Embed Size (px)
Citation preview
U.S. Department of the InteriorU.S. Geological Survey
Open-File Report 2018–1172
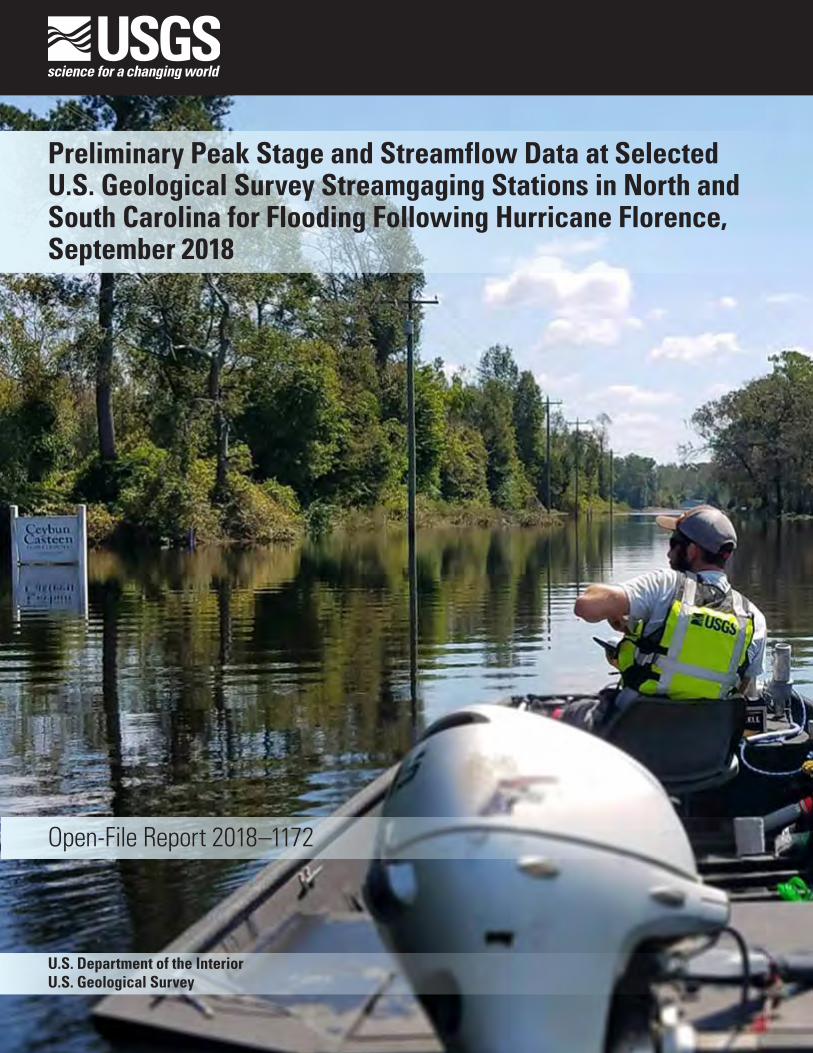
Preliminary Peak Stage and Streamflow Data at Selected U.S. Geological Survey Streamgaging Stations in North and South Carolina for Flooding Following Hurricane Florence, September 2018

Cover. Front cover photograph is a U.S. Geological Survey hydrographer navigating flood waters in Duplin County, North Carolina, in an effort to install a rapid-deployment gage to monitor rising flood waters (back cover photograph), September 20, 2018. Photographs by Daniel McCay, USGS.
Preliminary Peak Stage and Streamflow Data at Selected U.S. Geological Survey Streamgaging Stations in North and South Carolina for Flooding Following Hurricane Florence, September 2018
By Toby D. Feaster, J. Curtis Weaver, Anthony J. Gotvald, and Katharine R. Kolb
Open-File Report 2018–1172
U.S. Department of the InteriorU.S. Geological Survey
U.S. Department of the InteriorRYAN K. ZINKE, Secretary
U.S. Geological SurveyJames F. Reilly II, Director
U.S. Geological Survey, Reston, Virginia: 2018
For more information on the USGS—the Federal source for science about the Earth, its natural and living resources, natural hazards, and the environment—visit https://www.usgs.gov or call 1–888–ASK–USGS.
For an overview of USGS information products, including maps, imagery, and publications, visit https://store.usgs.gov.
Any use of trade, firm, or product names is for descriptive purposes only and does not imply endorsement by the U.S. Government.
Although this information product, for the most part, is in the public domain, it also may contain copyrighted materials as noted in the text. Permission to reproduce copyrighted items must be secured from the copyright owner.
Suggested citation:Feaster, T.D., Weaver, J.C., Gotvald, A.J., and Kolb, K.R., 2018, Preliminary peak stage and streamflow data at selected U.S. Geological Survey streamgaging stations in North and South Carolina for flooding following Hurricane Florence, September 2018: U.S. Geological Survey Open-File Report 2018–1172, 36 p., https://doi.org/10.3133/ofr20181172.
ISSN 2331-1258 (online)
iii
ContentsAbstract ..........................................................................................................................................................1Introduction.....................................................................................................................................................1
Purpose and Scope ..............................................................................................................................5Study Area..............................................................................................................................................5
General Weather Conditions and Precipitation Causing the September 2018 Flooding ....................5Methods...........................................................................................................................................................7
Flood Exceedance Probabilities of Peak Streamflows ...................................................................9Peak Streamflows and Stages ..................................................................................................................10Estimated Magnitudes and Flood Exceedance Probabilities of Peak Streamflows .........................11Comparison to Past Floods .........................................................................................................................16Summary........................................................................................................................................................23References Cited..........................................................................................................................................24
Figures
1. National Oceanic and Atmospheric Administration satellite image of Hurricane Florence as it made landfall on September 14, 2018 ............................................2
2. The track of Hurricane Florence through the Atlantic Ocean from August 30 through September 18, 2018 ............................................................................2
3. Accumulated precipitation during Hurricane Florence for September 13–18, 2018 .........3 4. U.S. Geological Survey Real-Time Data Network for the United States .............................4 5. Selected U.S. Geological Survey real-time streamgages and major
physiographic provinces in North and South Carolina ..........................................................6 6. U.S. Geological Survey personnel use an acoustic Doppler current profiler
to make a streamflow measurement of flood waters from the Cape Fear River in Kelly, North Carolina, on September 20, 2018 .....................................................................7
7. Rating curve developed for use before and after the September 2018 flood for Little River at Manchester in northern Cumberland County, N.C., showing streamflow measurements made during the event .....................................................................................8
8. U.S. Geological Survey rapid deployment gage at Trent River at U.S. Highway 70 at New Bern, N.C., September 20, 2018 ....................................................................................8
9. U.S. Geological Survey field crews conducting surveys of high-water marks to document the depth of flood waters near Northeast Creek in Piney Green in Onslow County, N.C., for the September 2018 flood ...........................................................9
10. Flood-frequency curve for the annual peak streamflows at U.S. Geological Survey streamgage 02109500, Waccamaw River at Freeland, N.C. ................................................10
11. Peak streamflows for the period of record and the peak streamflow from Hurricane Florence at U.S. Geological Survey streamgage 02135000, Little Pee Dee River at Galivants Ferry, S.C. ...........................................................................16
12. Peak streamflows for the period of record and the peak streamflow from Hurricane Florence at U.S. Geological Survey streamgage 02109500, Waccamaw River at Freeland, N.C. .........................................................................................17
13. Annual peak flows at U.S. Geological Survey streamgage 02169500, Congaree River at Columbia, S.C. ............................................................................................17
iv
14. Annual peak streamflows at U.S. Geological Survey streamgage 02197000, Savannah River at Augusta, Georgia ......................................................................................18
15. Daily mean streamflows at U.S. Geological Survey streamgage 02197000, Savannah River at Augusta, Georgia, for September 21, 1929, to October 8, 1929 ..........19
16. Annual peak streamflows at U.S. Geological Survey streamgage 03451500, French Broad River at Asheville, N.C. .....................................................................................20
Tables
1. Preliminary peak stage and streamflow data at streamgages in North and South Carolina with at least 10 years of record and where new or top 5 peak-streamflow records were set during the flood of September 2018 following Hurricane Florence .....................................................................................................................27
2. Selected recurrence intervals and the associated annual exceedance probabilities .....9 3. Site identification number, station number, and weighted estimated peak
streamflows for selected annual exceedance probabilities with 95-percent confidence intervals at selected U.S. Geological Survey streamgages in North Carolina and South Carolina ..........................................................................................12
4. Peak gage heights, peak streamflows, and estimated annual exceedance probabilities for the September 2018 Hurricane Florence related-flood event at selected U.S. Geological Survey streamgages in North and South Carolina ...................15
5. Chronology of major floods in North Carolina since 1876 and in South Carolina since 1893 .....................................................................................................................................20
Conversion Factors
U.S. customary units to International System of Units
Multiply By To obtain
Length
foot (ft) 0.3048 meter (m)mile (mi) 1.609 kilometer (km)
Area
square mile (mi2) 259.0 hectare (ha)square mile (mi2) 2.590 square kilometer (km2)
Flow rate
foot per second (ft/s) 0.3048 meter per second (m/s)cubic foot per second (ft3/s) 0.02832 cubic meter per second (m3/s)
DatumHorizontal coordinate information is referenced to either the North American Datum of 1927 (NAD27) or the North American Datum of 1983 (NAD83).
Preliminary Peak Stage and Streamflow Data at Selected U.S. Geological Survey Streamgaging Stations in North and South Carolina for Flooding Following Hurricane Florence, September 2018
By Toby D. Feaster, J. Curtis Weaver, Anthony J. Gotvald, and Katharine R. Kolb
Abstract Hurricane Florence made landfall as a Category 1
hurricane at Wrightsville Beach, North Carolina, shortly after dawn on September 14, 2018. Once over land, the forward motion of the hurricane slowed to about 2 to 3 miles per hour. Over the next several days, the hurricane delivered historic amounts of rainfall across North and South Carolina, causing substantial flooding in many communities across both States. For the Hurricane Florence event, a new record rainfall total of 35.93 inches was set in Elizabethtown, N.C. Many other locations throughout North Carolina set new records for rainfall, exceeding the previous State record for rainfall from a tropical system of 24.06 inches, which was set over a 4-day period in Southport, N.C., during Hurricane Floyd in 1999. In South Carolina, the highest reported total rainfall of 23.63 inches was in Loris, S.C., which was the highest total rainfall in South Carolina from a tropical cyclone, replacing the previous total of 17.45 inches associated with Tropical Storm Beryl in 1994. During the October 2015 flood in South Carolina, a 4-day total rainfall of 26.88 inches was recorded in Mount Pleasant; however, because that total rain-fall was a combination of a tropical storm system and another front that was centered over the State, it is not considered the largest rainfall event from a tropical storm.
Peak streamflow and stage data at 84 U.S. Geological Survey streamflow gaging stations (referred to hereafter as streamgages) in North and South Carolina with at least 10 years of systematic record and for which the flooding following Hurricane Florence resulted in a peak in the top 5 for the period of record are included in this report. New peak streamflows of record were recorded at 18 sites in North Caro-lina and 10 sites in South Carolina. Another 49 streamgages recorded peak streamflows in the top 5 for their record (45 in North Carolina and 4 in South Carolina). Peak streamflow data following Hurricane Florence were not available for three additional streamgages prior to the publication of this report. Of those three streamgages, two recorded a new peak stage of record and one recorded the second highest peak stage of
record. An additional four stage-only streamgages having at least 10 years of systematic record also had new peak stages (also referred to as gage height) of record. For 11 of the 28 streamgages for which the September 2018 peak streamflow was the peak of record, the October 2016 peak following Hurricane Matthew was the second largest peak, and for another four streamgages the September 1999 peak following Hurricane Floyd was the second largest peak.
For the 28 streamgages for which a new peak streamflow of record was recorded, a flood-frequency analysis was done using available systematic record through September 2017 and the peak streamflow from the Hurricane Florence event. Of the 28 streamgages analyzed, the estimated annual exceedance probability for the Hurricane Florence peak streamflow at 9 of the streamgages was less than 0.2 percent, which in terms of recurrence intervals is greater than a 500-year flood event. At three streamgages, the estimated annual exceedance probability was equal to 0.2 percent, and at six streamgages, it was between 0.2 and 1 percent (between a 500- and 100-year recurrence interval, respectively). For the remaining 10 streamgages, the estimated annual exceedance probability was between 1.5 and 7.1 percent, which in terms of recurrence intervals is approximately a 67- to 14-year event, respectively.
IntroductionEarly Friday morning on September 14, 2018, Hur-
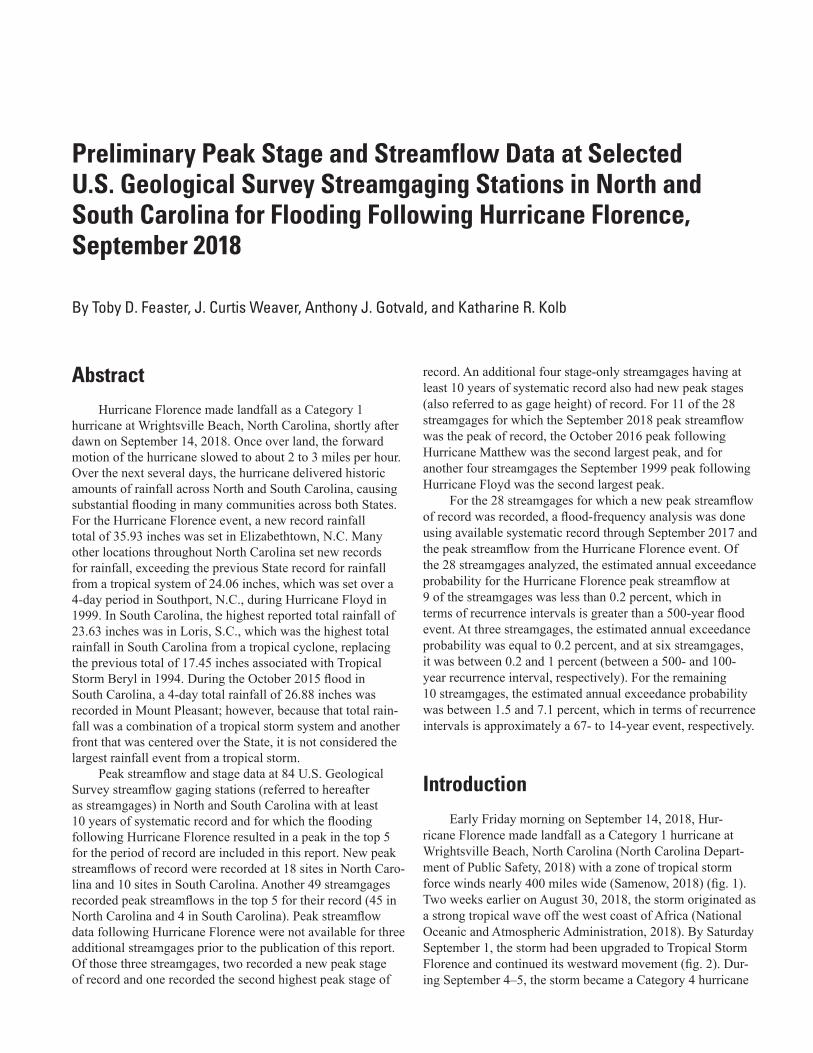
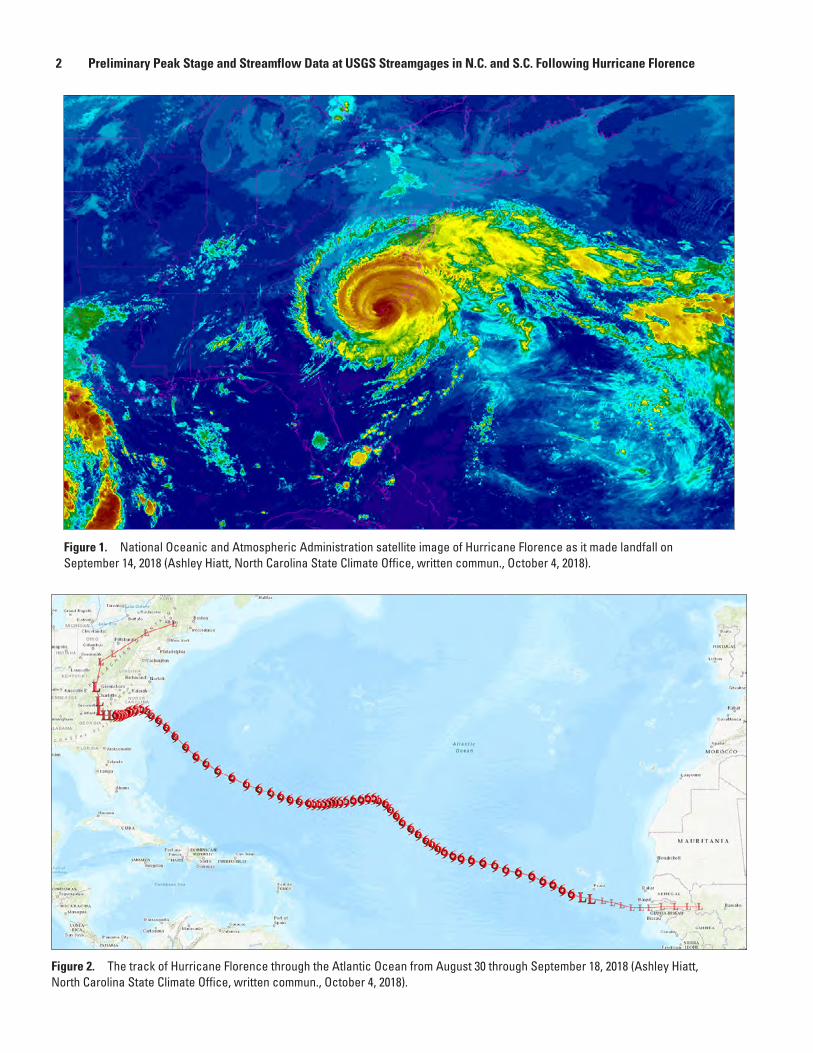
ricane Florence made landfall as a Category 1 hurricane at Wrightsville Beach, North Carolina (North Carolina Depart-ment of Public Safety, 2018) with a zone of tropical storm force winds nearly 400 miles wide (Samenow, 2018) (fig. 1). Two weeks earlier on August 30, 2018, the storm originated as a strong tropical wave off the west coast of Africa (National Oceanic and Atmospheric Administration, 2018). By Saturday September 1, the storm had been upgraded to Tropical Storm Florence and continued its westward movement (fig. 2). Dur-ing September 4–5, the storm became a Category 4 hurricane
2 Preliminary Peak Stage and Streamflow Data at USGS Streamgages in N.C. and S.C. Following Hurricane Florence
Figure 1. National Oceanic and Atmospheric Administration satellite image of Hurricane Florence as it made landfall on September 14, 2018 (Ashley Hiatt, North Carolina State Climate Office, written commun., October 4, 2018).
Figure 2. The track of Hurricane Florence through the Atlantic Ocean from August 30 through September 18, 2018 (Ashley Hiatt, North Carolina State Climate Office, written commun., October 4, 2018).
Introduction 3
with maximum sustained winds of 130 miles per hour. In the following days, Florence continued to move north-northwest and encountered areas of high wind shear that reduced and weakened the storm; following periods of strengthening, the hurricane made landfall as a Category 1 hurricane (State Climate Office of North Carolina, 2018a).
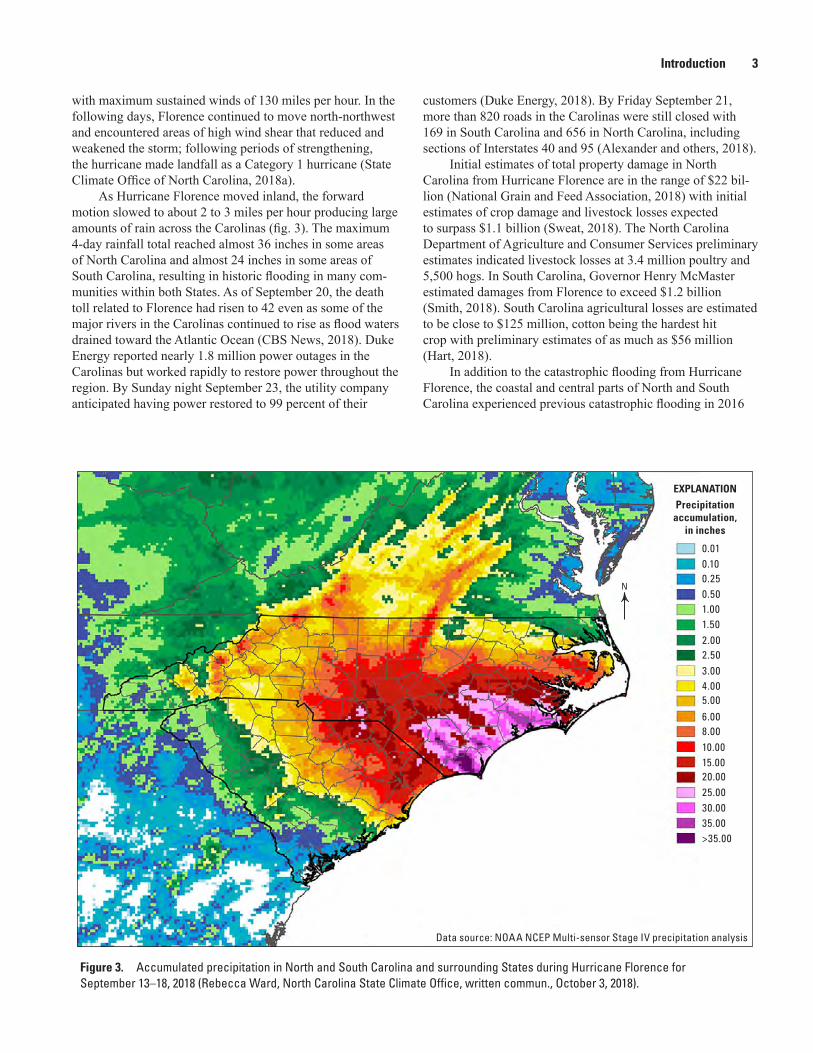
As Hurricane Florence moved inland, the forward motion slowed to about 2 to 3 miles per hour producing large amounts of rain across the Carolinas (fig. 3). The maximum 4-day rainfall total reached almost 36 inches in some areas of North Carolina and almost 24 inches in some areas of South Carolina, resulting in historic flooding in many com-munities within both States. As of September 20, the death toll related to Florence had risen to 42 even as some of the major rivers in the Carolinas continued to rise as flood waters drained toward the Atlantic Ocean (CBS News, 2018). Duke Energy reported nearly 1.8 million power outages in the Carolinas but worked rapidly to restore power throughout the region. By Sunday night September 23, the utility company anticipated having power restored to 99 percent of their
customers (Duke Energy, 2018). By Friday September 21, more than 820 roads in the Carolinas were still closed with 169 in South Carolina and 656 in North Carolina, including sections of Interstates 40 and 95 (Alexander and others, 2018).
Initial estimates of total property damage in North Carolina from Hurricane Florence are in the range of $22 bil-lion (National Grain and Feed Association, 2018) with initial estimates of crop damage and livestock losses expected to surpass $1.1 billion (Sweat, 2018). The North Carolina Department of Agriculture and Consumer Services preliminary estimates indicated livestock losses at 3.4 million poultry and 5,500 hogs. In South Carolina, Governor Henry McMaster estimated damages from Florence to exceed $1.2 billion (Smith, 2018). South Carolina agricultural losses are estimated to be close to $125 million, cotton being the hardest hit crop with preliminary estimates of as much as $56 million (Hart, 2018).
In addition to the catastrophic flooding from Hurricane Florence, the coastal and central parts of North and South Carolina experienced previous catastrophic flooding in 2016
30.0035.00>35.00
25.0020.0015.0010.008.006.00
5.004.003.00
2.00
1.001.50
2.50
0.500.250.100.01
Precipitationaccumulation,
in inches
EXPLANATION
Data source: NOAA NCEP Multi-sensor Stage IV precipitation analysis
N
Figure 3. Accumulated precipitation in North and South Carolina and surrounding States during Hurricane Florence for September 13–18, 2018 (Rebecca Ward, North Carolina State Climate Office, written commun., October 3, 2018).
4 Preliminary Peak Stage and Streamflow Data at USGS Streamgages in N.C. and S.C. Following Hurricane Florence
and 2015 from two other tropical events. In October 2016, Hurricane Matthew brought heavy rainfall to the eastern and central parts of the Carolinas (Weaver and others, 2016). Rainfall totals from 3 to more than 15 inches for the 3-day period October 7–9, 2016, were widespread. For that same period, one U.S. Geological Survey (USGS) raingage at the Cape Fear River at William O. Huske Lock near Tarheel in Bladen County, N.C., (USGS streamgage 02105500) recorded a total of about 16.9 inches of rain, and in South Carolina, 17.2 inches of rainfall was recorded near Dillon. For the Hurricane Matthew event, Weaver and others (2016) presented peak streamflow and (or) stage data for 139 streamgages (127 in North Carolina and 12 in South Carolina). Twenty-three of the 127 streamgages in North Carolina recorded stage only, thus leaving 104 streamgages in North Carolina for which both peak streamflow and stage were presented. Twenty-three of the 104 streamgages in North Carolina and 3 of the 12 streamgages in South Carolina had new peaks of record for streamflow associated with Hurricane Matthew. An additional 44 streamgages recorded new peaks that ranked in the top 5 for the period of record. Sixty-seven streamgages had record lengths of 30 or more years, and of those, 11 had new peaks of record, and 27 recorded peaks that ranked in the top 5 for the period of record. Historical flood records for USGS streamgage 02134500, Lumber River at Boardman, N.C., indicate that the October 2016 peak streamflow was the largest since 1901.
In October 2015, the presence of an upper atmospheric low-pressure system over the Southeast funneled tropical moisture from Hurricane Joaquin into South Carolina causing historic rainfall amounts (Feaster and others, 2015), which resulted in historic flooding in the central and coastal parts of the State. The USGS raingage at Black River at Kingstree, S.C. (USGS streamgage 02136000), recorded about 22.9 inches of rain for the period October 1–5, 2015. Over the same period, almost 27 inches of rain fell near Mount Pleasant in Charleston County, S.C. USGS streamgages recorded peaks of record at 17 locations, and 15 other streamgages had peaks ranking in the top 5 for the period of record. With respect to streamflow, USGS streamgage 02136000 recorded the largest peak streamflow in 87 years, which according to additional historic information was the largest peak since at least 1893, based on annual maximum peak stage records from the National Weather Service.
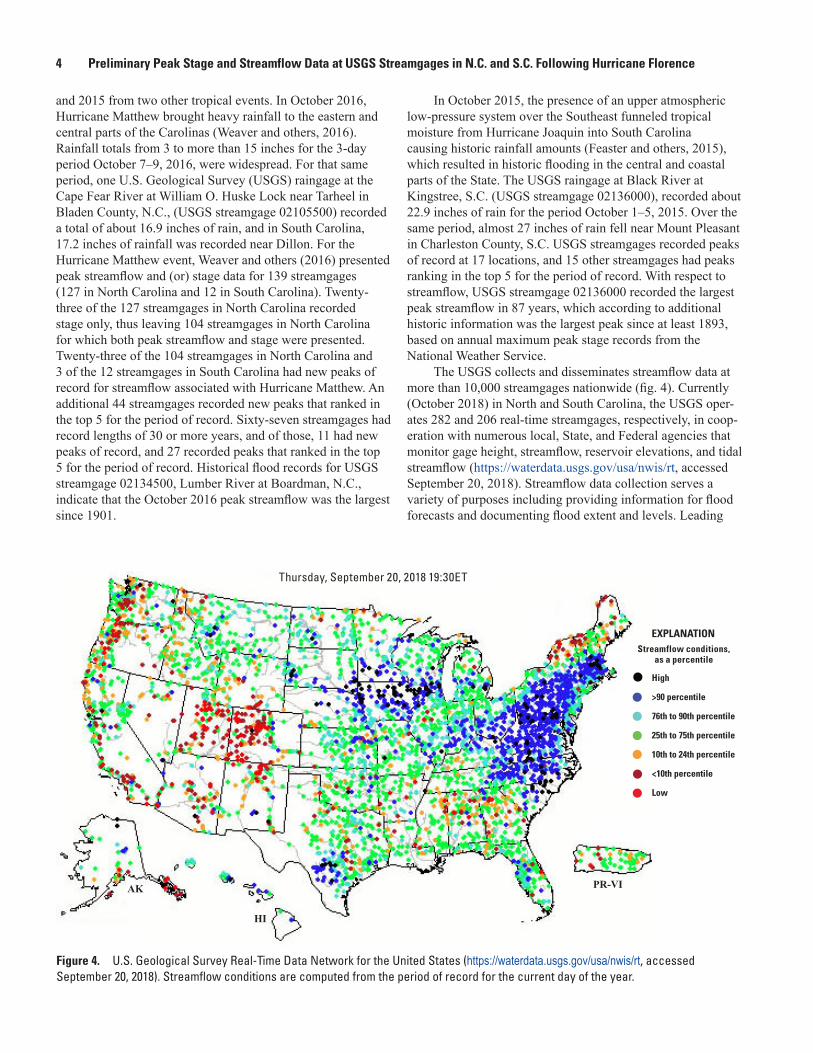
The USGS collects and disseminates streamflow data at more than 10,000 streamgages nationwide (fig. 4). Currently (October 2018) in North and South Carolina, the USGS oper-ates 282 and 206 real-time streamgages, respectively, in coop-eration with numerous local, State, and Federal agencies that monitor gage height, streamflow, reservoir elevations, and tidal streamflow (https://waterdata.usgs.gov/usa/nwis/rt, accessed September 20, 2018). Streamflow data collection serves a variety of purposes including providing information for flood forecasts and documenting flood extent and levels. Leading
Thursday, September 20, 2018 19:30ET
PR-VIAK
HI
Streamflow conditions,as a percentile
EXPLANATION
High
>90 percentile
76th to 90th percentile
25th to 75th percentile
10th to 24th percentile
<10th percentile
Low
Figure 4. U.S. Geological Survey Real-Time Data Network for the United States (https://waterdata.usgs.gov/usa/nwis/rt, accessed September 20, 2018). Streamflow conditions are computed from the period of record for the current day of the year.
General Weather Conditions and Precipitation Causing the September 2018 Flooding 5
up to and during flooding, streamflow data are vital for flood warning, forecasting, and emergency management. The long-term systematic streamflow data are used to assess risk and to mitigate flooding through floodplain management and in the design or repair of infrastructure (for example, road, bridges, reservoirs, and pipelines), houses, and buildings.
Purpose and Scope
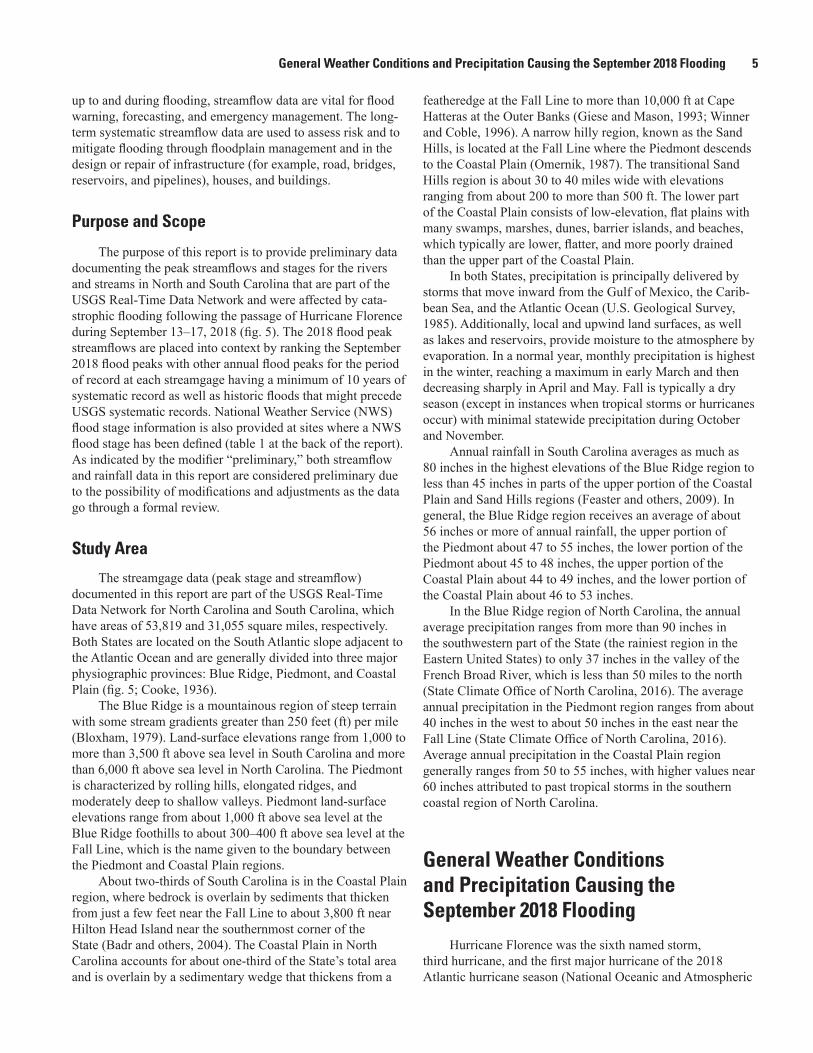
The purpose of this report is to provide preliminary data documenting the peak streamflows and stages for the rivers and streams in North and South Carolina that are part of the USGS Real-Time Data Network and were affected by cata-strophic flooding following the passage of Hurricane Florence during September 13–17, 2018 (fig. 5). The 2018 flood peak streamflows are placed into context by ranking the September 2018 flood peaks with other annual flood peaks for the period of record at each streamgage having a minimum of 10 years of systematic record as well as historic floods that might precede USGS systematic records. National Weather Service (NWS) flood stage information is also provided at sites where a NWS flood stage has been defined (table 1 at the back of the report). As indicated by the modifier “preliminary,” both streamflow and rainfall data in this report are considered preliminary due to the possibility of modifications and adjustments as the data go through a formal review.
Study Area
The streamgage data (peak stage and streamflow) documented in this report are part of the USGS Real-Time Data Network for North Carolina and South Carolina, which have areas of 53,819 and 31,055 square miles, respectively. Both States are located on the South Atlantic slope adjacent to the Atlantic Ocean and are generally divided into three major physiographic provinces: Blue Ridge, Piedmont, and Coastal Plain (fig. 5; Cooke, 1936).
The Blue Ridge is a mountainous region of steep terrain with some stream gradients greater than 250 feet (ft) per mile (Bloxham, 1979). Land-surface elevations range from 1,000 to more than 3,500 ft above sea level in South Carolina and more than 6,000 ft above sea level in North Carolina. The Piedmont is characterized by rolling hills, elongated ridges, and moderately deep to shallow valleys. Piedmont land-surface elevations range from about 1,000 ft above sea level at the Blue Ridge foothills to about 300–400 ft above sea level at the Fall Line, which is the name given to the boundary between the Piedmont and Coastal Plain regions.
About two-thirds of South Carolina is in the Coastal Plain region, where bedrock is overlain by sediments that thicken from just a few feet near the Fall Line to about 3,800 ft near Hilton Head Island near the southernmost corner of the State (Badr and others, 2004). The Coastal Plain in North Carolina accounts for about one-third of the State’s total area and is overlain by a sedimentary wedge that thickens from a
featheredge at the Fall Line to more than 10,000 ft at Cape Hatteras at the Outer Banks (Giese and Mason, 1993; Winner and Coble, 1996). A narrow hilly region, known as the Sand Hills, is located at the Fall Line where the Piedmont descends to the Coastal Plain (Omernik, 1987). The transitional Sand Hills region is about 30 to 40 miles wide with elevations ranging from about 200 to more than 500 ft. The lower part of the Coastal Plain consists of low-elevation, flat plains with many swamps, marshes, dunes, barrier islands, and beaches, which typically are lower, flatter, and more poorly drained than the upper part of the Coastal Plain.
In both States, precipitation is principally delivered by storms that move inward from the Gulf of Mexico, the Carib-bean Sea, and the Atlantic Ocean (U.S. Geological Survey, 1985). Additionally, local and upwind land surfaces, as well as lakes and reservoirs, provide moisture to the atmosphere by evaporation. In a normal year, monthly precipitation is highest in the winter, reaching a maximum in early March and then decreasing sharply in April and May. Fall is typically a dry season (except in instances when tropical storms or hurricanes occur) with minimal statewide precipitation during October and November.
Annual rainfall in South Carolina averages as much as 80 inches in the highest elevations of the Blue Ridge region to less than 45 inches in parts of the upper portion of the Coastal Plain and Sand Hills regions (Feaster and others, 2009). In general, the Blue Ridge region receives an average of about 56 inches or more of annual rainfall, the upper portion of the Piedmont about 47 to 55 inches, the lower portion of the Piedmont about 45 to 48 inches, the upper portion of the Coastal Plain about 44 to 49 inches, and the lower portion of the Coastal Plain about 46 to 53 inches.
In the Blue Ridge region of North Carolina, the annual average precipitation ranges from more than 90 inches in the southwestern part of the State (the rainiest region in the Eastern United States) to only 37 inches in the valley of the French Broad River, which is less than 50 miles to the north (State Climate Office of North Carolina, 2016). The average annual precipitation in the Piedmont region ranges from about 40 inches in the west to about 50 inches in the east near the Fall Line (State Climate Office of North Carolina, 2016). Average annual precipitation in the Coastal Plain region generally ranges from 50 to 55 inches, with higher values near 60 inches attributed to past tropical storms in the southern coastal region of North Carolina.
General Weather Conditions and Precipitation Causing the September 2018 Flooding
Hurricane Florence was the sixth named storm, third hurricane, and the first major hurricane of the 2018 Atlantic hurricane season (National Oceanic and Atmospheric
6
Preliminary Peak Stage and Stream
flow Data at USGS Stream
gages in N.C. and S.C. Follow
ing Hurricane Florence
Base from NHD Watershed Boundary Dataset, 1:100,000-scaleStreams and Lakes from the 1:2,000,000-scale National Hydrography DatasetState boundaries from the U.S. Census Tiger-Line filesEcoregions from the U.S. Environmental Protection Agency 1:7,500,000-scaledigital data (Omernik, 1987)
NORTH CAROLINA
SOUTH CAROLINA
!#
!#
!#
!#!#!#!#!#!#!#
!#
!#!#
!#
!#
!#
!#!#!#
!#
!#!#!#!#!#!#!#
!#
!#!#!#
!#!#
!# !#!#
!# !#
!#
!#
!#
!#!#
!#
!#!#
!#
!#
!#!#!#
!# !#
!#
!#
!#!#
!#
!#
!# !#!#
!#
!#
!#
!#
!#!#
!#
!#
!#
!#!#!#
!#!#!#!#!#
!#
!"!"
!"
!"
15
17
39
4445
1640
46
Roanoke River Basin
Yadkin-Pee DeeRiver Basin
0 25 50 75 100 KILOMETERS
0 10 20 30 40 50 60 70 80 MILES
ATLANTIC OCEAN
!#!#
!#
!#!#
!#!#
!#
!#
!#
!#
!#
!#!#!#
!#!#
!#
!#
!#
!#!#
!#
!#
!#
!#
80°81°82°83° 77°78°79°
36°
35°
34°
2726 25
2423
22
2120
28
5455
12
18
19
3234
3551
56
57
Greensboro Inset
Tar-PamlicoRiver Basin
Fall Line
Raleigh Inset
3
11
1213
14
293133
36
37
30
ChowanRiver Basin
Cape Fear River Basin
Neuse River Basin
White Oak/New River
Basins
41
42
43
47
59
6465
67
69
70
71 72
73
74
68
58
60
6162
66 63
48
4950
75
SAND HILLS
8382
8180
79
7877
76
53
52
84
Charlotte area streamgagesCatawba-Santee
River Basin
Tennessee River Basin
Greensboro area streamgages
Charlotte Inset
Raleigh areastreamgages
9
8
7
65
410
38
EXPLANATIONPhysiographic province
Streamgage with newpeak of record
Streamgage with peakin top 5 of record
Stage-only site with newpeak of record
!#
!#
!"
Blue Ridge
Piedmont
Coastal Plain
River basin boundary
Figure 5. Selected U.S. Geological Survey real-time streamgages and major physiographic provinces in North and South Carolina.
Methods 7
Administration, 2018). Beginning as a strong tropical wave off the west coast of Africa on August 30, 2018, Florence became a tropical depression near Cape Verde on August 31 and began a west-northwest trek strengthening to a tropical storm by September 1 (fig. 2). Florence quickly gained strength and was a Category 4 hurricane by September 5, with maximum sustained winds of 130 miles per hour. After weakening to a tropical storm on September 7, a few days later the storm regained hurricane strength on September 9. Following a stint of rapid intensification on September 10, Florence again reached major hurricane status becoming a Category 3 and 4 hurricane on the same day with Category 4 winds of 140 miles per hour noted by the end of the day. Although Hurricane Florence’s wind field continued to grow, increasing wind shear gradually weakened the storm, which lead to the hurricane making landfall during the morning of September 14 at Wrightsville Beach, N.C., as a Category 1 hurricane (North Carolina Department of Public Safety, 2018).
As Florence moved inland, the forward motion slowed to about 2 to 3 miles per hour, producing large amounts of rain across the Carolinas (fig. 3) with the maximum 4-day total of about 36 inches in some areas of North Carolina and nearly 24 inches in some areas of South Carolina, resulting in historic flooding in many communities in both States. For the Hurricane Florence event, the NWS reported the highest total rainfall of 35.93 inches in Elizabethtown, N.C., and 27 additional locations with totals from 21.04 to 34.00 inches (National Weather Service, 2018b). Many of these locations set new State records for rainfall, exceeding the previous State record for rainfall from a tropical system of 24.06 inches that was set over a 4-day period in Southport, N.C., during Hur-ricane Floyd in 1999 (State Climate Office of North Carolina, 2018a). In South Carolina, the highest reported total rainfall of 23.63 inches was in Loris, S.C., and was the highest total rainfall in South Carolina from a tropical cyclone, replacing the previous total of 17.45 inches associated with Tropical Storm Beryl in 1994 (South Carolina State Climatology Office, 2018). An additional 17 locations in South Carolina reported rainfall totals between 10.10 and 22.58 inches. During the Hurricane Joaquin event in October 2015, a 4-day today rainfall of 26.88 inches was recorded in Mount Pleasant, South Carolina. However, because that total rainfall was a combination of the tropical storm and another front, it is not considered the largest rainfall event from a tropical storm (Melissa Griffin, South Carolina Department of Natural Resources, written commun., October 10, 2018).
MethodsIn this report, streamflow data refer to both stage or gage
height (in feet) and volumetric streamflow (in cubic feet per second). These data were collected systematically at USGS continuous record streamgages or from field measurements of stage in cases where the gage structure or equipment was damaged by flood waters. The peak-streamflow data used in the analyses in this report were obtained from the USGS National Water Information System (https://waterdata.usgs.gov/nwis/sw, accessed October 2, 2018).
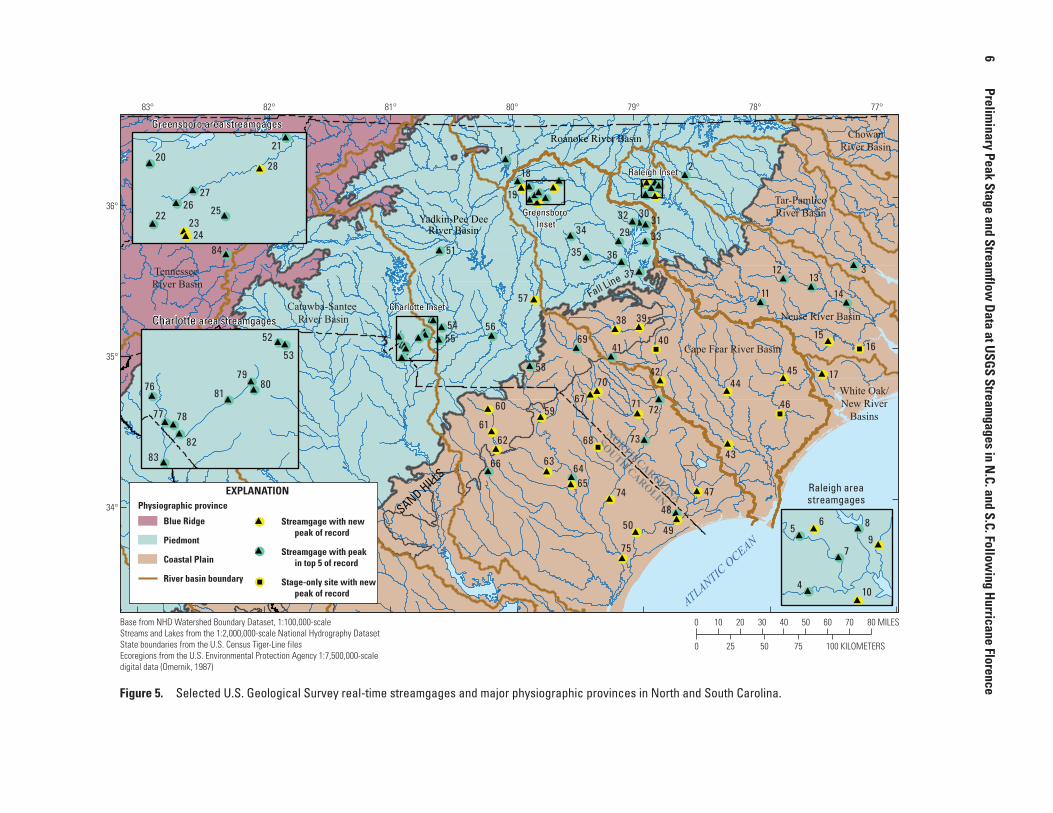
U.S. Geological Survey streamgages operate autono-mously by collecting data at regular time intervals (typically either 5 or 15 minutes) dependent on watershed size and how rapidly the water rises in the stream. Typical streamgage records include observations of stage. The stage data are collected using a variety of methods, including float, submers-ible pressure transducer, nonsubmersible pressure transducer, or noncontact radar. More information on how USGS streamgages operate is available in Lurry (2011). Although stage data are important, streamflow is often more important for such purposes as streamflow forecasting and flood warn-ing, water-quality loading computations, flood-frequency analysis, and flood mitigation planning. Computation of streamflow at a streamgage requires periodic measurements of streamflow over a range of stage. The relation defined between stage and measured streamflow, or rating curve, is used to convert the stage data to streamflow. USGS personnel collect physical observations of stream velocity and stream depth onsite to determine near-instantaneous streamflow (fig. 6; Turnipseed and Sauer, 2010).
In most cases the relation is a simple stage-streamflow relation or rating curve. After constructing the rating curve, continued periodic measurements of streamflow are required at various stages to verify or support changes to a streamgage rating curve. During the September 2018 flood,
Figure 6. U.S. Geological Survey personnel use an acoustic Doppler current profiler to make a streamflow measurement of flood waters from the Cape Fear River in Kelly, North Carolina, on September 20, 2018.
8 Preliminary Peak Stage and Streamflow Data at USGS Streamgages in N.C. and S.C. Following Hurricane Florence
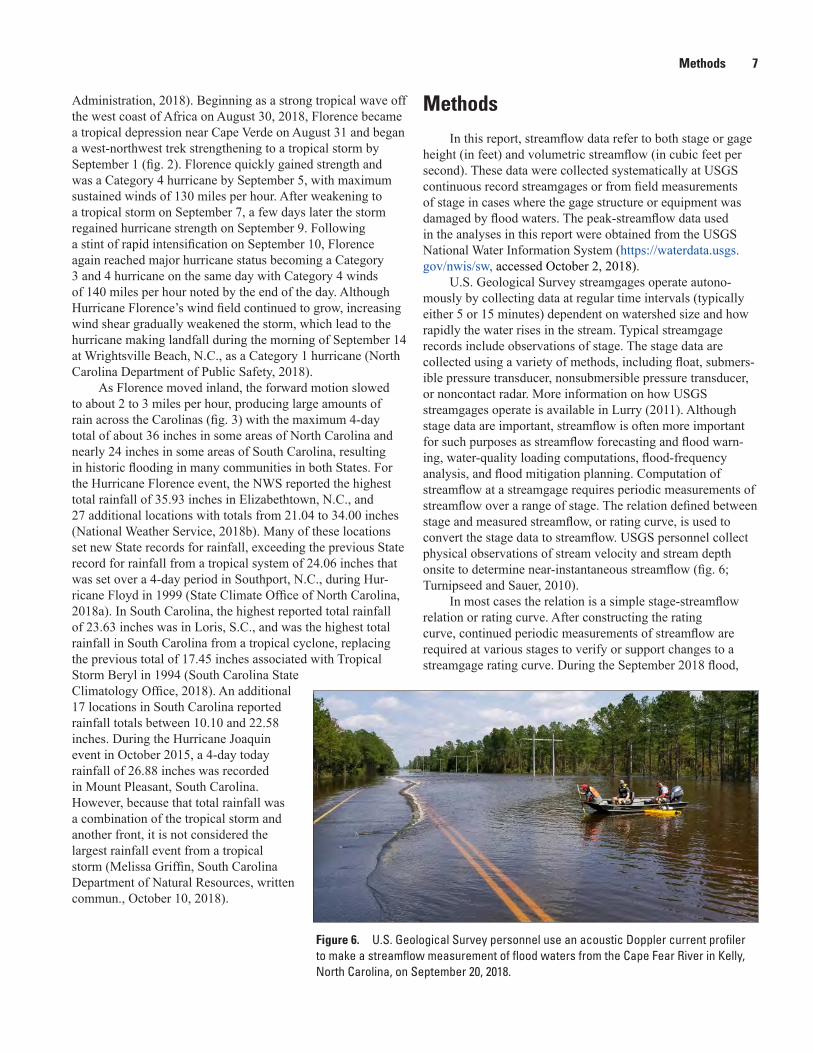
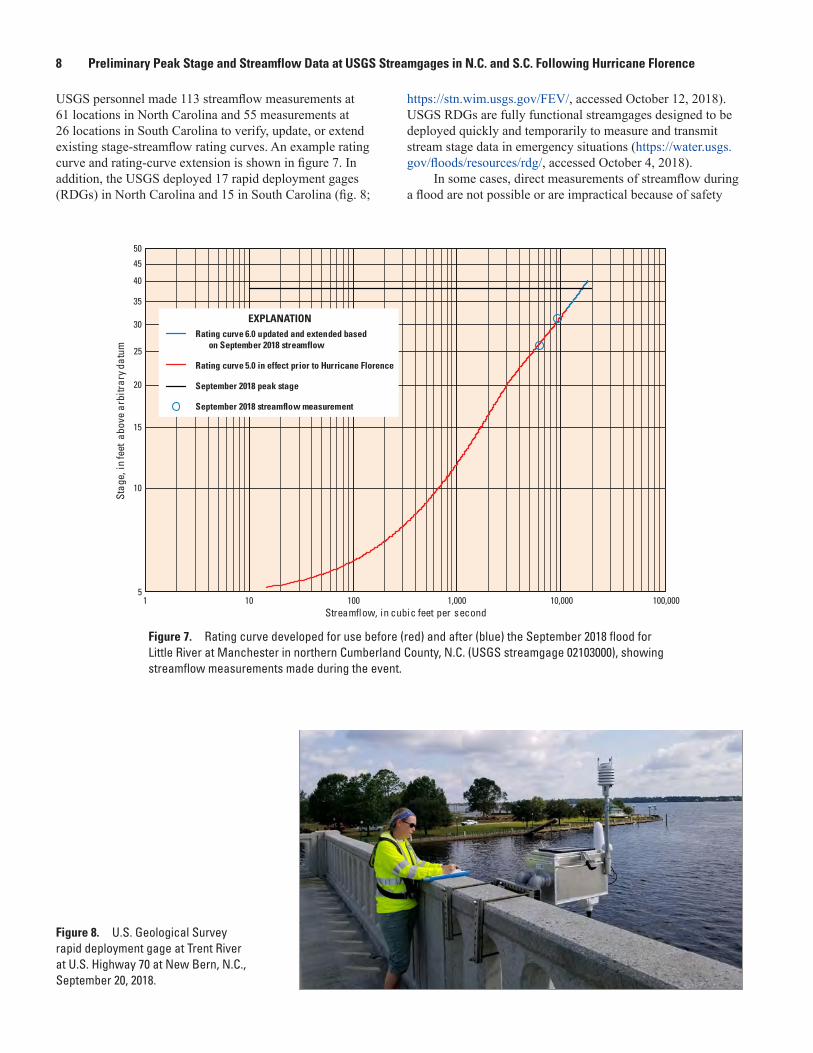
USGS personnel made 113 streamflow measurements at 61 locations in North Carolina and 55 measurements at 26 locations in South Carolina to verify, update, or extend existing stage-streamflow rating curves. An example rating curve and rating-curve extension is shown in figure 7. In addition, the USGS deployed 17 rapid deployment gages (RDGs) in North Carolina and 15 in South Carolina (fig. 8;
https://stn.wim.usgs.gov/FEV/, accessed October 12, 2018). USGS RDGs are fully functional streamgages designed to be deployed quickly and temporarily to measure and transmit stream stage data in emergency situations (https://water.usgs.gov/floods/resources/rdg/, accessed October 4, 2018).
In some cases, direct measurements of streamflow during a flood are not possible or are impractical because of safety
25
5
30
35
40
45
10
20
15
50
1 10 100 1,000 10,000 100,000Streamflow, in cubic feet per second
Stag
e, in
feet
abo
ve a
rbitr
ary d
atum
Rating curve 6.0 updated and extended basedon September 2018 streamflow
Rating curve 5.0 in effect prior to Hurricane Florence
September 2018 peak stage
September 2018 streamflow measurement
EXPLANATION
Figure 7. Rating curve developed for use before (red) and after (blue) the September 2018 flood for Little River at Manchester in northern Cumberland County, N.C. (USGS streamgage 02103000), showing streamflow measurements made during the event.
Figure 8. U.S. Geological Survey rapid deployment gage at Trent River at U.S. Highway 70 at New Bern, N.C., September 20, 2018.
Methods 9
concerns or inaccessibility to the measurement site. In those instances, indirect measurement methods can be used (Benson and Dalrymple, 1967), whereby water-surface profiles deter-mined by high-water marks, channel roughness, and geometry are used in hydraulic equations based on the principles of conservation of energy, conservation of momentum, and continuity to compute the peak streamflow for that flood. The high-water marks and channel geometry are determined by field survey. Roughness typically is subjectively determined on the basis of bed material, cross-section irregularities, depth of streamflow, vegetation, and channel alignment. The USGS assigns uncertainty/accuracy estimates to each indirect measurement on the basis of the hydraulic and geometry conditions found at each field site (Benson and Dalrymple, 1967; Dalrymple and Benson, 1967; Hulsing, 1967; Matthai,
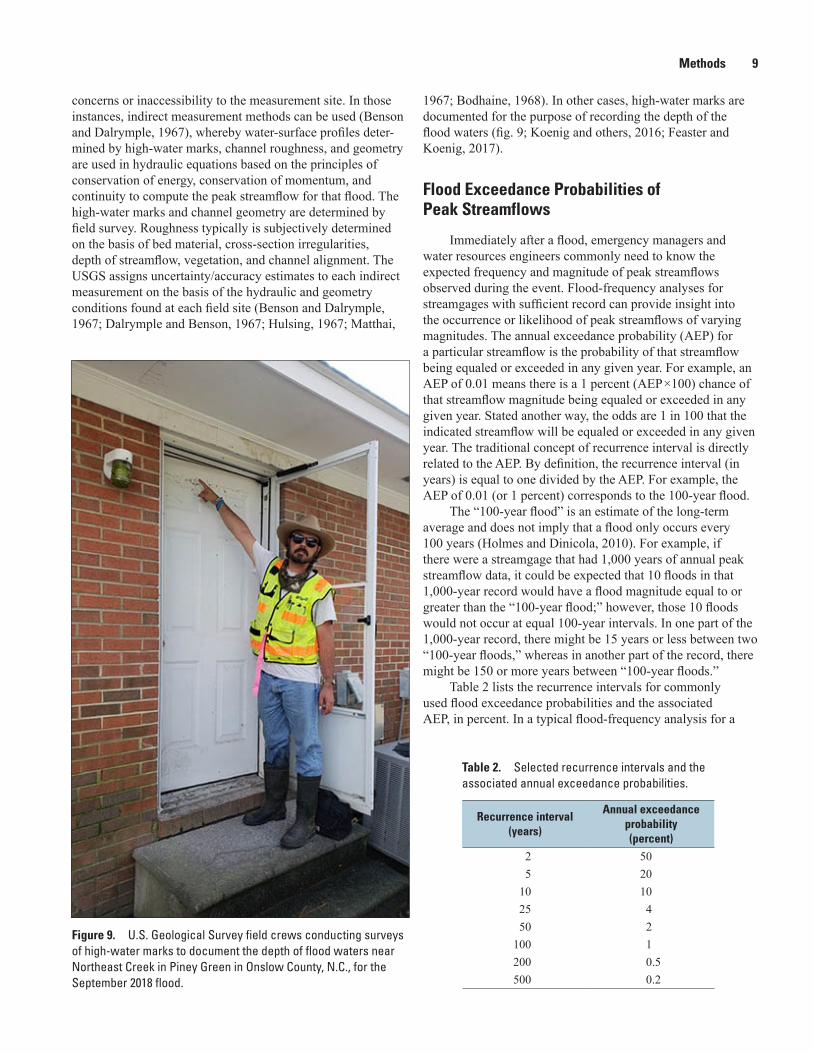
1967; Bodhaine, 1968). In other cases, high-water marks are documented for the purpose of recording the depth of the flood waters (fig. 9; Koenig and others, 2016; Feaster and Koenig, 2017).
Flood Exceedance Probabilities of Peak Streamflows
Immediately after a flood, emergency managers and water resources engineers commonly need to know the expected frequency and magnitude of peak streamflows observed during the event. Flood-frequency analyses for streamgages with sufficient record can provide insight into the occurrence or likelihood of peak streamflows of varying magnitudes. The annual exceedance probability (AEP) for a particular streamflow is the probability of that streamflow being equaled or exceeded in any given year. For example, an AEP of 0.01 means there is a 1 percent (AEP ×100) chance of that streamflow magnitude being equaled or exceeded in any given year. Stated another way, the odds are 1 in 100 that the indicated streamflow will be equaled or exceeded in any given year. The traditional concept of recurrence interval is directly related to the AEP. By definition, the recurrence interval (in years) is equal to one divided by the AEP. For example, the AEP of 0.01 (or 1 percent) corresponds to the 100-year flood.
The “100-year flood” is an estimate of the long-term average and does not imply that a flood only occurs every 100 years (Holmes and Dinicola, 2010). For example, if there were a streamgage that had 1,000 years of annual peak streamflow data, it could be expected that 10 floods in that 1,000-year record would have a flood magnitude equal to or greater than the “100-year flood;” however, those 10 floods would not occur at equal 100-year intervals. In one part of the 1,000-year record, there might be 15 years or less between two “100-year floods,” whereas in another part of the record, there might be 150 or more years between “100-year floods.”
Table 2 lists the recurrence intervals for commonly used flood exceedance probabilities and the associated AEP, in percent. In a typical flood-frequency analysis for a
Figure 9. U.S. Geological Survey field crews conducting surveys of high-water marks to document the depth of flood waters near Northeast Creek in Piney Green in Onslow County, N.C., for the September 2018 flood.
Table 2. Selected recurrence intervals and the associated annual exceedance probabilities.
Recurrence interval (years)
Annual exceedance probability (percent)
2 505 20
10 1025 450 2
100 1200 0.5500 0.2
10 Preliminary Peak Stage and Streamflow Data at USGS Streamgages in N.C. and S.C. Following Hurricane Florence
USGS streamgage, results are only reported up to an AEP of 0.2 percent (or 1 in 500 chance, also referred to as a 500-year recurrence interval) because the record lengths of most USGS peak-streamflow files are less than 100 years (Feaster and oth-ers, 2009). Consequently, extrapolating beyond a 0.2-percent AEP streamflow is not warranted due to the large uncertainty.
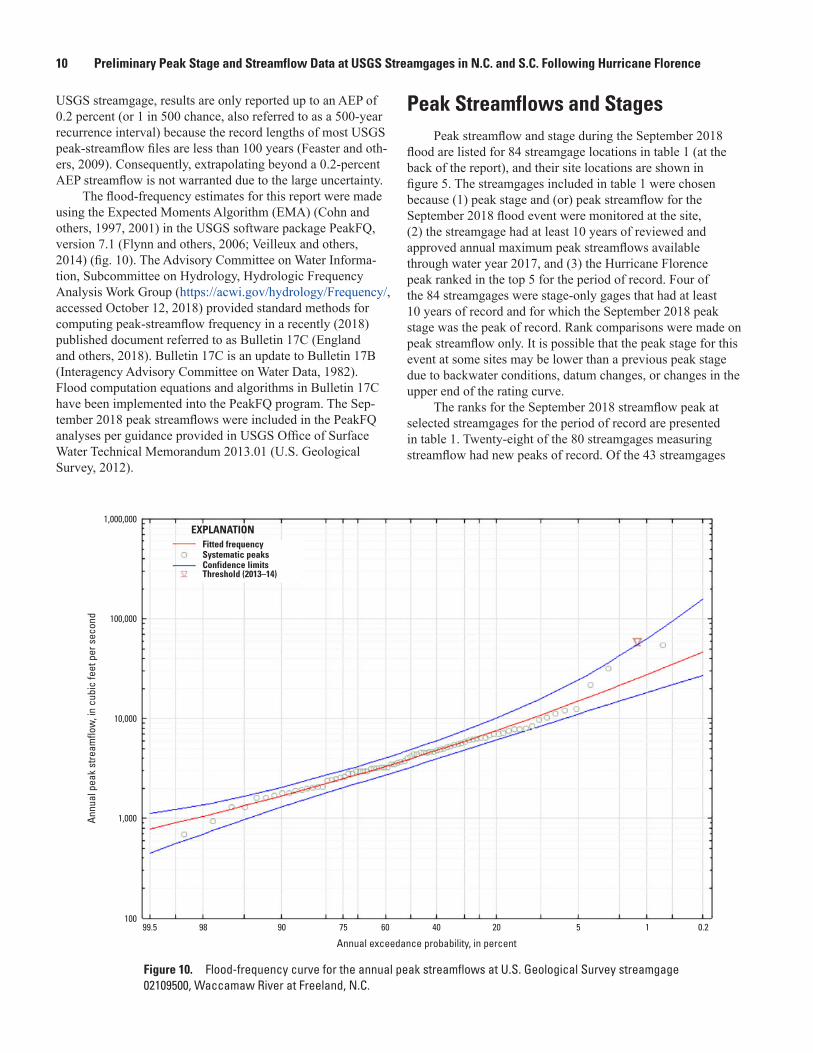
The flood-frequency estimates for this report were made using the Expected Moments Algorithm (EMA) (Cohn and others, 1997, 2001) in the USGS software package PeakFQ, version 7.1 (Flynn and others, 2006; Veilleux and others, 2014) (fig. 10). The Advisory Committee on Water Informa-tion, Subcommittee on Hydrology, Hydrologic Frequency Analysis Work Group (https://acwi.gov/hydrology/Frequency/, accessed October 12, 2018) provided standard methods for computing peak-streamflow frequency in a recently (2018) published document referred to as Bulletin 17C (England and others, 2018). Bulletin 17C is an update to Bulletin 17B (Interagency Advisory Committee on Water Data, 1982). Flood computation equations and algorithms in Bulletin 17C have been implemented into the PeakFQ program. The Sep-tember 2018 peak streamflows were included in the PeakFQ analyses per guidance provided in USGS Office of Surface Water Technical Memorandum 2013.01 (U.S. Geological Survey, 2012).
Peak Streamflows and StagesPeak streamflow and stage during the September 2018
flood are listed for 84 streamgage locations in table 1 (at the back of the report), and their site locations are shown in figure 5. The streamgages included in table 1 were chosen because (1) peak stage and (or) peak streamflow for the September 2018 flood event were monitored at the site, (2) the streamgage had at least 10 years of reviewed and approved annual maximum peak streamflows available through water year 2017, and (3) the Hurricane Florence peak ranked in the top 5 for the period of record. Four of the 84 streamgages were stage-only gages that had at least 10 years of record and for which the September 2018 peak stage was the peak of record. Rank comparisons were made on peak streamflow only. It is possible that the peak stage for this event at some sites may be lower than a previous peak stage due to backwater conditions, datum changes, or changes in the upper end of the rating curve.
The ranks for the September 2018 streamflow peak at selected streamgages for the period of record are presented in table 1. Twenty-eight of the 80 streamgages measuring streamflow had new peaks of record. Of the 43 streamgages
1,000,000
100,000
10,000
1,000
10099.5 98 90 75 60 40 20 5 1 0.2
Annu
al p
eak
stre
amflo
w, i
n cu
bic
feet
per
sec
ond
Annual exceedance probability, in percent
Fitted frequencySystematic peaksConfidence limitsThreshold (2013–14)
EXPLANATION
Figure 10. Flood-frequency curve for the annual peak streamflows at U.S. Geological Survey streamgage 02109500, Waccamaw River at Freeland, N.C.
Estimated Magnitudes and Flood Exceedance Probabilities of Peak Streamflows 11
with long-term records1 of 30 or more years, 14 had new peaks of record: 02108000, Northeast Cape Fear River near Chin-quapin, N.C. (78 years) (fig. 10); 02109500, Waccamaw River at Freeland, N.C. (77 years); 02135000, Little Pee Dee River at Galivants Ferry, S.C. (77 years); 02105500, Cape Fear River at William O Huske Lock near Tarheel, N.C. (71 years); 02106500, Black River near Tomahawk, N.C. (70 years); 02110500, Waccamaw River near Longs, S.C. (68 years); 02092500, Trent River near Trenton, N.C. (67 years); 02128000, Little River near Star, N.C. (64 years); 02130900, Black Creek near McBee, S.C. (59 years); 02130910, Black Creek near Hartsville, S.C. (58 years); 02102908, Flat Creek near Inverness, N.C. (50 years); 02105769, Cape Fear at Lock #1 near Kelly, N.C. (49 years); 02132320, Big Shoe Heel Creek near Laurinburg, N.C. (31 years); and 02133624, Lumber River near Maxton, N.C. (30 years).
In addition to the 28 streamgages that had new peaks of record for streamflow, 49 streamgages recorded new peak streamflows that ranked in the top 5 for the period of record. For streamgages with at least 30 years of record, 20 recorded peak streamflows ranking in the top 5 for the period of record. For 11 of the 28 streamgages for which the September 2018 peak streamflow was the peak of record, the October 2016 peak following Hurricane Matthew was the second largest peak of record, and for another five the September 1999 peak following Hurricane Floyd was the second largest peak of record (table 1; Weaver and others, 2016). For streamgage 02130980, Black Creek near Quinby, S.C., the second largest peak of record was recorded in October 2015 following Hurricane Joaquin (Feaster and others, 2015).
Peak streamflow data following Hurricane Florence were not available for three streamgages prior to the publication of this report. Of those three streamgages, two recorded a new peak stage of record (streamgages 02086624, Knap of Reeds Creek near Butner, N.C., and 02093000, New River near Gum Branch, N.C.) and one recorded the second highest peak stage of record (02101800, Tick Creek near Mount Vernon Springs, N.C.).
Estimated Magnitudes and Flood Exceedance Probabilities of Peak Streamflows
Updated at-site flood-frequency streamflows for selected AEPs (50, 20, 10, 4, 2, 1, 0.5, and 0.2 percent) were computed for USGS streamgages that had at least 10 years of approved annual maximum peak streamflows through the 2017
1The USGS uses a 30-year criterion to identify those streamgages having long-term periods of streamflow record (U.S. Geological Survey, 2014a).
water year2 and for which the peak streamflow associated with Hurricane Florence exceeded the peak of record of the approved peak streamflows (table 3). For unregulated streamgages, the expected peak streamflows for selected AEPs and their 95-percent confidence intervals were computed by weighting the updated flood-frequency analysis at each streamgage, including the September 2018 peak streamflow from Hurricane Florence, with the regional regression estimate for the same location using equations from Feaster and others (2009) and Weaver and others (2009). For urban streamgages, the at-site flood-frequency streamflows were weighted with the regression equation estimates from Feaster and others (2014). The weighting was computed using the variance of the two estimates as outlined in Bulletin 17C (England and others, 2018). Such weighting can reduce the uncertainty in the peak-streamflow statistics with the weights being based on the variance of the EMA estimate and the variance of the regional regression equations (England and others, 2018). The weighted streamflow estimates were then used to determine the AEP associated with the September 2018 peak streamflow. No weighted values were computed for the at-site flood- frequency streamflows estimated for regulated streamgages.
In addition to weighting the updated at-site streamflows for selected AEPs with the appropriate regional regression equations, weighted upper and lower 95-percent confidence interval streamflows for the selected AEPs also were computed using methods described in USGS Office of Surface Water Informational and Technical Note 2014.43 (table 3; U.S. Geo-logical Survey, 2014b). The regional regression equations, regression equation estimates at USGS streamgages, and variances are documented in Feaster and others (2009, 2014) and Weaver and others (2009).
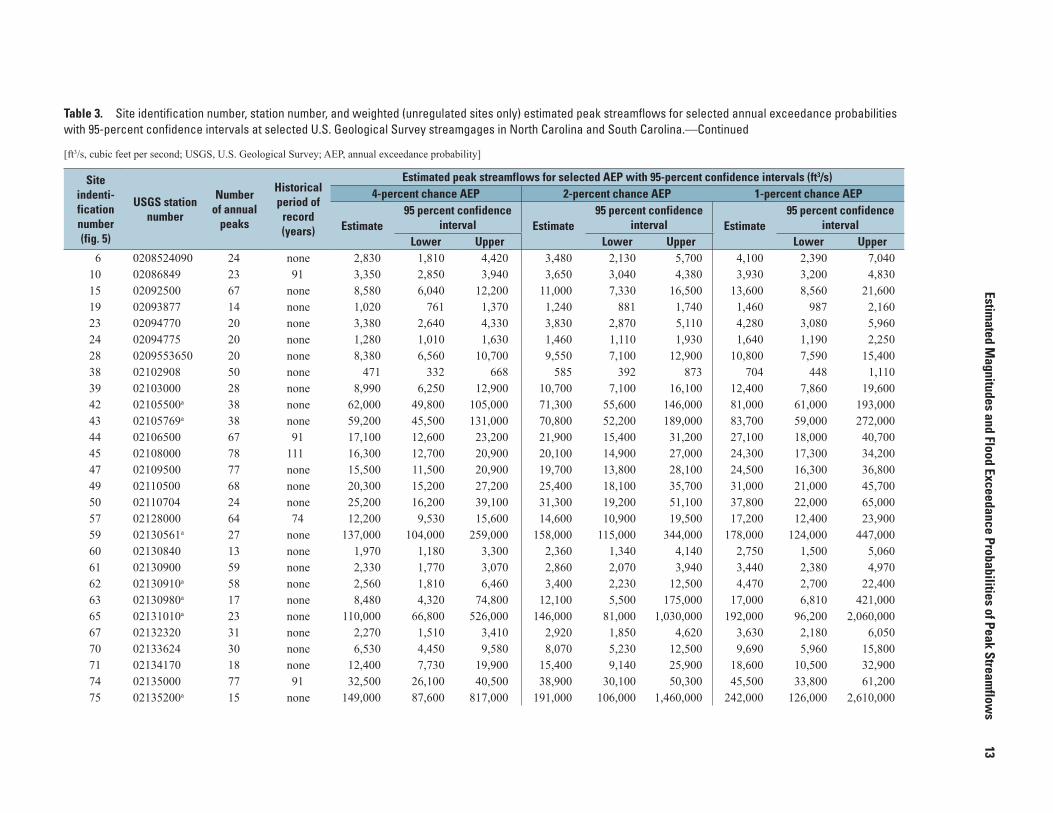
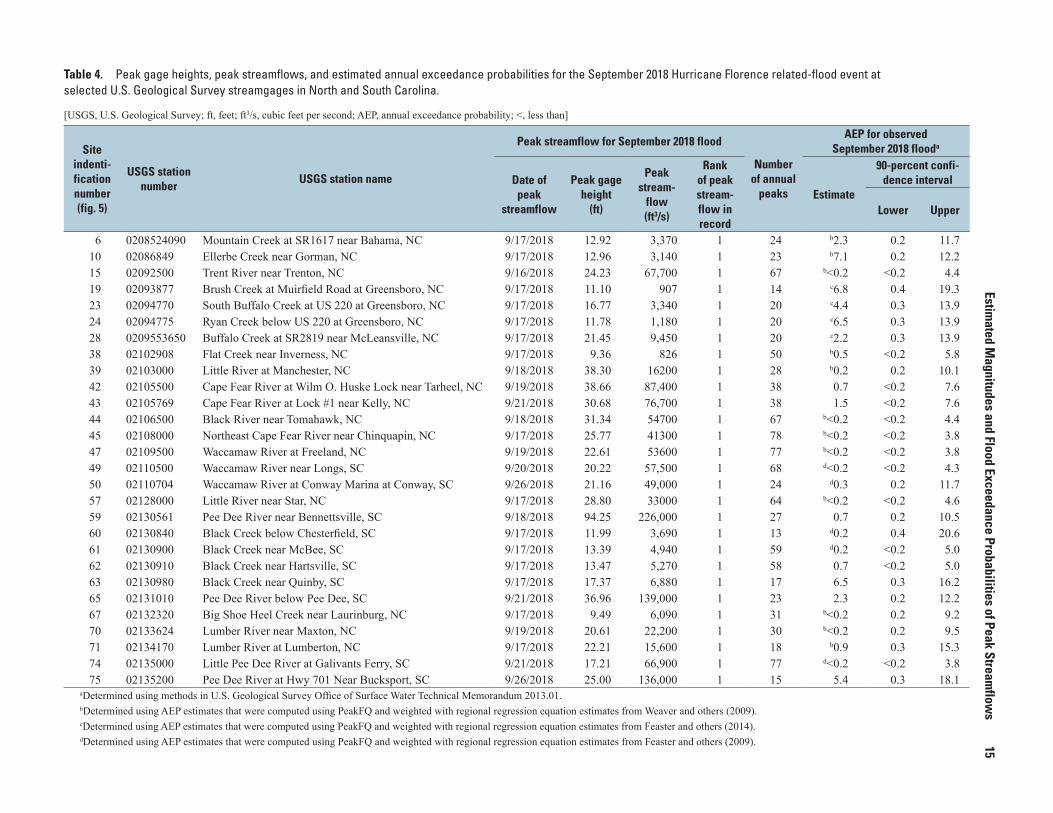
Table 4 lists the peak gage-height data, peak streamflow data, and the corresponding AEP (in percent) determined for the September 2018 flood for the 28 USGS streamgages that measured record annual peak streamflow in North and South Carolina and had at least 10 years of approved annual maximum peak streamflows through the 2017 water year. The data listed in tables 3 and 4 are currently (October 2018) considered provisional until final verification of the peak-streamflow data. The estimated AEP for the September 2018 flood for each streamgage was determined using log-linear interpolation of the weighted streamflow estimates included in table 3, following equation 1 in USGS Office of Surface Water Technical Memorandum 2013.01 (U.S. Geological Survey, 2012) based on the weighted flood-frequency estimates (table 3). The uncertainty in the estimated AEP can increase when a specific AEP is assigned to an observed flood event such as the September 2018 flood. Techniques recommended by U.S. Geological Survey (2012) also were used to estimate a 90-percent confidence interval that is likely to include the true AEP.
2The water year is the annual period from October 1 through September 30 and is designated by the year in which the period ends.
12
Preliminary Peak Stage and Stream
flow Data at USGS Stream
gages in N.C. and S.C. Follow
ing Hurricane Florence
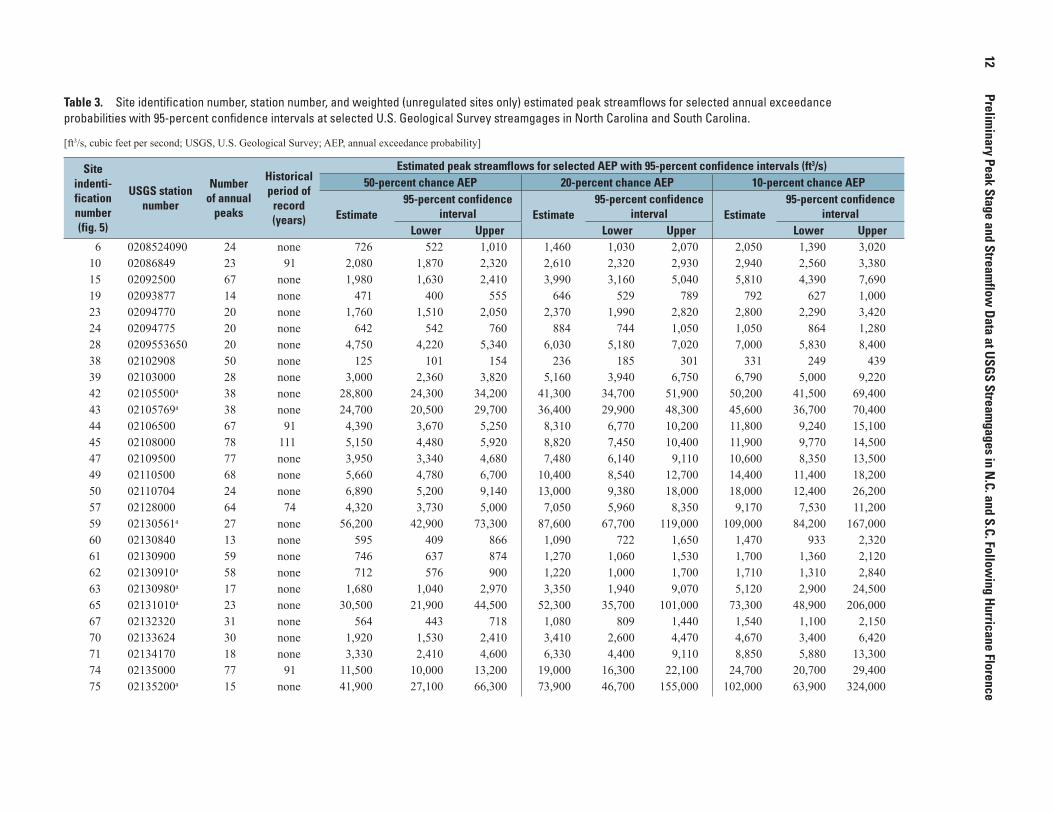
Table 3. Site identification number, station number, and weighted (unregulated sites only) estimated peak streamflows for selected annual exceedance probabilities with 95-percent confidence intervals at selected U.S. Geological Survey streamgages in North Carolina and South Carolina.
[ft3/s, cubic feet per second; USGS, U.S. Geological Survey; AEP, annual exceedance probability]
Site indenti-fication number (fig. 5)
USGS station number
Number of annual
peaks
Historical period of
record (years)
Estimated peak streamflows for selected AEP with 95-percent confidence intervals (ft3/s)50-percent chance AEP 20-percent chance AEP 10-percent chance AEP
Estimate95-percent confidence
interval Estimate95-percent confidence
interval Estimate95-percent confidence
intervalLower Upper Lower Upper Lower Upper
6 0208524090 24 none 726 522 1,010 1,460 1,030 2,070 2,050 1,390 3,02010 02086849 23 91 2,080 1,870 2,320 2,610 2,320 2,930 2,940 2,560 3,38015 02092500 67 none 1,980 1,630 2,410 3,990 3,160 5,040 5,810 4,390 7,69019 02093877 14 none 471 400 555 646 529 789 792 627 1,00023 02094770 20 none 1,760 1,510 2,050 2,370 1,990 2,820 2,800 2,290 3,42024 02094775 20 none 642 542 760 884 744 1,050 1,050 864 1,28028 0209553650 20 none 4,750 4,220 5,340 6,030 5,180 7,020 7,000 5,830 8,40038 02102908 50 none 125 101 154 236 185 301 331 249 43939 02103000 28 none 3,000 2,360 3,820 5,160 3,940 6,750 6,790 5,000 9,22042 02105500a 38 none 28,800 24,300 34,200 41,300 34,700 51,900 50,200 41,500 69,40043 02105769a 38 none 24,700 20,500 29,700 36,400 29,900 48,300 45,600 36,700 70,40044 02106500 67 91 4,390 3,670 5,250 8,310 6,770 10,200 11,800 9,240 15,10045 02108000 78 111 5,150 4,480 5,920 8,820 7,450 10,400 11,900 9,770 14,50047 02109500 77 none 3,950 3,340 4,680 7,480 6,140 9,110 10,600 8,350 13,50049 02110500 68 none 5,660 4,780 6,700 10,400 8,540 12,700 14,400 11,400 18,20050 02110704 24 none 6,890 5,200 9,140 13,000 9,380 18,000 18,000 12,400 26,20057 02128000 64 74 4,320 3,730 5,000 7,050 5,960 8,350 9,170 7,530 11,20059 02130561a 27 none 56,200 42,900 73,300 87,600 67,700 119,000 109,000 84,200 167,00060 02130840 13 none 595 409 866 1,090 722 1,650 1,470 933 2,32061 02130900 59 none 746 637 874 1,270 1,060 1,530 1,700 1,360 2,12062 02130910a 58 none 712 576 900 1,220 1,000 1,700 1,710 1,310 2,84063 02130980a 17 none 1,680 1,040 2,970 3,350 1,940 9,070 5,120 2,900 24,50065 02131010a 23 none 30,500 21,900 44,500 52,300 35,700 101,000 73,300 48,900 206,00067 02132320 31 none 564 443 718 1,080 809 1,440 1,540 1,100 2,15070 02133624 30 none 1,920 1,530 2,410 3,410 2,600 4,470 4,670 3,400 6,42071 02134170 18 none 3,330 2,410 4,600 6,330 4,400 9,110 8,850 5,880 13,30074 02135000 77 91 11,500 10,000 13,200 19,000 16,300 22,100 24,700 20,700 29,40075 02135200a 15 none 41,900 27,100 66,300 73,900 46,700 155,000 102,000 63,900 324,000
Estimated M
agnitudes and Flood Exceedance Probabilities of Peak Streamflow
s
13
Table 3. Site identification number, station number, and weighted (unregulated sites only) estimated peak streamflows for selected annual exceedance probabilities with 95-percent confidence intervals at selected U.S. Geological Survey streamgages in North Carolina and South Carolina.—Continued
[ft3/s, cubic feet per second; USGS, U.S. Geological Survey; AEP, annual exceedance probability]
Site indenti-fication number (fig. 5)
USGS station number
Number of annual
peaks
Historical period of
record (years)
Estimated peak streamflows for selected AEP with 95-percent confidence intervals (ft3/s)4-percent chance AEP 2-percent chance AEP 1-percent chance AEP
Estimate95 percent confidence
interval Estimate95 percent confidence
interval Estimate95 percent confidence
intervalLower Upper Lower Upper Lower Upper
6 0208524090 24 none 2,830 1,810 4,420 3,480 2,130 5,700 4,100 2,390 7,04010 02086849 23 91 3,350 2,850 3,940 3,650 3,040 4,380 3,930 3,200 4,83015 02092500 67 none 8,580 6,040 12,200 11,000 7,330 16,500 13,600 8,560 21,60019 02093877 14 none 1,020 761 1,370 1,240 881 1,740 1,460 987 2,16023 02094770 20 none 3,380 2,640 4,330 3,830 2,870 5,110 4,280 3,080 5,96024 02094775 20 none 1,280 1,010 1,630 1,460 1,110 1,930 1,640 1,190 2,25028 0209553650 20 none 8,380 6,560 10,700 9,550 7,100 12,900 10,800 7,590 15,40038 02102908 50 none 471 332 668 585 392 873 704 448 1,11039 02103000 28 none 8,990 6,250 12,900 10,700 7,100 16,100 12,400 7,860 19,60042 02105500a 38 none 62,000 49,800 105,000 71,300 55,600 146,000 81,000 61,000 193,00043 02105769a 38 none 59,200 45,500 131,000 70,800 52,200 189,000 83,700 59,000 272,00044 02106500 67 91 17,100 12,600 23,200 21,900 15,400 31,200 27,100 18,000 40,70045 02108000 78 111 16,300 12,700 20,900 20,100 14,900 27,000 24,300 17,300 34,20047 02109500 77 none 15,500 11,500 20,900 19,700 13,800 28,100 24,500 16,300 36,80049 02110500 68 none 20,300 15,200 27,200 25,400 18,100 35,700 31,000 21,000 45,70050 02110704 24 none 25,200 16,200 39,100 31,300 19,200 51,100 37,800 22,000 65,00057 02128000 64 74 12,200 9,530 15,600 14,600 10,900 19,500 17,200 12,400 23,90059 02130561a 27 none 137,000 104,000 259,000 158,000 115,000 344,000 178,000 124,000 447,00060 02130840 13 none 1,970 1,180 3,300 2,360 1,340 4,140 2,750 1,500 5,06061 02130900 59 none 2,330 1,770 3,070 2,860 2,070 3,940 3,440 2,380 4,97062 02130910a 58 none 2,560 1,810 6,460 3,400 2,230 12,500 4,470 2,700 22,40063 02130980a 17 none 8,480 4,320 74,800 12,100 5,500 175,000 17,000 6,810 421,00065 02131010a 23 none 110,000 66,800 526,000 146,000 81,000 1,030,000 192,000 96,200 2,060,00067 02132320 31 none 2,270 1,510 3,410 2,920 1,850 4,620 3,630 2,180 6,05070 02133624 30 none 6,530 4,450 9,580 8,070 5,230 12,500 9,690 5,960 15,80071 02134170 18 none 12,400 7,730 19,900 15,400 9,140 25,900 18,600 10,500 32,90074 02135000 77 91 32,500 26,100 40,500 38,900 30,100 50,300 45,500 33,800 61,20075 02135200a 15 none 149,000 87,600 817,000 191,000 106,000 1,460,000 242,000 126,000 2,610,000
14
Preliminary Peak Stage and Stream
flow Data at USGS Stream
gages in N.C. and S.C. Follow
ing Hurricane Florence
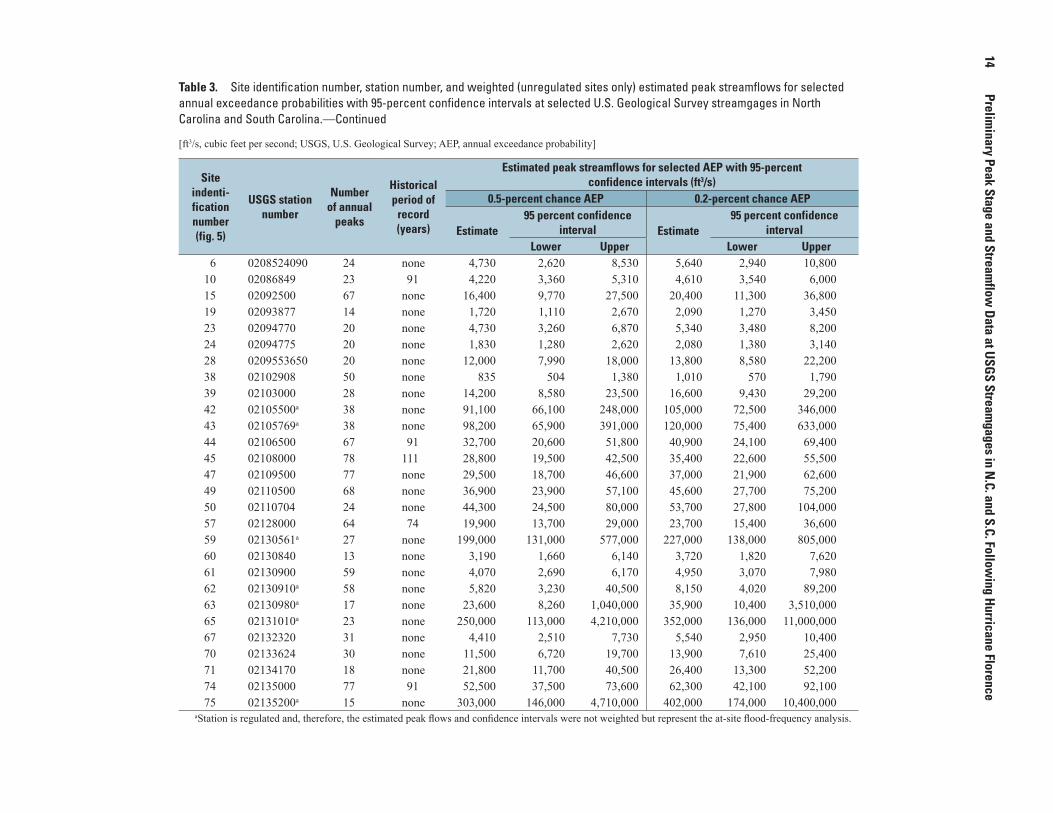
Table 3. Site identification number, station number, and weighted (unregulated sites only) estimated peak streamflows for selected annual exceedance probabilities with 95-percent confidence intervals at selected U.S. Geological Survey streamgages in North Carolina and South Carolina.—Continued
[ft3/s, cubic feet per second; USGS, U.S. Geological Survey; AEP, annual exceedance probability]
Site indenti-fication number (fig. 5)
USGS station number
Number of annual
peaks
Historical period of
record (years)
Estimated peak streamflows for selected AEP with 95-percent confidence intervals (ft3/s)
0.5-percent chance AEP 0.2-percent chance AEP
Estimate95 percent confidence
interval Estimate95 percent confidence
intervalLower Upper Lower Upper
6 0208524090 24 none 4,730 2,620 8,530 5,640 2,940 10,80010 02086849 23 91 4,220 3,360 5,310 4,610 3,540 6,00015 02092500 67 none 16,400 9,770 27,500 20,400 11,300 36,80019 02093877 14 none 1,720 1,110 2,670 2,090 1,270 3,45023 02094770 20 none 4,730 3,260 6,870 5,340 3,480 8,20024 02094775 20 none 1,830 1,280 2,620 2,080 1,380 3,14028 0209553650 20 none 12,000 7,990 18,000 13,800 8,580 22,20038 02102908 50 none 835 504 1,380 1,010 570 1,79039 02103000 28 none 14,200 8,580 23,500 16,600 9,430 29,20042 02105500a 38 none 91,100 66,100 248,000 105,000 72,500 346,00043 02105769a 38 none 98,200 65,900 391,000 120,000 75,400 633,00044 02106500 67 91 32,700 20,600 51,800 40,900 24,100 69,40045 02108000 78 111 28,800 19,500 42,500 35,400 22,600 55,50047 02109500 77 none 29,500 18,700 46,600 37,000 21,900 62,60049 02110500 68 none 36,900 23,900 57,100 45,600 27,700 75,20050 02110704 24 none 44,300 24,500 80,000 53,700 27,800 104,00057 02128000 64 74 19,900 13,700 29,000 23,700 15,400 36,60059 02130561a 27 none 199,000 131,000 577,000 227,000 138,000 805,00060 02130840 13 none 3,190 1,660 6,140 3,720 1,820 7,62061 02130900 59 none 4,070 2,690 6,170 4,950 3,070 7,98062 02130910a 58 none 5,820 3,230 40,500 8,150 4,020 89,20063 02130980a 17 none 23,600 8,260 1,040,000 35,900 10,400 3,510,00065 02131010a 23 none 250,000 113,000 4,210,000 352,000 136,000 11,000,00067 02132320 31 none 4,410 2,510 7,730 5,540 2,950 10,40070 02133624 30 none 11,500 6,720 19,700 13,900 7,610 25,40071 02134170 18 none 21,800 11,700 40,500 26,400 13,300 52,20074 02135000 77 91 52,500 37,500 73,600 62,300 42,100 92,10075 02135200a 15 none 303,000 146,000 4,710,000 402,000 174,000 10,400,000
aStation is regulated and, therefore, the estimated peak flows and confidence intervals were not weighted but represent the at-site flood-frequency analysis.
Estimated M
agnitudes and Flood Exceedance Probabilities of Peak Streamflow
s
15Table 4. Peak gage heights, peak streamflows, and estimated annual exceedance probabilities for the September 2018 Hurricane Florence related-flood event at selected U.S. Geological Survey streamgages in North and South Carolina.
[USGS, U.S. Geological Survey; ft, feet; ft3/s, cubic feet per second; AEP, annual exceedance probability; <, less than]
Site indenti-fication number (fig. 5)
USGS station number
USGS station name
Peak streamflow for September 2018 flood
Number of annual
peaks
AEP for observed September 2018 flooda
Date of peak
streamflow
Peak gage height
(ft)
Peak stream-
flow (ft3/s)
Rank of peak stream-flow in record
Estimate
90-percent confi-dence interval
Lower Upper
6 0208524090 Mountain Creek at SR1617 near Bahama, NC 9/17/2018 12.92 3,370 1 24 b2.3 0.2 11.710 02086849 Ellerbe Creek near Gorman, NC 9/17/2018 12.96 3,140 1 23 b7.1 0.2 12.215 02092500 Trent River near Trenton, NC 9/16/2018 24.23 67,700 1 67 b<0.2 <0.2 4.419 02093877 Brush Creek at Muirfield Road at Greensboro, NC 9/17/2018 11.10 907 1 14 c6.8 0.4 19.323 02094770 South Buffalo Creek at US 220 at Greensboro, NC 9/17/2018 16.77 3,340 1 20 c4.4 0.3 13.924 02094775 Ryan Creek below US 220 at Greensboro, NC 9/17/2018 11.78 1,180 1 20 c6.5 0.3 13.928 0209553650 Buffalo Creek at SR2819 near McLeansville, NC 9/17/2018 21.45 9,450 1 20 c2.2 0.3 13.938 02102908 Flat Creek near Inverness, NC 9/17/2018 9.36 826 1 50 b0.5 <0.2 5.839 02103000 Little River at Manchester, NC 9/18/2018 38.30 16200 1 28 b0.2 0.2 10.142 02105500 Cape Fear River at Wilm O. Huske Lock near Tarheel, NC 9/19/2018 38.66 87,400 1 38 0.7 <0.2 7.643 02105769 Cape Fear River at Lock #1 near Kelly, NC 9/21/2018 30.68 76,700 1 38 1.5 <0.2 7.644 02106500 Black River near Tomahawk, NC 9/18/2018 31.34 54700 1 67 b<0.2 <0.2 4.445 02108000 Northeast Cape Fear River near Chinquapin, NC 9/17/2018 25.77 41300 1 78 b<0.2 <0.2 3.847 02109500 Waccamaw River at Freeland, NC 9/19/2018 22.61 53600 1 77 b<0.2 <0.2 3.849 02110500 Waccamaw River near Longs, SC 9/20/2018 20.22 57,500 1 68 d<0.2 <0.2 4.350 02110704 Waccamaw River at Conway Marina at Conway, SC 9/26/2018 21.16 49,000 1 24 d0.3 0.2 11.757 02128000 Little River near Star, NC 9/17/2018 28.80 33000 1 64 b<0.2 <0.2 4.659 02130561 Pee Dee River near Bennettsville, SC 9/18/2018 94.25 226,000 1 27 0.7 0.2 10.560 02130840 Black Creek below Chesterfield, SC 9/17/2018 11.99 3,690 1 13 d0.2 0.4 20.661 02130900 Black Creek near McBee, SC 9/17/2018 13.39 4,940 1 59 d0.2 <0.2 5.062 02130910 Black Creek near Hartsville, SC 9/17/2018 13.47 5,270 1 58 0.7 <0.2 5.063 02130980 Black Creek near Quinby, SC 9/17/2018 17.37 6,880 1 17 6.5 0.3 16.265 02131010 Pee Dee River below Pee Dee, SC 9/21/2018 36.96 139,000 1 23 2.3 0.2 12.267 02132320 Big Shoe Heel Creek near Laurinburg, NC 9/17/2018 9.49 6,090 1 31 b<0.2 0.2 9.270 02133624 Lumber River near Maxton, NC 9/19/2018 20.61 22,200 1 30 b<0.2 0.2 9.571 02134170 Lumber River at Lumberton, NC 9/17/2018 22.21 15,600 1 18 b0.9 0.3 15.374 02135000 Little Pee Dee River at Galivants Ferry, SC 9/21/2018 17.21 66,900 1 77 d<0.2 <0.2 3.875 02135200 Pee Dee River at Hwy 701 Near Bucksport, SC 9/26/2018 25.00 136,000 1 15 5.4 0.3 18.1
aDetermined using methods in U.S. Geological Survey Office of Surface Water Technical Memorandum 2013.01.bDetermined using AEP estimates that were computed using PeakFQ and weighted with regional regression equation estimates from Weaver and others (2009).cDetermined using AEP estimates that were computed using PeakFQ and weighted with regional regression equation estimates from Feaster and others (2014).dDetermined using AEP estimates that were computed using PeakFQ and weighted with regional regression equation estimates from Feaster and others (2009).
16 Preliminary Peak Stage and Streamflow Data at USGS Streamgages in N.C. and S.C. Following Hurricane Florence
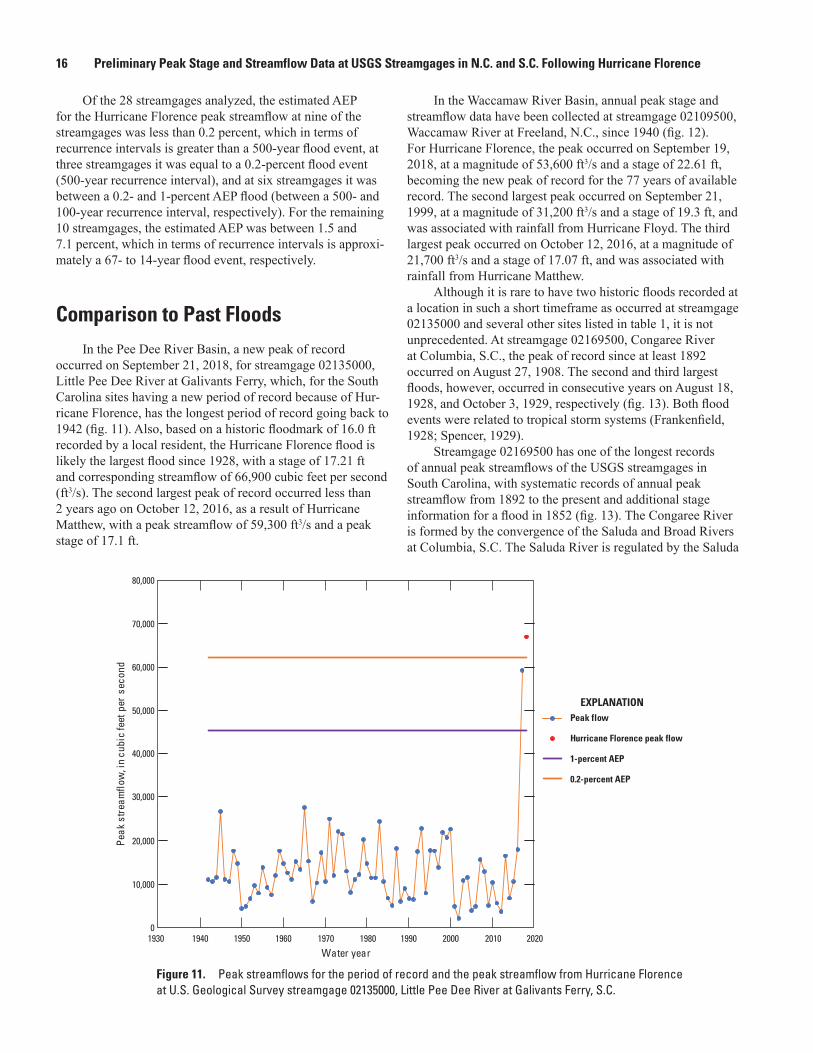
Of the 28 streamgages analyzed, the estimated AEP for the Hurricane Florence peak streamflow at nine of the streamgages was less than 0.2 percent, which in terms of recurrence intervals is greater than a 500-year flood event, at three streamgages it was equal to a 0.2-percent flood event (500-year recurrence interval), and at six streamgages it was between a 0.2- and 1-percent AEP flood (between a 500- and 100-year recurrence interval, respectively). For the remaining 10 streamgages, the estimated AEP was between 1.5 and 7.1 percent, which in terms of recurrence intervals is approxi-mately a 67- to 14-year flood event, respectively.
Comparison to Past FloodsIn the Pee Dee River Basin, a new peak of record
occurred on September 21, 2018, for streamgage 02135000, Little Pee Dee River at Galivants Ferry, which, for the South Carolina sites having a new period of record because of Hur-ricane Florence, has the longest period of record going back to 1942 (fig. 11). Also, based on a historic floodmark of 16.0 ft recorded by a local resident, the Hurricane Florence flood is likely the largest flood since 1928, with a stage of 17.21 ft and corresponding streamflow of 66,900 cubic feet per second (ft3/s). The second largest peak of record occurred less than 2 years ago on October 12, 2016, as a result of Hurricane Matthew, with a peak streamflow of 59,300 ft3/s and a peak stage of 17.1 ft.
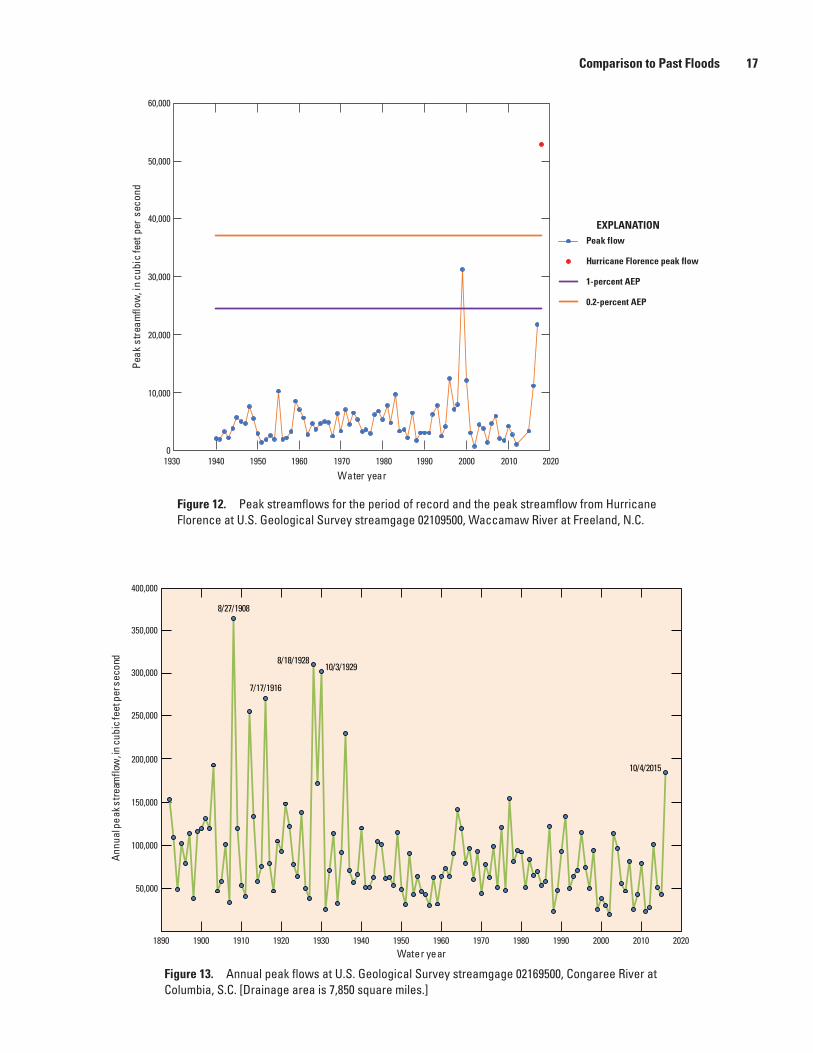
In the Waccamaw River Basin, annual peak stage and streamflow data have been collected at streamgage 02109500, Waccamaw River at Freeland, N.C., since 1940 (fig. 12). For Hurricane Florence, the peak occurred on September 19, 2018, at a magnitude of 53,600 ft3/s and a stage of 22.61 ft, becoming the new peak of record for the 77 years of available record. The second largest peak occurred on September 21, 1999, at a magnitude of 31,200 ft3/s and a stage of 19.3 ft, and was associated with rainfall from Hurricane Floyd. The third largest peak occurred on October 12, 2016, at a magnitude of 21,700 ft3/s and a stage of 17.07 ft, and was associated with rainfall from Hurricane Matthew.
Although it is rare to have two historic floods recorded at a location in such a short timeframe as occurred at streamgage 02135000 and several other sites listed in table 1, it is not unprecedented. At streamgage 02169500, Congaree River at Columbia, S.C., the peak of record since at least 1892 occurred on August 27, 1908. The second and third largest floods, however, occurred in consecutive years on August 18, 1928, and October 3, 1929, respectively (fig. 13). Both flood events were related to tropical storm systems (Frankenfield, 1928; Spencer, 1929).
Streamgage 02169500 has one of the longest records of annual peak streamflows of the USGS streamgages in South Carolina, with systematic records of annual peak streamflow from 1892 to the present and additional stage information for a flood in 1852 (fig. 13). The Congaree River is formed by the convergence of the Saluda and Broad Rivers at Columbia, S.C. The Saluda River is regulated by the Saluda
10,000
0
20,000
30,000
40,000
50,000
60,000
70,000
80,000
1930 1940 1950 1960 1970 1980 1990 2000 2010 2020
Peak
stre
amflo
w, i
n cu
bic
feet
per
sec
ond
Water year
Peak flow
Hurricane Florence peak flow
1-percent AEP
0.2-percent AEP
EXPLANATION
Figure 11. Peak streamflows for the period of record and the peak streamflow from Hurricane Florence at U.S. Geological Survey streamgage 02135000, Little Pee Dee River at Galivants Ferry, S.C.
Comparison to Past Floods 17
10,000
0
20,000
30,000
40,000
50,000
60,000
1930 1940 1950 1960 1970 1980 1990 2000 2010 2020
Peak
stre
amflo
w, i
n cu
bic
feet
per
sec
ond
Water year
Peak flow
Hurricane Florence peak flow
1-percent AEP
0.2-percent AEP
EXPLANATION
Figure 12. Peak streamflows for the period of record and the peak streamflow from Hurricane Florence at U.S. Geological Survey streamgage 02109500, Waccamaw River at Freeland, N.C.
50,000
100,000
150,000
200,000
250,000
300,000
350,000
400,000
1890 1900 1910 1920 1930 1940 1950 1960 1970 1980 1990 2000 2010 2020
Annu
al p
eak s
tream
flow
, in cu
bic f
eet p
er s
econ
d
Water year
8/27/1908
8/18/192810/3/1929
7/17/1916
10/4/2015
Figure 13. Annual peak flows at U.S. Geological Survey streamgage 02169500, Congaree River at Columbia, S.C. [Drainage area is 7,850 square miles.]
18 Preliminary Peak Stage and Streamflow Data at USGS Streamgages in N.C. and S.C. Following Hurricane Florence
Dam, which was completed in 1929 (Conrads and others, 2008). Low-head dams on the Broad River have regulated low streamflows since the late 1880s and early 1900s, but flood streamflows are essentially unregulated. The Broad River Basin accounts for approximately two-thirds of the drainage area for the Congaree River at the Columbia streamgage.
Conrads and others (2008) did a historical analysis to assess the effects the Saluda Dam has had on the flood frequency of Congaree River streamflows and concluded the 1-percent chance flood (also referred to as the 100-year flood) is likely reduced by about 18 percent due to regulation on the Saluda River. Under extreme flood conditions, emergency spillway gates at the Saluda Dam are used to prevent overtopping of the dam. During the historic flood of 1929, the spillway gates were opened on October 1, 1929, and held open through the afternoon of October 6 (South Carolina Electric and Gas, written commun., May 18, 2017). The spillway gates also were opened during the October 2015 flood event related to Hurricane Joaquin (SCE&G, 2018). Consequently, for major floods, operations at the Saluda Dam are likely to be such that the inflow to the reservoir is passed through the system and, thus, the resulting peak streamflows on the Congaree River will tend to reflect preregulation conditions.
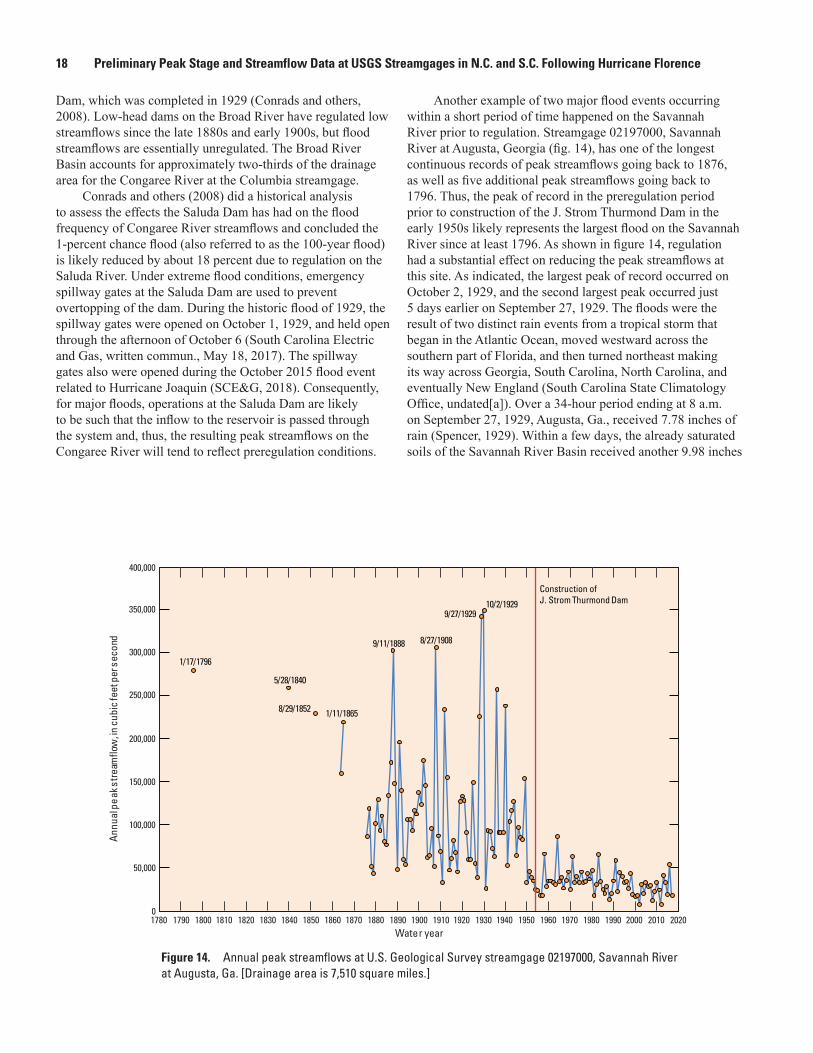
Another example of two major flood events occurring within a short period of time happened on the Savannah River prior to regulation. Streamgage 02197000, Savannah River at Augusta, Georgia (fig. 14), has one of the longest continuous records of peak streamflows going back to 1876, as well as five additional peak streamflows going back to 1796. Thus, the peak of record in the preregulation period prior to construction of the J. Strom Thurmond Dam in the early 1950s likely represents the largest flood on the Savannah River since at least 1796. As shown in figure 14, regulation had a substantial effect on reducing the peak streamflows at this site. As indicated, the largest peak of record occurred on October 2, 1929, and the second largest peak occurred just 5 days earlier on September 27, 1929. The floods were the result of two distinct rain events from a tropical storm that began in the Atlantic Ocean, moved westward across the southern part of Florida, and then turned northeast making its way across Georgia, South Carolina, North Carolina, and eventually New England (South Carolina State Climatology Office, undated[a]). Over a 34-hour period ending at 8 a.m. on September 27, 1929, Augusta, Ga., received 7.78 inches of rain (Spencer, 1929). Within a few days, the already saturated soils of the Savannah River Basin received another 9.98 inches
50,000
0
100,000
150,000
200,000
250,000
300,000
400,000
350,000
1780 1790 1800 1810 1820 1830 1840 1850 1860 1870 1880 1890 1900 1910 1920 1930 1940 1950 1960 1970 1980 1990 2000 2010 2020
Annu
al p
eak s
tream
flow
, in cu
bic f
eet p
er s
econ
d
Water year
Construction ofJ. Strom Thurmond Dam
9/27/192910/2/1929
8/27/19089/11/1888
1/17/1796
5/28/1840
8/29/1852 1/11/1865
Figure 14. Annual peak streamflows at U.S. Geological Survey streamgage 02197000, Savannah River at Augusta, Ga. [Drainage area is 7,510 square miles.]
Comparison to Past Floods 19
50,000
0
100,000
150,000
200,000
250,000
300,000
350,000
20 22 24 26 28 30
1929
2 4 6 8 10September October
Daily
mea
n st
ream
flow
, in
cubi
c fe
et p
er s
econ
d
Figure 15. Daily mean streamflows at U.S. Geological Survey streamgage 02197000, Savannah River at Augusta, Ga., for September 21, 1929, to October 8, 1929. [Drainage area is 7,510 square miles.]
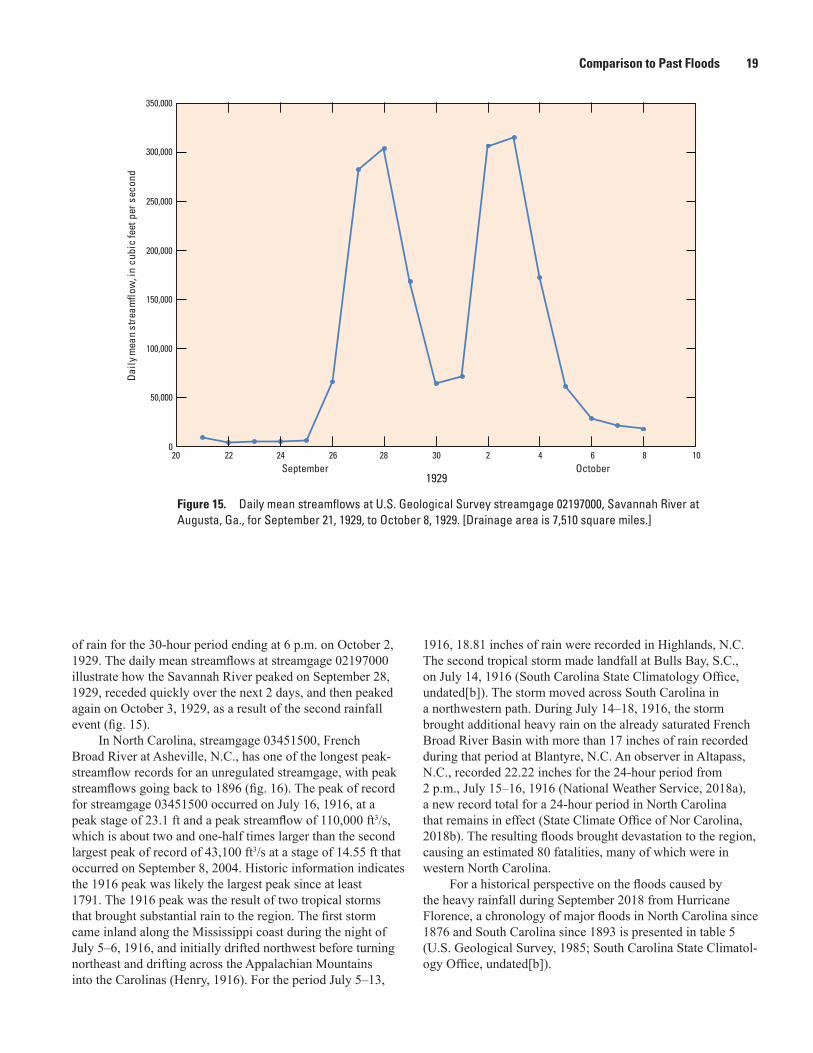
of rain for the 30-hour period ending at 6 p.m. on October 2, 1929. The daily mean streamflows at streamgage 02197000 illustrate how the Savannah River peaked on September 28, 1929, receded quickly over the next 2 days, and then peaked again on October 3, 1929, as a result of the second rainfall event (fig. 15).
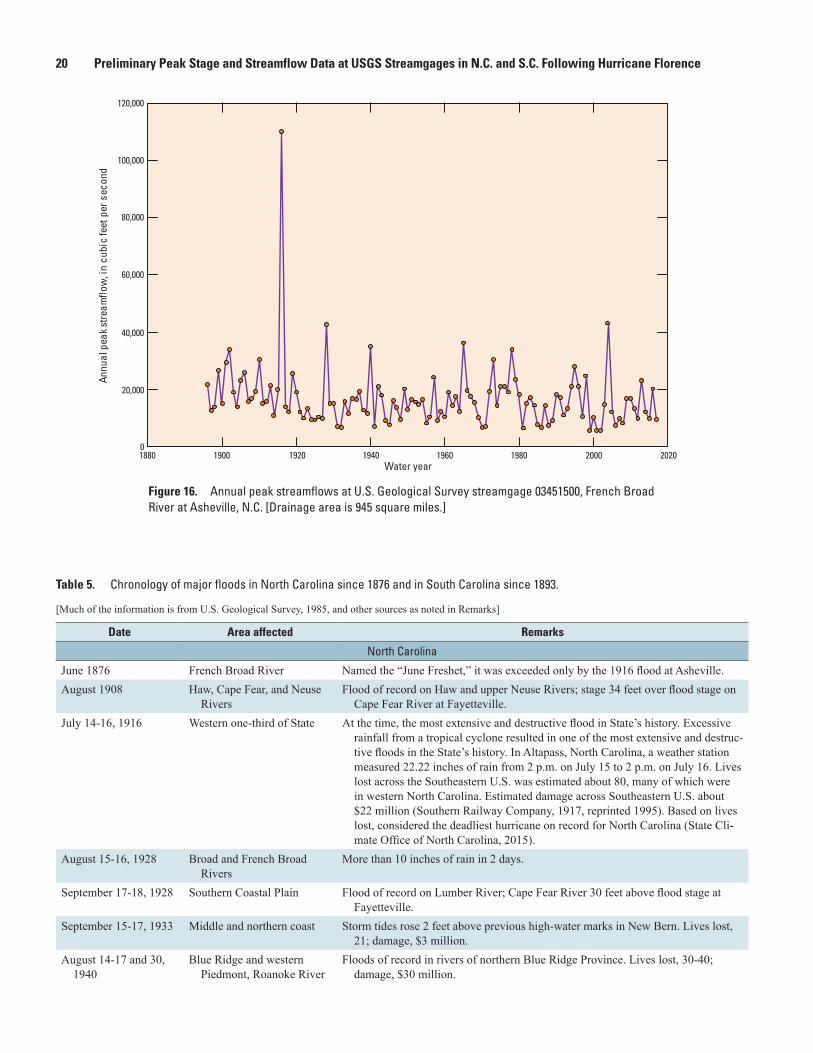
In North Carolina, streamgage 03451500, French Broad River at Asheville, N.C., has one of the longest peak-streamflow records for an unregulated streamgage, with peak streamflows going back to 1896 (fig. 16). The peak of record for streamgage 03451500 occurred on July 16, 1916, at a peak stage of 23.1 ft and a peak streamflow of 110,000 ft3/s, which is about two and one-half times larger than the second largest peak of record of 43,100 ft3/s at a stage of 14.55 ft that occurred on September 8, 2004. Historic information indicates the 1916 peak was likely the largest peak since at least 1791. The 1916 peak was the result of two tropical storms that brought substantial rain to the region. The first storm came inland along the Mississippi coast during the night of July 5–6, 1916, and initially drifted northwest before turning northeast and drifting across the Appalachian Mountains into the Carolinas (Henry, 1916). For the period July 5–13,
1916, 18.81 inches of rain were recorded in Highlands, N.C. The second tropical storm made landfall at Bulls Bay, S.C., on July 14, 1916 (South Carolina State Climatology Office, undated[b]). The storm moved across South Carolina in a northwestern path. During July 14–18, 1916, the storm brought additional heavy rain on the already saturated French Broad River Basin with more than 17 inches of rain recorded during that period at Blantyre, N.C. An observer in Altapass, N.C., recorded 22.22 inches for the 24-hour period from 2 p.m., July 15–16, 1916 (National Weather Service, 2018a), a new record total for a 24-hour period in North Carolina that remains in effect (State Climate Office of Nor Carolina, 2018b). The resulting floods brought devastation to the region, causing an estimated 80 fatalities, many of which were in western North Carolina.
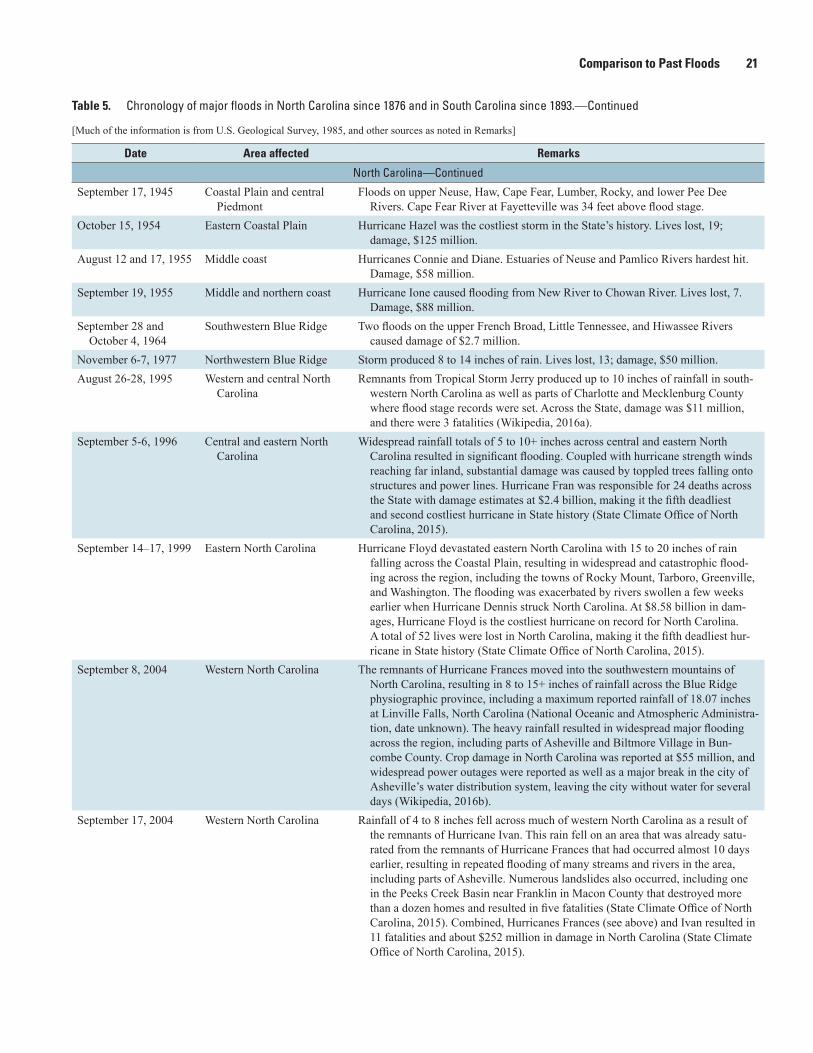
For a historical perspective on the floods caused by the heavy rainfall during September 2018 from Hurricane Florence, a chronology of major floods in North Carolina since 1876 and South Carolina since 1893 is presented in table 5 (U.S. Geological Survey, 1985; South Carolina State Climatol-ogy Office, undated[b]).
20 Preliminary Peak Stage and Streamflow Data at USGS Streamgages in N.C. and S.C. Following Hurricane Florence
20,000
0
40,000
60,000
80,000
100,000
120,000
1880 1900 1920 1940 1960 1980Water year
2000 2020
Annu
al p
eak s
tream
flow
, in
cubi
c fe
et p
er s
econ
d
Figure 16. Annual peak streamflows at U.S. Geological Survey streamgage 03451500, French Broad River at Asheville, N.C. [Drainage area is 945 square miles.]
Table 5. Chronology of major floods in North Carolina since 1876 and in South Carolina since 1893.—Continued
[Much of the information is from U.S. Geological Survey, 1985, and other sources as noted in Remarks]
Date Area affected Remarks
North Carolina
June 1876 French Broad River Named the “June Freshet,” it was exceeded only by the 1916 flood at Asheville.August 1908 Haw, Cape Fear, and Neuse
RiversFlood of record on Haw and upper Neuse Rivers; stage 34 feet over flood stage on
Cape Fear River at Fayetteville.July 14-16, 1916 Western one-third of State At the time, the most extensive and destructive flood in State’s history. Excessive
rainfall from a tropical cyclone resulted in one of the most extensive and destruc-tive floods in the State’s history. In Altapass, North Carolina, a weather station measured 22.22 inches of rain from 2 p.m. on July 15 to 2 p.m. on July 16. Lives lost across the Southeastern U.S. was estimated about 80, many of which were in western North Carolina. Estimated damage across Southeastern U.S. about $22 million (Southern Railway Company, 1917, reprinted 1995). Based on lives lost, considered the deadliest hurricane on record for North Carolina (State Cli-mate Office of North Carolina, 2015).
August 15-16, 1928 Broad and French Broad Rivers
More than 10 inches of rain in 2 days.
September 17-18, 1928 Southern Coastal Plain Flood of record on Lumber River; Cape Fear River 30 feet above flood stage at Fayetteville.
September 15-17, 1933 Middle and northern coast Storm tides rose 2 feet above previous high-water marks in New Bern. Lives lost, 21; damage, $3 million.
August 14-17 and 30, 1940
Blue Ridge and western Piedmont, Roanoke River
Floods of record in rivers of northern Blue Ridge Province. Lives lost, 30-40; damage, $30 million.
Comparison to Past Floods 21
Table 5. Chronology of major floods in North Carolina since 1876 and in South Carolina since 1893.—Continued
[Much of the information is from U.S. Geological Survey, 1985, and other sources as noted in Remarks]
Date Area affected Remarks
North Carolina—Continued
September 17, 1945 Coastal Plain and central Piedmont
Floods on upper Neuse, Haw, Cape Fear, Lumber, Rocky, and lower Pee Dee Rivers. Cape Fear River at Fayetteville was 34 feet above flood stage.
October 15, 1954 Eastern Coastal Plain Hurricane Hazel was the costliest storm in the State’s history. Lives lost, 19; damage, $125 million.
August 12 and 17, 1955 Middle coast Hurricanes Connie and Diane. Estuaries of Neuse and Pamlico Rivers hardest hit. Damage, $58 million.
September 19, 1955 Middle and northern coast Hurricane Ione caused flooding from New River to Chowan River. Lives lost, 7. Damage, $88 million.
September 28 and October 4, 1964
Southwestern Blue Ridge Two floods on the upper French Broad, Little Tennessee, and Hiwassee Rivers caused damage of $2.7 million.
November 6-7, 1977 Northwestern Blue Ridge Storm produced 8 to 14 inches of rain. Lives lost, 13; damage, $50 million.August 26-28, 1995 Western and central North
CarolinaRemnants from Tropical Storm Jerry produced up to 10 inches of rainfall in south-
western North Carolina as well as parts of Charlotte and Mecklenburg County where flood stage records were set. Across the State, damage was $11 million, and there were 3 fatalities (Wikipedia, 2016a).
September 5-6, 1996 Central and eastern North Carolina
Widespread rainfall totals of 5 to 10+ inches across central and eastern North Carolina resulted in significant flooding. Coupled with hurricane strength winds reaching far inland, substantial damage was caused by toppled trees falling onto structures and power lines. Hurricane Fran was responsible for 24 deaths across the State with damage estimates at $2.4 billion, making it the fifth deadliest and second costliest hurricane in State history (State Climate Office of North Carolina, 2015).
September 14–17, 1999 Eastern North Carolina Hurricane Floyd devastated eastern North Carolina with 15 to 20 inches of rain falling across the Coastal Plain, resulting in widespread and catastrophic flood-ing across the region, including the towns of Rocky Mount, Tarboro, Greenville, and Washington. The flooding was exacerbated by rivers swollen a few weeks earlier when Hurricane Dennis struck North Carolina. At $8.58 billion in dam-ages, Hurricane Floyd is the costliest hurricane on record for North Carolina. A total of 52 lives were lost in North Carolina, making it the fifth deadliest hur-ricane in State history (State Climate Office of North Carolina, 2015).
September 8, 2004 Western North Carolina The remnants of Hurricane Frances moved into the southwestern mountains of North Carolina, resulting in 8 to 15+ inches of rainfall across the Blue Ridge physiographic province, including a maximum reported rainfall of 18.07 inches at Linville Falls, North Carolina (National Oceanic and Atmospheric Administra-tion, date unknown). The heavy rainfall resulted in widespread major flooding across the region, including parts of Asheville and Biltmore Village in Bun-combe County. Crop damage in North Carolina was reported at $55 million, and widespread power outages were reported as well as a major break in the city of Asheville’s water distribution system, leaving the city without water for several days (Wikipedia, 2016b).
September 17, 2004 Western North Carolina Rainfall of 4 to 8 inches fell across much of western North Carolina as a result of the remnants of Hurricane Ivan. This rain fell on an area that was already satu-rated from the remnants of Hurricane Frances that had occurred almost 10 days earlier, resulting in repeated flooding of many streams and rivers in the area, including parts of Asheville. Numerous landslides also occurred, including one in the Peeks Creek Basin near Franklin in Macon County that destroyed more than a dozen homes and resulted in five fatalities (State Climate Office of North Carolina, 2015). Combined, Hurricanes Frances (see above) and Ivan resulted in 11 fatalities and about $252 million in damage in North Carolina (State Climate Office of North Carolina, 2015).
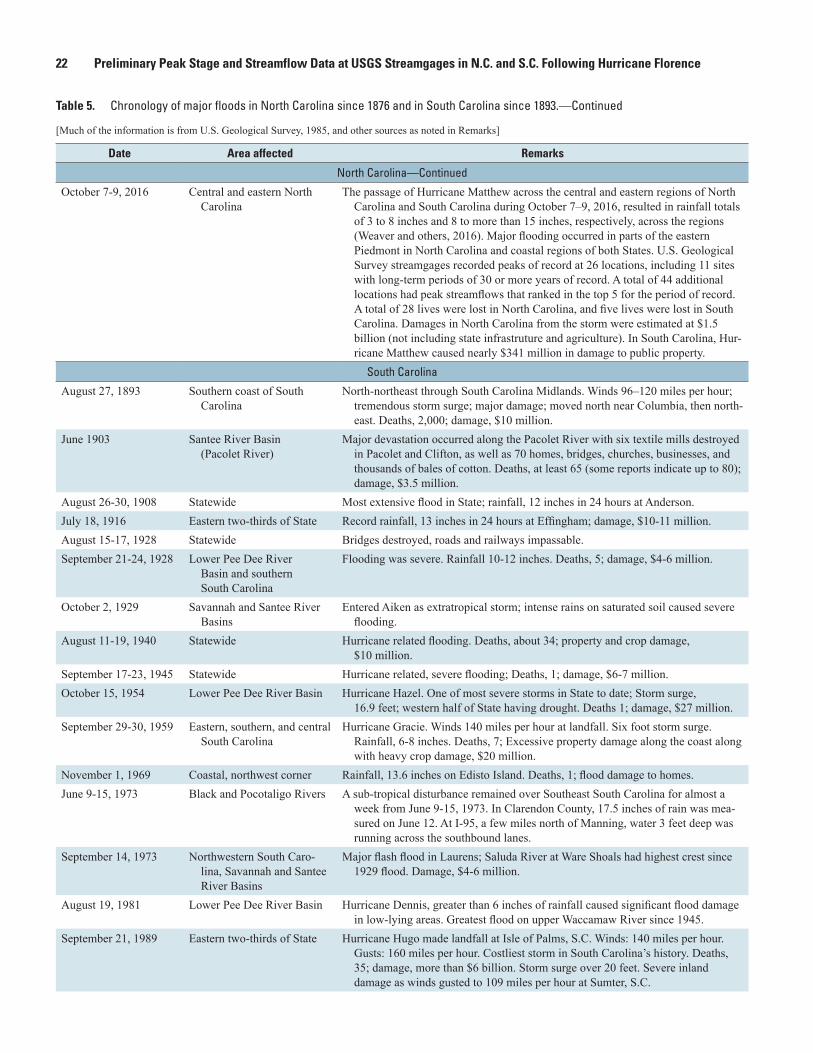
22 Preliminary Peak Stage and Streamflow Data at USGS Streamgages in N.C. and S.C. Following Hurricane Florence
Table 5. Chronology of major floods in North Carolina since 1876 and in South Carolina since 1893.—Continued
[Much of the information is from U.S. Geological Survey, 1985, and other sources as noted in Remarks]
Date Area affected Remarks
North Carolina—Continued
October 7-9, 2016 Central and eastern North Carolina
The passage of Hurricane Matthew across the central and eastern regions of North Carolina and South Carolina during October 7–9, 2016, resulted in rainfall totals of 3 to 8 inches and 8 to more than 15 inches, respectively, across the regions (Weaver and others, 2016). Major flooding occurred in parts of the eastern Piedmont in North Carolina and coastal regions of both States. U.S. Geological Survey streamgages recorded peaks of record at 26 locations, including 11 sites with long-term periods of 30 or more years of record. A total of 44 additional locations had peak streamflows that ranked in the top 5 for the period of record. A total of 28 lives were lost in North Carolina, and five lives were lost in South Carolina. Damages in North Carolina from the storm were estimated at $1.5 billion (not including state infrastruture and agriculture). In South Carolina, Hur-ricane Matthew caused nearly $341 million in damage to public property.
South Carolina
August 27, 1893 Southern coast of South Carolina
North-northeast through South Carolina Midlands. Winds 96–120 miles per hour; tremendous storm surge; major damage; moved north near Columbia, then north-east. Deaths, 2,000; damage, $10 million.
June 1903 Santee River Basin (Pacolet River)
Major devastation occurred along the Pacolet River with six textile mills destroyed in Pacolet and Clifton, as well as 70 homes, bridges, churches, businesses, and thousands of bales of cotton. Deaths, at least 65 (some reports indicate up to 80); damage, $3.5 million.
August 26-30, 1908 Statewide Most extensive flood in State; rainfall, 12 inches in 24 hours at Anderson.July 18, 1916 Eastern two-thirds of State Record rainfall, 13 inches in 24 hours at Effingham; damage, $10-11 million.August 15-17, 1928 Statewide Bridges destroyed, roads and railways impassable.September 21-24, 1928 Lower Pee Dee River
Basin and southern South Carolina
Flooding was severe. Rainfall 10-12 inches. Deaths, 5; damage, $4-6 million.
October 2, 1929 Savannah and Santee River Basins
Entered Aiken as extratropical storm; intense rains on saturated soil caused severe flooding.
August 11-19, 1940 Statewide Hurricane related flooding. Deaths, about 34; property and crop damage, $10 million.
September 17-23, 1945 Statewide Hurricane related, severe flooding; Deaths, 1; damage, $6-7 million.October 15, 1954 Lower Pee Dee River Basin Hurricane Hazel. One of most severe storms in State to date; Storm surge,
16.9 feet; western half of State having drought. Deaths 1; damage, $27 million.September 29-30, 1959 Eastern, southern, and central
South CarolinaHurricane Gracie. Winds 140 miles per hour at landfall. Six foot storm surge.
Rainfall, 6-8 inches. Deaths, 7; Excessive property damage along the coast along with heavy crop damage, $20 million.
November 1, 1969 Coastal, northwest corner Rainfall, 13.6 inches on Edisto Island. Deaths, 1; flood damage to homes.June 9-15, 1973 Black and Pocotaligo Rivers A sub-tropical disturbance remained over Southeast South Carolina for almost a
week from June 9-15, 1973. In Clarendon County, 17.5 inches of rain was mea-sured on June 12. At I-95, a few miles north of Manning, water 3 feet deep was running across the southbound lanes.
September 14, 1973 Northwestern South Caro-lina, Savannah and Santee River Basins
Major flash flood in Laurens; Saluda River at Ware Shoals had highest crest since 1929 flood. Damage, $4-6 million.
August 19, 1981 Lower Pee Dee River Basin Hurricane Dennis, greater than 6 inches of rainfall caused significant flood damage in low-lying areas. Greatest flood on upper Waccamaw River since 1945.
September 21, 1989 Eastern two-thirds of State Hurricane Hugo made landfall at Isle of Palms, S.C. Winds: 140 miles per hour. Gusts: 160 miles per hour. Costliest storm in South Carolina’s history. Deaths, 35; damage, more than $6 billion. Storm surge over 20 feet. Severe inland damage as winds gusted to 109 miles per hour at Sumter, S.C.
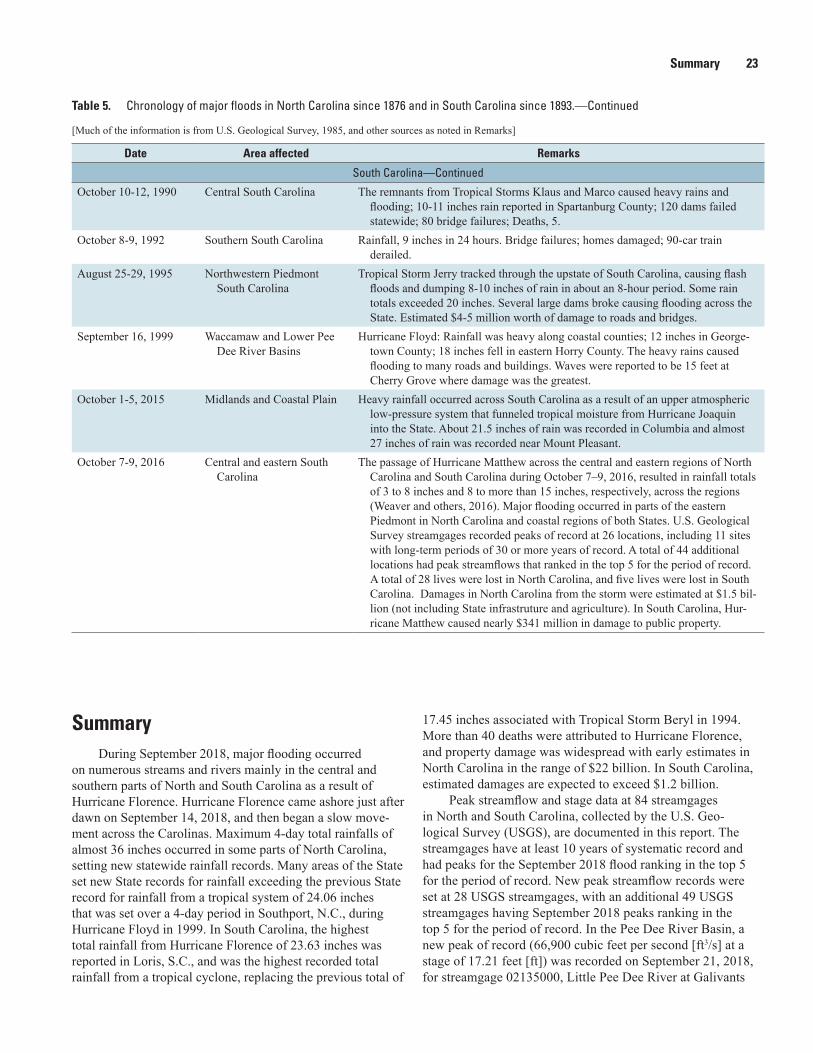
Summary 23
Table 5. Chronology of major floods in North Carolina since 1876 and in South Carolina since 1893.—Continued
[Much of the information is from U.S. Geological Survey, 1985, and other sources as noted in Remarks]
Date Area affected Remarks
South Carolina—Continued
October 10-12, 1990 Central South Carolina The remnants from Tropical Storms Klaus and Marco caused heavy rains and flooding; 10-11 inches rain reported in Spartanburg County; 120 dams failed statewide; 80 bridge failures; Deaths, 5.
October 8-9, 1992 Southern South Carolina Rainfall, 9 inches in 24 hours. Bridge failures; homes damaged; 90-car train derailed.
August 25-29, 1995 Northwestern Piedmont South Carolina
Tropical Storm Jerry tracked through the upstate of South Carolina, causing flash floods and dumping 8-10 inches of rain in about an 8-hour period. Some rain totals exceeded 20 inches. Several large dams broke causing flooding across the State. Estimated $4-5 million worth of damage to roads and bridges.
September 16, 1999 Waccamaw and Lower Pee Dee River Basins
Hurricane Floyd: Rainfall was heavy along coastal counties; 12 inches in George-town County; 18 inches fell in eastern Horry County. The heavy rains caused flooding to many roads and buildings. Waves were reported to be 15 feet at Cherry Grove where damage was the greatest.
October 1-5, 2015 Midlands and Coastal Plain Heavy rainfall occurred across South Carolina as a result of an upper atmospheric low-pressure system that funneled tropical moisture from Hurricane Joaquin into the State. About 21.5 inches of rain was recorded in Columbia and almost 27 inches of rain was recorded near Mount Pleasant.
October 7-9, 2016 Central and eastern South Carolina
The passage of Hurricane Matthew across the central and eastern regions of North Carolina and South Carolina during October 7–9, 2016, resulted in rainfall totals of 3 to 8 inches and 8 to more than 15 inches, respectively, across the regions (Weaver and others, 2016). Major flooding occurred in parts of the eastern Piedmont in North Carolina and coastal regions of both States. U.S. Geological Survey streamgages recorded peaks of record at 26 locations, including 11 sites with long-term periods of 30 or more years of record. A total of 44 additional locations had peak streamflows that ranked in the top 5 for the period of record. A total of 28 lives were lost in North Carolina, and five lives were lost in South Carolina. Damages in North Carolina from the storm were estimated at $1.5 bil-lion (not including State infrastruture and agriculture). In South Carolina, Hur-ricane Matthew caused nearly $341 million in damage to public property.
SummaryDuring September 2018, major flooding occurred
on numerous streams and rivers mainly in the central and southern parts of North and South Carolina as a result of Hurricane Florence. Hurricane Florence came ashore just after dawn on September 14, 2018, and then began a slow move-ment across the Carolinas. Maximum 4-day total rainfalls of almost 36 inches occurred in some parts of North Carolina, setting new statewide rainfall records. Many areas of the State set new State records for rainfall exceeding the previous State record for rainfall from a tropical system of 24.06 inches that was set over a 4-day period in Southport, N.C., during Hurricane Floyd in 1999. In South Carolina, the highest total rainfall from Hurricane Florence of 23.63 inches was reported in Loris, S.C., and was the highest recorded total rainfall from a tropical cyclone, replacing the previous total of
17.45 inches associated with Tropical Storm Beryl in 1994. More than 40 deaths were attributed to Hurricane Florence, and property damage was widespread with early estimates in North Carolina in the range of $22 billion. In South Carolina, estimated damages are expected to exceed $1.2 billion.
Peak streamflow and stage data at 84 streamgages in North and South Carolina, collected by the U.S. Geo-logical Survey (USGS), are documented in this report. The streamgages have at least 10 years of systematic record and had peaks for the September 2018 flood ranking in the top 5 for the period of record. New peak streamflow records were set at 28 USGS streamgages, with an additional 49 USGS streamgages having September 2018 peaks ranking in the top 5 for the period of record. In the Pee Dee River Basin, a new peak of record (66,900 cubic feet per second [ft3/s] at a stage of 17.21 feet [ft]) was recorded on September 21, 2018, for streamgage 02135000, Little Pee Dee River at Galivants
24 Preliminary Peak Stage and Streamflow Data at USGS Streamgages in N.C. and S.C. Following Hurricane Florence
Ferry, S.C., and was the largest peak in the 77 years of record. Historical information indicates the September 2018 peak was the largest since at least 1928. In the Waccamaw River Basin, a new peak of record (53,600 ft3/s at a stage of 22.61 ft) was recorded on September 19, 2018, for streamgage 02109500, Waccamaw River at Freeland, N.C., which was the largest peak for the 77 years of record going back to 1940.
For the 28 streamgages for which the September 2018 peak streamflow was the peak of record, at-site flood-frequency estimates were computed using all available peak-streamflow data through September 2017 and including the September 2018 peak from Hurricane Florence. The at-site flood-frequency estimates were weighted with the appropriate USGS regional regression equations and, based on those weighted results, annual exceedance probabilities (AEP) were estimated for the Hurricane Florence peak streamflows. For the 28 streamgages, 9 had floods with an estimated AEP of less the 0.2 percent (greater than a 500-year recurrence interval), 3 had an estimated AEP equal to 0.2 percent (500-year recurrence interval), and 6 had floods with an estimated AEP of between 0.2 and 1 percent (between a 100- and 500-year recurrence interval). The AEP for the remaining 10 streamgages was estimated to be between 1.5 and 7.1 per-cent (between a 67- and 14-year recurrence interval).
References Cited
Alexander, A., Cope, C., Off, G., and Schechter, M., 2018, Florence damaged hundreds of SC roads and bridges. When will they be repaired?: The State website (September 22, 2018), accessed September 26, 2018, at https://www.thestate.com/ news/weather/article218812185.html.
Badr, A.W., Wachob, A., and Gellici, J.A., 2004, South Carolina water plan, second edition: South Carolina Department of Natural Resources, Land, Water and Conservation Division, 120 p. [Also available at http://www.dnr.sc.gov/water/hydro/wtrplanerrata.html.]
Benson, M.A., and Dalrymple, T., 1967, General field and office procedures for indirect discharge measurements: U.S. Geologi-cal Survey Techniques of Water-Resources Investigations, book 3, chap. A1, 30 p. [Also available at https://doi.org/ 10.3133/twri03A1.]
Bloxham, W.M., 1979, Low-flow frequency and flow duration of South Carolina streams: South Carolina Water Resources Commission Report No. 11, 48 p.
Bodhaine, G.L., 1968, Measurement of peak discharge at culverts by indirect methods: U.S. Geological Survey Techniques of Water-Resources Investigations, book 3, chap. A3, 60 p. [Also available at https://pubs.usg.gov/twri/twri3-a3/.]
CBS News, 2018, Hurricane Florence death toll rises to 42 as South Carolina expects more record flooding: CBS News website (September 20, 2018), accessed September 26, 2018, at https://www.cbsnews.com/news/hurricane-florence-flooding-north-south-carolina-virginia-death-toll-today-2018-09-20/.
Cohn, T.A., Lane, W.L., and Baier, W.G., 1997, An algorithm for computing moments-based flood quantile estimates when historical flood information is available: Water Resources Research, v. 33, no. 9, p. 2089–2096. [Also available at https://doi.org/10.1029/97WR01640.]
Cohn, T.A., Lane, W.L., and Stedinger, J.R., 2001, Confidence intervals for expected moments algorithm flood quantile esti-mates: Water Resources Research, v. 37, no. 6, p. 1695–1706. [Also available at https://doi.org/10.1029/2001WR900016.]
Conrads, P.A., Feaster, T.D., and Harrelson, L.G., 2008, The effects of the Saluda Dam on the surface-water and ground-water hydrology of the Congaree National Park flood plain, South Carolina: U.S. Geological Survey Scientific Investiga-tions Report 2008–5170, 58 p. [Also available at https://pubs.usgs.gov/sir/2008/5170/.]
Cooke, C.W., 1936, Geology of the Coastal Plain of South Carolina: U.S. Geological Survey Bulletin 867, 196 p., 2 pls.
Dalrymple, T., and Benson, M.A., 1967, Measurement of peak discharge by the slope-area method: U.S. Geological Survey Techniques of Water-Resources Investigations, book 3, chap. A2, 12 p. [Also available at https://pubs.usgs.gov/twri/twri3-a2/.)
Duke Energy, 2018, Duke Energy restoring power to remaining 26,000 customers after repairing nearly 1.8 million outages in Carolinas: Duke Energy website (September 21, 2018), accessed September 26, 2018, at https://news.duke-energy.com/releases/duke-energy-restoring-power-to-remaining-26-000-customers-after-repairing-nearly-1-8-million-outages-in-carolinas?_ga=2.95376412.1074249658.1537965382-1307930236.1501670512.
England, J.F., Jr., Cohn, T.A., Faber, B.A., Stedinger, J.R., Thomas, W.O., Jr., Veilleux, A.G., Kiang, J.E., and Mason, R.R., Jr., 2018, Guidelines for determining flood flow frequency—Bulletin 17C: U.S. Geological Survey Techniques and Methods, book 4, chap. B5, 148 p. [Also available at https://doi.org/10.3133/tm4B5.]
Feaster, T.D., Gotvald, A.J., and Weaver, J.C., 2009, Magnitude and frequency of rural floods in the Southeastern United States, 2006—Volume 3, South Carolina: U.S. Geologi-cal Survey Scientific Investigations Report 2009–5156, 226 p. [Also available at https://pubs.usgs.gov/sir/2009/5156/.]
Feaster, T.D., Gotvald, A.J., and Weaver, J.C., 2014, Methods for estimating the magnitude and frequency of floods for urban and small, rural streams in Georgia, South Carolina, and North Carolina, 2011 (ver. 1.1, March 2014): U.S. Geological Survey Scientific Investigations Report 2014–5030, 104 p. [Also available at https://doi.org/10.3133/sir20145030.]
References Cited 25
Feaster, T.D., and Koenig, T.A., 2017, Field manual for identify-ing and preserving high-water mark data: U.S. Geological Survey Open-File Report 2017–1105, 67 p. [Also available at https://doi.org/10.3133/ofr20171105.]
Feaster, T.D., Shelton, J.M., and Robbins, J.C., 2015, Preliminary peak stage and streamflow data at selected USGS streamgaging stations for the South Carolina flood of October 2015 (ver. 1.1, November 2015): U.S. Geological Survey Open-File Report 2015–1201, 19 p. [Also available at https://doi.org/10.3133/ofr20151201.]
Flynn, K.M., Kirby, W.H., and Hummel, P.R., 2006, User’s manual for program PeakFQ, annual flood-frequency analysis using Bulletin 17B guidelines: U.S. Geological Survey Techniques and Methods, book 4, chap. B4, 42 p. [Also available at https://pubs.usgs.gov/tm/2006/tm4b4/.]
Frankenfield, H.C., 1928, Rivers and floods: Monthly Weather Review, v. 56, no. 8, p. 332–334, accessed October 2, 2018, at https://journals.ametsoc.org/toc/mwre/56/8.
Giese, G.L., and Mason, R.R., Jr., 1993, Low-flow characteristics of streams in North Carolina: U.S. Geological Survey Water-Supply Paper 2403, 29 p., 2 pls. [Also available at https://doi.org/10.3133/wsp2403.]
Hart, J., 2018, Ag losses from Florence pegged at $125 million: Southeast Farm Press, September 24, 2018, accessed Septem-ber 27, 2018, at https://www.southeastfarmpress.com/weather/ ag-losses-florence-pegged-125-million.
Henry, A.J., 1916, Rivers and floods, August, 1916: Monthly Weather Review, August 1916, p. 465–466, accessed Octo-ber 3, 2018, at ftp://ftp.library.noaa.gov/docs.lib/htdocs/rescue/mwr/057/mwr-057-10-0435b.pdf.
Holmes, R.R., Jr., and Dinicola, K., 2010, 100-year flood—It’s all about chance: U.S. Geological Survey General Information Product 106, 1 p. [Also available at https://doi.org/10.3133/gip106.]
Hulsing, H., 1967, Measurement of peak discharge at dams by indirect methods: U.S. Geological Survey Techniques of Water-Resources Investigations, book 3, chap. A5, 29 p. [Also available at https://pubs.usgs.gov/twri/twri3-a5/.]
Interagency Advisory Committee on Water Data, 1982, Guide-lines for determining flood flow frequency, Bulletin 17B of the Hydrology Subcommittee: U.S. Geological Survey, Office of Water Data Coordination, 28 p., 14 apps., 1 oversized sheet.
Koenig, T.A., Bruce, J.L., O’Connor, J.E., McGee, B.D., Holmes, R.R., Jr., Hollins, R., Forbes, B.T., Kohn, M.S., Schellekens, M.F., Martin, Z.W., and Peppler, M.C., 2016, Identifying and preserving high-water mark data: U.S. Geological Survey Techniques and Methods, book 3, chap. A24, 47 p. [Also available at https://doi.org/10.3133/tm3A24.]
Lurry, D.L., 2011, How does a U.S. Geological Survey streamgage work?: U.S. Geological Survey Fact Sheet 2011–3001, 2 p. [Also available at http://doi.org/10.3133/fs20113001.]
Matthai, H.F., 1967, Measurement of peak discharge at width contractions by indirect methods: U.S. Geological Survey Techniques of Water-Resources Investigations, book 3, chap. A4, 44 p. [Also available at https://pubs.usgs.gov/twri/twri3-a4/.]
National Grain and Feed Association, 2018, North Carolina estimates Hurricane Florence’s ag damage: National Grain and Feed Association newsletter, September 21, 2018, accessed September 26, 2018, at https://www.ngfa.org/newsletter/north-carolina-estimates-hurricane-florences-ag-damage/.
National Oceanic and Atmospheric Administration, [date unknown], Hurricanes in history—Hurricane Frances 2004: National Hurricane Center Web page, accessed December 13, 2016, at http://www.nhc.noaa.gov/outreach/history/#frances.
National Oceanic and Atmospheric Administration, 2018, Historical Hurricane Florence, September 12–15, 2018: National Weather Service website, accessed September 24, 2018, at https://www.weather.gov/mhx/Florence2018.
National Weather Service, 2018a, Flooding in North Carolina: National Weather Service website, accessed October 15, 2018, at https://www.weather.gov/safety/flood-states-nc.
National Weather Service, 2018b, Storm summary for heavy rain and wind associated with Florence: The Weather Prediction Center web page (September 19, 2018), accessed Septem-ber 27, 2018, at https://www.wpc.ncep.noaa.gov/discussions/nfdscc4.html.
North Carolina Department of Public Safety, 2018, Hurricane Florence claims three lives in North Carolina: North Carolina Department of Public Safety press release, September 14, 2018, accessed September 20, 2018, at https://www.ncdps.gov/news/press-releases/2018/09/14/hurricane-florence-claims-three-lives-north-carolina.
Omernik, J.M., 1987, Ecoregions of the conterminous United States: Annals of the Association of American Geographers, v. 77, no. 1, p. 118–125. [Also available at https://doi.org/ 10.1111/j.1467-8306.1987.tb00149.x.]
Samenow, J., 2018, Hurricane Florence’s assault begins as wind gusts top 105 mph on Outer Banks, waters rise 10 feet: The Washington Post, September 14, 2018, accessed September 25, 2018, at https://www.washingtonpost.com/news/capital-weather-gang/wp/2018/09/13/hurricane-florence-set-to-begin-dangerous-assault-from-rain-and-wind-in-the-carolinas/?noredirect=on&utm_term=.3d48f19f07a4.
SCE&G, 2018, SCE&G reminds customers to be safe during severe weather: SCE&G website, accessed October 3, 2018, at https://www.sceg.com/about-us/newsroom/2015/10/04/ sce-g-reminds-customers-to-be-safe-during-severe-weather.
Smith, T., 2018, Hurricane Florence, another 1,000-year event, caused at least $1.2 billion in damage in SC: Greenville News, September 20, 2018, accessed September 26, 2018, at https://www.greenvilleonline.com/story/news/local/south-carolina/2018/09/20/south-carolina-damage-florence-estimated-1-2-billion/1368815002/.
26 Preliminary Peak Stage and Streamflow Data at USGS Streamgages in N.C. and S.C. Following Hurricane Florence
South Carolina State Climatology Office, 2018, Hurricane Florence—Preliminary Open File Report: South Carolina Department of Natural Resources, 8 p., accessed September 26, 2018, at http://www.dnr.sc.gov/climate/sco/Publications/ FlorenceQuickReport_100518.pdf.
South Carolina State Climatology Office, undated[a], Hurricane #2, September 22–October 4, 1929: South Carolina State Climatology Office website, accessed October 3, 2018, at http://www.dnr.sc.gov/climate/sco/Tropics/pastTracks/Hurr2_1929.php.
South Carolina State Climatology Office, undated[b], Hurricanes and tropical storms affecting South Carolina 1910–1919: South Carolina State Climatology Office website, accessed October 3, 2018, at http://www.dnr.sc.gov/climate/sco/Tropics/1910s.php.
Southern Railway Company, 1917, The floods of July, 1916—How the Southern Railway Organization met an emergency: Southern Railway Company, 131 p. (Reprinted in 1995 by The Overmountain Press.)
Spencer, R.E., 1929, Rivers and floods: Monthly Weather Review, v. 57, no. 10, p. 435–437, accessed October 2, 2018, at https://journals.ametsoc.org/toc/mwre/57/10.
State Climate Office of North Carolina, 2015, NC extremes— Damaging hurricanes from slopes to shores: State Climate Office of North Carolina Web page, accessed November 12, 2016, at http://climate.ncsu.edu/climateblog?id=157.
State Climate Office of North Carolina, 2016, Averages and normals: State Climate Office of North Carolina website, accessed November 1, 2016, at https://climate.ncsu.edu/edu/Normals.
State Climate Office of North Carolina, 2018a, Rapid reac-tion—Record rainfall and flooding follow Florence: State Climate Office of North Carolina website (September 18, 2018), accessed September 25, 2018, at http://climate.ncsu.edu/climateblog?id=266.
State Climate Office of North Carolina, 2018b, Weather extremes: State Climate Office of North Carolina website, accessed October 24, 2018, at http://climate.ncsu.edu/nc_extremes.
Sweat, C., 2018, When agriculture hurts, everybody hurts— Florence caused $1.1B in NC agriculture losses: WRAL website (September 26, 2018), accessed September 27, 2018, at https://www.wral.com/florence-caused-1-1b-in-nc-agriculture-losses/17875342/.
Turnipseed, D.P., and Sauer, V.B., 2010, Discharge measurements at gaging stations: U.S. Geological Survey Techniques and Methods book 3, chap. A8, 87 p. [Also available at https://pubs.usgs.gov/tm/tm3-a8/.]
U.S. Geological Survey, 1985, National Water Summary 1988–89, Hydrologic events and floods and droughts: U.S. Geological Survey Water-Supply Paper 2375, 591 p. [Also available at https://doi.org/10.3133/wsp2375.]
U.S. Geological Survey, 2012, Computation of annual exceedance probability (AEP) for characterization of observed flood peaks: U.S. Geological Survey Office of Surface Water Technical Memorandum 2013.01, accessed March 6, 2018, at https://water.usgs.gov/admin/memo/SW/sw13.01.pdf.
U.S. Geological Survey, 2014a, Number of USGS streamgages through time: USGS National Streamflow Information Program web page, accessed October 9, 2018, at http://water.usgs.gov/nsip/history1.html.
U.S. Geological Survey, 2014b, Weighting estimates of peak-flow-frequency when using the expected moments algorithm for at-site flood-frequency estimation: Office of Surface Water Informational and Technical Note 2014.43, 8 p., accessed October 10, 2018, at https://water.usgs.gov/floods/usgs/OSW_Note_2014.43.pdf.
Veilleux, A.G., Cohn, T.A., Flynn, K.M., Mason, R.R., Jr., and Hummel, P.R., 2014, Estimating magnitude and frequency of floods using the PeakFQ 7.0 program: U.S. Geological Survey Fact Sheet 2013–3108, 2 p. [Also available at https://doi.org/ 10.3133/fs20133108.]
Weaver, J.C., Feaster, T.D., and Gotvald, A.J., 2009, Magnitude and frequency of rural floods in the Southeastern United States, through 2006—Volume 2, North Carolina: U.S. Geological Survey Scientific Investigations Report 2009–5158, 111 p. [Also available at https://pubs.usgs.gov/sir/2009/5158/.]
Weaver, J.C., Feaster, T.D., and Robbins, J.C., 2016, Preliminary peak stage and streamflow data at selected streamgaging stations in North Carolina and South Carolina for flooding following Hurricane Matthew, October 2016: U.S. Geological Survey Open-File Report 2016–1205, 38 p. [Also available at https://doi.org/10.3133/ofr20161205.]
Wikipedia, 2016a, Tropical Storm Jerry (1995): Wikipedia® web page, accessed December 2, 2016, at https://en.wikipedia.org/wiki/Tropical_Storm_Jerry_(1995). [Wikipedia is a registered trademark of the Wikimedia Foundation, Inc.]
Wikipedia, 2016b, Hurricane Frances: Wikipedia® web page, accessed December 2, 2016, at https://en.wikipedia.org/ wiki/Hurricane_Frances. [Wikipedia is a registered trademark of the Wikimedia Foundation, Inc.]
Winner, M.D., Jr., and Coble, R.W., 1996, Hydrogeologic framework of the North Carolina Coastal Plain, in Regional Aquifer-System Analysis—Northern Atlantic Coastal Plain: U.S. Geological Survey Professional Paper 1404–I, 106 p., 24 pls. [Also available at https://pubs.usgs.gov/pp/1404i/ report.pdf.]
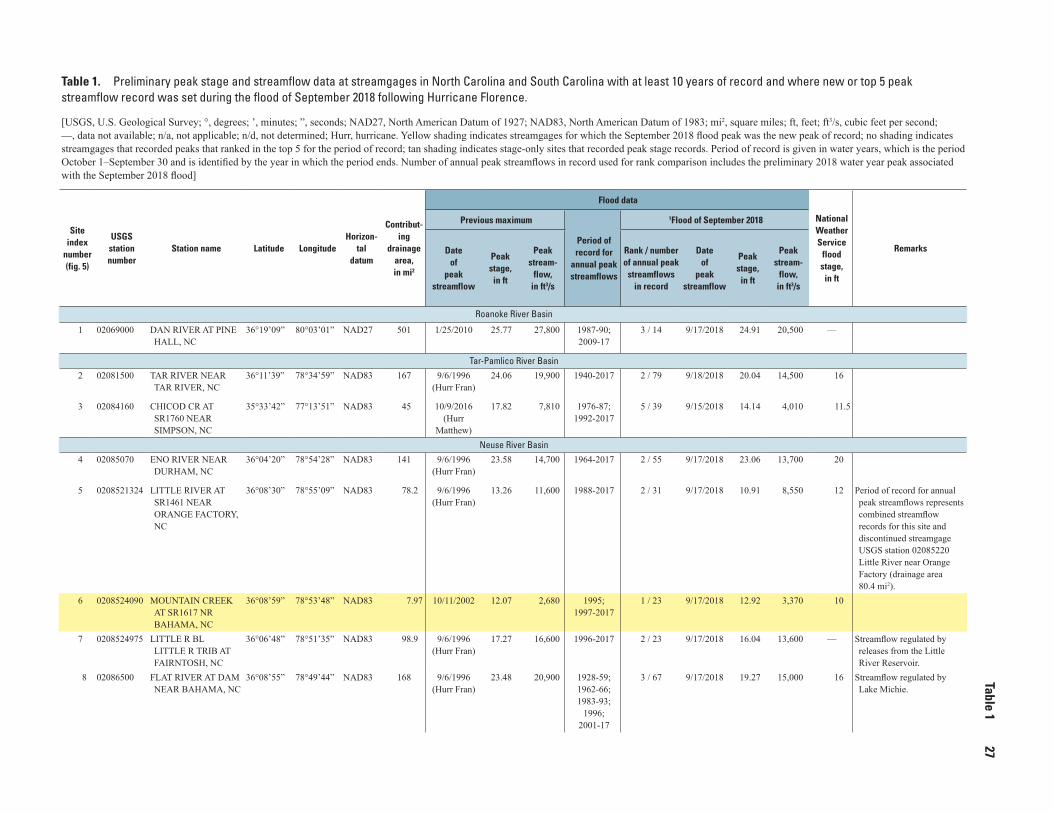
Table 1
27Table 1. Preliminary peak stage and streamflow data at streamgages in North Carolina and South Carolina with at least 10 years of record and where new or top 5 peak streamflow record was set during the flood of September 2018 following Hurricane Florence.—Continued
[USGS, U.S. Geological Survey; °, degrees; ’, minutes; ”, seconds; NAD27, North American Datum of 1927; NAD83, North American Datum of 1983; mi2, square miles; ft, feet; ft3/s, cubic feet per second; —, data not available; n/a, not applicable; n/d, not determined; Hurr, hurricane. Yellow shading indicates streamgages for which the September 2018 flood peak was the new peak of record; no shading indicates streamgages that recorded peaks that ranked in the top 5 for the period of record; tan shading indicates stage-only sites that recorded peak stage records. Period of record is given in water years, which is the period October 1–September 30 and is identified by the year in which the period ends. Number of annual peak streamflows in record used for rank comparison includes the preliminary 2018 water year peak associated with the September 2018 flood]
Site index
number (fig. 5)
USGS station number
Station name Latitude LongitudeHorizon-
tal datum
Contribut-ing
drainage area, in mi2
Flood data
National Weather Service
flood stage, in ft
Remarks
Previous maximum
Period of record for
annual peak streamflows
1Flood of September 2018
Date of
peak streamflow
Peak stage,
in ft
Peak stream-
flow, in ft3/s
Rank / number of annual peak
streamflows in record
Date of
peak streamflow
Peak stage, in ft
Peak stream-
flow, in ft3/s
Roanoke River Basin
1 02069000 DAN RIVER AT PINE HALL, NC
36°19’09” 80°03’01” NAD27 501 1/25/2010 25.77 27,800 1987-90; 2009-17
3 / 14 9/17/2018 24.91 20,500 —
Tar-Pamlico River Basin
2 02081500 TAR RIVER NEAR TAR RIVER, NC
36°11’39” 78°34’59” NAD83 167 9/6/1996 (Hurr Fran)
24.06 19,900 1940-2017 2 / 79 9/18/2018 20.04 14,500 16
3 02084160 CHICOD CR AT SR1760 NEAR SIMPSON, NC
35°33’42” 77°13’51” NAD83 45 10/9/2016 (Hurr
Matthew)
17.82 7,810 1976-87; 1992-2017
5 / 39 9/15/2018 14.14 4,010 11.5
Neuse River Basin
4 02085070 ENO RIVER NEAR DURHAM, NC
36°04’20” 78°54’28” NAD83 141 9/6/1996 (Hurr Fran)
23.58 14,700 1964-2017 2 / 55 9/17/2018 23.06 13,700 20
5 0208521324 LITTLE RIVER AT SR1461 NEAR ORANGE FACTORY, NC
36°08’30” 78°55’09” NAD83 78.2 9/6/1996 (Hurr Fran)
13.26 11,600 1988-2017 2 / 31 9/17/2018 10.91 8,550 12 Period of record for annual peak streamflows represents combined streamflow records for this site and discontinued streamgage USGS station 02085220 Little River near Orange Factory (drainage area 80.4 mi2).
6 0208524090 MOUNTAIN CREEK AT SR1617 NR BAHAMA, NC
36°08’59” 78°53’48” NAD83 7.97 10/11/2002 12.07 2,680 1995; 1997-2017
1 / 23 9/17/2018 12.92 3,370 10
7 0208524975 LITTLE R BL LITTLE R TRIB AT FAIRNTOSH, NC
36°06’48” 78°51’35” NAD83 98.9 9/6/1996 (Hurr Fran)
17.27 16,600 1996-2017 2 / 23 9/17/2018 16.04 13,600 — Streamflow regulated by releases from the Little River Reservoir.
8 02086500 FLAT RIVER AT DAM NEAR BAHAMA, NC
36°08’55” 78°49’44” NAD83 168 9/6/1996 (Hurr Fran)
23.48 20,900 1928-59; 1962-66; 1983-93;
1996; 2001-17
3 / 67 9/17/2018 19.27 15,000 16 Streamflow regulated by Lake Michie.
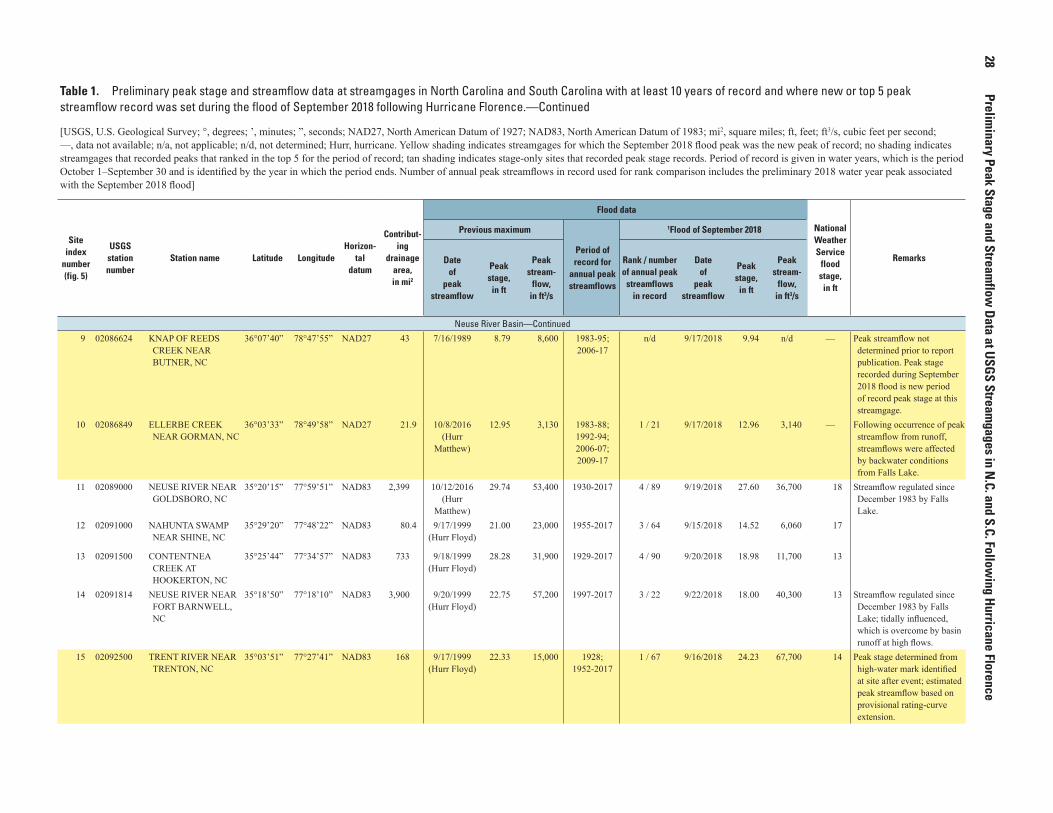
28
Preliminary Peak Stage and Stream
flow Data at USGS Stream
gages in N.C. and S.C. Follow
ing Hurricane Florence
Table 1. Preliminary peak stage and streamflow data at streamgages in North Carolina and South Carolina with at least 10 years of record and where new or top 5 peak streamflow record was set during the flood of September 2018 following Hurricane Florence.—Continued
[USGS, U.S. Geological Survey; °, degrees; ’, minutes; ”, seconds; NAD27, North American Datum of 1927; NAD83, North American Datum of 1983; mi2, square miles; ft, feet; ft3/s, cubic feet per second; —, data not available; n/a, not applicable; n/d, not determined; Hurr, hurricane. Yellow shading indicates streamgages for which the September 2018 flood peak was the new peak of record; no shading indicates streamgages that recorded peaks that ranked in the top 5 for the period of record; tan shading indicates stage-only sites that recorded peak stage records. Period of record is given in water years, which is the period October 1–September 30 and is identified by the year in which the period ends. Number of annual peak streamflows in record used for rank comparison includes the preliminary 2018 water year peak associated with the September 2018 flood]
Site index
number (fig. 5)
USGS station number
Station name Latitude LongitudeHorizon-
tal datum
Contribut-ing
drainage area, in mi2
Flood data
National Weather Service
flood stage, in ft
Remarks
Previous maximum
Period of record for
annual peak streamflows
1Flood of September 2018
Date of
peak streamflow
Peak stage,
in ft
Peak stream-
flow, in ft3/s
Rank / number of annual peak
streamflows in record
Date of
peak streamflow
Peak stage, in ft
Peak stream-
flow, in ft3/s
Neuse River Basin—Continued
9 02086624 KNAP OF REEDS CREEK NEAR BUTNER, NC
36°07’40” 78°47’55” NAD27 43 7/16/1989 8.79 8,600 1983-95; 2006-17
n/d 9/17/2018 9.94 n/d — Peak streamflow not determined prior to report publication. Peak stage recorded during September 2018 flood is new period of record peak stage at this streamgage.
10 02086849 ELLERBE CREEK NEAR GORMAN, NC
36°03’33” 78°49’58” NAD27 21.9 10/8/2016 (Hurr
Matthew)
12.95 3,130 1983-88; 1992-94; 2006-07; 2009-17
1 / 21 9/17/2018 12.96 3,140 — Following occurrence of peak streamflow from runoff, streamflows were affected by backwater conditions from Falls Lake.
11 02089000 NEUSE RIVER NEAR GOLDSBORO, NC
35°20’15” 77°59’51” NAD83 2,399 10/12/2016 (Hurr
Matthew)
29.74 53,400 1930-2017 4 / 89 9/19/2018 27.60 36,700 18 Streamflow regulated since December 1983 by Falls Lake.
12 02091000 NAHUNTA SWAMP NEAR SHINE, NC
35°29’20” 77°48’22” NAD83 80.4 9/17/1999 (Hurr Floyd)
21.00 23,000 1955-2017 3 / 64 9/15/2018 14.52 6,060 17
13 02091500 CONTENTNEA CREEK AT HOOKERTON, NC
35°25’44” 77°34’57” NAD83 733 9/18/1999 (Hurr Floyd)
28.28 31,900 1929-2017 4 / 90 9/20/2018 18.98 11,700 13
14 02091814 NEUSE RIVER NEAR FORT BARNWELL, NC
35°18’50” 77°18’10” NAD83 3,900 9/20/1999 (Hurr Floyd)
22.75 57,200 1997-2017 3 / 22 9/22/2018 18.00 40,300 13 Streamflow regulated since December 1983 by Falls Lake; tidally influenced, which is overcome by basin runoff at high flows.
15 02092500 TRENT RIVER NEAR TRENTON, NC
35°03’51” 77°27’41” NAD83 168 9/17/1999 (Hurr Floyd)
22.33 15,000 1928; 1952-2017
1 / 67 9/16/2018 24.23 67,700 14 Peak stage determined from high-water mark identified at site after event; estimated peak streamflow based on provisional rating-curve extension.
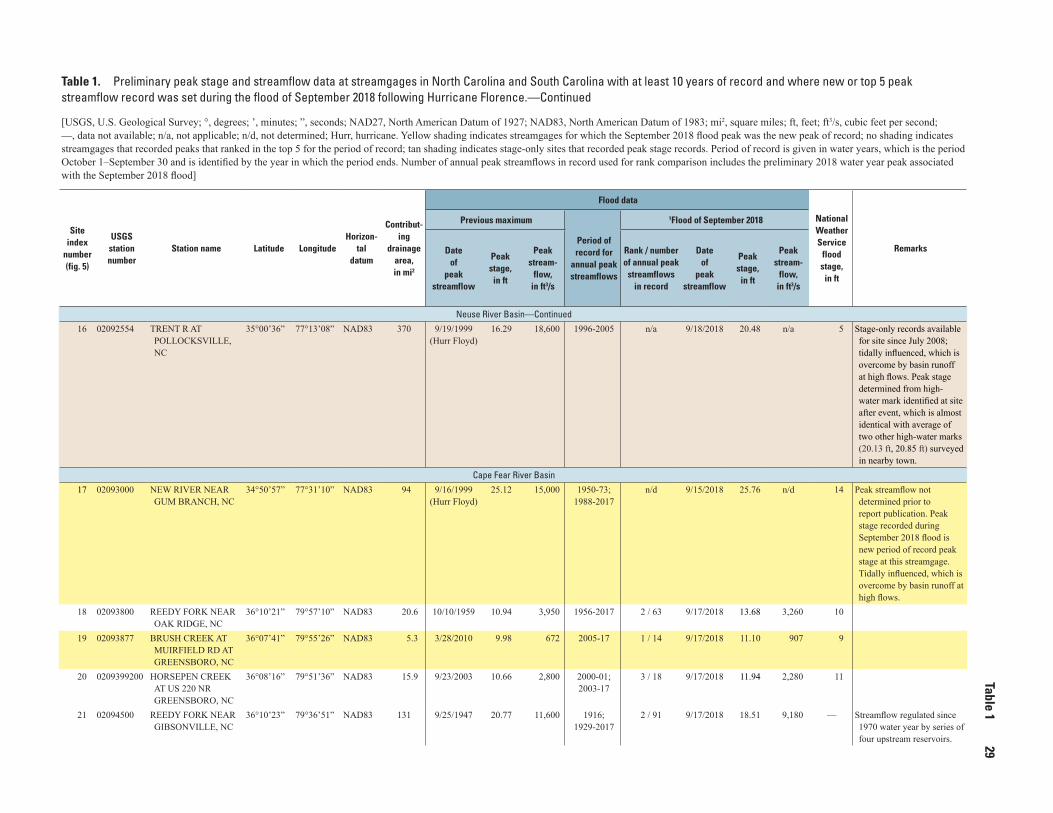
Table 1
29Table 1. Preliminary peak stage and streamflow data at streamgages in North Carolina and South Carolina with at least 10 years of record and where new or top 5 peak streamflow record was set during the flood of September 2018 following Hurricane Florence.—Continued
[USGS, U.S. Geological Survey; °, degrees; ’, minutes; ”, seconds; NAD27, North American Datum of 1927; NAD83, North American Datum of 1983; mi2, square miles; ft, feet; ft3/s, cubic feet per second; —, data not available; n/a, not applicable; n/d, not determined; Hurr, hurricane. Yellow shading indicates streamgages for which the September 2018 flood peak was the new peak of record; no shading indicates streamgages that recorded peaks that ranked in the top 5 for the period of record; tan shading indicates stage-only sites that recorded peak stage records. Period of record is given in water years, which is the period October 1–September 30 and is identified by the year in which the period ends. Number of annual peak streamflows in record used for rank comparison includes the preliminary 2018 water year peak associated with the September 2018 flood]
Site index
number (fig. 5)
USGS station number
Station name Latitude LongitudeHorizon-
tal datum
Contribut-ing
drainage area, in mi2
Flood data
National Weather Service
flood stage, in ft
Remarks
Previous maximum
Period of record for
annual peak streamflows
1Flood of September 2018
Date of
peak streamflow
Peak stage,
in ft
Peak stream-
flow, in ft3/s
Rank / number of annual peak
streamflows in record
Date of
peak streamflow
Peak stage, in ft
Peak stream-
flow, in ft3/s
Neuse River Basin—Continued
16 02092554 TRENT R AT POLLOCKSVILLE, NC
35°00’36” 77°13’08” NAD83 370 9/19/1999 (Hurr Floyd)
16.29 18,600 1996-2005 n/a 9/18/2018 20.48 n/a 5 Stage-only records available for site since July 2008; tidally influenced, which is overcome by basin runoff at high flows. Peak stage determined from high-water mark identified at site after event, which is almost identical with average of two other high-water marks (20.13 ft, 20.85 ft) surveyed in nearby town.
Cape Fear River Basin
17 02093000 NEW RIVER NEAR GUM BRANCH, NC
34°50’57” 77°31’10” NAD83 94 9/16/1999 (Hurr Floyd)
25.12 15,000 1950-73; 1988-2017
n/d 9/15/2018 25.76 n/d 14 Peak streamflow not determined prior to report publication. Peak stage recorded during September 2018 flood is new period of record peak stage at this streamgage. Tidally influenced, which is overcome by basin runoff at high flows.
18 02093800 REEDY FORK NEAR OAK RIDGE, NC
36°10’21” 79°57’10” NAD83 20.6 10/10/1959 10.94 3,950 1956-2017 2 / 63 9/17/2018 13.68 3,260 10
19 02093877 BRUSH CREEK AT MUIRFIELD RD AT GREENSBORO, NC
36°07’41” 79°55’26” NAD83 5.3 3/28/2010 9.98 672 2005-17 1 / 14 9/17/2018 11.10 907 9
20 0209399200 HORSEPEN CREEK AT US 220 NR GREENSBORO, NC
36°08’16” 79°51’36” NAD83 15.9 9/23/2003 10.66 2,800 2000-01; 2003-17
3 / 18 9/17/2018 11.94 2,280 11
21 02094500 REEDY FORK NEAR GIBSONVILLE, NC
36°10’23” 79°36’51” NAD83 131 9/25/1947 20.77 11,600 1916; 1929-2017
2 / 91 9/17/2018 18.51 9,180 — Streamflow regulated since 1970 water year by series of four upstream reservoirs.
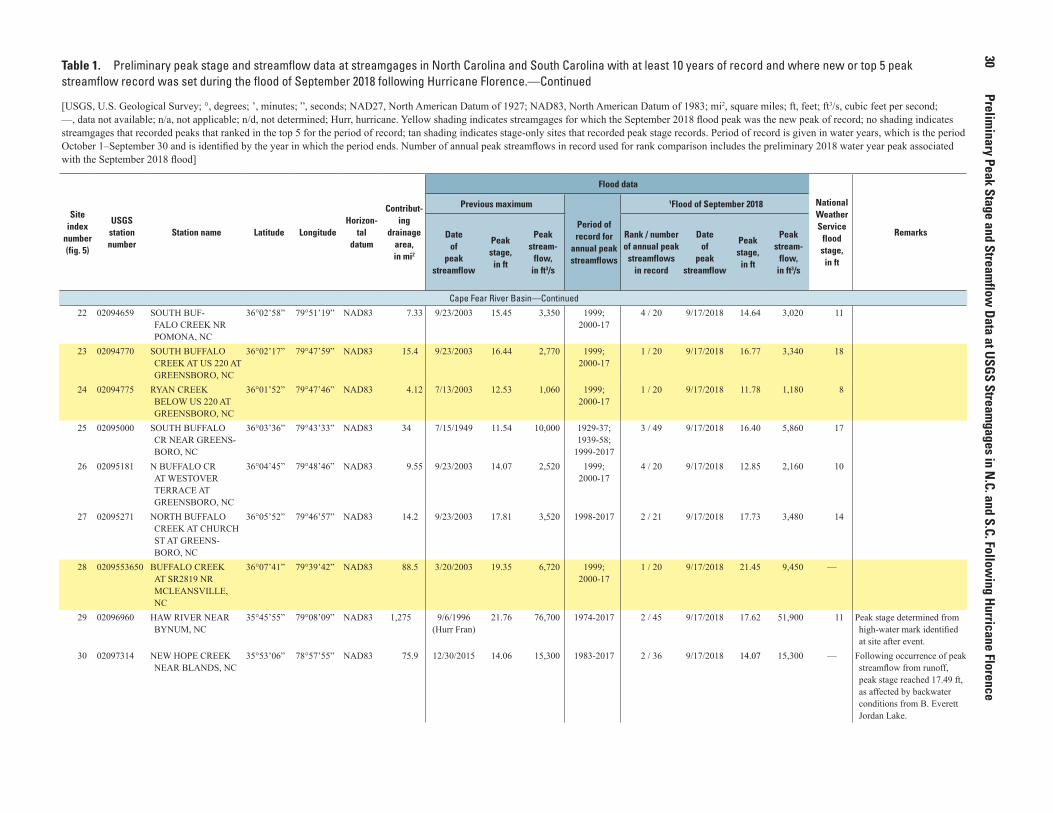
30
Preliminary Peak Stage and Stream
flow Data at USGS Stream
gages in N.C. and S.C. Follow
ing Hurricane FlorenceTable 1. Preliminary peak stage and streamflow data at streamgages in North Carolina and South Carolina with at least 10 years of record and where new or top 5 peak streamflow record was set during the flood of September 2018 following Hurricane Florence.—Continued
[USGS, U.S. Geological Survey; °, degrees; ’, minutes; ”, seconds; NAD27, North American Datum of 1927; NAD83, North American Datum of 1983; mi2, square miles; ft, feet; ft3/s, cubic feet per second; —, data not available; n/a, not applicable; n/d, not determined; Hurr, hurricane. Yellow shading indicates streamgages for which the September 2018 flood peak was the new peak of record; no shading indicates streamgages that recorded peaks that ranked in the top 5 for the period of record; tan shading indicates stage-only sites that recorded peak stage records. Period of record is given in water years, which is the period October 1–September 30 and is identified by the year in which the period ends. Number of annual peak streamflows in record used for rank comparison includes the preliminary 2018 water year peak associated with the September 2018 flood]
Site index
number (fig. 5)
USGS station number
Station name Latitude LongitudeHorizon-
tal datum
Contribut-ing
drainage area, in mi2
Flood data
National Weather Service
flood stage, in ft
Remarks
Previous maximum
Period of record for
annual peak streamflows
1Flood of September 2018
Date of
peak streamflow
Peak stage, in ft
Peak stream-
flow, in ft3/s
Rank / number of annual peak
streamflows in record
Date of
peak streamflow
Peak stage, in ft
Peak stream-
flow, in ft3/s
Cape Fear River Basin—Continued
22 02094659 SOUTH BUF-FALO CREEK NR POMONA, NC
36°02’58” 79°51’19” NAD83 7.33 9/23/2003 15.45 3,350 1999; 2000-17
4 / 20 9/17/2018 14.64 3,020 11
23 02094770 SOUTH BUFFALO CREEK AT US 220 AT GREENSBORO, NC
36°02’17” 79°47’59” NAD83 15.4 9/23/2003 16.44 2,770 1999; 2000-17
1 / 20 9/17/2018 16.77 3,340 18
24 02094775 RYAN CREEK BELOW US 220 AT GREENSBORO, NC
36°01’52” 79°47’46” NAD83 4.12 7/13/2003 12.53 1,060 1999; 2000-17
1 / 20 9/17/2018 11.78 1,180 8
25 02095000 SOUTH BUFFALO CR NEAR GREENS-BORO, NC
36°03’36” 79°43’33” NAD83 34 7/15/1949 11.54 10,000 1929-37; 1939-58;
1999-2017
3 / 49 9/17/2018 16.40 5,860 17
26 02095181 N BUFFALO CR AT WESTOVER TERRACE AT GREENSBORO, NC
36°04’45” 79°48’46” NAD83 9.55 9/23/2003 14.07 2,520 1999; 2000-17
4 / 20 9/17/2018 12.85 2,160 10
27 02095271 NORTH BUFFALO CREEK AT CHURCH ST AT GREENS-BORO, NC
36°05’52” 79°46’57” NAD83 14.2 9/23/2003 17.81 3,520 1998-2017 2 / 21 9/17/2018 17.73 3,480 14
28 0209553650 BUFFALO CREEK AT SR2819 NR MCLEANSVILLE, NC
36°07’41” 79°39’42” NAD83 88.5 3/20/2003 19.35 6,720 1999; 2000-17
1 / 20 9/17/2018 21.45 9,450 —
29 02096960 HAW RIVER NEAR BYNUM, NC
35°45’55” 79°08’09” NAD83 1,275 9/6/1996 (Hurr Fran)
21.76 76,700 1974-2017 2 / 45 9/17/2018 17.62 51,900 11 Peak stage determined from high-water mark identified at site after event.
30 02097314 NEW HOPE CREEK NEAR BLANDS, NC
35°53’06” 78°57’55” NAD83 75.9 12/30/2015 14.06 15,300 1983-2017 2 / 36 9/17/2018 14.07 15,300 — Following occurrence of peak streamflow from runoff, peak stage reached 17.49 ft, as affected by backwater conditions from B. Everett Jordan Lake.
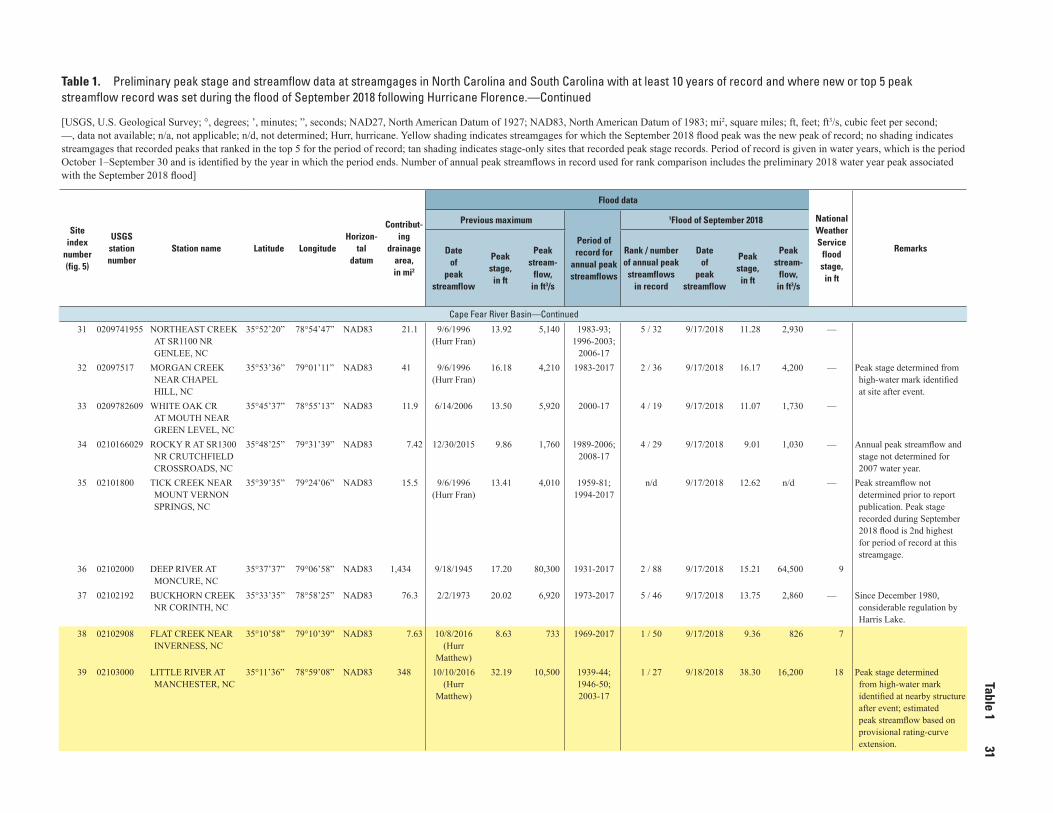
Table 1
31Table 1. Preliminary peak stage and streamflow data at streamgages in North Carolina and South Carolina with at least 10 years of record and where new or top 5 peak streamflow record was set during the flood of September 2018 following Hurricane Florence.—Continued
[USGS, U.S. Geological Survey; °, degrees; ’, minutes; ”, seconds; NAD27, North American Datum of 1927; NAD83, North American Datum of 1983; mi2, square miles; ft, feet; ft3/s, cubic feet per second; —, data not available; n/a, not applicable; n/d, not determined; Hurr, hurricane. Yellow shading indicates streamgages for which the September 2018 flood peak was the new peak of record; no shading indicates streamgages that recorded peaks that ranked in the top 5 for the period of record; tan shading indicates stage-only sites that recorded peak stage records. Period of record is given in water years, which is the period October 1–September 30 and is identified by the year in which the period ends. Number of annual peak streamflows in record used for rank comparison includes the preliminary 2018 water year peak associated with the September 2018 flood]
Site index
number (fig. 5)
USGS station number
Station name Latitude LongitudeHorizon-
tal datum
Contribut-ing
drainage area, in mi2
Flood data
National Weather Service
flood stage, in ft
Remarks
Previous maximum
Period of record for
annual peak streamflows
1Flood of September 2018
Date of
peak streamflow
Peak stage,
in ft
Peak stream-
flow, in ft3/s
Rank / number of annual peak
streamflows in record
Date of
peak streamflow
Peak stage, in ft
Peak stream-
flow, in ft3/s
Cape Fear River Basin—Continued
31 0209741955 NORTHEAST CREEK AT SR1100 NR GENLEE, NC
35°52’20” 78°54’47” NAD83 21.1 9/6/1996 (Hurr Fran)
13.92 5,140 1983-93; 1996-2003;
2006-17
5 / 32 9/17/2018 11.28 2,930 —
32 02097517 MORGAN CREEK NEAR CHAPEL HILL, NC
35°53’36” 79°01’11” NAD83 41 9/6/1996 (Hurr Fran)
16.18 4,210 1983-2017 2 / 36 9/17/2018 16.17 4,200 — Peak stage determined from high-water mark identified at site after event.
33 0209782609 WHITE OAK CR AT MOUTH NEAR GREEN LEVEL, NC
35°45’37” 78°55’13” NAD83 11.9 6/14/2006 13.50 5,920 2000-17 4 / 19 9/17/2018 11.07 1,730 —
34 0210166029 ROCKY R AT SR1300 NR CRUTCHFIELD CROSSROADS, NC
35°48’25” 79°31’39” NAD83 7.42 12/30/2015 9.86 1,760 1989-2006; 2008-17
4 / 29 9/17/2018 9.01 1,030 — Annual peak streamflow and stage not determined for 2007 water year.
35 02101800 TICK CREEK NEAR MOUNT VERNON SPRINGS, NC
35°39’35” 79°24’06” NAD83 15.5 9/6/1996 (Hurr Fran)
13.41 4,010 1959-81; 1994-2017
n/d 9/17/2018 12.62 n/d — Peak streamflow not determined prior to report publication. Peak stage recorded during September 2018 flood is 2nd highest for period of record at this streamgage.
36 02102000 DEEP RIVER AT MONCURE, NC
35°37’37” 79°06’58” NAD83 1,434 9/18/1945 17.20 80,300 1931-2017 2 / 88 9/17/2018 15.21 64,500 9
37 02102192 BUCKHORN CREEK NR CORINTH, NC
35°33’35” 78°58’25” NAD83 76.3 2/2/1973 20.02 6,920 1973-2017 5 / 46 9/17/2018 13.75 2,860 — Since December 1980, considerable regulation by Harris Lake.
38 02102908 FLAT CREEK NEAR INVERNESS, NC
35°10’58” 79°10’39” NAD83 7.63 10/8/2016 (Hurr
Matthew)
8.63 733 1969-2017 1 / 50 9/17/2018 9.36 826 7
39 02103000 LITTLE RIVER AT MANCHESTER, NC
35°11’36” 78°59’08” NAD83 348 10/10/2016 (Hurr
Matthew)
32.19 10,500 1939-44; 1946-50; 2003-17
1 / 27 9/18/2018 38.30 16,200 18 Peak stage determined from high-water mark identified at nearby structure after event; estimated peak streamflow based on provisional rating-curve extension.
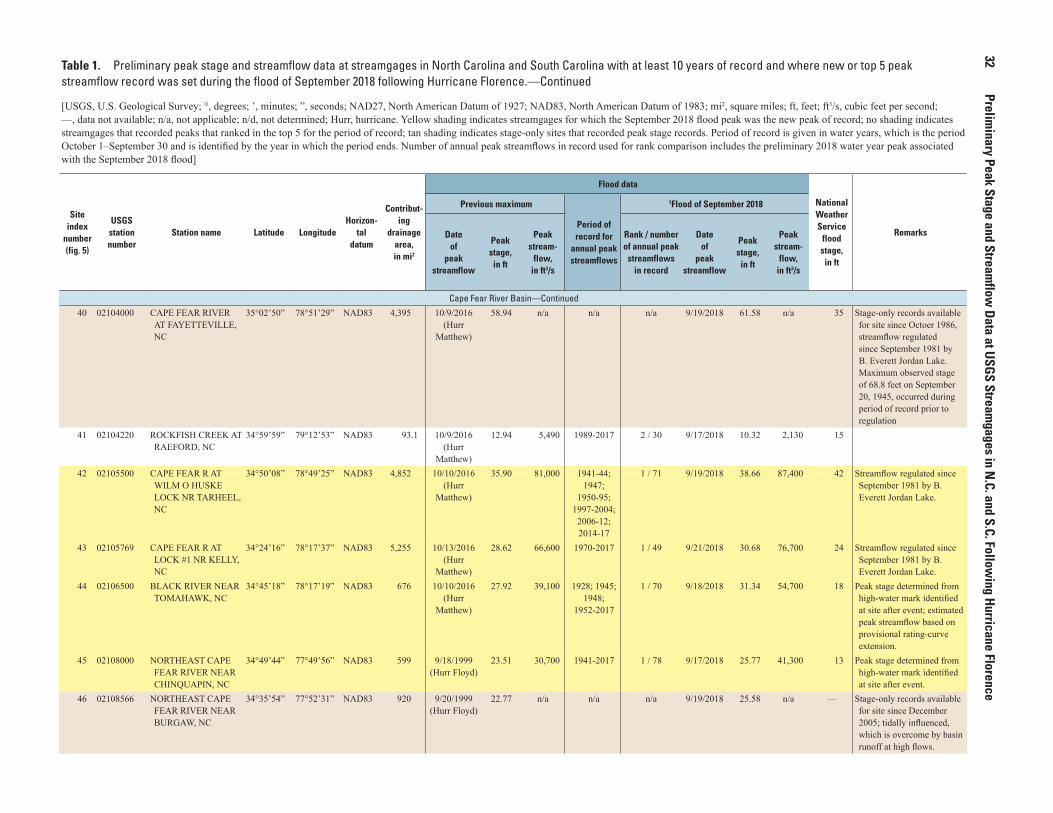
32 Prelim
inary Peak Stage and Streamflow
Data at USGS Streamgages in N
.C. and S.C. Following Hurricane Florence
Table 1. Preliminary peak stage and streamflow data at streamgages in North Carolina and South Carolina with at least 10 years of record and where new or top 5 peak streamflow record was set during the flood of September 2018 following Hurricane Florence.—Continued
[USGS, U.S. Geological Survey; °, degrees; ’, minutes; ”, seconds; NAD27, North American Datum of 1927; NAD83, North American Datum of 1983; mi2, square miles; ft, feet; ft3/s, cubic feet per second; —, data not available; n/a, not applicable; n/d, not determined; Hurr, hurricane. Yellow shading indicates streamgages for which the September 2018 flood peak was the new peak of record; no shading indicates streamgages that recorded peaks that ranked in the top 5 for the period of record; tan shading indicates stage-only sites that recorded peak stage records. Period of record is given in water years, which is the period October 1–September 30 and is identified by the year in which the period ends. Number of annual peak streamflows in record used for rank comparison includes the preliminary 2018 water year peak associated with the September 2018 flood]
Site index
number (fig. 5)
USGS station number
Station name Latitude LongitudeHorizon-
tal datum
Contribut-ing
drainage area, in mi2
Flood data
National Weather Service
flood stage, in ft
Remarks
Previous maximum
Period of record for
annual peak streamflows
1Flood of September 2018
Date of
peak streamflow
Peak stage,
in ft
Peak stream-
flow, in ft3/s
Rank / number of annual peak
streamflows in record
Date of
peak streamflow
Peak stage, in ft
Peak stream-
flow, in ft3/s
Cape Fear River Basin—Continued
40 02104000 CAPE FEAR RIVER AT FAYETTEVILLE, NC
35°02’50” 78°51’29” NAD83 4,395 10/9/2016 (Hurr
Matthew)
58.94 n/a n/a n/a 9/19/2018 61.58 n/a 35 Stage-only records available for site since Octoer 1986, streamflow regulated since September 1981 by B. Everett Jordan Lake. Maximum observed stage of 68.8 feet on September 20, 1945, occurred during period of record prior to regulation
41 02104220 ROCKFISH CREEK AT RAEFORD, NC
34°59’59” 79°12’53” NAD83 93.1 10/9/2016 (Hurr
Matthew)
12.94 5,490 1989-2017 2 / 30 9/17/2018 10.32 2,130 15
42 02105500 CAPE FEAR R AT WILM O HUSKE LOCK NR TARHEEL, NC
34°50’08” 78°49’25” NAD83 4,852 10/10/2016 (Hurr
Matthew)
35.90 81,000 1941-44; 1947;
1950-95; 1997-2004; 2006-12; 2014-17
1 / 71 9/19/2018 38.66 87,400 42 Streamflow regulated since September 1981 by B. Everett Jordan Lake.
43 02105769 CAPE FEAR R AT LOCK #1 NR KELLY, NC
34°24’16” 78°17’37” NAD83 5,255 10/13/2016 (Hurr
Matthew)
28.62 66,600 1970-2017 1 / 49 9/21/2018 30.68 76,700 24 Streamflow regulated since September 1981 by B. Everett Jordan Lake.
44 02106500 BLACK RIVER NEAR TOMAHAWK, NC
34°45’18” 78°17’19” NAD83 676 10/10/2016 (Hurr
Matthew)
27.92 39,100 1928; 1945; 1948;
1952-2017
1 / 70 9/18/2018 31.34 54,700 18 Peak stage determined from high-water mark identified at site after event; estimated peak streamflow based on provisional rating-curve extension.
45 02108000 NORTHEAST CAPE FEAR RIVER NEAR CHINQUAPIN, NC
34°49’44” 77°49’56” NAD83 599 9/18/1999 (Hurr Floyd)
23.51 30,700 1941-2017 1 / 78 9/17/2018 25.77 41,300 13 Peak stage determined from high-water mark identified at site after event.
46 02108566 NORTHEAST CAPE FEAR RIVER NEAR BURGAW, NC
34°35’54” 77°52’31” NAD83 920 9/20/1999 (Hurr Floyd)
22.77 n/a n/a n/a 9/19/2018 25.58 n/a — Stage-only records available for site since December 2005; tidally influenced, which is overcome by basin runoff at high flows.
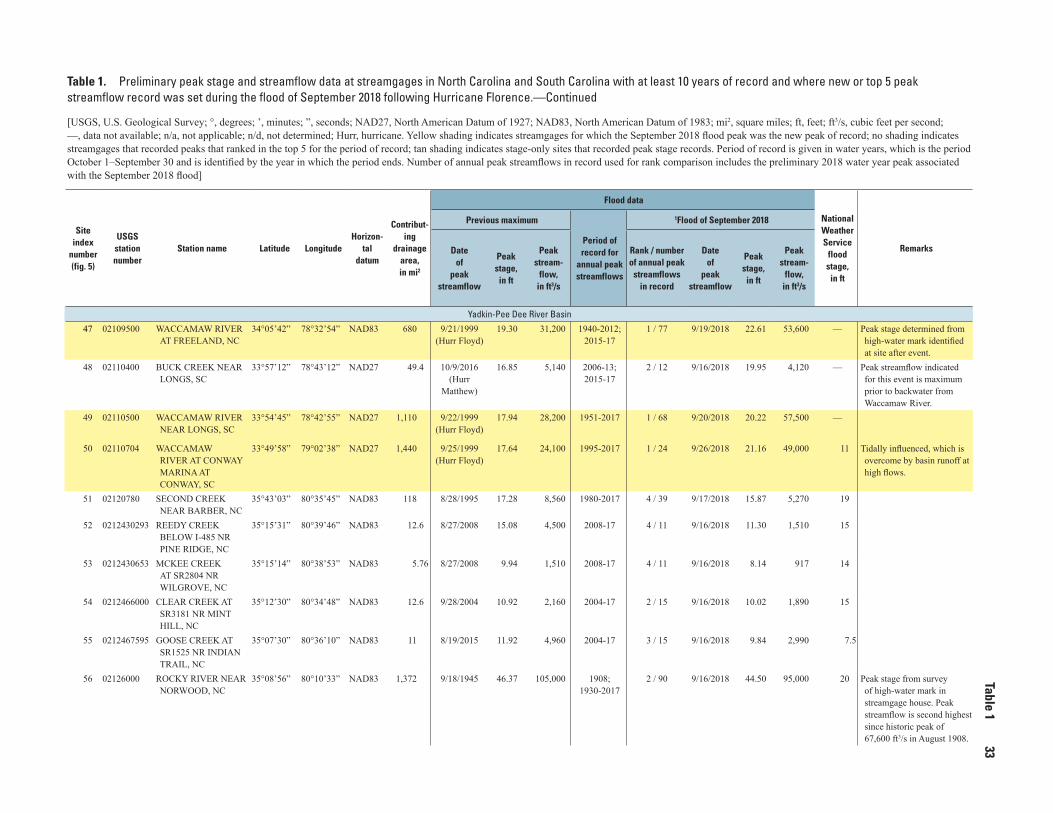
Table 1
33Table 1. Preliminary peak stage and streamflow data at streamgages in North Carolina and South Carolina with at least 10 years of record and where new or top 5 peak streamflow record was set during the flood of September 2018 following Hurricane Florence.—Continued
[USGS, U.S. Geological Survey; °, degrees; ’, minutes; ”, seconds; NAD27, North American Datum of 1927; NAD83, North American Datum of 1983; mi2, square miles; ft, feet; ft3/s, cubic feet per second; —, data not available; n/a, not applicable; n/d, not determined; Hurr, hurricane. Yellow shading indicates streamgages for which the September 2018 flood peak was the new peak of record; no shading indicates streamgages that recorded peaks that ranked in the top 5 for the period of record; tan shading indicates stage-only sites that recorded peak stage records. Period of record is given in water years, which is the period October 1–September 30 and is identified by the year in which the period ends. Number of annual peak streamflows in record used for rank comparison includes the preliminary 2018 water year peak associated with the September 2018 flood]
Site index
number (fig. 5)
USGS station number
Station name Latitude LongitudeHorizon-
tal datum
Contribut-ing
drainage area, in mi2
Flood data
National Weather Service
flood stage, in ft
Remarks
Previous maximum
Period of record for
annual peak streamflows
1Flood of September 2018
Date of
peak streamflow
Peak stage, in ft
Peak stream-
flow, in ft3/s
Rank / number of annual peak
streamflows in record
Date of
peak streamflow
Peak stage, in ft
Peak stream-
flow, in ft3/s
Yadkin-Pee Dee River Basin
47 02109500 WACCAMAW RIVER AT FREELAND, NC
34°05’42” 78°32’54” NAD83 680 9/21/1999 (Hurr Floyd)
19.30 31,200 1940-2012; 2015-17
1 / 77 9/19/2018 22.61 53,600 — Peak stage determined from high-water mark identified at site after event.
48 02110400 BUCK CREEK NEAR LONGS, SC
33°57’12” 78°43’12” NAD27 49.4 10/9/2016 (Hurr
Matthew)
16.85 5,140 2006-13; 2015-17
2 / 12 9/16/2018 19.95 4,120 — Peak streamflow indicated for this event is maximum prior to backwater from Waccamaw River.
49 02110500 WACCAMAW RIVER NEAR LONGS, SC
33°54’45” 78°42’55” NAD27 1,110 9/22/1999 (Hurr Floyd)
17.94 28,200 1951-2017 1 / 68 9/20/2018 20.22 57,500 —
50 02110704 WACCAMAW RIVER AT CONWAY MARINA AT CONWAY, SC
33°49’58” 79°02’38” NAD27 1,440 9/25/1999 (Hurr Floyd)
17.64 24,100 1995-2017 1 / 24 9/26/2018 21.16 49,000 11 Tidally influenced, which is overcome by basin runoff at high flows.
51 02120780 SECOND CREEK NEAR BARBER, NC
35°43’03” 80°35’45” NAD83 118 8/28/1995 17.28 8,560 1980-2017 4 / 39 9/17/2018 15.87 5,270 19
52 0212430293 REEDY CREEK BELOW I-485 NR PINE RIDGE, NC
35°15’31” 80°39’46” NAD83 12.6 8/27/2008 15.08 4,500 2008-17 4 / 11 9/16/2018 11.30 1,510 15
53 0212430653 MCKEE CREEK AT SR2804 NR WILGROVE, NC
35°15’14” 80°38’53” NAD83 5.76 8/27/2008 9.94 1,510 2008-17 4 / 11 9/16/2018 8.14 917 14
54 0212466000 CLEAR CREEK AT SR3181 NR MINT HILL, NC
35°12’30” 80°34’48” NAD83 12.6 9/28/2004 10.92 2,160 2004-17 2 / 15 9/16/2018 10.02 1,890 15
55 0212467595 GOOSE CREEK AT SR1525 NR INDIAN TRAIL, NC
35°07’30” 80°36’10” NAD83 11 8/19/2015 11.92 4,960 2004-17 3 / 15 9/16/2018 9.84 2,990 7.5
56 02126000 ROCKY RIVER NEAR NORWOOD, NC
35°08’56” 80°10’33” NAD83 1,372 9/18/1945 46.37 105,000 1908; 1930-2017
2 / 90 9/16/2018 44.50 95,000 20 Peak stage from survey of high-water mark in streamgage house. Peak streamflow is second highest since historic peak of 67,600 ft3/s in August 1908.
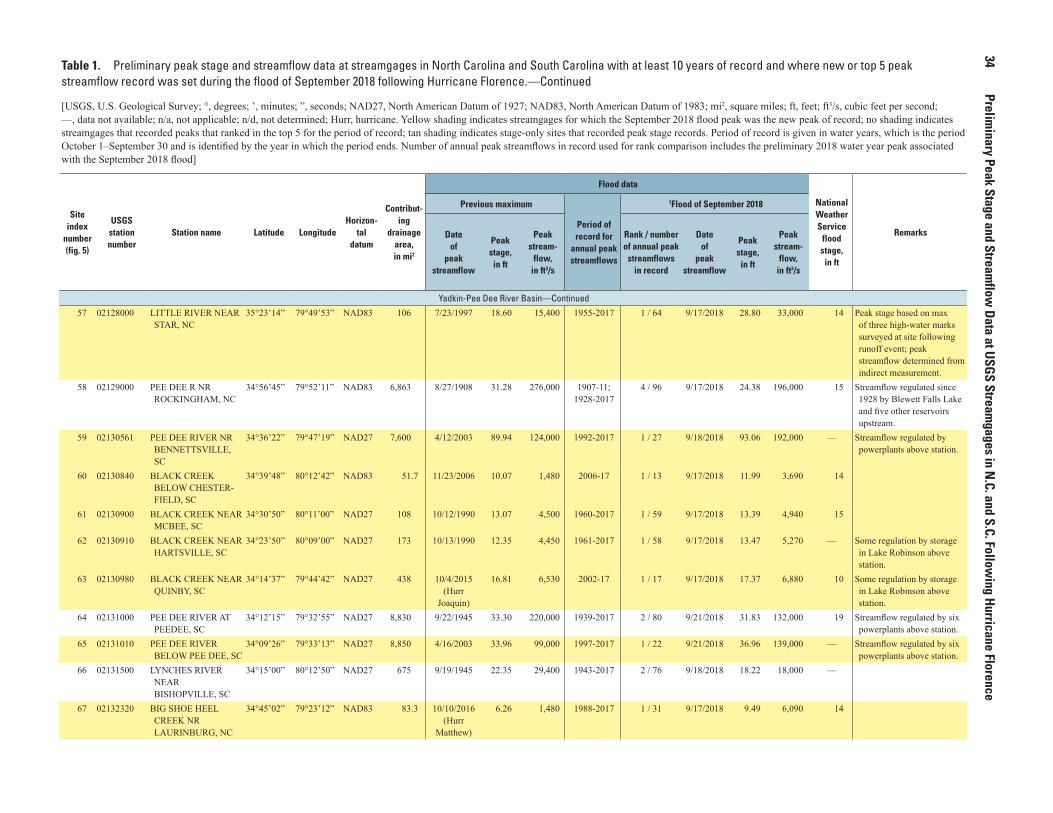
34
Preliminary Peak Stage and Stream
flow Data at USGS Stream
gages in N.C. and S.C. Follow
ing Hurricane FlorenceTable 1. Preliminary peak stage and streamflow data at streamgages in North Carolina and South Carolina with at least 10 years of record and where new or top 5 peak streamflow record was set during the flood of September 2018 following Hurricane Florence.—Continued
[USGS, U.S. Geological Survey; °, degrees; ’, minutes; ”, seconds; NAD27, North American Datum of 1927; NAD83, North American Datum of 1983; mi2, square miles; ft, feet; ft3/s, cubic feet per second; —, data not available; n/a, not applicable; n/d, not determined; Hurr, hurricane. Yellow shading indicates streamgages for which the September 2018 flood peak was the new peak of record; no shading indicates streamgages that recorded peaks that ranked in the top 5 for the period of record; tan shading indicates stage-only sites that recorded peak stage records. Period of record is given in water years, which is the period October 1–September 30 and is identified by the year in which the period ends. Number of annual peak streamflows in record used for rank comparison includes the preliminary 2018 water year peak associated with the September 2018 flood]
Site index
number (fig. 5)
USGS station number
Station name Latitude LongitudeHorizon-
tal datum
Contribut-ing
drainage area, in mi2
Flood data
National Weather Service
flood stage, in ft
Remarks
Previous maximum
Period of record for
annual peak streamflows
1Flood of September 2018
Date of
peak streamflow
Peak stage,
in ft
Peak stream-
flow, in ft3/s
Rank / number of annual peak
streamflows in record
Date of
peak streamflow
Peak stage, in ft
Peak stream-
flow, in ft3/s
Yadkin-Pee Dee River Basin—Continued
57 02128000 LITTLE RIVER NEAR STAR, NC
35°23’14” 79°49’53” NAD83 106 7/23/1997 18.60 15,400 1955-2017 1 / 64 9/17/2018 28.80 33,000 14 Peak stage based on max of three high-water marks surveyed at site following runoff event; peak streamflow determined from indirect measurement.
58 02129000 PEE DEE R NR ROCKINGHAM, NC
34°56’45” 79°52’11” NAD83 6,863 8/27/1908 31.28 276,000 1907-11; 1928-2017
4 / 96 9/17/2018 24.38 196,000 15 Streamflow regulated since 1928 by Blewett Falls Lake and five other reservoirs upstream.
59 02130561 PEE DEE RIVER NR BENNETTSVILLE, SC
34°36’22” 79°47’19” NAD27 7,600 4/12/2003 89.94 124,000 1992-2017 1 / 27 9/18/2018 93.06 192,000 — Streamflow regulated by powerplants above station.
60 02130840 BLACK CREEK BELOW CHESTER-FIELD, SC
34°39’48” 80°12’42” NAD83 51.7 11/23/2006 10.07 1,480 2006-17 1 / 13 9/17/2018 11.99 3,690 14
61 02130900 BLACK CREEK NEAR MCBEE, SC
34°30’50” 80°11’00” NAD27 108 10/12/1990 13.07 4,500 1960-2017 1 / 59 9/17/2018 13.39 4,940 15
62 02130910 BLACK CREEK NEAR HARTSVILLE, SC
34°23’50” 80°09’00” NAD27 173 10/13/1990 12.35 4,450 1961-2017 1 / 58 9/17/2018 13.47 5,270 — Some regulation by storage in Lake Robinson above station.
63 02130980 BLACK CREEK NEAR QUINBY, SC
34°14’37” 79°44’42” NAD27 438 10/4/2015 (Hurr
Joaquin)
16.81 6,530 2002-17 1 / 17 9/17/2018 17.37 6,880 10 Some regulation by storage in Lake Robinson above station.
64 02131000 PEE DEE RIVER AT PEEDEE, SC
34°12’15” 79°32’55” NAD27 8,830 9/22/1945 33.30 220,000 1939-2017 2 / 80 9/21/2018 31.83 132,000 19 Streamflow regulated by six powerplants above station.
65 02131010 PEE DEE RIVER BELOW PEE DEE, SC
34°09’26” 79°33’13” NAD27 8,850 4/16/2003 33.96 99,000 1997-2017 1 / 22 9/21/2018 36.96 139,000 — Streamflow regulated by six powerplants above station.
66 02131500 LYNCHES RIVER NEAR BISHOPVILLE, SC
34°15’00” 80°12’50” NAD27 675 9/19/1945 22.35 29,400 1943-2017 2 / 76 9/18/2018 18.22 18,000 —
67 02132320 BIG SHOE HEEL CREEK NR LAURINBURG, NC
34°45’02” 79°23’12” NAD83 83.3 10/10/2016 (Hurr
Matthew)
6.26 1,480 1988-2017 1 / 31 9/17/2018 9.49 6,090 14
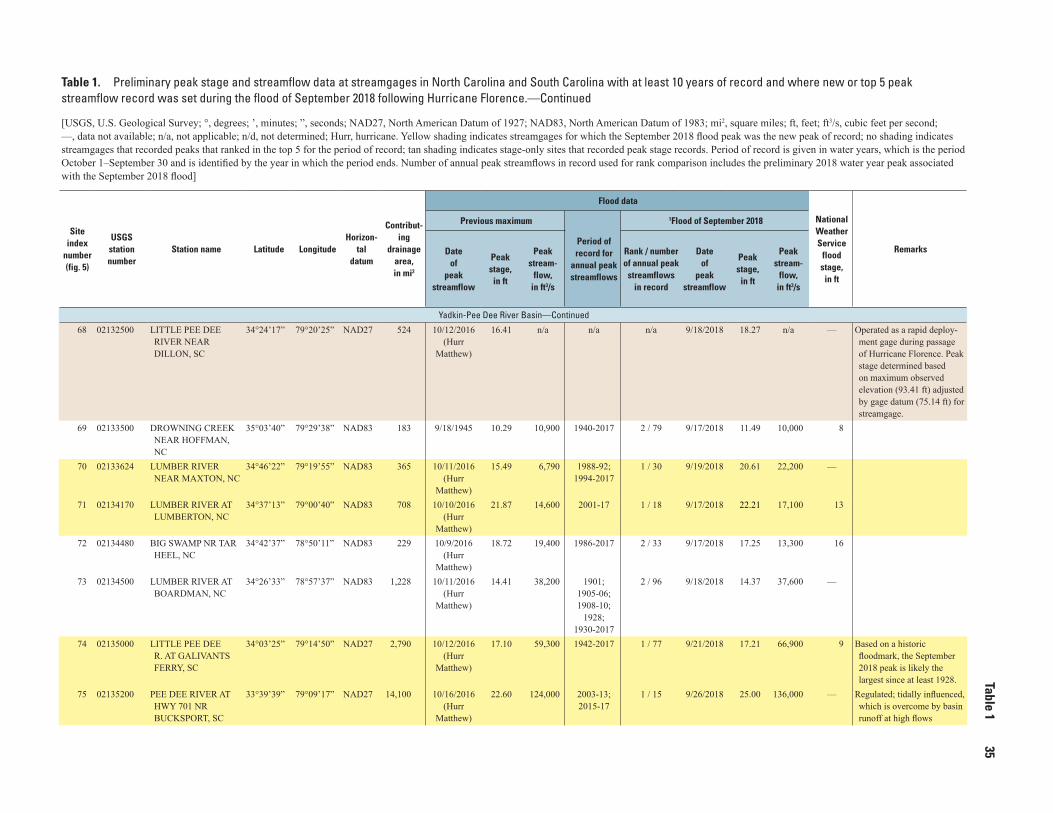
Table 1
35Table 1. Preliminary peak stage and streamflow data at streamgages in North Carolina and South Carolina with at least 10 years of record and where new or top 5 peak streamflow record was set during the flood of September 2018 following Hurricane Florence.—Continued
[USGS, U.S. Geological Survey; °, degrees; ’, minutes; ”, seconds; NAD27, North American Datum of 1927; NAD83, North American Datum of 1983; mi2, square miles; ft, feet; ft3/s, cubic feet per second; —, data not available; n/a, not applicable; n/d, not determined; Hurr, hurricane. Yellow shading indicates streamgages for which the September 2018 flood peak was the new peak of record; no shading indicates streamgages that recorded peaks that ranked in the top 5 for the period of record; tan shading indicates stage-only sites that recorded peak stage records. Period of record is given in water years, which is the period October 1–September 30 and is identified by the year in which the period ends. Number of annual peak streamflows in record used for rank comparison includes the preliminary 2018 water year peak associated with the September 2018 flood]
Site index
number (fig. 5)
USGS station number
Station name Latitude LongitudeHorizon-
tal datum
Contribut-ing
drainage area, in mi2
Flood data
National Weather Service
flood stage, in ft
Remarks
Previous maximum
Period of record for
annual peak streamflows
1Flood of September 2018
Date of
peak streamflow
Peak stage,
in ft
Peak stream-
flow, in ft3/s
Rank / number of annual peak
streamflows in record
Date of
peak streamflow
Peak stage, in ft
Peak stream-
flow, in ft3/s
Yadkin-Pee Dee River Basin—Continued
68 02132500 LITTLE PEE DEE RIVER NEAR DILLON, SC
34°24’17” 79°20’25” NAD27 524 10/12/2016 (Hurr
Matthew)
16.41 n/a n/a n/a 9/18/2018 18.27 n/a — Operated as a rapid deploy-ment gage during passage of Hurricane Florence. Peak stage determined based on maximum observed elevation (93.41 ft) adjusted by gage datum (75.14 ft) for streamgage.
69 02133500 DROWNING CREEK NEAR HOFFMAN, NC
35°03’40” 79°29’38” NAD83 183 9/18/1945 10.29 10,900 1940-2017 2 / 79 9/17/2018 11.49 10,000 8
70 02133624 LUMBER RIVER NEAR MAXTON, NC
34°46’22” 79°19’55” NAD83 365 10/11/2016 (Hurr
Matthew)
15.49 6,790 1988-92; 1994-2017
1 / 30 9/19/2018 20.61 22,200 —
71 02134170 LUMBER RIVER AT LUMBERTON, NC
34°37’13” 79°00’40” NAD83 708 10/10/2016 (Hurr
Matthew)
21.87 14,600 2001-17 1 / 18 9/17/2018 22.21 17,100 13
72 02134480 BIG SWAMP NR TAR HEEL, NC
34°42’37” 78°50’11” NAD83 229 10/9/2016 (Hurr
Matthew)
18.72 19,400 1986-2017 2 / 33 9/17/2018 17.25 13,300 16
73 02134500 LUMBER RIVER AT BOARDMAN, NC
34°26’33” 78°57’37” NAD83 1,228 10/11/2016 (Hurr
Matthew)
14.41 38,200 1901; 1905-06; 1908-10;
1928; 1930-2017
2 / 96 9/18/2018 14.37 37,600 —
74 02135000 LITTLE PEE DEE R. AT GALIVANTS FERRY, SC
34°03’25” 79°14’50” NAD27 2,790 10/12/2016 (Hurr
Matthew)
17.10 59,300 1942-2017 1 / 77 9/21/2018 17.21 66,900 9 Based on a historic floodmark, the September 2018 peak is likely the largest since at least 1928.
75 02135200 PEE DEE RIVER AT HWY 701 NR BUCKSPORT, SC
33°39’39” 79°09’17” NAD27 14,100 10/16/2016 (Hurr
Matthew)
22.60 124,000 2003-13; 2015-17
1 / 15 9/26/2018 25.00 136,000 — Regulated; tidally influenced, which is overcome by basin runoff at high flows
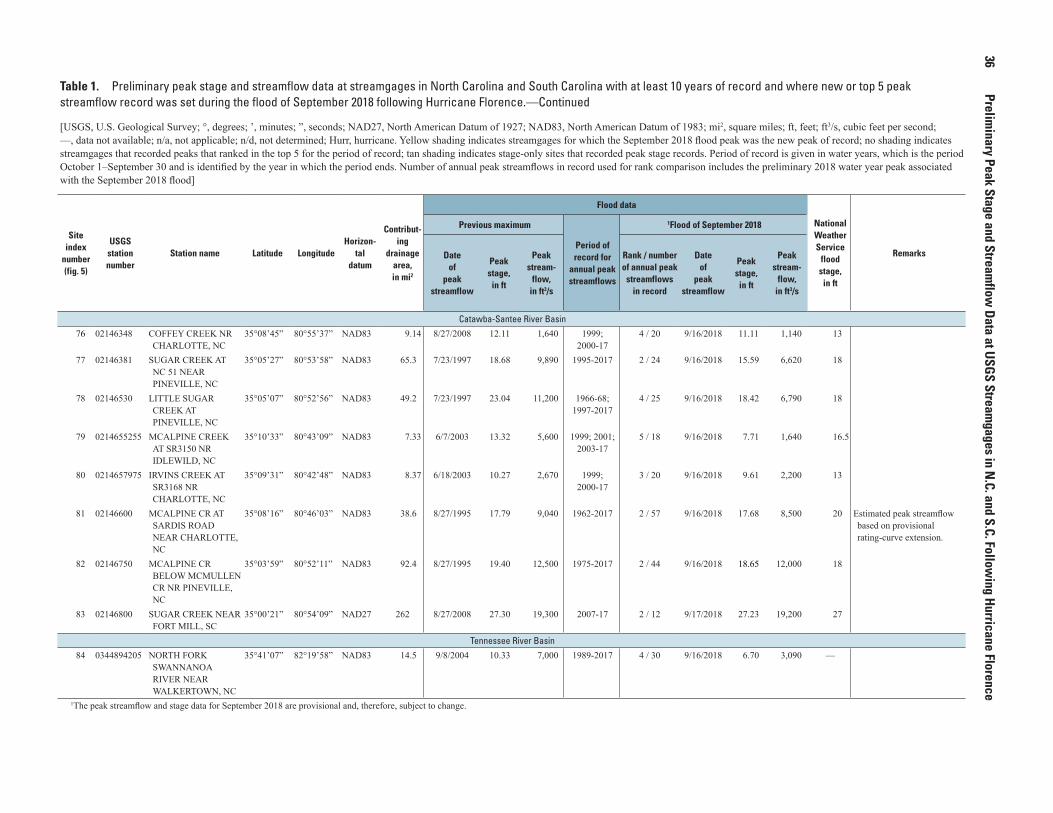
36
Preliminary Peak Stage and Stream
flow Data at USGS Stream
gages in N.C. and S.C. Follow
ing Hurricane Florence
Table 1. Preliminary peak stage and streamflow data at streamgages in North Carolina and South Carolina with at least 10 years of record and where new or top 5 peak streamflow record was set during the flood of September 2018 following Hurricane Florence.—Continued
[USGS, U.S. Geological Survey; °, degrees; ’, minutes; ”, seconds; NAD27, North American Datum of 1927; NAD83, North American Datum of 1983; mi2, square miles; ft, feet; ft3/s, cubic feet per second; —, data not available; n/a, not applicable; n/d, not determined; Hurr, hurricane. Yellow shading indicates streamgages for which the September 2018 flood peak was the new peak of record; no shading indicates streamgages that recorded peaks that ranked in the top 5 for the period of record; tan shading indicates stage-only sites that recorded peak stage records. Period of record is given in water years, which is the period October 1–September 30 and is identified by the year in which the period ends. Number of annual peak streamflows in record used for rank comparison includes the preliminary 2018 water year peak associated with the September 2018 flood]
Site index
number (fig. 5)
USGS station number
Station name Latitude LongitudeHorizon-
tal datum
Contribut-ing
drainage area, in mi2
Flood data
National Weather Service
flood stage, in ft
Remarks
Previous maximum
Period of record for
annual peak streamflows
1Flood of September 2018
Date of
peak streamflow
Peak stage,
in ft
Peak stream-
flow, in ft3/s
Rank / number of annual peak
streamflows in record
Date of
peak streamflow
Peak stage, in ft
Peak stream-
flow, in ft3/s
Catawba-Santee River Basin
76 02146348 COFFEY CREEK NR CHARLOTTE, NC
35°08’45” 80°55’37” NAD83 9.14 8/27/2008 12.11 1,640 1999; 2000-17
4 / 20 9/16/2018 11.11 1,140 13
77 02146381 SUGAR CREEK AT NC 51 NEAR PINEVILLE, NC
35°05’27” 80°53’58” NAD83 65.3 7/23/1997 18.68 9,890 1995-2017 2 / 24 9/16/2018 15.59 6,620 18
78 02146530 LITTLE SUGAR CREEK AT PINEVILLE, NC
35°05’07” 80°52’56” NAD83 49.2 7/23/1997 23.04 11,200 1966-68; 1997-2017
4 / 25 9/16/2018 18.42 6,790 18
79 0214655255 MCALPINE CREEK AT SR3150 NR IDLEWILD, NC
35°10’33” 80°43’09” NAD83 7.33 6/7/2003 13.32 5,600 1999; 2001; 2003-17
5 / 18 9/16/2018 7.71 1,640 16.5
80 0214657975 IRVINS CREEK AT SR3168 NR CHARLOTTE, NC
35°09’31” 80°42’48” NAD83 8.37 6/18/2003 10.27 2,670 1999; 2000-17
3 / 20 9/16/2018 9.61 2,200 13
81 02146600 MCALPINE CR AT SARDIS ROAD NEAR CHARLOTTE, NC
35°08’16” 80°46’03” NAD83 38.6 8/27/1995 17.79 9,040 1962-2017 2 / 57 9/16/2018 17.68 8,500 20 Estimated peak streamflow based on provisional rating-curve extension.
82 02146750 MCALPINE CR BELOW MCMULLEN CR NR PINEVILLE, NC
35°03’59” 80°52’11” NAD83 92.4 8/27/1995 19.40 12,500 1975-2017 2 / 44 9/16/2018 18.65 12,000 18
83 02146800 SUGAR CREEK NEAR FORT MILL, SC
35°00’21” 80°54’09” NAD27 262 8/27/2008 27.30 19,300 2007-17 2 / 12 9/17/2018 27.23 19,200 27
Tennessee River Basin
84 0344894205 NORTH FORK SWANNANOA RIVER NEAR WALKERTOWN, NC
35°41’07” 82°19’58” NAD83 14.5 9/8/2004 10.33 7,000 1989-2017 4 / 30 9/16/2018 6.70 3,090 —
1The peak streamflow and stage data for September 2018 are provisional and, therefore, subject to change.
Manuscript was approved on October 23, 2018
For more information about this publication, contact Director South Atlantic Water Science Center U.S. Geological Survey 720 Gracern Road Columbia, SC 29210 (803) 750–6100
For additional information visit https://www.usgs.gov/centers/sa-water
Prepared by the USGS Science Publishing Network, Reston Publishing Service Center
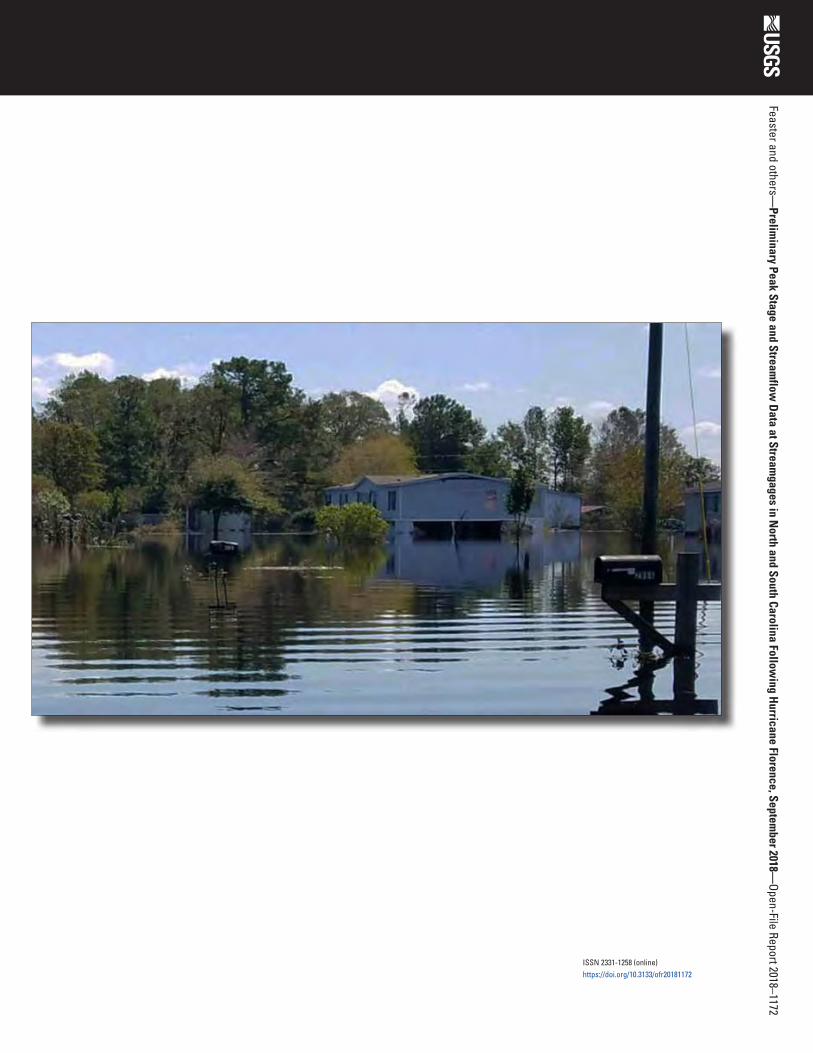
Feaster and others—Prelim
inary Peak Stage and Streamflow
Data at Stream
gages in North and South Carolina Follow
ing Hurricane Florence, Septem
ber 2018—Open-File Report 2018–1172
ISSN 2331-1258 (online)https://doi.org/10.3133/ofr20181172