Embed Size (px)
Citation preview
Marketplace Realities& Risk Management Solutions
Strategies for aMarket in Transition
April 2006 Edition
As we go to press, Property market capacity and pricing are dominant headline issues, affecting clientswith assets and operations in areas exposed to the natural catastrophe (Nat Cat) perils of Wind, Floodand Earthquake and to the peril of Terrorism. Terms and conditions offered by insurers and reinsurershave deteriorated rapidly and precipitously, raising the bar for program design and marketingstrategies for programs renewing in the near term, while prompting thoroughgoing studies of long-term business plans and risk-funding arrangements.
In November 2005, we published the first edition of Marketplace Realities & Risk ManagementSolutions 2006 – “Strategies for a Market in Transition.” In this April 2006 edition, transition continuesto be a generally applicable term. As noted above, however, events in the Nat Cat segment of theProperty marketplace are nothing less than tumultuous, as the underwriting community struggles tofind equilibrium. The 2006 Atlantic Hurricane Season is fast approaching. Nat Cat models are beingretooled to reflect new data and revised, more forward-looking assumptions. And there is awidespread feeling that the recent two-year spike in frequency and severity of windstorm events maywell be repeated in years to come. Accordingly, our Property Marketplace article is devoted to anexamination of the mechanics of Nat Cat risk exposure analysis, underwriting regimens, programdesign and marketing strategies.
Marketplace SegmentsEach of our contributing authors follows essentially the same comprehensive approach – what youneed to know about your own risk; what you need to know about current and anticipated marketplaceconditions; and how you can build positive differentiation through risk management, program designand strategic marketing.• Property• Aviation• Casualty• Cyber Risk• Environmental• Executive Risks• Healthcare Professional• Private Client Group• Surety• Workers’ Compensation
Marketplace DynamicsThis edition also includes a proverbial “30-thousand-foot view” of the marketplace. Aggregation Riskreprises major excerpts from our webcast of March 30.We examine the dimensions of such risk, the threatit poses to the balance sheet, the future performance of the commercial insurance marketplace, andstrategies that companies can undertake today to address volatility and shape the future. Macro Markets,Micro Markets and Liquidity treats the evolving structure and role of the commercial insurance marketplace.• Aggregation Risk and What You Can Do About It• Macro Markets, Micro Markets and Liquidity
What’s Inside
April 2006
Marketplace Realities 2006& R i s k M a n a g e m e n t S o l u t i o n s
Editorial Staff:Margie ComerJonathan FriedGordon Prager
Copyright © 2006 Willis NorthAmerica, Inc. All rights reserved.
Marketplace Realities
MR 2006: Property 1 • 04/06
PropertyApril 2006
Exposures, Termsand Conditions
2006& R i s k M a n a g e m e n t S o l u t i o n s
The following article is an update and continuation of the Property market white paper published in lastNovember’s electronic edition of Marketplace Realities 2006. It is written in the first person, reflectingthe author’s vast career experience and refreshingly direct style of expression.
As someone with over 30 years in the insurance business, I should be immune by now to the wild swingswe sometimes see in Property terms and conditions following catastrophes. But I am not. Perhaps it isour almost instantaneous ability to register bad news across the world’s re/insurance markets (and toreport bad results to shareholders and financial markets). Perhaps it is increasing pressure from ratingagencies – viewed by many as the real “market regulators” – to weigh cat portfolio exposures againstcapital available to pay claims. Perhaps it is the apprehension felt by both insurers and rating agenciesthat the modeling on which they based their previous assumptions regarding loss expectancy appears inso many cases to have been flawed. No matter what the reason, the changes that have taken place sincethe beginning of 2006 are astonishing both in their speed and their intensity. Contrary to popular belief,these changes are not reserved for Wind alone, but are spilling over into Earthquake and Flood (andTerrorism), perils now viewed as equally challenging in terms of reliable and consistent assessment ofexposures, frequency, severity and volatility.
The following are noteworthy examples of changing terms and conditions and revamped underwritingappraisals of exposures and risk factors:• US Earthquake, Flood and Wind exposures are being shed on a broad scale through non-renewals,
reductions in renewal lines or declinations of new business, sometimes even within an insurer’s“sweet spot,” simply to reduce risk accumulations.
• Borrowed from reinsurance contracts, Wind aggregates are being introduced, with some insurersquoting one-time reinstatements, often at close to the original program price. Please remember thatany sub-limits or aggregates apply across-the-board to all the coverage afforded by the policy – e.g.,Miscellaneous Unscheduled Locations, Service Interruption, Contingent Time Element – not just todamage at your locations.
• Percentage deductibles applicable to Wind – and with some underwriters, Flood resulting from Windevents – are being forced upward. For many, the days of the two percent deductible are gone,replaced by three to five percent deductibles, depending on individual circumstances. Dollar caps onthese are disappearing.
• Contingent coverage is perhaps the most scrutinized. Many more contingent losses arose this yearthan had ever been reported before. Policyholders whose facilities were far removed from the GulfCoast are still registering variability in pricing for raw materials.
• Some underwriters are excluding Flood for any areas protected by dams, dikes and similar floodbarriers. An overreaction to New Orleans? Consider:– California, particularly Sacramento, is viewed by the American Association for the Advancement
of Science as possibly “the next New Orleans.”– In mid-March, a 40-foot dam burst on the island of Kauai following torrential rains.– The American Society of Civil Engineers estimates that 3,500 of the nation’s 80,000 dams are unsafe.– Parts of Japan are below sea level and may be vulnerable
to floods caused by wind or earthquake.– China has a significant system of dams – can these be
any less vulnerable than our own?
MR 2006: Property 2 • 04/06
In terms of susceptibility to dramatically changed Property market conditions for assets and operationsexposed to cat risk potential, client programs can be seen as falling into one of three basic categories,each of which has subgroups that are important to acknowledge as you head toward your renewal.
Material losses and exposures – Clients who sustained material natural catastrophe losses over2004 and 2005 are the most affected. Pricing has skyrocketed, often by much more than 100 percent,and expiring limits are not available at any price. Other than the energy segment (dealt with separatelyin Willis’ Energy Market Review) many of these clients seem to fall into the following broad segments:• Healthcare• Hospitality and Gaming• Real Estate• Retail
Why? These segments are everywhere their customers are or want to go – places with sunshine, warmweather and ocean views are most prone to natural catastrophes. This is no one’s fault; it is a fact of life.Companies with such exposures accept it. Insurers have historically dealt with it. Recent history has notbeen kind to either party.
Minimal losses but material exposures – Clients who have had minimal to no catastrophe lossesin the last two years, but who have Nat Cat exposures of more than, say, 25 percent of total insuredvalues in any single high-hazard zone, may be viewed by underwriters as “challenged.” Favorable lossexperience will be appealing, but adding anything to a portfolio that is otherwise in the process of beingreduced will dampen underwriting enthusiasm. From the insurer’s perspective: how do you explain to along-term client that you cannot renew or must reduce your participation because of cat concerns whileat the same time adding cat for a new client? How do you explain to your management that you areadding new cat when their instruction has been to do the contrary? Clients in this category areexperiencing rate increases of 50 to 100 percent and still finding themselves without the level of catprotection they enjoyed last year.
For both of the above, understand that if you have locations in Florida, your insurer is likely facing anassessment of about seven percent for 2004 and ten percent for 2005 for deficits sustained by CitizensProperty Insurance Company, the Property insurer of last resort in that state. This rising cost of doingbusiness, alongside current or projected reinsurance cost increases, must be passed along.
No cat losses and minimal cat exposures – For clients who have neither cat losses nor material catexposures (and otherwise good loss experience), the world should be your oyster. Having said that, theremay be a drive to extract some rate increases in the neighborhood of five to ten percent – simply tosatisfy the theory of insurance, i.e., the many pay for the losses of the (theoretically) few.
Marketplace Realities 2006& R i s k M a n a g e m e n t S o l u t i o n s
Is Everyone AffectedEqually By TheseChanges?
Doing nothing is simply not in our collective vocabularies. Let’s look at the facts:• Many re/insurers cannot afford to or will no longer take on the Nat Cat risks they had previously and
(a) remain financially solvent and (b) remain acceptably rated. We should all be in synch inunderstanding this position.
• Cat models are now viewed with a jaundiced eye. It is generally accepted that these models cannotadequately deal with the Time Element portions of a potential claim, even at a client’s own locations.Assessment of the extent of physical damage that could occur obscures the efficacy of disasterrecovery or business continuity plans a client may have in place. An example: a facility could sustain40 percent physical damage, but shifting operations to another facility could make up entirely or inpart what is lost. You should be able to explain this, as well as outline the costs of shifting operations.For the underwriter or for you? Both. To the extent you may be self-insuring more risk this year, youneed to know what and how big that risk is.
• Having been presented with numbers of claims that have far exceeded the values reported,underwriters are increasing their focus on the accuracy of values and imposing location limits ofliability where accuracy is questionable. Be prepared to discuss the process you use to develop valuesand, where necessary, engage professional appraisers and forensic accountants. In the worst case,where you cannot avoid location limits, you need to ensure you are not the unpleasantly surprisedparty after a loss.
• At the risk of sounding like a broken record, do you know where your suppliers and customers are?A number of companies received force majeure notices from these parties after the 2005 hurricanesand such notices generated losses. Are these risks you are aware of and accept, or are theyunexpected – and perhaps avoidable? To drive inefficiency from day-to-day operations we sometimesintroduce vulnerabilities not entirely understood – until a loss occurs. If re/insurers are concernedabout these, and likely to reduce protection for them, shouldn’t you be concerned as well? More thanever, risk management has to elicit the input of supply chain management to at least identify, andthen perhaps reduce, these exposures.
• A significant part of some clients’ claims is the extended loss of heat, light, power andtelecommunications (Off-Premises Power, Service Interruption). Re/insurers had already imposedlimitations on this coverage – using sub-limits, time limits and distance limits – and these cannot beexpected to go away. What plans did/do you have for such eventualities?
• I have heard stories of disappointing end results after initially encouraging face-to-face meetings betweenre/insurers and their long-time customers. In many of these meetings, the former do not address the factsof underwriting life as they relate to their customers and the latter do not come prepared to adequatelyalleviate obvious underlying concerns. Not a formula for success. These “meet and greet” sessions mustbe replaced by meaningful dialogue. Homework, homework, homework. Clients should not walk awayfrom such meetings without a clear understanding of what is going to drive underwriting decisionsand without giving a firm commitment to answer outstanding questions promptly.
In closing, I would like to reiterate one immutable golden rule from previous Marketplace Realitiescomments: “Risk management comes before risk transfer.”
Suzanne DouglassNorth America Property Practice LeaderWillis Risk Solutions212 804 [email protected]
MR 2006: Property 3 • 04/06
Marketplace Realities 2006& R i s k M a n a g e m e n t S o l u t i o n s
Contact
What Can You Do?
Marketplace Realities
MR 2006: Aviation 1 • 04/06
Aviation April 2006
MarketplaceConditions
2006& R i s k M a n a g e m e n t S o l u t i o n s
Pronounced change best describes the Aviation insurance marketplace in 2006. Following the chaoscreated by the events of 9/11, the marketplace experienced an unprecedented period of technicalunderwriting that produced four years of record underwriting profits in all Aviation sectors.
Some disruption returned in 2005, mostly due to activity in the underwriting ranks. Personnel from twowell established Aviation underwriting teams in North America left their firms. Incumbents quickly beganrecruiting new teams, and the net result was the introduction of three new underwriting facilities. Twohave already commenced underwriting in the US, and one of these is setting up its international team.Thethird is expected to begin writing business in April 2006. Personnel shifting continued in the first quarterof 2006, with a London team leaving an existing carrier for a start up.
Airlines
Given the absence of market-changing airline catastrophe losses, rates and premiums have declinedsteadily over the past four years – to what underwriters describe as “near critical levels.” Even so, afurther erosion of worldwide airline premiums is expected again in 2006. While most underwriters willundoubtedly try to hold the line on rates and premiums, the emergence of new capacity is likely to createenough competition among the expanded field of underwriters to maintain downward pressure.
Products
In 2005, capacity levels stayed unchanged from 2004, but a number of underwriters deployed capacitymore selectively. The market imposed a wide range of price increases, which varied according to productmix, sales volume, loss deterioration and other factors. Risks renewing with static exposures and lossrecords received single-digit increases. For those with deteriorating loss histories, the increases werehigher. In 2006, we again expect to see insurers differentiate accounts and use actuarial trendinganalyses to support increased price levels. An early start to renewal preparations and a sound marketingplan are needed to achieve optimal results.
General Aviation
The new entrants in the Aviation market have had little impact on General Aviation capacity.Segmentation in the sector continues. There is plenty of capacity for quality industrial aid risks; as aconsequence, premium reductions have continued. For commercial operators, less capacity was available.Highly sought risks, those operations with excellent loss records, were able to negotiate flat renewals ormarginal reductions. Others saw increases, particularly ground handlers and fixed-base operators. Highlimits of liability remain expensive. Loss experience and pilot training continue to be critical factors ininsurers’ risk analyses.
MR 2006: Aviation 2 • 04/06
• The Federal Aviation Administration (FAA) war risk insurance program, amended by the HomelandSecurity Act to provide first-dollar coverage for third-party and passenger liability, hull and spare partsexposures, was finalized in February of 2003. Soon thereafter, most US airlines cancelled theircommercial war risks insurance and entered the federal program. Additional legislation extended theprogram through August of 2006. We expect a further extension through December, but no extensionbeyond 2006.
• In April of 2005, the European Union (EU) imposed significant increases in required limits of liabilityinsurance for operations in Europe. These higher limits have resulted in significant cost increases formany corporate aircraft operators. The aviation industry continues to seek relief from theserequirements, but none appears to be forthcoming in 2006.
• There has been resurgence in non-airline commercial and corporate aviation activity since 9/11.Orders for business jets are up.
• The introduction of the VLJ (light jet) has created new challenges in underwriting Aviation risks.• Pilot qualification and training factors are more critical than ever in rating.• Heightened security and safety awareness post 9/11 are often cited as key reasons no major domestic
airline accidents have occurred since November 2001. Underwriters are increasingly focusing onsecurity factors for non-airline operators.
With the increased focus on technical underwriting, it is more important than ever that buyers of Aviationinsurance begin gathering renewal information early and articulate positive differentiation for their risksin the marketplace. A strong marketing plan and thorough strategic review of underwriting markets arekey ingredients to successful placements.
Joe TrottiCEO Global AviationWillis North America212 820 7447 [email protected]
Marketplace Realities 2006& R i s k M a n a g e m e n t S o l u t i o n s
Legal & RegulatoryEnvironment
Other AviationHighlights
Strategies forTomorrow
Contact
Marketplace Realities
MR 2006: Casualty 1 • 04/06
CasualtyApril 2006
MarketplaceConditions
2006& R i s k M a n a g e m e n t S o l u t i o n s
Insurers remained cautious during the first quarter of 2006, with more emphasis being placed onmanaging their exposure to catastrophic loss. Although directly impacting Property risks in catastrophe-prone areas, the post-hurricane environment has also had an indirect effect on Casualty lines. This is theresult of insurers either spreading the increases needed to fund for catastrophe losses across all lines ofbusiness; or re-allocating capital away from Casualty where prices were softening, and adding it to theProperty units where higher returns can be achieved.
Notwithstanding the recent rise in interest rates and increases in investment income, underwriting profitsare needed in 2006 in order to achieve the ROEs necessary to sustain overall capacity in the marketplace.Consequently, carriers are for the most part maintaining pricing and underwriting discipline.
Primary CasualtyPrograms that reflect a good loss record are being renewed flat or with modest rate reductions. Largermore complex accounts with a degree of volatility are experiencing increases in the five to ten percentrange. The principle underwriting concerns continue to be:• Employee concentrations in large metropolitan areas• Collateralization of expected losses within loss-sensitive programs• Limiting exposures to potentially catastrophic risk• Availability of financially sound reinsurance• Adverse judicial developments
Umbrella Excess CasualtyThe market for large Casualty account umbrella and excess business, which was showing some softnessin 2005, is now adhering to a more disciplined underwriting approach. Increases in interest rates havenot been reflected in rate reductions, except for those accounts with stellar claims experience andinnocuous exposures. For the most part, rates are holding firm, with most of the increases being confinedto risks with potential for large catastrophe losses.
Over the course of the last year, we have witnessed a reduction in the number of markets offering leadumbrella capacity. Simultaneously, the number of carriers offering capacity excess of $25 million hasincreased significantly. In these excess layers, carriers can achieve acceptable premiums with acomfortable attachment point.
Further, “true” umbrella policy forms are on the decline. Replacement forms are actually more reflectiveof straight excess insurance. The major lead umbrella markets are in the process of filing the new formsnow and will be pushing to have them utilized for their fourth quarter renewal and new business writings.
Finally, underwriters’ insatiable thirst for exposure information on even the most seemingly mainstreamrisk continues, with no expectation for any change.
MR 2006: Casualty 2 • 04/06
Tort costs are still a major factor influencing industry performance, notwithstanding the 2005 ClassAction Fairness Act, which has so far had little impact on underwriting results. Also, in its present form,the proposed trust fund to handle asbestos claims provides little comfort to insurance carriers, and thelikelihood of these proposals significantly limiting the ongoing adverse development of incurred claims isremote.
Another concern is the recent decision declaring paint manufacturers liable for the expense of cleaningup lead paint contamination. Although the ruling was made on narrowly drawn conclusions, the effecton other litigation could be significant, as several states are considering their own suits. This is beingcompared by some analysts to the asbestos crisis in the 1970s.
TRIA has been extended for two years and the industry aggregate deductibles have been raised from $15billion in 2005 to $25 billion in 2006 and $27.5 billion in 2007. Even with TRIA protection, a large-scaleterrorist event would give many insurers greater retentions than their 9/11 losses. A long-term solutionis still needed.
Workers’ Compensation reform continues to be a moving target and varies dramatically from state tostate, but as mentioned earlier, the industry’s main concern is concentration of employees, not just inregard to terrorism, but also earthquakes.
Most indicators suggest that the Casualty market will remain relatively stable throughout 2006. Severalfactors, however, could influence the near-term direction of the marketplace. If interest rates continue torise, high excess long-tail business becomes very attractive for insurers, creating competition and thepotential for rate reductions. An offset to such a development is the possibility of another year of record-breaking natural catastrophe losses.
Carriers are constantly adjusting their preferred attachment points, and it behooves insureds to explorevarious structures to minimize their cost of risk. This would include the use of buffer layers, increasedretentions, integrated insurance products and alternative risk transfer mechanisms.
Robert DavisSenior Vice PresidentWillis Risk Solutions Casualty Practice212 837 [email protected]
Marketplace Realities 2006& R i s k M a n a g e m e n t S o l u t i o n s
Legal & RegulatoryEnvironment
Strategies forTomorrow
Contact
Marketplace Realities
MR 2006: Cyber Risk 1 • 04/06
Cyber RiskApril 2006
MarketplaceDevelopments
2006& R i s k M a n a g e m e n t S o l u t i o n s
Cyber products began appearing at the turn of the millennium and for its first five years, the Cyber marketgrew steadily but slowly. The dimensions of risk were only gradually being understood, coverage waslimited in scope, and insurance buyers had their share of distractions – for example, rising rates forExecutive Risks and Property lines. Many companies put their Cyber risk concerns in hibernation mode andtrusted that Information Technology (IT) security was mitigating the exposure.
Then came 2005, dubbed by some the Year of Identity Theft. Several well-publicized identity theft / dataprivacy events in early 2005, coupled with Cyber legislation in many states, began to change the thinkingof the risk manager, general counsel and treasurer. Organizations began forming e-risk committees toidentify, assess and mitigate the risk – and refresh their thinking about Cyber insurance.
In 2006, companies are starting to break down the walls between risk management and IT security. Thereis a growing acceptance that even the most secure network infrastructures can be breached by externalhackers, disgruntled employees or service providers with authorized access. Once breached, a computernetwork or even a single laptop can yield personally identifiable information on customers, clients, patientsor subscribers, data that can be put to ill use.
Security breaches are not new. The common response has been to keep quiet about them in an effort toavoid worry, panic and bad publicity. For the most part, that’s no longer an option. Security breachnotification laws were passed by 23 state legislatures in 2005, requiring notification to consumers if theirpersonal information may have been involved in a Cyber incident. These notifications have led tomultiparty and class action litigation. Multimillion dollar losses are hitting the Cyber underwriters’ books.Markets are responding with new products and endorsements addressing privacy risk.
In 2005, AIG introduced their Privacy and Security Module to their Cyber package, netAdvantage Suite.The module expands liability coverage for the breach of personally identifiable information beyondnetwork systems to include laptops, non-electronic data (dumpster diving) and release or unauthorizeduse of data by a service provider.
ACE introduced DNA, a product that provides first-party coverage for network business interruption anddata corruption on a stand-alone basis, or as a tie-in-limit with their DigiTech policy.
Other markets are granting endorsements that would respond to privacy risk.
In early 2006, Beazley introduced a new product that broadened their privacy liability coverage andadded first-party Cyber coverage.
Arch, Hiscox, St. Paul and CNA are introducing new policies in second quarter 2006 that will broadentheir definitions of privacy coverage.
Chubb has added endorsements to their financial institutionproducts, CyberSecurity and CyberLiability.
MR 2006: Cyber Risk 2 • 04/06
Markets have been responding to Cyber issues other than privacy:• Internet media liability – products cover trademark losses, which are on the rise• Network business interruption – expanding over the past two years to cover entire networks, not just
internet activity• Denial-of-service attacks
A trend developing among professional services firms (especially publishers, broadcasters, technologyservice providers and law firms) is the blending of Cyber Liability coverage into Errors & Omissionspolicies. As more firms use their network to provide services electronically, such as distributing contentor billing online, their Professional and Cyber risks overlap. Programs are evolving accordingly.
To date, the demand for Cyber Liability coverage has outstripped the demand for first-party Cybercoverage. Many insurance buyers are realizing that a hacking event may not only create liability, but alsodisrupt critical operations involving supply chain, logistics, account receivables or other financialtransactions. A disruption of several hours or days can cause significant loss of income and futurebusiness. Markets, as mentioned above, are recognizing the developing demand for first-party Cybercoverage.
In 2003, California enacted the first security breach notification law requiring a corporation that suffereda breach to report the incident to all California consumers who may have had their personally identifiableinformation accessed illegally and could be victims of identity theft or fraud. Following several databreaches in early 2005 and the slow responses from some of the breached corporations, 23 states passedlegislation following the California model. Two more states have passed legislation and expect to enacttheir laws in second quarter 2006. The US House of Representatives recently passed security breachnotification legislation, sending it on to the Senate in March 2006. If it becomes law, the legislation isexpected to preempt the state laws.
For many companies, from financial institutions to retailers to healthcare providers, the new state lawsare merely the latest mandates in a growing list of regulatory and industry compliance requirementsregarding the handling of personally identifiable information:• Health Insurance Portability and Accountability Act (HIPAA) – for healthcare organizations and any
company managing employee benefits• Gramm-Leach-Bliley Act – for financial institutions and any organization processing credit card data,
including retailers• Sarbanes-Oxley Act (SOX) – requiring all public companies to have security protections around
financial controls
All these laws require businesses to protect against unauthorized access or use of data or computernetwork systems. The government is not alone in these efforts. Energy and power companies, throughtheir critical infrastructure protection (CIP) efforts have pushed their industry partners to secure theirnetworks. MasterCard and Visa have required large and mid-size merchants/retailers to undergo annualnetwork security assessments.
Marketplace Realities 2006& R i s k M a n a g e m e n t S o l u t i o n s
Other CoverageIssues
Into the RegulatoryBreach
The good news in all of this is not only that businesses are being forced to take steps to protect customer,client, patient and subscriber information – it is also that levels of security and security assessments thatare now customary are making it easier to purchase Cyber risk insurance. A strong security program isthe highly protected risk of the electronic age – the e-HPR.
The sobering news is that the security breach notification laws create an opportunity for the plaintiffs’ bar,as regulatory bodies set standards that organizations may need to prove in a court of law they have met.
For organizations new to Cyber coverage or for those who bought an early Cyber product, there is much toreview. Starting with privacy protection issues, buyers must understand all features of coverage today, suchas full network coverage, coverage for acts committed by employees or service providers, expanded privacycoverage for non-electronic breach of personally identifiable information, expense coverage for securitybreach consumer notification, lower retentions and waiting periods on first-party coverage. At the sametime, coverage is easier to come by. There is increased capacity ($150 million to $250 million), sufficient tofully address catastrophic Cyber risk. The underwriting process is less stringent. There are shorterapplications, largely thanks to underwriter use of security assessments already conducted by buyers.
This does not mean policies are inexpensive. Underwriters have been hit with multi-million dollar lossesarising out of privacy and intellectual property issues, and the new laws are driving more claims. As thoselosses build and claims are paid, organizations are developing greater appreciation for the scope andvalue of Cyber insurance.
Perhaps the greatest hurdle for companies addressing Cyber risk is bridging the gap between IT securityand risk management/treasury. These two groups need to communicate and act collaboratively. Even withrobust network security in place, many large corporations and institutions have suffered highly publicizeddata breaches and losses. Putting another form of protection – insurance – in place behind robust securitypolicies and procedures should not be viewed by IT as a lack of confidence in their infrastructure, butrather as an important operational risk management tool for addressing this growing risk.
Peter FosterSenior Vice PresidentE&O and Cyber Risks Practice617 351 [email protected]
MR 2006: Cyber Risk 3 • 04/06
Contact
Marketplace Realities 2006& R i s k M a n a g e m e n t S o l u t i o n s
Strategies forBuyers of CyberCoverage
Into the RegulatoryBreach (cont.)
Marketplace Realities
MR 2006: Environmental 1 • 04/06
EnvironmentalApril 2006
MarketplaceConditions
2006& R i s k M a n a g e m e n t S o l u t i o n s
Recent trends in the global Environmental insurance market indicate continued steady growth. A deeperlook reveals significant changes in the market drivers, exposures and underwriting appetites that affectthis still relatively new line of coverage.
The $2-3 billion Environmental market is clearly maturing. Environmental insurance products, once appliedto a narrow set of high-exposure scenarios, have evolved into a mainstream purchase, addressing a widerange of circumstances. The market, however, is being propelled by a new set of drivers:
• The routine application of Environmental insurance to a wider array of properties (including non-industrial sites) and transactions (both M&A and real estate)
• The burgeoning brownfield and military base redevelopment markets • New demands for greater financial disclosure of Environmental liabilities• The trend towards insured, fixed-price cleanup projects
The relative youth of the market is also evident. Loss trends from long-term policies are just nowcoming to light, prompting a tightening of terms and conditions and a reassessment of certain productlines. We anticipate carriers will emphasize profitable underwriting and focus on shorter term policies.They will also need to address new areas of exposure from emerging contamination challenges andregulatory initiatives.
Global Environmental capacity remains plentiful (approximately $400 million) and relatively stable,despite market-leader AIG’s recent decision to reduce capacity for single placements from $100 millionto $50 million. That decision appears to be based on weaker demand for higher limit programs, and theassociated cost of unused reinsurance protection, rather than any fundamental change in risk appetite.
The most critical market question for insurance buyers is not limits, or rates (which are only showingmodest increases), but, rather, how to best manage increasingly restrictive terms and conditions. Due topast carrier losses, new scientific advances and new regulatory initiatives, buyers can now expect:• Pressure to reduce policy periods• New coverage restrictions for certain key issues, such as mold, certain building materials (with the
potential to cause mold) and emerging contaminants such as perchlorate• More demand for location-specific information on portfolio placements • Increased underwriting scrutiny of areas of regulatory interest such as vapor intrusion of underground
contamination into buildings
Changing carrier appetites can be seen clearly in three product lines.• Cleanup Cost Cap underwriters continue to experience unacceptably high loss rates. AIG, the
dominant carrier in this product line, is tightening terms and has introduced minimum premiumthresholds. It has reduced its available capacity for Cost Cap and is now requiring up-frontengineering or commitment fees in many situations. The other Cost Cap insurers – ACE, Zurich andXL – are tentatively expanding their Cost Cap books, but willgenerally only offer policies to a pre-selected group ofcontractors.
MR 2006: Environmental 2 • 04/06
• Professional Liability programs, especially for large environmental service firms, have beenanother source of significant losses for the Environmental carriers. Insurers will be pulling back fromaccounts with a significant component of traditional design engineering (i.e., non-environmental)exposure.
• In contrast, construction-related products such as Contractors Pollution Liability (CPL) insurancerepresent a growth area targeted by all the major carriers. Mold and completed-operations exposuresare two of the main coverage drivers.
Other notable market developments include the reemergence of Chubb as a major market participantand Quanta’s decision in March 2006 to temporarily cease writing new Environmental business as theyexplore strategic alternatives following unexpected losses in the 2005 hurricane season.
The influence of the Sarbanes-Oxley Act (SOX) and the ongoing demand for greater corporatetransparency continue to drive the tightening of disclosure rules for Environmental liabilities. FIN 47(FASB Interpretation Number 47), announced in March 2005 and made effective in January 2006,addresses conditional asset retirement obligations. FIN 47 mandates that companies not wait until theyactually retire an asset to acknowledge the associated costs, such as future cleanup obligations. Theymust recognize the costs on their balance sheet as soon as the numbers can be reasonably estimated.The longer term consequences of this rule will become more evident after this year’s reporting period.
Several other regulatory issues bear watching:• Recent regulatory initiatives could mandate additional activities at many contaminated sites,
increasing the likelihood that regulators will reopen previously closed sites. For example:– The Environmental Protection Agency (EPA) is currently reviewing the effectiveness of
institutional controls (legal mechanisms such as deed restrictions that are used to minimize thepotential for human exposure).
– The EPA and several states have issued guidance documents for reevaluating the health risksposed by subsurface vapor intrusion.
• Natural Resource Damage (NRD) claims continue to be a looming regulatory concern for bothclients and Environmental insurance markets. While the federal Comprehensive EnvironmentalResponse, Compensation and Liability Act (CERCLA) provides the basis for NRD assessment,administration of NRD activities falls to individual state trustees. In addition, each state has its ownlegislation affecting NRD administration, and there has been no real coordination of the federal andthe state programs. To make matters more confusing, each state pursues NRD claims with varyingdegrees of aggressiveness. Since the Environmental insurance marketplace closely tracks federal andstate regulations, the availability of Environmental insurance for NRD claims is often determined bythe location of the property in question. NRD submissions will continue to be evaluated on a case-by-case basis.
• Emerging contaminants are substances that are currently unregulated but may be subject toincreased regulatory standards in the near future. A good example is perchlorate, a commoncontaminant on defense-related facilities that until now had been lightly regulated. In January 2006,the EPA proposed a stringent perchlorate drinking water standard that was followed by an evenstricter proposed state standard in Massachusetts. If finalized, the introduction of such standardswould have a significant impact on future cleanup strategies and costs.
Marketplace Realities 2006& R i s k M a n a g e m e n t S o l u t i o n s
Legal & RegulatoryEnvironment
MarketplaceConditions (cont.)
Insureds should expect challenging renewals with increasing restrictions on terms and conditions.Careful, strategic program design and marketing will be paramount to avoid erosion of valuablecoverage.
For new placements, it will be important to carefully match coverage needs with the current appetitesand offerings of the market. As Environmental insurers become more selective, purchasers that are ableto combine innovative program design with high-quality underwriting presentations will derivemaximum benefit.
FIN 47 makes it clear that, beginning this year, companies must reserve for asset retirement obligationsdespite uncertainties as to the time or method of settlement. Many companies will be looking for optionsto help mitigate the impact of FIN 47 on their 2006 financial reports. These options might include theaccelerated cleanup of a contaminated site, sale of non-performing sites or operations, and/or use of risktransfer arrangements such as Environmental insurance or liability transfer alternatives to bringresolution to cleanup obligations.
Mike BalmerSenior Vice PresidentWillis Environmental Practice617 351 [email protected]
Rick SecchiaSenior Vice PresidentWillis Environmental Practice212 804 [email protected]
MR 2006: Environmental 3 • 04/06
Strategies forTomorrow
Contacts
Marketplace Realities 2006& R i s k M a n a g e m e n t S o l u t i o n s
Marketplace Realities
MR 2006: Executive Risks 1 • 04/06
Executive RisksApril 2006
2006& R i s k M a n a g e m e n t S o l u t i o n s
The Willis Executive Risks Practice comprises expertise in every type of management liability coverage:
• Directors & Officers
• Errors & Omissions
• Professional Indemnity
• Fiduciary / Pension Trustees Liability
• Crime & Fidelity
• Cyber Risk
• Mergers & Acquisitions
In providing thought leadership for our clients and the industry’s risk management community, theExecutive Risks Practice produces a continuous stream of white papers, bulletins and referencedocuments that examine significant legal, regulatory and insurance product developments – all in adigestible format that facilitates board-level planning and decision-making.
On this page, we reference several recent products, including bulletins, a webcast and establishedreference tools:
FAQs on Crime Coverage (March 2006) – 10 instructive questions and answers that aid in planningyour crime protection strategy. Examples include “Do all Crime Bonds have an aggregate limit ofliability?” … “What is the difference between a ‘loss sustained’ and a ‘discovery’ Crime policy?” … “Istheft of confidential information generally covered by a Crime bond?”
The Willis Index: Directors’ and Officers’ Newsletter (Q1 2006) – A quarterly survey of the Lloyd’sand London company marketplace that examines primary and excess layer premium trends, regulatoryand judicial developments and implications for program coverage.
How Global Is Your Global D&O Program? (Jan. 19, 2006) – As part of our Willis Webcast Series,D&O Product Leader Ann Longmore and International Practice Leader Claude Gallello examined D&OLiability insurance program issues for multinational companies, highlighting recent events andrecommending program actions. Issues include non-admitted insurance laws, local premium taxobligations, stateside payments, repatriation of funds and related matters that impinge on the structureand administration of all global programs.
2005’s Top 10 Executive Risks Court Awards and Settlements (January 2006) – A summary of themost important Executive Risks cases and assessments of potential impact on the industry and on futurelitigation. Cases include Sunbeam, Disney, WorldCom, HealthSouth, Ahold and others.
White Papers,Bulletins andReferenceDocuments
MR 2006: Executive Risks 2 • 04/06
Directors & Officers Liability and Insurance FAQs – 20 questions and answers that are mustreading for those who need to understand the many dimensions and nuances of D&O coverage.Examples include: “Why don’t companies simply indemnify their Ds and Os?” … “What is an ‘insuredvs. insured’ exclusion?” … “What will a D&O policy generally not cover as loss or damages?”
Fiduciary or Pension Trust Liability and Insurance FAQs – 20 questions and answers that are alsomust reading for risk management professionals. Examples include: ”What is a Fiduciary liability policyintended to do?” … “Who selects defense counsel?” … “What is the ‘hammer clause’?”To access all of our Executive Risks thought leadership products, please visit our home page onWillis.com:http://www.willis.com/Services/Executive%20Risks.aspxand the Publications page of Willis.com:http://www.willis.com/Extras/Publications.aspx
Todd JonesNorth American Practice LeaderWillis Executive Risks610 254 [email protected]
Marketplace Realities 2006& R i s k M a n a g e m e n t S o l u t i o n s
Contact
White Papers,Bulletins andReferenceDocuments (cont.)
Marketplace Realities
MR 2006: HPL 1 • 04/06
HealthcareProfessionalLiabilityApril 2006
2006& R i s k M a n a g e m e n t S o l u t i o n s
After a four-year period (1999 to 2003) of significant rate increases, reduced capacity and reservestrengthening, Healthcare Professional Liability market conditions have stabilized and are much improved in2006. In August 2005, A.M. Best reported an HPL combined ratio of 112 against a break-even point of 114,indicating profitability, albeit slight, for the first time in many years. Despite the departure of certain majorcarriers from the HPL marketplace in recent years, capacity has gradually increased. Rates have stabilized forhospitals, long-term care and miscellaneous healthcare facilities, with average flat to slight decreases inrenewal rates/premiums for accounts with no significant exposure changes and favorable loss history. Rateincreases for physicians and surgeons and managed care organizations (MCOs) have also moderated.The HPLline appears to be on its most solid footing since the early-to-mid 1990s.
For most underwriters, the catchphrase of the moment is cautious optimism. Buyers can expect to see renewalpricing ranging from single-digit decreases to single-digit increases in 2006, closely following the marketconditions of 2005. Physicians should see no more than single-digit premium increases in most states, andmay see slight decreases in others.
The improvement has been facilitated by many factors beyond the insurance marketplace. These includewidespread enactment of state malpractice reform legislation, moderating claim severity and decreasingclaim frequency trends, and risk management and patient safety initiatives. Improvement of course does notmean perfection. While claim severity appears to have moderated, malpractice claims costs generallycontinue to increase faster than inflation, according to the Physician Insurers Association of America (PIAA).
Reinsurance losses from the 2005 hurricanes have had minimal impact on HPL, except perhaps toimprove capacity, as carriers are drawn to commit capital to lines with rate adequacy – a description ofHPL that would have seemed almost unimaginable only a few years ago. Interest rates have alsoimproved and thus bolstered carrier profitability.
The saga of malpractice reforms remains a chaotic one. While the passage of federal malpractice reformlegislation in 2006 seems quite unlikely, there have been many legislative victories in distressed states.However, the long-term effect of state tort reform remains to be seen and tested. More certain is thegradual change in societal attitudes. Media focus on the impact of malpractice suits on healthcare accesshas greatly aided the passage of reform laws and has helped win defense verdicts at trial. Virtually allcarriers and many self-insured entities report significant reductions in claims counts. Tort reform battleswill continue in state legislatures and, more and more, in the courts. The trial bar is expected to seek theoverturn of malpractice reform laws in more than half the states where laws have been passed since2001. This is called “judicial nullification.” Having lost many battles in statehouses and in the court ofpublic opinion, the trial bar is fighting the reform laws on constitutional grounds. The strategy worked in2005 in Wisconsin, where a long-standing malpractice reform law capping damages was struck down.
Notable recent market developments include several acquisitions:• ProAssurance’s acquisition of DC-based National Capital Reciprocal Insurance Company (NCRIC) and
Physicians Insurance Company of Wisconsin (PICWIS)• Berkshire Hathaway’s acquiring of Medical Protective from General Electric• OneBeacon acquiring the renewal rights to Chubb’s HPL book• ACE USA acquiring the renewal rights to GE Employers
Reinsurance’s HPL book• The Doctors Company’s acquisition of Oregon-based Northwest
Physicians Mutual.
The Saga ofMalpracticeReforms
MR 2006: HPL 2 • 04/06
This market segment is divided into two lines: Primary HPL and Excess/Reinsurance HPL. Pricing hasstabilized for both lines, and has become more competitive in recent years with the influx of new capital,especially in the Excess HPL line. Provider-owned companies control major market share in the PrimaryHPL line, but are being challenged by newer entrants and older commercial carriers. New entrants inPrimary HPL in recent years include: ACE USA, Arch, Darwin and Hudson Insurance Group. AIG, Zurich,CNA, Medical Protective and several physician-owned carriers remain major underwriters in Primary HPL.At the same time, many carriers have exited this segment in recent years, the most notable being St. Paul,the Reciprocal Group and PHICO. In 2005, Chubb sold their book to OneBeacon and ERC sold therenewal rights for their Excess HPL book to ACE USA. Occurrence coverage is very difficult to obtain oneither a primary or excess/reinsurance basis.
Capacity for Excess/Reinsurance remains plentiful, with competitive markets in the US, London, Europeand Bermuda. AIG, CNA, OneBeacon, Am Re, Berkley Medical Excess, Arch, Zurich and ACE USA aremajor domestic writers of Excess HPL. London is an active provider of this coverage, with such syndicatesas Catlin, Amlin, Beazley, Kiln, Chaucer and Faraday. European markets include Swiss Re, Hannover Re,Aspen Re and others. There are also numerous Bermuda-based insurers, including Starr, XL, Endurance,AWAC, Catlin, Max-Re, Arch, ACE and others. These same markets, along with many of the domestics,often reinsure captives and RRGs (risk retention groups). Of note here is that attachment points havegenerally been lowered in response to the improving malpractice environment and restored profitability,though few clients are electing to reduce their current retention levels.
This segment was in a state of distress a mere two years ago. Significant improvement was demonstratedin 2005 and should continue in 2006. Availability and affordability are less problematic except in a fewstates, most notably Florida. New entrants and increased competition have helped greatly as havemoderating loss trends. Non-profit facilities, especially those with religious affiliations, are viewed morefavorably by underwriters than for-profit facilities. One notable trend in this segment is the entry of smallregional carriers that limit their underwriting to one state or region. Most carriers have their own selecttargeted classes of business. All carriers are now carefully scrutinizing risk management structures andstaffing levels. Lexington / AIG is a major carrier in this segment. CNA is as well, and has cautiouslyexpanded into certain states as malpractice reforms laws take effect. Other markets include AmericanEmpire, Bunker Hill / Gulf, James River, US Risk, Uni-Ter, Old Colony, Evanston and OneBeacon. London isan important component of this market segment (e.g., Sapphire Blue, Spectrum / Willis London program).In addition, a number of Bermuda underwriters will entertain excess layer quotes with varying attachmentpoints. These include XL, Max Re, AWAC and ACE.
This remains the most troubled healthcare segment in 2006, mostly due to the issue of affordability, thoughthe extent of the crisis varies greatly by state and region. From an industry perspective, conditions haveimproved, but medical professionals are struggling. Many specialists have seen triple-digit price increasessince 2001 (though not many in the last two years) and some still find coverage very difficult to obtain,especially in obstetrics, radiology, neurosurgery and emergency medicine. These specialties have all curtailedservices, thus limiting access to healthcare, especially outside metropolitan areas. Prices have stabilized butat historically high levels. Single-digit increases should be the norm in 2006 in many regions, but somestates will see rate decreases from physician carriers and flat renewal pricing. There is further prospect forpremium relief as malpractice reforms take effect over the next three to five years. It won’t come a minute
Marketplace Realities 2006& R i s k M a n a g e m e n t S o l u t i o n s
Hospitals
Long-Term Care
Physicians andSurgeons
too soon, as the Medicare/Medicaid reimbursement levels for physicians continue to decline, creating afinancial squeeze for many practices. In addition, there is a gradual return of capacity into the physiciansmarket, which may further impact pricing trends in upcoming years. Leading physicians markets are MLMIC,The Doctors Company, Medical Protective (acquired by Berkshire Hathaway in July 2005 from GE) andProAssurance. ProAssurance continues to grow by acquisition, recently announcing plans to acquirePhysicians Insurance Company of Wisconsin (PICWIS).
Many physician-owned captives and RRGs have been created in recent years, especially in distressed states,but there is concern over the adequacy of capitalization and thus their long-term viability. Typically, onlylarger physician practice groups have the wherewithal to create alternative risk transfer (ART) vehicles;however, the market continues to see more physician groups exploring ART programs.
In early 2006, the American Medical Association added Tennessee to its list of states facing a malpracticecrisis. Twenty other states have been so designated. One state, Texas, has been removed from the list dueto recent passage of tort reform.
There are fewer carriers for this HPL segment than for any other: AIG, Darwin and OneBeacon (new as of2004). There are few excess markets for MCOs as well, though these include domestic, London andBermuda carriers. Attachment points have remained unchanged, but carriers are more open to manuscriptwording to meet coverage needs. Pricing trends are generally flat, with some slight reductions possible, (fivepercent or less), mostly in the upper middle market MCOs (revenues between $500 million and $1 billion).Sub-limits and sub-retentions are often used by these carriers for class action and/or antitrust cases, andthese types of legal actions are of great concern to carriers.
The market for HMO reinsurance and Provider Excess, on the other hand, is substantial and is being utilizedespecially for Medicaid and Medicare risks. Part D Medicare offers opportunities for risk sharing betweenprovider organizations and sponsoring HMOs and this type of arrangement is expected to see significantgrowth in 2006. Capitation strategies are seeing some revival in a number of localities and thus providerswill be examining whether to take risk and transfer a portion of it utilizing Provider Excess coverage. Majorcarriers in this market are: Allianz, OneBeacon, Presidio / CE, Independent Care / Standard Security, Chubb,Zurich, IOA Re / Arch, Cairnstone / TIG, Merna Merritt / Crum&Forester, AWAC, Max Re, RBS / Am Re (HMOonly), ING (HMO only), Summit Re, Swiss Re (HMO only).
There is more competition in this healthcare segment than in any other. The total marketplace is estimatedto be approximately $62 million in written premium. Virtually the entire range of miscellaneous healthcarefacilities (over 50 types, such as labs and home health services, with new ones created each year) representsdesirable underwriting risks as these facilities generally avoided the dramatic rise in claims severity thatbegan in the late 1990s. Large losses can and do occur, of course.The toughest risks are weight loss centers,facilities performing bariatric (weight loss) surgery and blood banks. Ambulatory surgery centers are highlydesired risks. Carriers competing for this class of business include AIG, Arch, CNA, Darwin, Evanston,Interstate, OneBeacon, Zurich, ACE USA and most of the other Primary HPL carriers.
MR 2006: HPL 3 • 04/06
Marketplace Realities 2006& R i s k M a n a g e m e n t S o l u t i o n s
MiscellaneousHealthcare Facilitiesand Providers
Physicians andSurgeons (cont.)
Managed CareOrganizations
Life sciences companies can be broadly defined as companies engaged in the development, manufactureand/or distribution of pharmaceuticals and medical devices. Most underwriters are now looking to the topend of the middle market (between $25 million and $3 billion in annual gross revenue) as the most desiredpart of this class. These companies are still considered to be high-hazard risks, but they are perceived byunderwriters to have less class action potential due to their tendency to be specialized.
The market for Products/Completed Operations remains limited in 2006, particularly in the number ofcarriers willing to provide primary coverage or capacity in the first $25 million excess of primary. Thepercentage of Fortune 500 pharmaceutical and medical device companies opting to forgo liability insuranceentirely is estimated as high as 60 percent. The decline in both supply and demand has made this anunusual market segment.
One meaningful change in 2006 has been the offshore (Bermuda) markets’ response to the reduction inFortune 500 business in this class. They are considering lower attachment points for optimal accounts.AWAC and MaxRe have both quoted attachment points below $25 million, where the standard range hasbeen $25 million to $250 million.
ACE Medical Risk, Chubb, CNA, Lexington and Medmarc all have specialized primary Product Liability formsfor this class. Apart from the rare exceptions, e.g., for a truly innocuous piece of medical equipment,coverage is on a claims-made basis. Capacity ranges from $5 million to $10 million. Most of these carrierswill provide coverage extensions or separate policies (including vicarious Professional Liability) to coverclinical trials. Competing policy forms differ mostly in their lists of specifically excluded products. These listsvary in length and comprehensiveness, and, with the exception of a few certainties (i.e., birth controlproducts), seem driven by a given company’s particular experience with the class.
All of the primary carriers mentioned also provide low excess coverage (within the first $25 million excessof primary). Axis, Gerling and General Star are the more notable names that can be added to the list of lowexcess participants.
Pricing for both primary and excess capacity remains about flat, if not marginally reduced, compared to2005. Meaningful reductions are not anticipated, given the limited field of participating carriers.
Paul GreveSenior Vice President / Senior ConsultantWillis Healthcare Practice615 872 [email protected]
Jennifer RuteckySenior Vice President / Healthcare Practice PrincipalWillis Healthcare Practice404 224 [email protected]
MR 2006: HPL 4 • 04/06
Marketplace Realities 2006& R i s k M a n a g e m e n t S o l u t i o n s
Life Sciences:Products/CompletedOperations Liability
Contacts
Marketplace Realities
MR 2006: Private Client Group 1 • 04/06
Willis PrivateClient Group April 2006
MarketplaceConditions
2006& R i s k M a n a g e m e n t S o l u t i o n s
Personal Property & Casualty Insurance
The Willis Private Client Group provides highly specialized risk management services for individuals withcomplex and/or highly valued personal insurance portfolios.
The personal Property and Casualty insurance marketplace will continue to experience significant premiumincreases in Homeowners insurance, driven primarily by reinsurance, especially in those areas subject topotential catastrophic loss from the perils of hurricane and earthquake. Other personal coverages,however – Automobile insurance, Personal Umbrella Liability insurance and Valuable Articles insurance (foritems such as art and antiques) – will remain competitive, as these are profitable lines for most insurancecarriers. Personal insurance will continue to be heavily regulated, with standard insurance carriersrequired to file their rates and insurance products with each state’s insurance department for approval.
For individual business owners and executives with complex personal insurance needs, several carriershave developed programs that offer innovative coverages in all lines, from Homeowners and Automobileto Personal Umbrella and Valuable Articles. In addition, these carriers are offering other personal riskmanagement-related services as part of their insurance programs – services that are offered for little orno additional premium.
The trend of higher Homeowners pricing and competitive Auto pricing will continue throughout the year,unless we have another active hurricane season that produces significant property losses. Should thathappen, we may witness a Property insurance availability crisis, as consumers in catastrophe-exposedcoastal counties may not be able to afford or even find Homeowner’s insurance.
As noted above, in 2006 the personal Property and Casualty insurance marketplace will continue to seedramatic pricing changes in property-related coverages. Homeowners in Florida and other Gulf Coaststates are dealing with serious issues of affordability and availability of coverage. For example, the state-sponsored insurance facility in Florida, Citizens Property Insurance, is considering substantial rate increasesas well as putting a cap on the amount of coverage they will offer per policyholder. Similar to thecommercial Property insurance market, reinsurance costs for personal lines insurance companies haveincreased significantly, and these higher costs are being passed along in the form of higher premiums.
However, other personal lines of insurance such as Automobile should continue to see competitivepricing and more open underwriting criteria, as insurance companies are willing to offer a product tovirtually all drivers, as long as they can charge a fair premium. Personal Umbrella Liability insurance ratesare also expected to remain stable, as are specialty coverages such as Fine Arts and Jewelry – providedthere is no significant catastrophe exposure.
Personal insurance will continue to be heavily regulated by each state, with carriers required to file theirrates and insurance products with each state’s insurancedepartment for approval. As the Property insurance marketplacecontinues to harden, however, more demand may be placed on thesurplus lines marketplace, where rates and coverages are not filed.
RegulatoryIssues
MR 2006: Private Client Group 2 • 04/06
Also, more consumers will continue to seek coverage through state programs, especially in catastrophe-prone states, as private insurance carriers continue to curtail their capacity in these areas. These stateprograms may also begin to limit their capacity, leaving consumers with few or no options.
For individual executives and business owners who have complex personal insurance needs, certaininsurance carriers have been able to create some very innovative personal insurance coverages that arebuilt into their deluxe personal insurance packages. Included are coverages such as Primary Flood,Identity Theft, individual Directors & Officers coverage, and even Crisis Management coverage to helppay for a public relations firm to help manage a covered lawsuit that puts a client in the public spotlight.In addition, these insurance carriers are offering personal risk management assistance for little or nocost. Examples of such services are domestic employee background checks and personal security andsafety evaluations.
If another active hurricane season produces major property losses, we may see a personal insurancemarketplace in crisis – one where those living in catastrophe-prone areas are unable to afford or evenobtain insurance. Those with property exposures in these areas need to be prepared. We are working withour clients to develop alternative approaches to deal with the exigencies that such a crisis would produce.
Sandra BravoExecutive Vice PresidentWillis Private Client Group212 837 [email protected]
Michael SmerkanichSenior Vice PresidentWillis Private Client Group212 830 [email protected]
Marketplace Realities 2006& R i s k M a n a g e m e n t S o l u t i o n s
RegulatoryIssues (cont.)
Client Issues
Strategies forTomorrow
Contacts
Marketplace Realities
MR 2006: Surety 1 • 04/06
SuretyApril 2006
Implications forBuyers of Surety
2006& R i s k M a n a g e m e n t S o l u t i o n s
Surety’s Return to Profitability – Will It Last?The US construction industry may be in the early stages of the strongest construction economy in morethan 10 years, as measured by available work and the prospects for future work during 2006 and intomuch of 2007. These conditions coincide with the Surety industry’s return to profitability after thecatastrophic experiences of 2001 through 2003. After returning to underwriting profitability in 2004,the industry’s preliminary 2005 results, recently released by the Surety Association of America, reflecteda second straight year of improved profitability. The 10 largest carriers, save one, posted excellent resultsfrom a loss experience perspective. As importantly, Surety reinsurers – the capacity engine of the industry– returned a profit for the first time since 1998.
In the past, however, very strong construction marketplaces have been followed by a cycle of severeSurety industry losses. Nor have sureties forgotten the recent past. From January 2001 throughSeptember 2005, the Surety industry sustained paid and reserved losses exceeding $11.9 billion. Thisperiod saw Contract Surety losses of unprecedented levels and Commercial Surety loss ratios close to, orin excess of, 100 in three of those years. The ability of sureties to balance support for contractor clientsin a very attractive marketplace for construction services, while maintaining the underwriting disciplinethat has returned the business to profitability, will be the determining factor in whether the return toprofitability is the beginning of a longer-term trend or merely a brief respite between periods of industryhardship.
• Single Surety Capacity remains an issue for aggregate programs above $300 million. There remainonly four sureties that will write aggregate programs of more than $500 million without a co-suretypartner.
• Co-Surety Programs may be arranged to obtain needed capacity for large accounts, but theypresent certain structural issues. The credit risk associated with co-surety participants remains a pointof concern for potential surety partners. Many clients are well-served by putting in place a “standbysurety” relationship (sometimes a co-surety can serve this purpose) to protect against unforeseenmarketplace developments.
• Single Bond Size Limitations may be imposed by sureties on contractors that do not have a jointventure partner. This requirement is driven by a surety’s desire for its client to obtain a spread of riskfor any large single project, as well as its own desire to maintain single credit aggregate exposureson any single risk within its current credit model.
• Reinsurance Terms have eased as capital has been attracted by the Surety industry’s return to:– Underwriting discipline – more adherence to traditional underwriting ratios, adequate
indemnity security, quality submissions, flow of information, ease of analysis, etc.– Pricing – stabilizing and an easing of the previous market bias toward higher rates– Higher retentions – leading to limited appetite for aggregate exposure on any single client’s
account– Additional security and/or collateral requirements – to cover net risk retained by the surety
MR 2006: Surety 2 • 04/06
• Insurance Company Management sees in Surety a business that:– Generates approximately one percent of US P&C industry revenues– Presents aggregation of liability vs. spread of risk challenges– Requires highly specialized underwriting– Demands significant capital support– Has exhibited increasing loss volatility in recent years– Holds the potential for any single loss to impact the insurer’s quarterly EPS
The robust construction economy presents sureties with a different set of parameters to consider asthey are asked to support a customer’s pursuit of potentially attractive opportunities. Some of theserisk factors may result in one-time pricing and security requirements that deviate from the client’sstandard bonding facility.
• Expansion Risk – The current conditions are presenting clients with expanded opportunities andpotentially attractive margins for work. Underwriters will focus on the contractor’s prequalificationof the owner, its source of financing, and the contractor’s experience in the type of work proposedand its familiarity with the market conditions (labor, material availability, etc.) in the project’s location.
• “Under-Engineered” Designs – Schedule risk will be assessed by the underwriter, at least in partfor potential liability.
• Subcontractor Default Exposure – Sureties underwrite their clients’ own risk managementpractices, including their subcontractor selection criteria. Some sureties are now requiring that clientshave in place a risk transfer mechanism for subcontractor default risk (be it surety or insurance) thataffords coverage to its surety partner on bonded work.
• Contract Duration / Warranty / Maintenance Periods – Durations of more than 24 months andmaintenance periods or warranties in excess of five years are unlikely to be approved withoutadditional security or collateral.
• Performance Efficiency Provisions – These may result in exclusionary language for the bond ora stipulation to cover such contract provisions through a separate surety performance obligation.
• Liquidated Damages Levels – Unusually high amounts are unlikely to be supported.• Consequential Damages Provisions – Sureties rarely agree to cover such provisions and will
inquire about the client’s insurance covers’ capabilities to respond to any claims not supported by theclient’s own resources.
• Materials Escalation Clauses / Industry Inflation – Sureties will ask how the client hasprotected itself against unforeseen price increases during the course of the contract. A more generalconcern relates to qualified labor and supervisory inflation costs due to the shortage of both in theconstruction industry.
• Bond Forms – Wordings continue to receive close scrutiny. Provisions relating to damages, anycurtailing of the contractor’s or surety’s rights under the bond, or obligations that are outside thecontract language itself are examples of “show stoppers” that may preclude underwriting support orcondition it upon additional security from the client.
• Residential Projects – Satisfaction regarding the source and adequacy of financing to pay theclient for its work and, within the contract documents, on provisions that may expose the surety orthe client to homeowner warranty claims are a surety’s primary focus in this rapidly expanding sector.The adequacy of the contractor’s insurance coverages will be a surety underwriting focus.
Marketplace Realities 2006& R i s k M a n a g e m e n t S o l u t i o n s
Implications forBuyers of Surety(cont.)
On What DoSureties Focus?
• Continuity Planning and Ownership Transfer – The construction industry is entering into asignificant period of generational change. Sureties are looking for continuity planning, bothoperationally and financially, that allows for a smooth transition in the case of a sale / buy-out or theorderly completion of existing work in the event the ultimate plan is for the firm to discontinueoperations. The availability of surety credit may affect a firm’s valuation and its shareholders’ abilityto transfer ownership of the business.
While conditions today are more stable than in the recent past and underwriters have an increasedinterest in new business, the Surety market retains elements of uncertainty. Financial ratings and thepotential for further industry consolidation – at the primary carrier or reinsurer level - could, at any time,interrupt the Surety industry’s ability to maintain capacity. For clients, this means continued vigilance andstrategic planning around their Surety program is advised, as rating changes and mergers generally comewith little or no warning.
Sureties, in many cases, have new business goals for the first time in two or three years. Willis expectsno significant easing of underwriting conditions for large buyers before the end of 2006, but capacity islikely to be available to support well-detailed opportunities, even on short notice. The first signs of suchflexibility and responsiveness were the Surety industry’s bonding support for emergency work to rebuildthe Gulf Coast following Katrina. The middle market continues to be well-served by a number of qualitysureties, and capacity is less of an issue. The credit considerations discussed above remain the same,however.
Even in the midst of such unsettled conditions, positive differentiation remains paramount in achievingpreferred terms. Simply put, surety support is attracted to well-managed firms. Treating a surety as apartner will reduce the chances of unexpected events negatively impacting a client’s surety facility, butstrategic planning and proactive communication are the key elements to dealing with continueduncertainty. Accordingly, we work with our client to secure answers to the following best-practiceschecklist and to act on their implications:• Am I completely familiar with my Surety submission and the ongoing work product representing my
company to the Surety marketplace?• How does the surety analyze my company?
– Review my surety’s financial analysis and credit modeling – it’s their scorecard for extending credit– Communicate what we expect of our surety and clearly understand the surety’s expectations of
my company• What are my surety’s underwriting results?• What level of reinsurance support does my surety rely on to service business? Have there been any
changes to my surety’s single project and aggregate program capacity?• What are my surety’s financial ratings? Have there been any recent changes to its or its parent
company’s ratings?• Have there been recent personnel changes within my surety at the local and/or home office level?• What is the status of my standby surety?
MR 2006: Surety 3 • 04/06
Marketplace Realities 2006& R i s k M a n a g e m e n t S o l u t i o n s
On What DoSureties Focus?(cont.)
A View Forward
A Client’s SuretyBest PracticesChecklist
Jim MaloneyDeputy ChairmanWillis National Construction Practice803 540 [email protected]
Mike AndersonEVP & Managing Director – SuretyWillis National Construction Practice610 254 [email protected]
MR 2006: Surety 4 • 04/06
Contacts
Marketplace Realities 2006& R i s k M a n a g e m e n t S o l u t i o n s
Marketplace Realities
MR 2006: Workers’ Compensation 1 • 04/06
Workers’Compensation April 2006
MarketplaceConditions
2006& R i s k M a n a g e m e n t S o l u t i o n s
Five years ago Workers’ Compensation was a challenging and unprofitable line of business for insurers.Today, markets are competing to write the business, and positive market conditions are likely to continueinto 2007. How did we get here?
Start with profitable underwriting in 2003, 2004 and 2005, attracting additional capital andcompetition. Add to that regulatory changes at the state level, enabling enhanced claims managementcontrol and reducing loss costs. Top it off with rising bond rates offering investment income potential forpremiums held until loss payments. The result: an eagerness to underwrite “good” Workers’Compensation risks, with price reductions quite common and expected to continue at least through thefourth quarter of 2006.
Improved Results
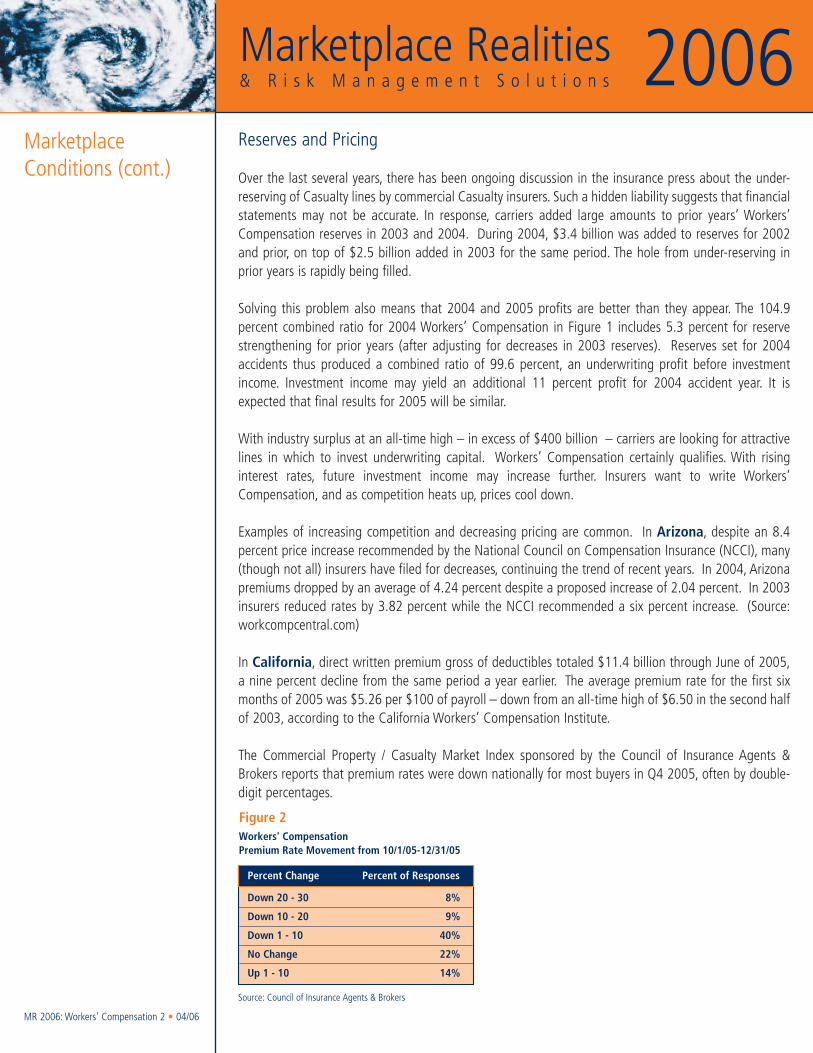
Figure 1 displays the net earned premiums and combined loss and expense ratios after policyholder dividendsfor Workers’ Compensation. Much improved combined ratios for 2003 and 2004 helped the industry add$110 billion dollar to surplus accounts during these two years. Workers’ Compensation produced solidprofits after investment income in 2004. Strong profits are also expected in final 2005 results.
In the industry as a whole, improving combined ratios, investment income and strong surplus convincedunderwriters in 2005 that it was time to be aggressive in renewing accounts and writing new business.The market softened throughout the year for most lines ofbusiness.
While the softening in Property pricing was abruptly reversed bythe 2005 hurricanes, Casualty lines were only temporarily affected.After a pause in pricing decreases, competition for Casualtybusiness has picked up again in 2006.
Figure 1Significant Improvement in 2003 and 2004Combined Ratios
Calendar Earned CombinedYear Premium Ratio
1995199619971998199920002001200220032004
$29.427.726.425.724.426.830.234.940.639.7
99.5102.4103.7111.2118.5120.7120.9119.1108.5104.9
Note: Combined ratio is after dividends to policyholders and beforeinclusion of investment income. Earned premium in billions.
Source: Best's Aggregates & Averages, Property and Casualty (2005)
Workers' Compensation
MR 2006: Workers’ Compensation 2 • 04/06
Reserves and Pricing
Over the last several years, there has been ongoing discussion in the insurance press about the under-reserving of Casualty lines by commercial Casualty insurers. Such a hidden liability suggests that financialstatements may not be accurate. In response, carriers added large amounts to prior years’ Workers’Compensation reserves in 2003 and 2004. During 2004, $3.4 billion was added to reserves for 2002and prior, on top of $2.5 billion added in 2003 for the same period. The hole from under-reserving inprior years is rapidly being filled.
Solving this problem also means that 2004 and 2005 profits are better than they appear. The 104.9percent combined ratio for 2004 Workers’ Compensation in Figure 1 includes 5.3 percent for reservestrengthening for prior years (after adjusting for decreases in 2003 reserves). Reserves set for 2004accidents thus produced a combined ratio of 99.6 percent, an underwriting profit before investmentincome. Investment income may yield an additional 11 percent profit for 2004 accident year. It isexpected that final results for 2005 will be similar.
With industry surplus at an all-time high – in excess of $400 billion – carriers are looking for attractivelines in which to invest underwriting capital. Workers’ Compensation certainly qualifies. With risinginterest rates, future investment income may increase further. Insurers want to write Workers’Compensation, and as competition heats up, prices cool down.
Examples of increasing competition and decreasing pricing are common. In Arizona, despite an 8.4percent price increase recommended by the National Council on Compensation Insurance (NCCI), many(though not all) insurers have filed for decreases, continuing the trend of recent years. In 2004, Arizonapremiums dropped by an average of 4.24 percent despite a proposed increase of 2.04 percent. In 2003insurers reduced rates by 3.82 percent while the NCCI recommended a six percent increase. (Source:workcompcentral.com)
In California, direct written premium gross of deductibles totaled $11.4 billion through June of 2005,a nine percent decline from the same period a year earlier. The average premium rate for the first sixmonths of 2005 was $5.26 per $100 of payroll – down from an all-time high of $6.50 in the second halfof 2003, according to the California Workers’ Compensation Institute.
The Commercial Property / Casualty Market Index sponsored by the Council of Insurance Agents &Brokers reports that premium rates were down nationally for most buyers in Q4 2005, often by double-digit percentages.
Marketplace Realities 2006& R i s k M a n a g e m e n t S o l u t i o n s
MarketplaceConditions (cont.)
Figure 2Workers' CompensationPremium Rate Movement from 10/1/05-12/31/05
Percent of ResponsesPercent Change
Down 20 - 30
Down 10 - 20
Down 1 - 10
No Change
Up 1 - 10
8%
9%
40%
22%
14%
Source: Council of Insurance Agents & Brokers
MR 2006: Workers’ Compensation 3 • 04/06
Stricter standards for disability ratings have contributed to reduction in rates in Florida,Tennessee and California.
State officials in Florida have called for a 22 percent rate reduction instead of the 7.2 percentrecommended by the NCCI. The 22 percent reduction is based on an independent rate review by thestate consumer advocate’s office. This year’s proposed decrease would be the third consecutive ratedecrease since a reform bill was passed in 2003. Rates dropped by 19 percent in the first two years afterthe reform bill.
In Tennessee, combined ratios for Workers’ Compensation insurers continued to improve in 2005, evenas rates declined. From a peak of 139 percent in 2000, the average combined ratio fell to 103 percentin 2003 and to 98 percent in 2004. A 3.3 percent rate reduction was approved effective July 2005,which followed a 6.3 percent reduction in 2004 and a 7.9 percent increase in 2003. Recent reforms,which included reductions in certain disability ratings and a medical fee schedule, are being credited forthe improved results.
In 2005, Texas enacted HB7, a comprehensive reform of its Workers’ Compensation law. This billincluded increases in indemnity benefits but also provided for the use of healthcare networks. The NCCIhas estimated that 100 percent network participation could yield up to 8.6 percent savings on overallsystem costs.
In Maryland, a medical fee schedule was adopted in September of 2004 that set rates for physicians’services at 109 percent of the federal Medicare program. This is expected to bring meaningful savingsin Workers’ Compensation medical costs.
In New Jersey, over 30 bills have been introduced before the state legislature. Major issues are thechoice of a medical provider and cost of living adjustments.
In Alaska, pressure for reform is mounting as its Workers’ Compensation insurance rates are now higherthan California rates.
Speaking of California, the California Workers’ Compensation Institute (CWCI) recently completed astudy that shows that an outpatient surgery facility fee schedule mandated by reforms passed in 2003is reducing medical costs. Average payments for outpatient surgery procedures are down 38.9 percentsince the schedule was adopted in January of 2004.
SB 228, passed in September 2003 and implemented in January 2004, set maximum fees for outpatientambulatory surgery facility services at 120 percent of Medicare fees for comparable services. TheWorkers’ Compensation Insurance Rating Bureau (WCIRB) in California estimated total outpatient costsfor 2004 work injuries of $2 billion and estimated that the schedule could produce net annual savingsof 41 percent ($800 million) for accident year 2004, not including any changes in utilization. In addition,the WCIRB estimated the outpatient surgery fee schedule could reduce further outpatient costs on pre-2004 claims by approximately $2.4 billion.
As a deterrent to over-utilization, which resulted in escalating costs in California, lawmakers passedlegislation in 2003 that revoked the treating physician’s presumption of correctness and mandated an
Marketplace Realities 2006& R i s k M a n a g e m e n t S o l u t i o n s
Legal & RegulatoryEnvironment
evidence-based treatment utilization schedule. However, adopting American College of Occupational andEnvironmental Medicine (ACOEM) guidelines as the basis for the schedule met resistance from physicians,who claimed that the guidelines limited their use of clinical judgment in determining the best medical care.They also argued that treatment beyond the guidelines would often prove helpful to patients.
The history of physical therapy and chiropractic manipulation in California is cautionary. By 2003,utilization of these services had grown to 37 cents out of every dollar paid for outpatient medicalprocedures. The only limits were restrictions on the number of services per visit included in the OfficialMedical Fee Schedule ground rules. Stories of 100 visits or more by a single patient were not uncommon.SB 228 mandated the adoption of a medical treatment utilization schedule, effectively requiring that anyuse of physical therapy or chiropractic services be supported by high-grade medical evidence found in theACOEM guidelines. The bill also established 24-visit caps for physical therapy and chiropractic care.
Although two bills passed in the fall of 2003 (AB 227 and SB 228) addressed medical costs, many seriousissues remained. SB 899, passed in July 2004, tackled many major cost drivers with the goal of makingpermanent, unprecedented changes to the system. Fourteen months later, the prognosis is very positive.
The WCIRB has estimated a cost reduction of 21 percent in 2004. Further reductions are likely as thereforms gradually take full effect. It is never wise, however, to underestimate the power of the plaintiffs’bar. Workers’ Compensation litigation is big business, even in a “no-fault” system. Recently, the CWCIdid a study on litigation and found that 76 percent of permanent disability claims (which represent 80percent of total system cost) were litigated. Most of the disputes focused on the nature and extent ofinjury – in large part fueled by the subjectivity of the rating schedule prior to SB 899. The study alsofound that the permanent disability payout for litigated claims was more than twice the average of non-litigated claims. Applicants’ attorneys will not walk away from millions of dollars in legal fees without afight, so continued litigation to dismantle the reforms may be expected.
Reduction in Workers’ Health Insurance
Over the last four years, the number of Americans with employer-provided health insurance fell by about3.7 million. Meanwhile, Medicaid increased nationwide by nearly eight million participants, a significantshift from private to public sector coverage. The number of people without any type of health insuranceat all increased from 39.8 million in 2000 to 45.6 million in 2004 (a 15 percent increase), mainly becauseof the sharp decline in employer-provided health coverage (Source: The Keystone Research Center andThe Economic Policy Institute). Poorer healthcare could result in more illness and injuries to workers,which could end up being filed as Workers’ Compensation claims.
Stress – a Global Workplace HazardIllnesses and injuries resulting from job-related stress are an unintended consequence of the rapidlychanging global workplace. Studies presented at the 17th World Congress on Health and Safety at Workin Orlando in September 2005 detailed the downside of our global, multicultural work environment.Among the highlights from the reports:
MR 2006: Workers’ Compensation 4 • 04/06
Marketplace Realities 2006& R i s k M a n a g e m e n t S o l u t i o n s
Legal & RegulatoryEnvironment (cont.)
Growing Issuesand Concerns
MR 2006: Workers’ Compensation 5 • 04/06
• Of 40.2 million working days lost to illness and injury, 13.4 million (30 percent) were from stress,anxiety and depression (which would explain the high usage of anti-depressants among Workers’Compensation claimants).
• Stresses created by a more globalized workplace include culture shock arising from a transfer to anew country or from a rural to an urban setting, isolation among outsourced workers anddisplacement resulting from mega-mergers and downsizing.
• Among the high-risk factors for workplace stress are work overload, lack of recognition from co-workers and supervisors, poor relations with supervisors, limited participation in decisions andinsufficient communication.
• Involving employees in decisions about workplace problems can be an inexpensive and relatively easyway to improve morale and reduce stress.
Obesity and an aging workforce are expected to lead to higher claim frequency and slower healing.There is also a new concern that use of BlackBerry devices could result in carpal tunnel symptoms fromrepetitive thumb motions.
Although the perceived threat of terrorist bombings may have subsided somewhat, there is still a concernabout aggregation of Workers’ Compensation claims. Chemical explosions, toxic fumes, tornadoes orearthquakes could all result in large aggregations of Workers’ Compensation losses, with or withoutterrorist involvement.
Pricing actions will vary by carrier, by state, and by the type of employers being targeted by underwritersfor growth. Overall, however, strong competition and reductions in Workers’ Compensation premiumsare likely throughout 2006. Lower rates may continue in 2007 for insureds with solid loss control andclaim management practices. For most, pricing for Workers’ Compensation may be expected to plateausometime in the second half of 2007, and begin again to increase in 2008.
Greg Alff, FCAS MAAASenior ActuaryWillis Captive, Actuarial & Pooling Solutions615 872 [email protected]
What’s in Store in2006 and 2007
Contact
Marketplace Realities 2006& R i s k M a n a g e m e n t S o l u t i o n s
Growing Issues andConcerns (cont.)
Marketplace Realities
MR 2006: Aggregation Risk 1 • 04/06
Aggregation RiskApril 2006
Aggregation RiskDefined
2006& R i s k M a n a g e m e n t S o l u t i o n s
On March 30, 2006, Willis conducted a webcast titled The Accelerated Growth of Aggregation Risk –and What You Can Do About It. Sandy Vietor, Executive Vice President, Willis North America, led thediscussion, examining Aggregation Risk, the threat it poses to the balance sheet, the future performanceof the commercial insurance marketplace, and strategies that companies can undertake today to addressvolatility and shape the future. He was joined by Rod Thaler, National Director of Willis Re, and byGordon Prager, Director of Risk Management Consulting, Willis Risk Solutions.
A replay of the webcast is available on Willis.com through July 31, 2006, and the PowerPoint slides canbe downloaded in a pdf file format. Please visit:http://www.willis.com/Extras/Webcasts/2006%20Archive.aspx
This white paper is based on salient excerpts from the webcast, addressing several defining questionsfor financial and strategic planning:• Who is exposed to Aggregation Risk, and how can it be measured?• How, if at all, can volatility be tamed?• Can we – and should we – depend on government to serve as “the insurer of last resort”?• Going forward, what are the legislative options and imperatives?• Going forward, what are the funding options?
Recognizing the overarching importance of dealing with today’s adverse conditions in the insurancemarketplace for natural catastrophe risk, we focus on Property-driven Aggregation Risk.
The October 2004 edition of the Willis Energy Market Review articulated the observation thatAggregation Risk is growing rapidly, with a widening gap between the levels of such risk and the abilityof the commercial insurance marketplace to provide risk transfer capacity for it. Aggregation Riskincludes concentrations of exposures (people and physical assets), within a defined geographical area,that may be subject to such Nat Cat perils as flood, wind or earthquake, or to an act of terrorism. It alsoincludes accumulation over time of liability arising from specific perils, products or operations.
Sources and examples of Aggregation Risk are all too familiar, most of them having occurred within arelatively short and recent span of time:• The events of 9/11 impacted multiple lines of insurance simultaneously and catastrophically.• Pharmaceutical risk, asbestos and “new age” environmental factors such as mold, silica and MTBE
qualify as examples of Aggregation Risk.• There have even been attempts to position fast food as a form of societal products liability risk, with
the allegation that levels of obesity, heart disease and other ills have been elevated insidiously byburgers, fries and chocolate shakes.
• Aggregations of physical damage and business interruption values subject to the Nat Cat perils ofwind, flood and earthquake, are, by definition, components of Aggregation Risk.
Sources andExamples
MR 2006: Aggregation Risk 2 • 04/06
In the midst of the 2004 hurricane season, one for the record books until the following year's hurricaneseason, we asked these questions: If the marketplace today were to sustain a new round of catastrophelosses, would it be able to stabilize? Would it be able to continue to cover aggregation exposures on thebasis that it does today?
Prior to 2005, the modern benchmark US hurricane was 1992's Hurricane Andrew. It dwarfed the classof 2004 – Charley, Frances, Ivan and Jeanne. Then came 2005 with Katrina, Rita and Wilma. These back-to-back record-breaking hurricane seasons, delivering the double whammy of frequency and severity,have produced a paradigm shift in the universe of expectations on the part of insurers, reinsurers,modeling firms and industry investors.
Reinsurers are looking much more closely at peak risk and catastrophe accumulations within insurancecompanies' portfolios. Obviously, people have heard that models are being revised, reflecting greaterexpected frequency and increased severity of Nat Cat losses. And reinsurers are examining a variety ofgauges of exposure. They're not relying as heavily on models as they have in the past. They're gettingback to basics, looking at roof counts and wind premium. They're looking more closely at pureaggregates, and they’re looking at the key loss drivers within the models.
What this means for reinsurers is that they have to manage their available aggregate much more closely.As they are “aggregate-constrained,” they're becoming far more demanding, revisiting what they expectinsurers to do in managing their own portfolios of risk. What are insurers doing with deductibles? Howare they limiting their accumulations in coastal tier one counties? What about sub-limits for earthquakeand flood? How are they applying them and how consistent and diligent are they?
Buying reinsurance is not simply a pricing issue. Reinsurers could fill out their available aggregatesseveral times over, all with well-priced reinsurance. So, there is real differentiation that's going to takeplace, with reinsurance capacity going to those insurers whom the reinsurers consider to have the best-managed catastrophic risk portfolios.
Is hurricane risk becoming more of a certainty than a fortuity?
Is what we’ve been experiencing just another capacity-driven insurance cycle?
We’ve witnessed many cycles in the Property / Casualty marketplace over the last 20 to 30 years. Ourview is that this is not just another cycle. Take a look at the exposures, the build-up of values in US Gulfand East Coast counties through new construction and through escalation of replacement costs forexisting properties – an escalation that far outpaces the general inflation rate.
Earlier we quoted Allstate: “The potential for widespread losses due to mega catastrophes is made worseby the combination of more people living in harm’s way and the rising value of homes in disaster-proneareas. More than half of Americans now live in coastal counties, an increase of 33 million people since1980 … When you factor in that about half of Americans’ net worth is tied up in their homes, evenretirements are at risk.” We cited an observation from AIR Worldwide that “insured property values incoastal counties from Texas to Maine totaled $7.2 trillion in 2004,” and the sobering statistic from theInsurance Information Institute that the Great Miami Hurricane of 1926 would cause $130 billion indamage today.
Marketplace Realities 2006& R i s k M a n a g e m e n t S o l u t i o n s
Reinsurance Today –a Sellers’ Market
Long-Term Driversof Aggregation Risk
Sources andExamples (cont.)
What’s happened in 2004 and 2005 has therefore been a wake-up call, as insureds, insurers, reinsurers,rating agencies, model makers and investors suddenly appreciate the potential economic and insuredloss that can be sustained by one or more of these mega storms.
Can the marketplace adequately address these exposures? The long-term drivers of marketplacecapacity – those factors that influence insurers and capital providers in their determination of how muchcapital to put at risk and where it is deployed – are many and varied:• Individual and industry loss experience• Values at risk and aggregations of exposure• Implications of Nat Cat and terrorism risk exposure models• Strictures and expectations of rating agencies• Investor expectations and demands• Requirements established by regulatory authorities• Ability to achieve acceptable, sustainable premium levels• Opportunity cost of capital in other applications
Capacity available today – certainly in the quake and flood area – is lower in real dollar terms than itwas 20 years ago. Factoring in the phenomenal growth in values at risk, and the fact that the peril ofwindstorm is now being aggregated, we are experiencing what can be termed a scissors effect –dwindling supply in the face of sharply increased demand. It is clearly going to be a long-term problem,and the bottom line question is: what can clients do to manage and fund for the risk?
Larger corporations have many options at their disposal:• Paying higher premiums• Relying on the strength of their balance sheet – their ability to withstand the risk of loss• Dispersing risk through their own international operations• Investing in property risk control and continuity planning• Building assets and operations in non-Nat Cat areas• Sharing risk with others through arrangements such as joint venture operations• Sharing risk via a broader-based arrangement such as a mutual insurance facility
Obviously, if you're a less-than-large company, you have less ability to do some of these things, but theprinciples are still the same. Senior management needs to be made aware of marketplace conditions,the extent to which company assets and operations are exposed to Nat Cat risk, and the optionsavailable to mitigate, disperse and fund for Aggregation Risk in the near, medium and long term.
There’s a wise old adage that tells us a sure way to stray into the minefield of another person’s hot buttonsis to talk about politics, religion or taxes. We can probably add the role of government to that list.
There’s another bromide, one rooted in the insurance industry, to the effect that “in the long run, youpay for your own losses.”
And then there’s that great line from the pioneering economist John Maynard Keynes: “In the long run,we’re all dead.”
MR 2006: Aggregation Risk 3 • 04/06
Marketplace Realities 2006& R i s k M a n a g e m e n t S o l u t i o n s
Managing andFunding forAggregation Risk
The Role ofGovernment
Long-Term Driversof Aggregation Risk(cont.)
All too often, we don’t have the luxury of the long term, because we need to deal with the immediateaftermath of calamity. Because we need to meet the exigencies of the moment, preserve order,safeguard the economy, bolster private enterprise and foster a sense of financial security. Thus TRIA inthe wake of 9/11.
The federal government has again become the post-facto insurer of last resort in the wake of the 2005hurricanes. And there are serious efforts underway to build support for a multi-tiered private-and-publicNat Cat Insurance Mechanism.
The issues are not new ones – but they have taken on a certain poignancy and urgency because theexperience of our infant millennium compels us to think of, and plan for, a host of scenarios that we simplycould not or chose not to contemplate before. None of us can afford the comfort of the sidelines anymore.
While dealing with the near term, we need to engage the long term:• What are the risk management and funding options that you can control or influence?• Can you live with the volatility of retained Aggregation Risk?• Can you build the imputed cost of capital into your pricing model … and remain competitive?• Is mutualization of Aggregation Risk an option?• Should you join the debate regarding creation of a federal Natural Catastrophe Insurance Mechanism?
Many of us witnessed how the liability insurance crunch of the mid-1980s changed the way we retain,manage and fund for risk. Will the shortage of critical Nat Cat capacity for hurricane-prone areas changehow and where we build our businesses, our livelihoods and our lives?
Moreover, what do we hope to achieve, as individual corporate risk managers and buyers of risk transfer,and as a society?• Stability and predictability in cost of risk?• Equity amongst risk-transferring groups – equity that rests on a foundation of actuarially sound
differentiation of risks and rates-on-line?• An economic safety net for fellow citizens devastated by the sheer magnitude of events that are now
more imaginable?• A pay-as-you-go culture … or one that sanctions forward-moving intergenerational transfers of
financial liability?
We can classify such questions and counterpoints as the “super macros.” On the immediate andpragmatic level, while we’re dealing with the near term, we – all of us – are obligated to pay attentionto the instrumentation and engage the issues and decisions that will shape the structure, scope and costof capacity in the future.
That may translate into supporting legislation designed to improve and expand governmentalinsurance programs.
It could be assessing the viability of mutualization of risk – building purchasing power to developcapital solutions.
MR 2006: Aggregation Risk 4 • 04/06
Marketplace Realities 2006& R i s k M a n a g e m e n t S o l u t i o n s
The Road Ahead
The Role ofGovernment (cont.)
We at Willis will continue to meet with clients, and with insurance and financial industry leaders, toilluminate these issues and opportunities, to gain a complete and balanced view of priorities and options,and to help effect change for the better.
We look forward to hearing your thoughts on Aggregation Risk and what it means to you.
Meanwhile, Willis Client Advocates, brokers and other technical specialists are working 24/7 to obtainquality capacity and reasonable terms for client programs that are renewing in today’s challengingmarketplace environment.
Sandy VietorExecutive Vice PresidentWillis North America212 837 [email protected]
Rod ThalerNational DirectorWillis Re212 820 [email protected]
Gordon PragerDirector of Risk Management ConsultingWillis Risk Solutions NA212 837 [email protected]
MR 2006: Aggregation Risk 5 • 04/06
Marketplace Realities 2006& R i s k M a n a g e m e n t S o l u t i o n s
The Road Ahead(cont.)
Contacts
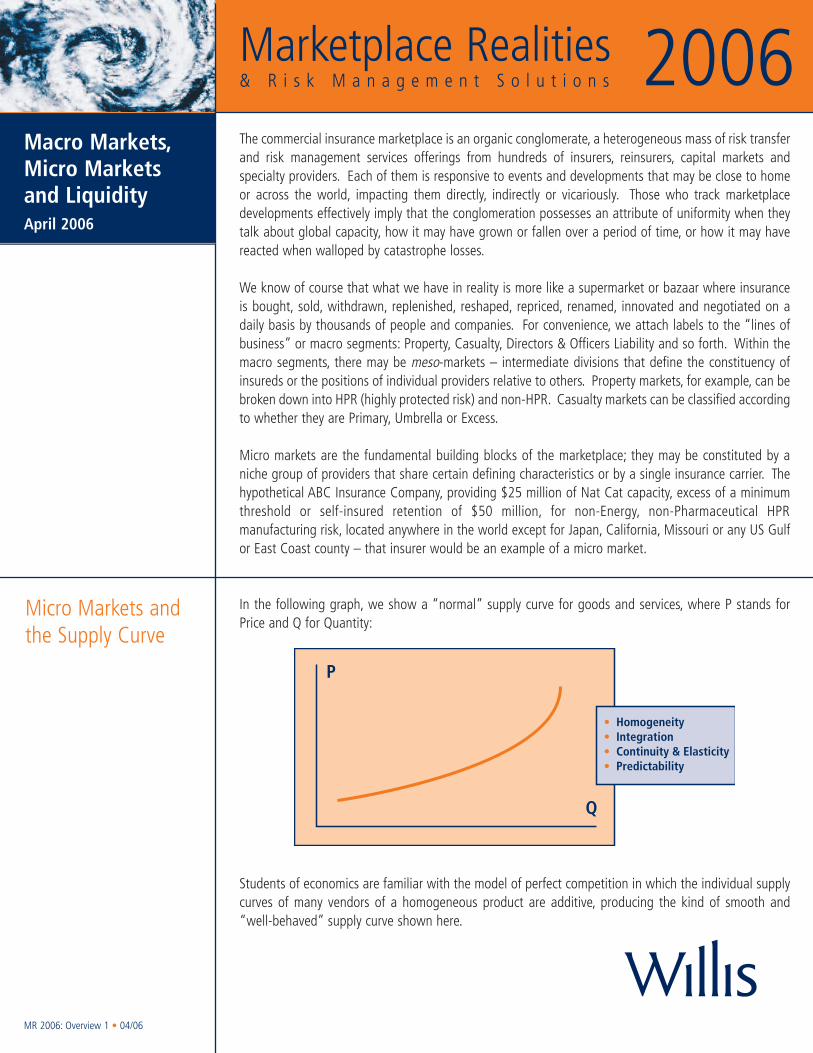
Marketplace Realities
MR 2006: Overview 1 • 04/06
Macro Markets,Micro Marketsand LiquidityApril 2006
Micro Markets andthe Supply Curve
2006& R i s k M a n a g e m e n t S o l u t i o n s
The commercial insurance marketplace is an organic conglomerate, a heterogeneous mass of risk transferand risk management services offerings from hundreds of insurers, reinsurers, capital markets andspecialty providers. Each of them is responsive to events and developments that may be close to homeor across the world, impacting them directly, indirectly or vicariously. Those who track marketplacedevelopments effectively imply that the conglomeration possesses an attribute of uniformity when theytalk about global capacity, how it may have grown or fallen over a period of time, or how it may havereacted when walloped by catastrophe losses.
We know of course that what we have in reality is more like a supermarket or bazaar where insuranceis bought, sold, withdrawn, replenished, reshaped, repriced, renamed, innovated and negotiated on adaily basis by thousands of people and companies. For convenience, we attach labels to the “lines ofbusiness” or macro segments: Property, Casualty, Directors & Officers Liability and so forth. Within themacro segments, there may be meso-markets – intermediate divisions that define the constituency ofinsureds or the positions of individual providers relative to others. Property markets, for example, can bebroken down into HPR (highly protected risk) and non-HPR. Casualty markets can be classified accordingto whether they are Primary, Umbrella or Excess.
Micro markets are the fundamental building blocks of the marketplace; they may be constituted by aniche group of providers that share certain defining characteristics or by a single insurance carrier. Thehypothetical ABC Insurance Company, providing $25 million of Nat Cat capacity, excess of a minimumthreshold or self-insured retention of $50 million, for non-Energy, non-Pharmaceutical HPRmanufacturing risk, located anywhere in the world except for Japan, California, Missouri or any US Gulfor East Coast county – that insurer would be an example of a micro market.
In the following graph, we show a “normal” supply curve for goods and services, where P stands forPrice and Q for Quantity:
Students of economics are familiar with the model of perfect competition in which the individual supplycurves of many vendors of a homogeneous product are additive, producing the kind of smooth and“well-behaved” supply curve shown here.
P
Q
• Homogeneity• Integration• Continuity & Elasticity• Predictability
MR 2006: Overview 2 • 04/06
Needless to say, it is not a depiction of today’s commercial insurance marketplace – as the behavior ofthat marketplace is more and more a product of the nature and multiplicity of its micro markets. Theforemost example is the Nat Cat risk segment of today’s Property market, a niche defined by its micromarkets. Individual carrier supply curves are discrete and targeted. For the most part, they are notadditive – there is no aggregate supply curve. In the environment constituted by such micro markets, thenature of one’s own risk is a major determinant of the dimensions of supply – capacity, breadth ofcoverage, retentions and sub-limits.
A smoothly functioning marketplace depends in good measure upon liquidity – a sufficient anddependable volume of the goods or services, so that willing buyers and willing sellers can be confidentthat at any given time they will be able to effect a transaction on reasonable terms that meet their needs.For Nat Cat perils, we no longer have that kind of liquidity; instead, we have what has euphemisticallybeen called a “capacity crunch.”
It is reasonable to ask: where will the desired capacity come from, and how much will it cost? Leavingaside for the moment the role of government as an institutional insurer or as a de facto, post-factoinsurer of last resort (as in the wake of mega-calamities such as 9/11 and hurricanes Katrina-Rita-Wilma), the risk funding / risk diversification universe has traditionally been composed of parties-at-risk,insurers and reinsurers. There is a limit, however, to the extent to which risk can be diversified in thatthree-part universe.
Mike Leybov, EVP and Managing Director of Willis Re, observes: “For further diversification, you need togo beyond reinsurance. Broader capital markets could be a good source of capacity for aggregated risk,for forming a market basket of risks, as what happens in the capital markets and what happens due tothe occurrence of Nat Cat events are not necessarily correlated.”
Capital markets solutions also require liquidity. For potential capital providers, the risk of loss must beascertainable, and the price must be right. Mike Leybov points out that as of today, however,“ theprobability of investment default risk for a Nat Cat bond is difficult to determine, and our views of it areswayed by the most recent experience. In 2004 we had an aggregation of relatively small Nat Catoccurrences. In 2005 we had the experience of the ‘large cat.’ The markets can’t get a fix on what’sreally happening. Is it random? Is it global warming? Is it human activity? Have we simply overbuiltin Nat Cat prone zones?”
The long-term solution to risk transfer capacity for Nat Cat risk may reside in the capital markets, but onlywhen such risk becomes a tradable commodity within the arena of retail mutual funds or the like.
Gordon PragerDirector of Risk Management ConsultingWillis Risk Solutions212 837 [email protected]
Marketplace Realities 2006& R i s k M a n a g e m e n t S o l u t i o n s
Liquidity andDiversification of Risk
Contact
Micro Markets andthe Supply Curve(cont.)
Willis Group
7 Hanover SquareNew York, NY 10004USATelephone: +1 212 344 8888
Ten Trinity SquareLondon EC3P 3AXUnited KingdomTelephone: +44 (0)20 7488 8111www.willis.com
Willis Group Holdings Limited is a leading global insurance broker, developing and delivering professional insurance, reinsurance, risk management,financial and human resource consulting and actuarial services to corporations, public entities and institutions around the world. With over 300offices in more than 80 countries, its global team of 15,400 Associates serves clients in some 190 countries. Willis is publicly traded on the NewYork Stock Exchange under the symbol WSH. Additional information on Willis may be found on its web site: www.willis.com.