Embed Size (px)
Citation preview
© SMAR-Azure Ltd, 2010
Contents
1. Aerodynamic Analysis
2. Aerodynamic Optimization
Oyster 100’ sailplan study
Study conducted using SA-Evolution, a SMAR-Azure technology
Boat: Oyster 100’
Sail: blade jib & mainsail
Date: November 24th 2010
Responsible: Sabrina Malpede
© SMAR-Azure Ltd, 2010
1. Aerodynamic Analysis
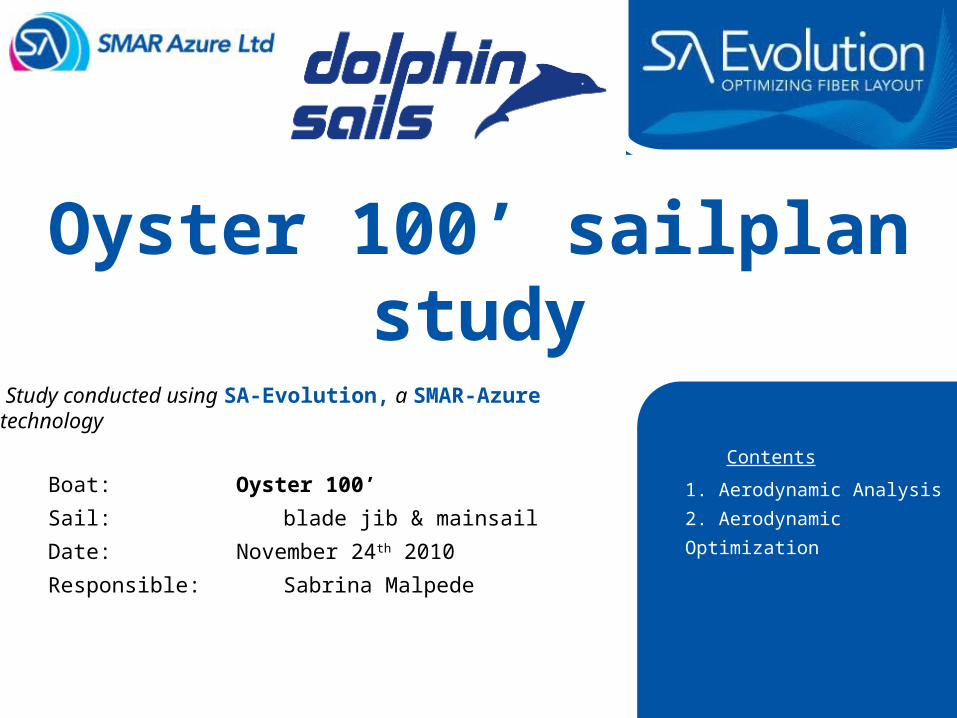
INPUT DATA Design shapes provided by Dolphin Sails
True wind speed 12 kn
Target TWA 43.3°
Target BS 8.93 kn
Heeling angle 10°
Sheeting angle 12.3° jib / 2° main
RESULTS Thrust 11690 N
Side force 48020 N
Heeling moment 894.7 kNm
Thrust Coefficient 0.40
Side Coefficient 1.64
Thrust / Side Ratio 0.24
Notes Sails are flying at appropriate angle of attack Foresail is developing higher forward thrust
Pre
ssu
re d
istr
ibuti
on
© SMAR-Azure Ltd, 2010
2. Aerodynamic Optimization Results
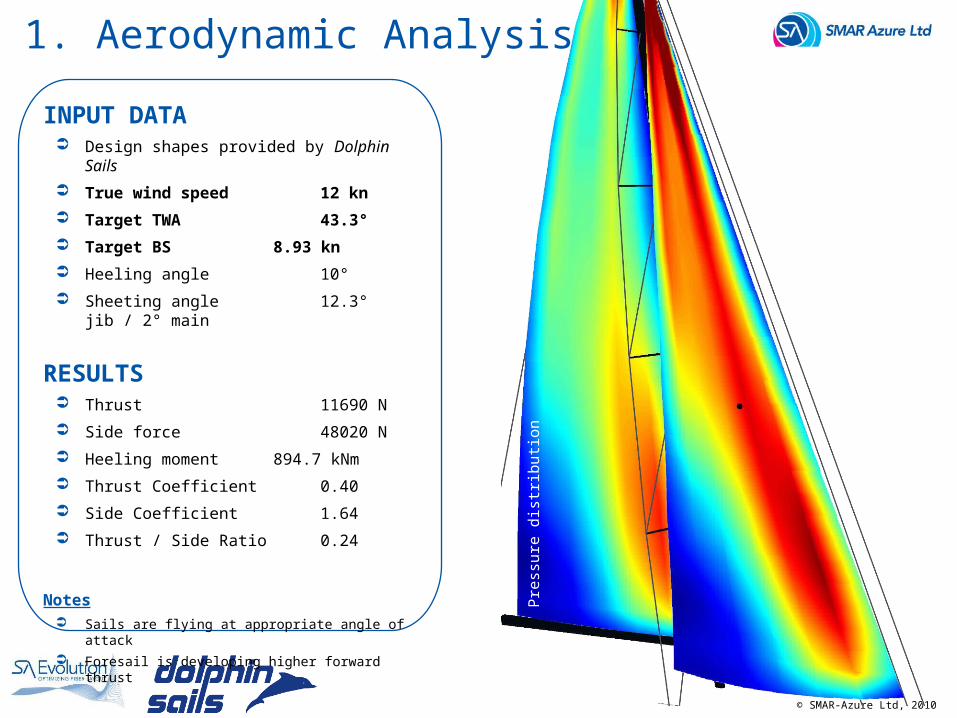
INPUT DATA Target sailing course at 12 TWS (see previous slide)
Sheeting and heeling angles have been kept fixed
Jib design shape Twist and maximum camber has been evenly reduced throughout the
foresail
Mainsail design shape Twist has been slightly evenly increased, while camber has not been
changed
RESULTS Thrust 12620 N +8.0%
Side force 46770 N - 2.6%
Heeling moment 865.6 kNm - 3.3%
Thrust Coefficient 0.43 +8.0%
Side Coefficient 1.59 - 2.6%
Thrust / Side Ratio 0.27 +13%
Conclusions Even if the thrust is increasing considerably, the side force and the heeling moment
are decreasing instead, allowing a much higher overall efficiency of the sailplan