Embed Size (px)
Citation preview
CORRELATES OF LEARNING DISABLED STUDENTS’
. SOCIAL ACCEPTANCE IN MAINSTREAM CLASSROOMS ·
bvJane Marie Keppel .
Thesis submitted to the Faculty of the
Virginia Polytechnic Institute and State University
in partial fulfillment of the requirements for the degree of
MASTER OF SCIENCE
ACORRELATES OF LEQRNING DISABLED STUDENTS’
SOCIAL ADJUSTMENT IN MAINSTREAM CLASSROOMS
Jane Marie Keppel ‘
Committee Co-chairpersons:
Thomas H. Ollendick and Caryn L. Carlson
Department of Psychology
(ABSTRACT)l
The present study investigated the social status of
learning disabled (LD) students among their non-LD peers
and explored how their social acceptance related to
personal attributes, behavioral characteristics, and
social information processing. Subjects were EE white,
third through fifth grade LD students and 347 of their
non-LD classmates. Results showed that on a play rating
scale, but not on a peer nomination measure, the LD group
was rated lower than non-LD students. In addition, more
LD than non-LD students were found to be rejected;
however, LD students were equally represented in the
popular, neglected, and controversial sociometric status
categories. LD students wake also found to be less well
known than controls. Acquaintance ratings correlated
highly with friendship ratings and moderately with peer
nominations, suggesting that being less well known was
sxgnificantly related to being rated as an undesirable
playmate. '
Although LD students were perceived by peers as less
physically attractive, less academically skilled, and
less socially skilled, as a group, these findings appear
to be clouded by the effects attributable to the low
status LD children. within the LD group, high social
status children did not differ significantly from
controls on dependent variables.
Multiple regression analyses showed that peer
ratings of physical attractiveness were most predictive
of peer nominations (multiple R square=.50>, whereas
athletic ability was found to predict 85% of the variance
in friendship ratings. Social information processing
deficits were not predictive of social acceptance.
Results suggest that special skills or attributes appear
to provide a boost needed for general social acceptance
of LD students.


TABLE ÜF CONTENT5 _7
Acknowledgements ivINTRDDUCTION ......................................... 1
METHÜD................................................ 17
RESULTS..............„....’............................ EB
DISCUSSION............................................ 42
TABLEB................................................ 56
REFERENCES............................................ 70
APPENDIX A: Criteria for eligibility ................. 75
APPENDIX B: Teacher rating scale......................‘76
APPENDIX C: Sociometric and acquaintance ratings...... 7B
APPENDIX D: Peer evaluations.......................... 79
APPENDIX E: Teacher evaluations....................... B1
APPENDIX F: Classification orocedure.................. B3
VITA.................................................. B4
· vi
‘ INTRODUCTION
The adjustment of handicapped children to mainstream
classrooms has been of major concern to educators and
other professionalssince the passage of Public Law 94-
142, The Education for All Handicapped Children Act ofl
1975. This legislation mandated the education of
children with handicaps in "least restrictive
environments". According to several sources, the basic
principle underlying this regulation was that handicapped
students could benefit educationally and socially from
observing and interacting with non-handicapped students.
In addition, it was hoped that non-handicapped children
would become more sensitive to their handicapped peers _
and would develop more positive attitudes towards them.
Kaufman, Gottlieb, Agard, and Kukic (1975) stated more
specifically that the legislation was anticipated to
enhance the social status of handicapped children among
their non-handicapped peers.
Despite its original intent, many individuals
maintain that P.L. 94-142 has resulted in what Gresham
(1992) calls "misguided mainstreaming". Specifically,
placing handicapped and non-handicapped students together
does not necessarily result in the increased social
acceptance of handicapped children. Sociometric
1
E
techniques, designed to investigate the social status of
particular groups, have long been used by researchers to
study the peer relations of children and adolescents. In
a review of social perception literature, LaGreca (1981)
reports that one group of handicapped children, the
learning disabled, are consistently rated lower on
indices of social acceptance and higher on measures of
peer rejection than their nondisabled peers.
In the first and probably the most frequently cited
study on the topic, Bryan (1974) reported that third,
fourth, and fifth grade LD children were significantly
less accepted and more socially rejected than their
classmates (matched for sex and race). Measures used to
determine this relationship included a combination of
sociometric techniques: a) positive nominations of three
classmates as friends, classroom neighbors, and invitees
to a birthday party (Moreno, 1960, cited in Bryan 1974);
b) negative nominations of three classmates who are not
friends, not neighbors, and not invitees to a birthday
party; and c) the Guess—who Technique in which children
provide nominations for positive and negative items such
. as, "who finds it hard to sit still in class?, who is
always scared?, and "who is handsome or pretty?" (Bryan
1974, p.3E). The results indicate that LD children
3
received fewer social attraction nominations and a
greater number of votes indicating social rejection.
A year after this study, Bryan (1976) replicated her
results using 25 of the original LD fourth and fifth
graders. She found that LD children again received a
greater number of negative nominations and fewer positive
nominations. These results led her to conclude that the
relatively poor social status of LD does not appear to
change substantially over time, even when the children
are placed with a predominantly new group of peers.
Other research has led to the conclusion thatrelatively low social acceptance is common among thee
learning disabled (Bruininks, 1978; Garrett & Crump,
1980; Horowitz, 1981; Siperstein, Bopp & Bak, 1978). In
one study, 100 LD students were randomly selected from
the 350 children enrolled in the school system’s LD
program, and compared to a group of 100 non—LD subjects,
matched for sex and classroom assignment, on "Guess who"
positive and negative nominations (Garrett & Crump,
1980). As found by Bryan (197Q, 1976), LD subjects
received a significantly lower social status score than
non-learning disabled subjects. Similarly, Siperstein et
al. (1978) found that LD students occupied a less popular
social position than other fifth and sixth grade children
‘• ywhen compared on same-sex positive nominations.
However, a closer examination of these studies
suggests that several qualifications must be made about
their conclusions. For example, the Siperstein et al.A
(1978) data reveals that although LD students were never
among the most popular, or what the author refers to as
social "stars", the prevalence of LD children among the
"isolates" (i.e., nominated by one or no peers) was
similar to that of other children. Thus, while less
popular, LD students were not found to be overlyQ
I represented as social isolates. Furthermore, Horowitz
(1981), who found LD students to be lower on a
sociometric ranking measure, qualified the results of her
study by noting that statistically significant
differences between LD and non-LD samples were found only
when there was no statistical control for the
significantly lower intelligence scores of LD versus non-
LD children. when an analysis of covariance was used to
control for intelligence, no significant differences were
noted between the two samples.
ln addition, two peer-nomination studies (Bursuck,V
1983; Prillaman, 1981) failed to support the conclusion
that'LD students are less likely to be accepted and/or
more likely to be rejected. Prillaman (1981) examined
5
the social status of 362 students (grades 1-6), 28 of
whom were learning disabled and receiving resource room
intervention, but who were mainstreamed into regular
classrooms during part of the school day. when the
social status of the 28 LD students was compared on a
positive nomination measure to that of the remaining non-
LD children, no significant differences were found forA
social acceptance at any of the age levels. In direct
contrast to Siperstein et al. (1978), chi square analyses
showed no group differences between the number of
"stars", but found 32% of the LD sample in the "isolate"
category, as compared to 16% of the non-LD sample. The
Prillaman (1981) findings indicate that a greater
percentage of LD students are social isolates, as they
are less likely to receive positive nominations, but the
author points out that the results do not necessarily
suggest that the group is rejected. Isolation is not
equivalent to rejection, nor is rejection required for
fewer nominations. Isolation reflects few poitive
nominations, whereas rejection reflects active dislike,
which is measured by negative nominations or ratings of 1
on a 1 to 5 scale. Furthermore, Prillaman concludes that
the results do not support the hypothesis that LD
children rate significantly lower in terms of popularity
6
and are all more rejected by their peers. Rather, some
LD students may in fact be as accepted by their peers as
those who are not classified as LD.
In another study, Bursuck (1983) asked students to
indicate classmates whom they "especially liked". Using
a comparison group of low-achieving students (matched on
classroom and reading achievement), no significant
differences in the peer-nomination scores of LD students
were found. The findings suggest that LD students are
not less popular, compared to other students who are
experiencing academic problems. In this case,
achievement, not handicap, may be mediating the reported
differences in the social status of LD and non—LD ”
children.V
In addition to studies which utiliied peer
nomination measures, a few studies (Bruininks, 1978;
Bruininks, Rydners, & Gross, 197ä; Bursuck, 1983; Coben &
Zigmond, 1986; Perlmutter, Crocker, Cordray, and
Garstecki, 1983) have used other kinds of sociometric
techniques to compare the social standing of LD students,
with similarly contradictory findings. For example,
Coben and Zigmond (1986) found that LD students were less
accepted, but not more rejected, when compared on the How
I Feel Towards Others (HIFTO) rating scale (Agard,
7
Velman, Kaufman, & Semmel, 1978 cited in Coben & Zigmond,l
1986). This instrument requires each student in a class
to rate all others in the class by choosing one of four
faces indicating a) acceptance b) indifference/tolerance
c) rejection d) do not know. Using a 1 to 5 rating
scale, on which children indicated how much they liked to
play with the other children in their class, Bursuck
(1983) found that children did not discriminate against
LD children. There were no significant LD vs non-LD
group differences. Also on a 1 to 5 rating, high school
aged LD students, as a group, were found to be less well
liked than non-LD students, however, a subgroup of the LD _
high school students were very well regarded by their
classmates. Additionally, most of those LD students who
were not very well liked were rated neutrally, rather
than in the disliked range (Perlmutter et al., 1983).
Thus, sociometric data provided by peer ratings
appear to be less conclusive about the social status of
LD students among their non-LD peers. Inconsistencies in
the data may in part be due to differences in sociometric ·
techniques. whereas peer nominations tend to measure
high priority friendships, peer rating scales tend
towards a more general acceptance dimension of likability
(Asher & Taylor, 1981). Because of this distinction, it
8
is possible that a rating scale measure would reveal a
more positive picture than a nomination sociometric with
respect to LD children. These children may be less
likely to be nominated as best friends, hence the
relatively weak social status of LD children found with
peer nominations measures, but they may not necessarily
be more disliked. The studies may indicate that they
simply are not popular enough to be nominated.
Another explanation for the low social acceptance of
LD children when it is reported in the literature is that
they may be less well known than their classmates; this
anonymity might be expected to influence nominations more
than ratings. Coben and Zigmond (1986) report findings
suggesting that this is an important variable in social
status. Specifically, the HIFT0 rating scale results
revealed that LD students were not only less well
accepted but they were significantly less well known than
their non-LD classmates. They found that with peer
nominations, LD students were less likely to be accepted
ggg less likely to be rejected. Furthermore, the authors
suggest that other studies that report the low
sociometric status for LD children may reflect anonymity
rather than true peer rejection.
lt is difficult to draw firm conclusions about the ·
~
social status of LD students in mainstreamed environmentsi
from the studies reviewed. In their review of the
literature, Dudley—Marling and Edmiaston (1985) conclude
that a re—evaluation of LD students’ social adjustment
may be necessary. Moreover, sociometric studies do not
provide information on the type of problems the child is
experiencing. while it is generally accepted (albeit
controversial) that young LD children are not as well
regarded as their nondisabled classmates, much less is
known about the reasons behind this phenomenon. In
discussing social status generally, Foster and Ritchey
(1979) strongly suggest that social acceptance is a '
function of a number of variables, including the child’s
physical attractiveness; his/her special skills,
especially athletic ability; academic competence; and
social skills. A review of the findings of some of these
studies, with an emphasis on those examining these
factors for LD children follows.
Numerous attributes have been evaluated in
attempting to explain low sociometric status in children.
One of the most researched variables is physical
attractiveness. ln an early investigation of factors
that influence popularity, Young and Cooper (19QA; cited
in Asher, Oden, & Gottman, 1977) found that a child’s l
10
facial appearance was correlated more highly (with
sociometric status) than 89 other variables examined.
Similarly, physical attractiveness has been found to
influence peer perceptions of social behavior. Dion &
Bersheid (1974) found nursery school children attributed
more antisocial behavior to their less attractive peers
and more self—sufficient and independent behavior to
their more attractive counterparts. Additionally, the
authors report that unattractive children were relatively
less popular than attractive children. ‘
Athletic ability, as well as physical
attractiveness, has also been found to be important in
social status among children. Siperstein et al. (1978)
collected same-sex nominations for the best athlete, the
best looking, and the smartest child in several fifth andsixth grade classes. They found that the LD children
were less popular and were not nominated among the
smartest in the class. However, in athletic ability and
physical appearance factors, an equal proportion of LD
and non-LD children received nominations-—with a tendency
for the best—liked LD children to be nominated as good
athletes. The correlation between physical appearance
and social status was the strongest; however, both
athletic and academic abilities also correlated
11
significantly with social status. Combined, the three
V characteristics accounted for more than 35% of the
variance in sociometric nominations.
In other studies, the academic achievement of
children has also been found to relate to a child’s
social status. Bursuck and Asher (1986) found that
children who were low in both achievement and sociometricstatus, based on peer ratings, did more poorly on
measures of social behavior than did low—status, higher-
achieving students. Green, Forehand, Beck and Vosk
(1980) found significant relationships between positive
peer nominations, negative nominations, and peer ratings
of academic achievement. Specifically, children who were
high on academic achievement were more accepted and less
rejected, as measured by nominations and less disliked,
as measured by low ratings. In the same study, teacher
_ ratings of classroom behavior, using the Conners Teacher
Rating Scale (Conners, 1969), indicated that children who
were disliked and rejected by peers were also viewed
negatively by their teachers. Perceived misbehavior and
academic incompetence, as measured by the HIFT0 and Guess
who sociometric measures, were also found to be related
to the social acceptance of mainstreamed mentally
retarded children in another study (Gottlieb, Semmel, &
12
Veldman, 1978). Peer and teacher perceptions of EMR
pupi1s’ cognitive ability, which were significantly
correlated with each other, significantly predicted their
social acceptance. ·
Children’s social status has also been shown to
correlate with their social behavior. Numerous studies
which have examined children’s social status as a
function of their social behavior have found that
unpopular children tend to be less prosocial and more
aggressive than their more popular classmates (Carlson,
Lahey, & Neeper, 1984; Ollendick, 1981; Coie, Dodge, &A
Coppotelli, 1982; Dodge, 1983; Putallaz & Gottman, 1981).
Using positive and negative nominations, Carlson et al.
(1984) found rejected second and fifth grade children to
be viewed by their peers as exhibiting more aggression
and acting-out behaviors. Hutton and Roberts (1982)
found a significant relationship between the sociometric
status of first, third, and fifth graders (as measured by
peer nominations) and teacher ratings of school behavior.
The most robust correlation (r=.72) indicated that
students who were rated as exhibiting the highest number
of aggressive behaviors were also those nominated by
peers as children by whom they would least like to sit.
Recently, a social—cognitive model has beenV
13
developed to explain the relationship of social cognition
to social behavior, particularly aggressive behavior in
normal children. Dodge (1986) proposed a social
information—processing (SIP) model to desribe how
children process social information in sequence in order
to respond competently in social situations. According
to the model, the first step of processing is to encode
accurately the relevant social cues in the environment.
The second step involves a mental representation of these
encoded cues and an accurate interpretation of them. The
third step requires the generation of a response
repertoire, from which the child can access possible
behavioral responses. The fourth step is response
evaluation and choice-making. And finally, when a choice
has been made, the fifth step of processing, is enactment
of the chosen behavior.
Dodge (1986) purports that each stage of the model
is related both independently and collectively to
patterns in social behavior. In a test of the model,
Feldman and Dodge (1987) administered an interview in
which children responded to a situation in which they
were teased by their classmates. This situation had been
identified by teachers as particularly problematic for
boys and girls. In their sample of 95 girls and boys in
14
the first, third, and fifth grades, the authors found
that relative to average and popular peers, unpopular
children more often interpreted peers in this situation
as being hostile, they generated fewer competent and more
aggressive responses to it, and they evaluated aggressive
responses presented by the examiner as being more
acceptable. Differences between status groups were,
however, not found in group entry or ambiguous
provocation situations.
As LD children have often been found to be less
socially accepted and/or overly represented in socially.
rejected groups, they may also exhibit some of the social
information processing deficiencies found in the rejected
non-LD children interviewed by Feldman and Dodge (1967).
It seems plausible that LD children may be more at risk
for social information processing difficulties, due to
their cognitive processing deficits. If so, the SIP Vmodel could potentially add much to the explanation of
the social experience of LD children.
In summary, the sociometric status of LD children
may be lower than that of non-LD peers. However, there
are some inconsistencies in the literature relating tok
how sociometric status is measured and how best to
interpret these discrepant findings. Additionally, some
15
evidence suggests that social status may be influenced by
how well-known the LD students are among their
classmates, a factor that has seldomly been acknowledged.
Even if one accepts that LD students are less popular,
little is known about the determinants of the low status.
variables which have been found to influence status in
"normal" populations (social skill, physical
attractiveness, athletic ability and academic
performance) have not been fully explored for LD
children. —
The present study attempted to add to the current
literature concerning the social status of LD students
and to explore additional factors which might relate to
social acceptance in mainstream classrooms. First, the
V relative social status of learning disabled children, who
receive services in an LD resource classroom, but who
. spend at least some portion of their school day inV
regular classrooms, was compared to their non—learning
disabled peers. It was expected that LD children would
be significantly lower than their non·LD peers when
compared on nomination sociometric measures but not when
compared on sociometric ratings. A measure of how well
the LD children are known was also collected to assess
their classmates’ familiarity with them. This
16
acquaintance score was hypothesized to be highly
correlated with both sociometric variables.
Secondly, variables that might predict social
adjustment in the mainstream classroom were examined,
looking specifically at factors associated with physical
attractiveness, athletic ability, academic performance,
and social skill. These factors were assessed with both
peer and teacher ratings in an LD sample and were
anticipated to add significantly to the prediction of
sociometriclstatus.
Finally, in order.to assess the cognitive components
of learning disabled students’ social behavior, an ‘
A exploration of Dodge’s (1986) model was conducted to
determine the extent to which LD children’s ability to
process social information was related to sociometric
status. Dodge’s (1986) four processings steps were
assessed in the manner described by Feldman and Dodge
(1987). Consistent with their findings, lower status
children were expected to show deficiencies in social
information processing. Thus, the four social
information processing steps were expected to add
independently and collectively to the prediction of
social status of LD children. _
METHDD
Subjects
A group of 22 learning disabled third, fourth and
fifth grade children (17 boys and 5 girls) from three
southwestern Virginia public elementary schools served as
the subjects of primary interest in this study. The
children were all caucasion and ranged in age from 8 to
12 years, with a distribution as follows: one eight year-
old, six nine year-olds, seven ten year-olds, four eleven
year-olds, and four twelve year-olds, As there were
typically only one or two LD children in a classroom, the
subjects represent fifteen different classrooms;
approximately five classrooms (7 children) from each
school. Out of a total of 32 children invited to
participate, the subjects represent 68% of the LD
children of this age group. Approximately 18% (n=6) of
the parents of LD children did not respond to letters
requesting their permission for their child’s
participation in the study, while 13% (n=4) of the
parents refused to grant permission.
Learning disabled students were identified by
criteria specified by the school system (see Appendix A).
On the average, these children had been labeled learning
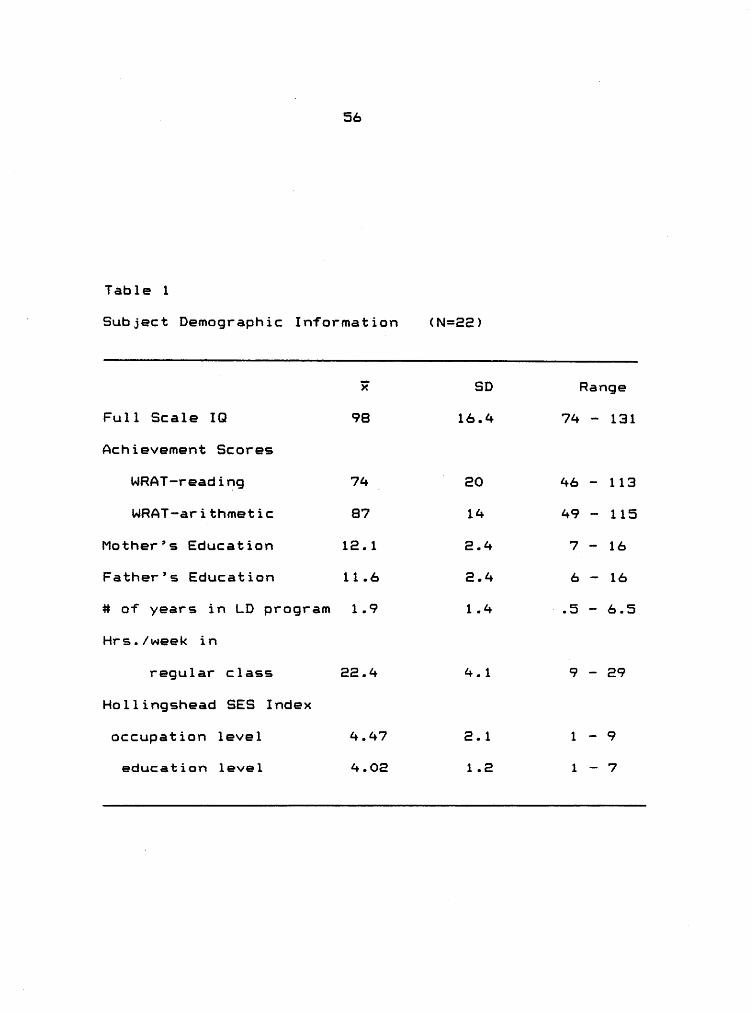
disabled for approximately 2 years (x=1.9, SD=1.4) and
17
18 .
spent approximately 22 hours (x=22.4, SD=4.1) out of 30
hours per week in mainstreamed classrooms. Their mean
full scale IQ, as measured by the weschler Intelligence
Scale for Children-Revised or the Stanford-Binet
Intelligence Scale, was 98 <SD= 16.4); mean maternal and
paternal education levels were 12.1 and 11.6 years,
respectively. Using the Hollingshead Socioeconomic
Index, the following distribution was found on the
occupation levels: six parents at levels 1 and 2, 13 at
level 4, 2 each at levels 5-8, and 1 parent at level 9.
On the education levels, 1 parent was scored at level 1,
2 at level 2, 9 at level 3, 20 at level 4, 4 at level 5,
5 at level 6, and 1 at level 7 (Hollingshead, 1975). A
summary of demographic information is presented in Table
1.
Insert Table 1 about here
Conner’s Teacher Rating Scale (CTRS) subscale scores
(Conners, 1969) indicate that this LD sample, as
perceived by regular classroom teachers, exhibitsl
slightly more problem behaviors relating to conduct,
inattention and anxiety, than were identified in a normal
sample of children of similar ages, as scores fell
19
between one and two standard deviations above normative
means. Scores on the hyperactivity subscale did not
exceed the norm (werry, Sprague, & Cohen, 1975) (see
Table 2).
Insert Table 2 about here
Sociometric data and peer and teacher ratings were
collected for the classmates of these LD children in
order to provide relevant non—LD comparisons. The total
control sample consisted of 3#7 children (172 boys and
175 girls). These children were members of regular
academic classrooms into which the LD students were
mainstreamed.
Procedure
After obtaining permission from school
iadministrators and classroom teachers, all LD and non—LDu
students completed the group administered sociometric
assessment, conducted by a graduate student in
psychology. Following completion of the sociometric
rating, peer ratings of academic achievement, athletic
ability, physical attractiveness, and social skill were
obtained.
· EOOn the same day, regular classroom teachers were
asked to complete ratings of academic achievement,
athletic ability, physical attractiveness, and social
skill on all class members, as well as the Conners
Teacher Rating Scale (CTRS) (see Appendix B).
In the second phase of the study, each of the
learning disabled children were individually interviewed
in the manner described by Feldman and Dodge (1987). The
social information processing (SIP) interviews were
audiotaped and required about 80 minutes to complete. As
a few parents granted permission at the close of the l
school year, several subjects completed the interview
outside of the school setting. One LD subject was unable
to be interviewed due to family relocation, thus reducing
the sample size to 81 in all SIP analyses. The rest of
this subject’s data was collected and is included in the
other analyses.
Measures
Peer friendshig ratings. Peer ratings of each child
in the mainstreamed classroom were gathered using a class
roster listing every child’s name. All children were
asked to respond on a 1-5 (1=not at all, 2=a little»
3=some, 4=quite a bit, 5=a lot) scale to the question
E1
"How much do you like to play with ?" for each
member of the class. Faces ranging from a frown to a
smile accompanied the scale to help communicate the
meaning of each of the numbers (see Appendix C). The
scale was explained using examples of food (e.g. "How
much do you like ice cream?"). Confidentiality was
explained and students were encouraged not to disclose
their answers to others.
An average sociometric rating of each student, by
both same and opposite—sex classmates, was obtained and
converted to ; scores within each classroom so that
standard cross—classroom comparisons could be made._
9oth—sex ratings, which have been shown to be moderately
correlated to same-sex ratings (Asher & Hymel, 1991),
were used to ensure that each target child’s average
rating was derived from a sufficiently large and
representative pool of raters.
Rating scale sociometrics have been shown to have
good test-retest reliability over a 6-week period (r=.94)
(Oden & Asher, 1977) and have also demonstrated
concurrent and predictive validity (Asher and Taylor,
1991). The standardized ratings reflect each child’s
general acceptance or likability among his or her
classmates.
88
Peer nominations. On the same class roster,
children were asked to circle the names of three
classmates with whom they "would like to play with the
most". The total number of nominations received for each
child was used to indicate peer popularity; these scores
also were standardized across classrooms. Nomination
measures have been found to be reliable and valid,
however, test-retest reliability coefficients are found
to be somewhat lower than those for sociometric ratings
(ranging from .67 to .84), with higher correlations
occurring in the older elementary school grades (Asher
and Taylor, 1981).
Peer acguaintance. ‘Fo1lowing these sociometric
procedures, children were given another class roster and_
asked to rate how well they knew each of their
classmates. Again, a 1 to 5 point rating scale was used
(1=not at all, 8=a little, 3=some, 4=quite a bit, 5=a
lot) (see Appendix C) from which standard scores were
computed. This information was obtained to determine the
extent of children’s familiarity with their classmates.
Peer ratings of Personal Characteristics. Students
in the mainstream classrooms rated their peers’ academic
achievement, physical attractiveness, athletic ability,Vand social skill on 1 to 5 rating scales (see Appendix D
E3
for specific directions).
Teacher ratings of Personal Characteristics.
Similarly, teachers in the mainstream classroom rated the
children’s academic achievement, physical attractiveness»
athletic ability, and social skill (see Appendix E).
Social Information Processing Interview. A
cognitive measure of social information processing was
collected following the procedures of Feldman and Dodge
(1987). The E1 LD children were asked to provide four
kinds of responses to a social situation, corresponding
to four of the five information processing steps (steps E
through 5) proposed in Dodge’s model (1986). The
scenerio presented involves a situation where a child is
being teased by some of his or her classmates. This
particular situation was found to produce significant
differences between high and low status children in the
Feldman and Dodge (1987) study.
The following protocol illustrates the procedure. A
female narrator told the following hypothetical situation
(presented on audiotape, in conjunction with cartoon
visual aids) involving peers who were the same gender as
the subject. The scene read as follows:
"Pretend that you come to school one morning allI
dressed up because you have to go out with your parents
84
right after school. when you walk into your classroom
you see two girls (boys) whom you know, and they are
looking at you and laughing".
Following this story, the subject was asked to
interpret the intentions of the children involved in
thesituation,answering the question "why do you think the
girls (boys) are laughing?" (step E of processing). The
subject’s responses were scored as 1 if the
interpretation failed to ascribe hostile intent or as a 8
if the interpretation denoted hostile intent.
Next, the subject’s response repetoire (essential to
step 3 processing) was assessed by asking the subject to
generate as many responses as possible to solve the
hypothetical problem (e.g., "Now you really want them to
stop laughing, so what could you do? what else could you
do? what else could you do? what else could you do?").
These responses were transcribed and categorized,
according to content (competent, aggressive, passive,
withdrawn, or appeal to authority) by two adult coders.
Following the method of Feldman and Dodge (1987), three‘ measures of this stage were coded: (1) the number of
solutions generated, (8) the proportion of solutionsi
generated that were rated by the adult coders as
competent, and (3) the proportion of solutions generated
35
that were rated as aggressive.
The subject’s response evaluation tendencies (step
4) ware assessed independently of the responses s/he
generated by presenting to the subject each of five
possible responses to the situation (generated by Feldman
& Dodge, 1987). The responses were as followss (1)
competent (E) aggressive, (3) passive-ineffective, (4)
withdrawn, or (5) appeal to an authority figure for
intervention. The script read as follows:
"Now I am going to tell you some things that you
could do when this situation happens to you. Here is one
thing; you could ignore them and not pay any attention to
them (passive). what would happen if you ignored them?
Do you think they would stop laughing? Here is another
thing: You could get really mad and hit them ·
(aggressive). what would happen if you hit the girls
(boys)? Do you think they would stop laughing? Here is
another thing: You could walk away from the girls (boys)
and feel really bad because you thought they were
laughing at you (withdrawn). what would happen if you
walked away: Do you think they would stop laughing?
Here is another thing: You could ask them why they are
laughing and could explain to them why you were dressed
up (competent). what would happen if you asked the girls
86
(boys) why they were laughing? Do you think they would
stop laughing? Here is another thing: You could tell
the teacher that the girls (boys) are laughing (appeal to
authority). what would happen if you told the teacher? _
Do you think they would stop laughing?"
The subject’s evaluation of each response was coded
according to whether the subject indicated the response
was (1) likely to be ineffective in solving the problem
or (8) likely to be effective. Consistent with the
procedures of Feldman and Dodge (1987), subjects’
evaluations were judged to indicate a strategy would be
ineffective if any portion of the response suggested a
negative outcome (e.g., getting sent to the principal’s
office). A postive (effective) evaluation was indicated
by complete endorsement of a particular response.
A second rater (blind to the subject’s sociometric
status) was used to compute reliability of the scoring of
the above three processing steps. The audiotaped
responses of a random sample of 11 subjects yielded
Pearson correlation coefficients of r=1.0 for steps 8 and
4 and r=.86 for processing step 3.
Lastly, to assess the subject’s enactment skills
(step 5) independently from the responses that he or she
generated, the subject was asked to role—play a competent
87
response presented by the experimenter: "One thing that
some girls (boys) might do when they want somebody to
stop laughing is to ask them why they are laughing. Show
me how you could do that."
The subject’s enactment was rated by the
experimenter on a 5—point scale (5= incompetent, 1=
highly competent) assessing the overall competence of the
role-play. Another rater observed half of the SIP
interviews and provided ratings of the fifth processing
(enactment) step. A Pearson correlation coefficient of
r=.9O reflects the inter—rater reliability on the 5 point
Likert scale. It should be noted that Feldman and Dodge
(1986) did not utilize two independent raters for.“
processing step 5, as they used audiotapes as the sole
„ means of computing inter-rater reliability. Since much
non—verbal information cannot be obtained via audiotapes,
the additional reliability was deemed necessary in the
present study.
RESULTS
Data were analyzed in the following steps: 1> Chi
square analyses were used to compare the distribution of
sociometric status (SMS) groups among LD and Non-LD
children; 8> analyses of variance were conducted toA
examine differences between the two groups on both
criterion and predictor variables; 3> Pearson
correlations were calculated to further describe
relations between variables; 4> regression equations were
completed separately for LD and non-LD groups to identify
variables predictive of SMS.
Distribution of Sociometric Status —
For descriptive purposes, the Asher and Dodge (1986)
categorization procedure that combines nomination and
rating procedures (see Appendix F for detailed
description) was used to obtain the distribution of
status within the LD and non-LD samples. This
categorization method has been found to be particularly
valid in identifying rejected children (Asher & Dodge,
1986; Ollendick, Greene, Hicks, Knowles, Francis, & Baum,
1988).
Table 3 shows the percentage of children from both _
groups in each of the status categories. For the Chi
square analyses, the distribution of LD and non-LD within
88
E9
the popular, average, neglected and controversial status
groups was found not to be significantly different
(p>.O5). However, there were significantly more rejected
LD children (32%) than rejected non—LD children (13%) (gz
(1)=b.55, p<.O2).
Insert Table 3 about here
Sociometric Status of LD and Non·LD Children
A multiple analysis of variance (MANOVA) was
computed to examine the effect of group (LD or non—LD) on
the pattern of sociometric status, acquaintance, peerl
rating and teacher rating variables. As the MANOVA
indicated significant group effects (F(11,352)= 1.97,
p<.O3>, individual analyses of variance were conducted to
compare the ratings of the learning disabled children to
their non—LD peers on each of the criterion and predictor
variables.
The results of comparisons of the criterion
variables indicate that LD children differed from non-LD
children on play and acguaintance ratings, but they did
not differ in terms of peer nominations. Standardized
play ratings of LD children (z=—.39) were significantly
lower than that of their non—LD peers (z=.OE>,
30
F(1,362)=3.93, p<.05. Similarly, acquaintance ratings of
the LD group <z=-.48) were significantly lower those for
the non-LD group (z=.08), (F(1,362)= 5.89, p<.01). On
standardized peer nominations, however, LD children (z=-
.27) were not significantly different from non-LD
children (z=.02), (F(1,362)= 1.90 p<.16), although a
marginal trend was evident.
Comparisons of LD and non-LD ratings on the
predictor variables of social skill, athletic ability, „
physical attractiveness, and academic performance wereM
—completed separately for the peer and teacher ratings.4
As shown in Table 4, peer ratings of social skill5
(F(1,362)=6.87, p<.009), physical attractiveness
<F(1,362)= 4.76, p<.02), and academic performance
(F(1,362)= 16.0, p<.0001) were found to be significantlyl
lower for LD than non—LD groups. A comparison of peer
ratings of athletic ability (F(1,362)= .95, p<.33),
however, did not yield significant group differences.
Teacher ratings of the same four predictor variables
revealed that teacher perceptions of physical
attractiveness (F(1,362)= 1.65, p<.20) and athletic
ability (F(1,362)= .97, p<.32) were not significantly
different for the LD children than they were for the non-
LD children. However, teacher ratings of academic
31
performance tF(1,362)= 6.91, p<.0O9) and social skill
(F(1,36E)= 10.44, p<.001) were found to be significantly
higher for nonÄLD children (see Table 4).
Insert Table 4 about here
Comgarisons of High and Low Social Preference Grougs
Based on sociometric ratings and nomination scores,
LD students were divided by a median split into low and
. high social preference rating groups based on the
description Asher and Dodge (1986) (see Appendix F).
Essentially, social preference is determined by
subtracting the number of "1" ratings from the number of
positive nominations. A MANOVA was computed to examine
the effect of group on the pattern of composite peer,
teacher and SIP variables. Because the MANOVA barley
missed statistical significance <F(3,17)= 3.07, p<.056),
a conservative approach to conducting followup analyses
was taken. Composite peer, teacher, and SIP scores were
compared prior to comparing individual peer, teacher, and
SIP items as a means of reducing the chances of making
Type 1 errors. These analyses revealed significant
effects for peer (F(1,19)= 7.45, p<.01), but not teacher
(F(1,19)= 1.69, p<.21) or SIP (F<1,19)= .11, p<.74)9
32
measures. Thus, individual peer (but not teacher or SIP)
items were then compared using ANOVAs. As shown in Table
5, the high social preference group was found to be rated
significantly higher than the low social preference group
on peer ratings of physical attractiveness (F(1,20)=
12.03, p<.002), athletic ability <F(1,20)= 8.92, p<.007)
and social skill (F(1,20)= 5.27, p<.03). Peer ratings of
academic performance were not found to be significantly
different for the two groups (F(1, 20)= 2.#4, p<.13) (see
Table 5). ‘
Insert Table 5 about here
Comparison of High Social Preference LD Group to Non—LD
Sample
_ Next, the high social preference LD group was
compared to the non-LD sample. when compared to the non-
LD sample, the LD.group was not found to be significantly
different on any of the criterion variables or predictor
lvariables (see Table 6). That is, the high preference LD
group was indistinguishable from their non-LD
counterparts. Although the number of subjects in these
groups differed greatly, analyses of variance were
‘justified as t-tests showed no significant differences in
33
sample variances.
Insert Table 6 about here
Interrelationshig Among Measures.
Pearson correlation coefficients were used to assess
the interrelationship among the measures collected on the
LD sample. First, no significant correlations were found
between the demographic variables (i.e., FSIQ, parental
education, and SES) or the number of months the LD child
had been in the resource program and the sociometric
predictor variables. Non—significant relationships were
also found between the amount of time spent in the
LD/Resource classroom and both measures of social status
(r=—.lB, p<.41 and -.01, p<.95, for rating and
nominations, respectively). In the LD sample
acquaintance ratings were significantly correlated with
standardized play ratings·(r=.70, p<.OOO3) and peer
nominations (r=.55, p<.OOB), indicating that likability
and popularity were associated with how well the student
was known.i
AAdditional correlations of the predictor variables
indicates that peer and teacher ratings for the non—LD
sample were highly inter-related. The highest
3A
correlations were found between peer and teacher ratingsQ
of academic performance (r=.70) and athletic ability
(r=.55). Teacher ratings of social skill not only
correlated highly with peer ratings of social skill
(r=.52), but also with peer ratings of physical
attractiveness (r=.53) and academic ability (r=.50),
suggesting that those children whom teachers perceived as
socially skilled, were viewed by their peers as being
l socially skilled, physically attractive and performing
well academically.
In the LD sample, similar intercorrelations were
found between peer and teacher ratings; Two of the ·
highest correlations were found between peer and teacher
ratings of athletic ability <r=.BO) and social skill
<r=.94). Teacher ratings of athletic ability and social
skill also correlated highly with all peer ratings.
Similarly, peer ratings of social skill correlated highly
with teacher ratings of athletic ability <r=.7B) and
physical attractiveness (r=.53). Agreement between peers
and teachers was less strong, although significant
<p<.O5), when correlating academic performance (r=.47)
and physical attractiveness (r=.49) (see Table 7).
35
. Insert Table 7 about here
Next, Pearson correlations between the criterion
variables (peer ratings and nominations) and the
predictor variables (peer and teacher ratings of social
skill, athletic ability, physical attractiveness and
academic ability) were computed for non-LD and LD
students. In the Non—LD sample, all peer and teacher
evaluations significantly correlated with play ratings
and nominations. The highest correlations were found
between peer evaluations and play ratings (ranging from
r=.b4 to r=.83).
In the LD sample, even higher correlations were Ufound between peer evaluations and play ratings (ranging
from r=.74 to .92). Peer evaluations significantly
correlated with the nomination sociometric measure, withV
the exception of peer ratings of academic performance.
Likewise, teacher evaluations of academic performance
were the only teacher ratings that were not found to be
significantly correlated with play ratings. Teacher
ratings of athletic ability significantly correlated
(r=.55> with peer nominations. No other teacherA evaluation correlated with the nominations (see Table 3),
36
although some of the coefficients were actually higher
than those for the non-LD analyses.
Insert Table S about here
Prediction of Sociometric Status.
For non-LD and LD students, separate multiple
regression analyses were conducted to predict social
status as defined by play ratings and peer nominations.
For each of these two criterion variables, four stepwise
multiple regression analyses were conducted for the non-
LD and LD students, using peer, teacher, SIP, and
composite scores, respectively, as the predictor
variables. _
Sociometric status: Friendship ratings. Stepwise
multiple regression analyses were conducted, using the
four peer ratings of social skill, physical
attractiveness, athletic ability, and academic ability to
predict standardized play ratings. Table 9 shows that in‘
the non-LD sample (n=347), the most significant predictor
(R square=.b9) of SMS was peer ratings of social skill
(p<.OOO1>. Unique variance was added by peer ratings of
athletic ability (R square change=.O7) and physical
attractiveness (R square change=.O2), with a total of 79%
37of the variance accounted for by the three ratings
_ (p<.OOO1>. In the LD sample (N=22), the most significant
predictor of sociometric play ratings was peer ratings of
athletic ability (R square=.85, p<.OOO5). Peer ratings
of social skill also contributed uniquely to the model (R
square change=.O4). Peer ratings of physical
attractiveness were not found to add significantly to the
prediction of sociometric status in this sample, however.
Insert Table 9 about here I
éecondly, stepwise regression analyses wereV
conducted using teacher ratings of social skill, physical
attractiveness, athletic ability and academic performance
as the predictor variables (see Table 10). As with peer
ratings, teacher ratings of social skill were the most
significant predictors (R square=.22, p<.OOO1) of social
status in the non—LD sample (n=347). Teacher ratings of
athletic ability and physical attractiveness also entered
into the model (R square change=.O4, p<.OOO1 and R square
change=.O2, p<.0OO#, respectively) to predict a total of
26% of the variance. within the LD sample (n=22),
teacher perceptions of athletic ability (R square=.58,
p<.OO3) and social skill (R square change=.lO, p<.O2> ‘
38 .
were significant predictors of sociometric play ratings
(see Table 10), accounting for 68% of the variance.
Insert Table 10 about here
V Thirdly, stepwise multiple regression analyses were
conducted using the four processing steps of the SIP
interview to predict sociometric status. Compared to
peer and teacher evaluations, the experimental measure
correlated less highly with sociometric ratings (all
correlations less than .35). The analysis showed none of
the social information processing steps to enter
significantly into the prediction equation at the .05 or
.15 levels of significance.
The last regression conducted to predict play
ratings utilized a composite peer rating score, a
composite teacher rating score, and a composite SIP
interview score as the three predictor variables. Peer
and teacher scores were obtained by adding together the
four standardized ratings of physical attractiveness,
athletic ability, academic performance, and social skill
to obtain a single peer and a single teacher score.
Similarly, the total SIP score was obtained by adding the
standardized scores of each of the four processing steps.
l 39Of the three composite variables, only the composite
peer rating score significantly contributed to the
prediction of sociometric play ratings (R square=.86,
p<.0001>. Neither teacher nor experimental composite
scores added to the model (see Table 11).
Insert Table 11 about herel
Sociometric status: Nominations. In general, peerVratings accounted for a smaller amount of the variance in
sociometric status when the index measure was defined by
_ the total number of nominations (most liked to play with)
that each child received. The results of the multiple
regression analyses, shown in Table 12, indicate that
peer ratings of physical attractiveness accounted for the
most variance in both the Non-LD (R square=.Al) and LD (R
square =.50) samples. Although physical attractiveness
was the only variable to enter the model at the p<.O5
level in the LD sample, athletic ability and academici
.performance added significantly to the model (R square
change=.03 and .008, respectively) in the non-LD sample.
Insert Table 12 about here
40
Analyses of teacher ratings again revealed that when
using peer nominations as the criterion variable, less
variance was accounted for by the predictor variables.
Teacher ratings of athletic ability (R square=.14) were
most significant, with social skill (R square change=.06)
and physical attractiveness (R square change=.0o) adding
to account for a total of 30% of the variance in the non-
LD sample. with the sample of LD children, teacher
ratings of athletic ability were the only significant
predictor (R square=.31) (see Table 13).
Insert Table 13 about here
As in the case of play ratings, SMS as defined by
peer nominations could not be significantly predicted by
the SIP interview. The SIP processing steps did not
enter into the prediction equation at the .05 or .15
levels of significance.
Lastly, in the composite analysis (computed as
described above for the LD sample only), the composite
peer rating score was a significant predictor of
sociometric nominations (R square=.35, p<.0O5).
Composite teacher and SIP scores did not contribute
independently to the model (see Table 14).

41
Insert Table 14 about here
DISCUSSIGN° One major purpose of this study was to further
delineate the social status of LD children by comparing
LD and non-LD students on various measures of sociometric
status and a measure of social acquaintance. Gften
previous studies have found that the social status of
learning disabled students is lower than that of non-LD
students. However, these studies vary in sociometric
techniques, with some using positive nominations
(Prillaman, 1981), some using positive nominations and
peer rating scales (Bursuck, 1983; Siperstein et al.,
1978), others using positive and negative nominations
(Coben & Zigmond, 1986; Garrett & Crump, 1980; Horowitz,
1981) and still others reporting a combination of
positive nominations and another sociometric (Bryan,
1974; Bryan, 1976). In addition, the more recent studies
reported no differences between LD and non-LD students
(Bursuck, 1983; Prillaman, 1981) or found higher status
for non-LD students, but related it to other factors such
as higher intelligence (Horowitz, 1981) or increased
familiarity (Coben & Zigmond, 1986). Peer nomination
studies, which have been most frequently reported in the
literature, are most suggestive of the negative status of
LD students, with studies of peer ratings being less
48h
V 43V
conclusive. Because of differences in the measurements,
nomination studies may be more likely to indicate group
discrepancies (Asher & Taylor, 1981), as LD students may
simply not be popular enough to be nominated. Therefore,
it was hypothesized in this study that LD students would
differ from non-LD peers less on the sociometric measure
of play ratings than on "most like to play with"
nominations. LD students were also hypothesized to be
less well known than their non-LD peers.
Contrary to the a priori hypotheses, the social
status of LD students was lower than that of non-LD peers
when compared on the 1-5 Likert play ratings but not when
the number of nominations they received were compared.
Thus, the notion (suggested above as a possible
explanation for lower status among LD children) that LD
students are not popular enough to be nominated was not
supported. The findings suggest that LD students are as
popular or as likely to receive positive nominations, but
overall, the group is not as well liked as non-LD
children.
The results of a previously cited study <Perlmutter
et al., 1983) are consistent with the present findings.
Perlmutter et al. (1983) found in their high school
sample, that LD children, as a group, were less well
ss
liked, based on 1 to 5 point ratings. However, when the
scores of individuals within the sample were examined,
they found that some individuals were very well liked.
Similarly, while LD children were found to be less well
liked as a group in this study, the lack of significant
differences in nominations indicates that some
individuals within the LD sample are found to be very
well liked, indeed.
The sociometric findings are also consistent with
the findings of Coben and Zigmond (1986), in that LD I
students in the present sample were also found to be
significantly less well known than their non-LD peers.
The positive correlations between peer acquaintance and
SMS status variables suggest that the degree of
familiarity of an LD student may be a mediating factor in
his/her status among peers. That is, students who spend
time away from their classmates may have more difficulty
establishing positive relationships in the mainstreamed
environment. However, within the LD group, the amount of
time mainstreamed or the number of years in the
LD/Resource program was not significantly correlated with
social status. Thus, while the amount of time spent
within the mainstreamed environment is important for LD
children, as compared to non—LD children, the variable
45
does not sufficiently explain differences in acceptance
among LD students. As suggested by LaGreca (1981) and
supported by the findings discussed below, qualitative as
well as quantitative aspects of interactions are
important in establishing and maintaining peer
relationships.
The lower acquaintance ratings received by LD
children may also partially explain the different pattern
of findings for the play and nomination scores. Since
acquaintance ratings were more highly correlated with
ratings (r=.70) than nominations (r=.55), the
significantly lower acquaintance scores received by LD‘
children may have more negatively influenced ratings than
nominations. This relationship was somewhat surprising,
since it was hypothesized that low acquaintance would put
a child "at risk" for not being nominated, but would not
necessarily result in their receiving lower play ratings.
At least for the current sample, however, being less
known was significantly related to being rated as an
undesirable playmate.
The greater degree of relationship between
acquaintance and ratings may also result from
methodological differences between ratings and
nominations. Specifically, a greater number of children
46
determine the average rating, as children receive ratings
from all of their classmates. This difference leads to
greater reliabilty of play ratings and perhaps to a
greater degree of sensitivity (Asher & Taylor, 1981).
The effects of acquaintance, then, are more likely to be
seen on the more sensitive measure of play ratings.
Further social status comparisons within the two
groups reveal that LD students were overrepresented in
the rejected category of SMS, as defined by a combined
rating and nomination score. Interestingly, however, LD
students were equally represented in the popular,
average, neglected and controversial categories. Earlier „F
research, which found the LD children to be equally
represented as "isolates" (but underrepresented as stars)
(Siperstein et al. 1978), used only positive nominations
to compare the groups. The Siperstein et al. (1978) ·
results could be more accurately reported by stating that
an equal proportion of students in LD and non—LD groups
were unlikely to receive positive nominations. Stated in
this manner, the results are consistent with those in the
present study. This is a particularly interesting
finding since this is the first study to report findings
related to status groups. As stated by Newcomb and
Bukowski (1983), forming status groups offers richer data
47
because it allows a multi- rather than a unidimensional
evaluation of children’s social status. Previous
studies, reporting mean ratings, positive nominations or
negative nominations do not adequately reflect the social
standing of LD children.
A second goal of this study was to add to the
understanding of the reasons for social acceptance or
rejection among children. Factors that had been found to
relate to social status (peer and teacher ratings of
physical attractiveness, athletic ability, academic
performance, and social skill) were hypothesized to
independently and significantly predict the sociometric
status of both LD and non-LD groups, as defined by peer
ratings and nominations. Also, as learning disabled
students may be described as evidencing difficulty in
processing academic information, an examination of their
social information processing was conducted. It was
hypothesized that this too, would contribute
significantly to the prediction of LD students’
sociometric status. A
Analyses revealed that almost all of the proposed
factors, with the exception of SIP measures, correlated
highly with variables of social status for both LD and
„ non-LD groups. Comparisons of LD and non-LD children
A8
. indicated that learning disabled students were perceived Alower than non—LD students on several factors: peer
ratings of social skill, physical attractiveness, and
academic performance as well as on teacher ratings ofA
social skill and academic performance. As Siperstein et
al. (1978) found with positive nominations, peer (or
teacher) ratings of athletic ability were not
significantly different for the two groups.‘ Given that the status group comparisons suggested
that the LD group was heterogeneous with regard to status
(many rejected as well as popular), analyses were
conducted to compare high status to low status LD
children. The high social preference LD group was not
found to be significantly different from the non—LD group
on any of the peer ratings. Thus, although it can be
said that LD students are perceived by peers as less
physically attractive, less academic, and less socially
skilled, as a group, these findings appear to be clouded
by the effects attributable to the low status LD
children. within the LD group, popular children were
similar to non—LD children in many important ways.
Additionally, high status LD children were found to
differ from low status LD children on all of the peer
ratings. This significant finding provides further
49
evidence of the wide range of acceptance within the LD
population.
Taking into consideration the high degree of
intercorrelation among the factors relating to
sociometric status, the regression analyses show what
factors are the most independently related to the
criterion variables. In the non-LD sample, the strongest
relationships to sociometric play ratings were peer and
teacher ratings of social skill (defined as how well the
child gets along with other children). This relationship
supports an earlier finding that teacher ratings of
likeability contributed significantly to the prediction
of children’s play ratings (Laßreca, 1981) and suggests
that peers and teachers perceptions of children’s
interpersonal skills are similar. Peer and teacher
perceptions of athletic ability and physical
attractiveness also added to the prediction of play
ratings in the non-LD sample.1
In the LD sample, however, the most significant
predictor of play ratings by both peers and teachers was
their perception of LD students’ athletic ability.
Eighty-five percent of the variance in play ratings was
accounted for in the peer rating (58% in teacher ratings)
suggesting that others’ perceptions of an LD student’s
50
athletic talent is strongly related to his or her social
status——even more strongly so than for non—LD students.
Peer and teacher ratings of social skill added to the
models, with peer ratings of the two variables predicting
a total of 89% of the variance in play ratings andl
teacher ratings predicting a total of 68% of the
variance.
That well-liked LD children were perceived by their
peers as athletically skilled, suggests that this is one
of the "special skil1s" needed to boost social acceptance l _
in mainstream classrooms. The greater their strengths.
in areas other than academics, such as athletics, the
less likely the chances are of being socially rejected.
Asher, Oden, and Gottman (1977) aptly stated, "One way
for a child to gain peer acceptance is to be very good at
something valued by other children" (p.48). Anecdotally,
Asher et al. (1977) reported increasing one child’s
social status by teaching him a skill which was valued by
his peers. For the LD child, increased athletic ability
may be a special skill that can serve to "innocu1ate" him
V or her against social rejection.
The results of the nomination data suggest that
athletic ability, as perceived by adults, is also
predictive of peer acceptance. Teacher ratings of
‘ 51
athletic ability were the sole contributor to the
prediction equation in the LD sample, accounting for 31%
of the variance. Similarly, in the non-LD group, teacher
ratings of athletic ability contributed the most unique _
variance, with ratings of social skill and physical
attractiveness also adding to the model.‘
In contrast to the teacher ratings, peer ratings of
physical attractiveness contributed all of the unique
variance in the LD sample and most of the unique variance
in the non-LD groups in the prediction of nominations.
Thus, peers perceive physical attractiveness to be a
particularly salient factor related to general
popularity, whereas teachers may underestimate its
importance. Peer ratings of athletic ability were the
second highest predictor in the non-LD group, with
academic performance also adding to account for a total
of Q5% of the variance. These results match those of
Siperstein et al. (1978}, who report accounting for 35%
of the variance in positive peer nominations, with peer
ratings of academic ability, athletic ability, and
physical attractiveness. Overall, the ratings of social
skill and physical attractiveness were most predictive of
non-LD student ratings and nominations, respectively»
while athletic ability and physical attractiveness were
52
most predictive in the LD sample. For the most part,
however, LD and non-LD students’ social status appears to
be determined by similar variables.
It is interesting to note that in the prediction of
both peer nominations and play ratings, teacher and peer
ratings were more predictive for the smaller group of LD
students than for the group of non-LD students. This
finding suggests that a stronger relationship exists
between the criterion and predictor variables for the
group of learning disabled students. Although it is
difficult to explain this pattern of findings, it could
be attributable to the LD students’ more limited amount
of social contact. Alternatively, since a greater
proportion of LD students are rejected, this group may beD
more predictable as they are more likely to receive
extreme scores. This latter explanation is consistent
with the greater standard deviation of scores on the
dependent variables found with LD students. For the less
sociometrically extreme non-LD stdents, these variablesU
were lesspredictable.The
lack of any predictive value with the SIP
interview is surprising. Since cognitive processing
problems may be likely to generate or exacerbate social
problems, LD students would seem to be at greater risk
53
for SIP deficits. These data suggest that LD students,
unlike aggressive children, do not exhibit the social
processing difficulties noted by Dodge (1986). The
quality of their interaction skills may be superior toy
that expected by their academic difficulties. This
interpretation is supported by the fact that very few of
the subjects in this sample were rated as interpreting
hostility, generating fewer competent and more aggressive
alternatives or endorsing aggressive responses generated
by the examiner. As Bursuck (1983) found in his use of
hypothetical situations, LD children’s responses to the
items were quite prosocial and they appeared to
understand what they "should" do in a problematic
situation.
Social information processing deficits, as defined
in this study, dealt with the constructs of aggression
and/or hostility. while these LD children did not
display this type of deficit, other types of SIP deficits
were not investigated and therefore cannot be dismissed.
Perhaps there are other information processing factors
that are more salient for the social acceptance of LD
students than for the group of aggressive normal children
studied by Feldman and Dodge (1987).
As few subjects provided deviant responses on the
54
SIP measure, one may interpret the data as resulting from
a lack of variability in the present sample. However,
the LD children were well represented at both extremes of
status groups (popular and rejected). Even when low and
high status LD children in this sample were compared on
SIP data, no significant differences in SIP emerged.
while it is still possible that LD students were all such
poor information processors that even the extreme
comparison would not show significant results, this
explanation appears unlikely since mean scores on the
individual processing steps are similar to the mean
scores of the popular children reported by Feldman and
Dodge (1987). In the final analysis, at least for this
sample, the SIP variables do not appear to be important
in explaining low status for LD children.
Despite these important findings, this study is
limited by a number of factors. First, the small sample
size limits both the amount of comparison and the
statistical power. Secondly, as noted by other
researchers (LaGreca, 1981), LD students are a
heterogeneous group of students, and LD vs. non-LD
comparisons are inherently limited because of this
quality. Because this study also examined within group
differences, however, this criticism is less relevant.
55
Thirdly, some might argue that the study does not control ‘
for Halo effects associated with multiple ratings for the
same sources. The lack of a one to one correlation among
measures, however, suggests that children were able to
discriminate among ratings. More investigation into the
psychometric properties of these ratings, however, would
do much to justify their use.
In summary, LD students, as a group, were found to
be significantly less well accepted (as measured by play
ratings), but not less popular (as measured by peer
nominations) than their non-LD peers. while LD students_were overrepresented in the rejected category, many LD
children were as well accepted as their non-LD
counterparts. Sociometric results were mitigated
somewhat by the finding that LD students were also less
well known by their peers. Peer and teacher perceptions
of athletic ability, social skill, physical
attractiveness, and academic ability were highly related
to social status-- with athletic ability being °
' particularly salient for peer acceptance of LD students.
56
Table 1‘ Subject Demographic Information (N=22)
F SD Range
Full Scale IQ 98 16.4 74 — 131
Achievement Scores
wRAT—reading 74 _ A 20 46 — 113
wRAT—arithmetic 87 14 49 - 115Mother’s Education 12.1 2.4 7 - 16
Father’s Education 11.6 2.4 6 - 16
# of years in LD program 1.9 1.4 -.5 - 6.5
Hrs./week in
regular class 22.4 4.1 9 - 29
Hollingshead SES Index
occupation level 4.47 2.1 1 — 9
education level 4.02 1.2 1 - 7
57
Table 2
Conners Teacher Rating Scale Subscale Scores
Normals LD Sample
(n=291) (n=22)l
F SD ? SD
Conduct Problem .1# .35 .70 .59
Inattention—Passive .51 .57 1.25 .69
Anxiety .32 .39 .33 .36
Hyperactivity .#O .55 .53 .65
Note. Normative data from werry et al. (1975).
58
Table 3
Distribution of Social Status Classifications among
Learning Disabled (N=88) and Non—LD (N=347) Children A
LD Non—LD X2 p value
PDPULAR 3 (14%) 61 (18%) .98 ns
AVERAGE 1 (4%) 59 (17%) 8.94 ns
NEGLECTED 4 (18%) 46 (13%)l
.40 ns
REJECTED 7 (38%) 45 (13%) 6.55 <.O8
CONTRUVERSIAL 0 (0%) 18 (3%) 1.14 ns
N/A 7 (38%) 184 (36%) .81l
ns
59
Table 46
Comparison of mean standard scores of predictor and
criterion variable ratings for LD (n=22) and Non-LD
(n=347) groupsu
Non-LD LD F obs p value
x x
CRITERION VARIABLES
Play Ratings .02 -.39 3.93 .05
Nominations .02 -.27 1.90 .17
Acquaintance” .03 -.43. 5.39 .01
PREDICTOR VARIABLES
Peer Ratings ‘
Social Skill .03 -.51 6.37 .009
Physical Attract. .02 -.43 4.76 .02
Athletic Ability .009 -.20 .95 .33
Academic Perf. .05 A-.79 16.0 .0001
Teacher Ratings
Social Skill .03 -.64 10.44 .001 '
Physical Attract. .02 -.24 1.65 .20
Athletic Ability .01 -.19 .97 .32
Academic Perf. .03 -.53 6.91 .009
60
Table 5 UComparisons of mean scores for High Social Preference vs. '
Low Social Preference LD Children
High Low
(n=11) (n=l1)Y Y F obs p value
' CRITERION VARIABLES V_Play ratings .25 -1.03 9.9 .005
Nominations .42 -.97 12.26 .002Acquaintance .15 -1.13 7.96 .01
PREDICTOR VARIABLESPeer RatingsSocial Skill -.11 -.93 5.27 .03
Physical Attract. .16 -1.04 12.03 .002
Athletic Ability .42 -.32 3.32 .003
Academic Perf. -.42 -1.15 2.44 .13
61
Table 6
Comparisons of mean scores for Non-LD vs. High Social
Preference LD Children
Non-LD High LD
(n=347) (n=11)_? E F obs p value
CRITERION VARIABLESl
Play ratings .02 .25 .58 .45
Nominations .01 .42 1.83 .18
Acquaintance .03 .15 .18 .67
PREDICTOR VARIABLES
Peer Ratings
Social Skill- .03 -.11 .23 .63
Physical Attract. .03 .16 .20 .65
Athletic Ability .01 .42 1.86 .17
Academic Perf. .05 -.42 2.62 .10 .
62
Table 7
Pearson Correlations between peer and teacher ratings
(Non—LD, N=347) PEER RATING8
Acad Athl(
Scsk Phys
TEACHER RATING8
Acad .70** .26** .40** .38**
Athl .26** .55** .27** .42**
Scsk .50** .37** .52** .53**
Phys .32** .35** .29** .42**
(LD, N=22> PEER PATINGS
Acad Athl Scsk Phys
TEACHER RATINGS
Acad~ .47* .20 .26 .14
Athl .67** .80** .78** .80**Scsk .70** .71** .84** .63**
Phys .32 .40 .53** .49*
*p<.O5
**p<.01 ~
63
. Table 8
Correlations between Peer and Teacher Evaluations and
Sociometric Scores of LD (N=22) and Non—LD <N=347)
Students
,Play ratings Nominations
PLD Non—LD LD Non—LD
Peer Ratings
Social Skill .91** .83** T .52** .52**
'Physical Attract .83** .83** .71** .64**
Athletic Ability .92** .73** .55** ..58**
Academic Perform .74** .64** .31 .37**
Teacher Ratings
Social Skill .72** .48** .36 .36**
Athletic Ability .76** .36** .55** .37**
Physical Attract .49** .34** .30 .29**
Academic Perform .21 .33** .00 .15**
*p<.O5
**p<.O1 _
64 .
Table 9
Stepwise Multiple Regression Findings for Sociometric
Play Ratings with Peer Evaluations
Variable F Value of Increment p level multiple
Entered increment in R2 of incr. R2
NON—LD (N=347)
Social Skill 783.58 .69 .0001 .69
Athletic Ability 105.91 .07 .0001 .77
Physical Attract. 41.75 .08 .0001 .79
LD (N=88)
Athletic Ability 110.43 .85 .0001 .85
Social Skill 7.55 .04 .01 .89
65
Table 10
Stepwise Multiple Regression Findings for Sociometric
Play Ratings with Teacher Evaluations
1Variable F value of Increment p level multiple
Entered increment in RZ of incr. R2-
NON—LD (N=347) ·
Social Skilll
96.09V
.22 .0001 .22
Athletic Ability 19.22 .04 .0001 .26
Physical Attract.· 8.42 .02 .0004 .28
LD (N=22)
Athletic Ability 27.86 .58 .001 .58
Social Skill ‘ 6.00 .10 .02 .68 _
66
Table 11
Stepwise Multiple Regression Findings for Sociometric
Play Ratings with Composite variables (Peer, Teacher and
Experimental)
variable F value of Increment p level multiple‘ Entered increment in R2 of incr. R2
LD (N=E8)
Peer Ratings 118.59 .86 .0001 .86
67
Table 12
Stepwise Multiple Regression Findings for Sociometric
Nominations with Peer Evaluations
Variable F value of lncrement p level multiple
Entered increment in R2 of incr. R2
(NON—LD N=347)
Physical Attr. 240.67 .41 .0001 .41
Athletic Abil. 21.29 .03 .0001 .44
Academic Perf. 5.36 .008 .0196 .45
(LD N=22)
Physical Attr. 20.32 9 .50 .0002 .50
68
Table 13
Stepwise Multiple Regression Findings for Sociometric
Nomination with Teacher Evaluations
Variable F value of Increment p level multiple
Entered increment in Rg of incr. Rg
NON—LD (N=347) ·
Athletic Abil. 53.61 .14 .0001 .13
Social Skill 24.14 .06 .0001 .19
Physical Attr. 4.24 .01 .03 .20
LD (N=22)
Athletic Abil. 8.93 .31 .007 .31
69
Table 14
Stepwise Multiple Regression Findings for Sociometric
Nominations with Composite variables (Peer, TeacherandSIP)
~
variable F value of Increment p level multiple
Entered increment in R2 of incr. R2
LD (N=E2)
Peer Ratings 10.14 .35 .0049 .35
REFERENCES
Asher, S. R., & Taylor, A. R. (1981). Social outcomes ofmainstreaming: Sociometric assessment and beyond.Excegtional Education Quarterly, L(4), 13-30.
Asher, S. R., & Dodge, K. A. (1986). Identifyingchildren who are rejected by their peers.Develogmental Psychology, gg, 444-449.
Asher, S. R., & Hymel, S. (1981). Children’s socialcompetence in peer relations: Sociometric andbehavioral assessment. In J. D. wine & M. D. Syme(Eds.), Social Comgetence. New York: Guilford.
Asher, S. R., Oden, S. L., & Gottman, J. M. (1977).Children’s friendships in school settings. In L. G.Katz (Ed.), Current Togics in Early Education, (L,33-61). Norwood, N. J.: Ablex.
Asher, S. R., & Taylor, A. R. (1981). Social outcomes ofmainstreaming: sociometric assessment and beyond.Excegtional Education Quarterly, L, 13-30. _
Bursuck, N. D. (1983). Sociometric status, behaviorratings and social knowledge of learning disabledand low-achieving students. Learning Disability
QUBTIZETIY,Bruininks,V. L. (1978a). Actual and perceived status oflearning-disabled students in mainstream programs.Journal of Sgecial Education, 18, 51-58.
Bruininks, V. L. (1978b). Peer stats and personalitycharacteristics of learning disabled and non-disabled students. -Journal of LearningDisabilities, LL, 484-489.
Bruininks, R. H., Rynders, J. E., Gross, J. C. (1974).Social acceptance of mildly retarded pupils inresource rooms and regular classes. American
. Journal of Mental Deficiency, ZQ, 377-383. ‘
Bryan, T. H. (1974a). Peer popularity of learningdisabled children. Journal of LearningDisabilities, Z, 621-685.
Bryan, T. H. (1974b). An observational analysis of
70
71
classroom behaviors of children with learningdisabilities. Journal of Learning Disabilities, Z,86-34.
Bryan, T. H. (1976). Peer popularity of learningdisabled children: A replication. Journal ofLearning Disabilities, Q, 307-311.
Bursuck, N. D. (1983). Sociometric status, behaviorratings, and social knowledge of learning disabledand low-achieving students. Journal of LearningDisabilities, Q, 389-338.
Bursuck, N. D., & Asher, 8. R. (1986). The relationshipbetween social competence and achievement inelementary school children. Journal of ClinicalChild Psychology, LQ, 41-49.
Carlson, C. L., Lahey, B. B., & Neeper, R. (1984). Peerassessment of the social behavior of accepted,rejected, and neglected children. Journal ofAbnormal Child Psychology, LQ, 189-198.
Coben, S. S., & Zigmond, N. (1986)._ The socialintegration of learning disabled students from self-contained to mainstream elementary school settings.Journal of Learning Disabilities, LQ, 614-618.
Coie, J. D., & Dodge, K. A., & Coppotelli, H. (1988).Dimensions and types of status: A cross—age
V perspective. Develogmental Psychology, LQ, 557-570.
Conners, C. K. (1969). A teacher rating scale for use indrug studies with children. American Journal ofPsychiatry, 186, 884-888.
Dion, K. K., & Berscheid, E. (1974). Physicalattractiveness and peer perception among children.Sociometry, Q2, 1-18.
Dodge, K. A. (1986). A social information processingmodel of social competence in children. InPerlmutter (Ed.), Minnesota Symgosium in ChildPsychology, (LQ, 77-185). Hillsdale, New Jersey:Erlbaum.
73
Dodge, K. A. (1983). Behavioral antecedents of peer» social status. Child Develogment, gg, 1386-1399.
lDudley—Marling, C. C. 8 Edmiaston, R. (1985). Social
status of learning disabled children andadolescents: A review. Learning DisabilityQuarterly, g, 189-304.
Feldman, E. 8 Dodge, K. A. (1987). Social InformationProcessing and Sociometric Status: Sex, Age, andSituational Effects. Journal of Abnormal ChildPsychology, gg, 311-337.
Foster, S. L., 8 Ritchey, N. L. (1979). Issues in theassessment of social competence in children.Journal of Agglied Behavior Analysis, Lg, 635-638.
Garrett, M. K., 8 Crump, N. D. (1980). Peer acceptance,teacher preference, and self—appraisal of socialstatus of learning disabled students. LearningDisability Quarterly, g, 43-48.
Gottlieb, J., Semmel, M. I., 8 Veldman, D. J. (1978).Correlates of social status among mainstreamedmentally retarded children. Journal of EducationalPsychology, ZQ, 396-405.
Green, K. D., Beck, S. J., Forehand, R., 8 Vosk, B.(1980). Validity of teacher nominations of childbehavior problems. Journal of Abnormal ChildPsychology, g, 397-404.
Green, K. D., Forehand, R., Beck, S. J., 8 Vosk, B.(1980). An assessment of the relationship amongmeasures of children’s social competence andchildren’s academic achievement.g Child Develogment,äi, 1149-1156.
Gresham, F. M. (1983). Misguided mainstreaming: The casefor social skills training with handicappedchildren. Excegtional Children, gg, 433-433.
Hartup, N. N. (1970). Peer interacion and socialorganization. In P. H. Mussen (Ed.), Carmichael’smanual of child gsychology, Volume 3 (3rd ed.). NewYork: John Niley and Sons.
73
Hollingshead, A. B. (1975). Four factor index of socialstatus. Unpublished manuscript, Department ofSociology, Yale University. New Haven, Conneticut.
Hutton, J. B., & Roberts, T. G. (1933). Relationships ofsociometric status and characteristics of emotionaldisturbance. Behavioral Disorders, Q, 19-39.
Horowitz, E. C. (1931). Popularity, decentering ability,and role-taking skills in learning disabled andnormal children. Learning Disability Quarterly, Q,33-30.
Kaufman, M., Gottleib, J., Agard, J. A., & Kukic, M.B.Mainstreaming: Toward an explication of theconstruct. In E. L. Meyer, G. A. Vergason, R. J.whelan (Eds.), Alternatives for teachingexcegtional children. Denver: Love Publishing, 1975.
La Greca, A. M. (1931). Social behavior and socialperception in learning-disabled children: A reviewwith implications for social skills training.
· Journal of Pediatric Psychology, Q, 395-916.
Newcomb, A. F., & Bukowski, N. M. (1933). Social impactand social preference as determinants of children’speer group status. Develogmental Psychology, Q2,356-367.
Dden, S., & Asher, S. R._(1977). Coaching children insocial skills for friendship making. ChildDevelogment, QQ, 995-506.
Ollendick, T. H. (1931). Assessment of social interactionskills in children. Behavioral CounselingQuarterly, Q, 337-393.
T, H,} GVEEÜE} R, N,} Hicks, B,} KÜOWIES}S,.}
Francis, G., & Baum, C. G. (1933). Stability andvalidity of sociometric status among neglected,‘ rejected, and popular children. Unpublishedmanuscript.
Perlmutter, B. F., Crocker, J., Cordray, D., &Garstecki, D. (1933). Sociometric status andrelated personality characteristics of mainstreamedlearning disabled adolescents. Learning DisabilityQuarterly, Q, 30-30.
74
Prilliman, D. (1981). Acceptance of learning disabledstudents in the mainstream environment: A failure toreplicate. Journal of Learning Disabilities, 14,844-346. b
Putallaz, M. & Gottman, J. M. Social skills and groupacceptance. In S. R. Asher & J. M. Gottman (Eds.),The develogment of children’s friendshigs:Descrigtion and intervention. New York: CambridgeUniversity Press, 1981.
Siperstein, G. N., Bopp, M. J., & Bak, J. J. (1978).Social status of learning disabled children.Journal of Learning Disabilities, LL, 98-108.
werry, J. S., Sprague, R. L., & Cohen, M. N. (1975).Conners Teacher Rating Scale for use in drug studieswith children- an empirical study. Journal ofAbnormal Child Psychology, Q, 817-889.
75
Appendix A
Criteria for Eligibility ——Specific Learning Disabilities
1. The child does not achieve commensurate with his orher age and ability levels in one or more of the areaslisted (below) when provided with learning experiencesappropriate for the child’s age and ability levels; and2. The team finds that a child has a severe discrepancybetween achievement and intellectual ability in one ormore of the ...areas (listed).
The areas to be considered, as stated in theregulations, are oral expression, listeningcomprehension, written expression, basic reading skill,reading comprehension, and mathematics calculation orreasoning.
In order for the team to identify the student as LD,the regulations specify that the diability may not begrimarily the result of:
1. a visual, hearing or motor handicap; _E. mental retardation;3. emotional disturbance; or4. environmental, cultural or economic disadvantage.
when the criteria shown above have been met, furtherindication that a student is LD are the following:——A wide spread between verval and performancescores (if these are provided by the individuallyadministered test of intelligence used); Q3 a wide spread‘ among scaled subtest scores on an individuallyadministered test of intelligence;
-—Difficulty in interpreting information presentedvisually and/or auditorily;
——Evidence of reversals in letters, words, ornumbers, or in concepts;—-A cluster of the characteristics
A severe discrepancy between expected achievementand actual achievement in one or more areas of learningbased on age, ability and years in school, is a keydeterminant for classifying students as learningdisabled. Usually, a fifteen (15) point differencebetween ability and achievement standard scores suggeststhat a severe discrepancy exists.
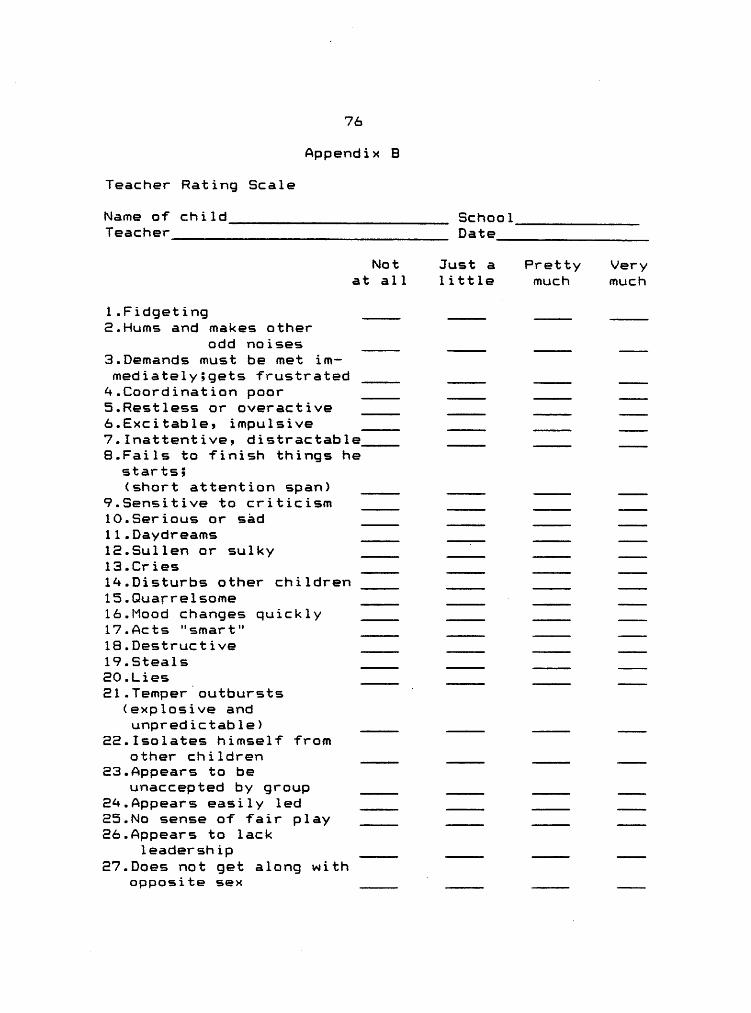
7éAppendix B
Teacher Rating Scale
Name of child Schon}Teacher DataNot Just a Pretty Veryat all little much much
1.Fidgeting2.Hums and makes otherodd noises ___3.Demands must be met im-mediate1y;gets frustrated ___4.Coordination poor ___
5.Restless or overactive ___6.Excitable; impulsive ___7.Inattentive, distractable ___B.Fails to finish things hestarts;
(short attention span) ___9.Sensitive to criticism ___10.Serious or sad ___11.Daydreams ___1E.Sullen or sulky l ___l3.Cries ___1A.Disturbs other children ___l5.Quarrelsome · ___1é.Mood changes quickly ___17.Acts "smart" ___1S.Destructive ___l9.Steals ___20.Lies ___El.Temper outbursts °
(explosive andunpredictable) ___22.Isolates himself from
other children ___E3.Appears to be
unaccepted by group ___E4.Appears easily led ___25.No sense of fair play ___E6.Appears to lackleadership ___E7.Does not get along withopposite sex ° ___
77E6.Does not get along withsame sex ___E9.Teases other children orinterferes with their
activities ___30.Submissive ___31.Defiant ___32.Impudent ___33.Shy ___3Q.Fearful ____35.Excessive demands for
teacher attention ___36.Stubborn ___37.Anxious to please ___38.Uncooperative ___39.Attendance problem ___
None Mild Moderate SevereA0.Considering your total ·teaching experience withchildren of this age,how much of a problemis the child at this time? ___Other information:
78
Appendix C
Sociometric Measures
Friendship Rating and Nomination Scale
Directions: Listed below are the names of all thechildren in your classroom. First, find your name anddraw a line through it. O.K. Now, for each of thestudents listed, circle the number which best describes „"How much you like to play with this person." Circle the"l" if you don’t like to play with this student at all,"8" if you like to a little, "3" if you like to some, "4"if you like to quite a bit, and "5" if you like to a lot.
Now, draw a circle around the names of the 3classmates whom you like to play with the most.Remember, only 3 names.
_\ A _ Quite; Not at all little Some a bit A lot
Jane Doe .1 8 3 4 5
John Doe 1 8 3 4 5
etc. VAcquaintance Scale
Directions: Here is another list of the students in yourclass. This time, circle the number which best describes"How well you know this person." Circle the "l" if youdon’t know them at all, "8" if you know them a little,"3" if you know them some, "4" if you know them quitewell, and "5" if you know them very well.
Al
Quite VeryNot at all little Some well well
Jane Doe 1 3 3 4 5
John Doe 1 E 3 4 5
etc.
79
Appendix D
Peer Ratings J _
Physical Attractiveness
Directions: Find your name and draw a line through it.Now, rate each person according to how good you thinks/he looks. If you don’t think they look good at all,circle "1"; circle "3" if you think they look good alittle; "3" if they look 0.K.; "4" if they look prettygood; and circle "5" if you think they look very good.
A Pretty VeryNot at all little 0.K. good good
Jane Doe 1 ‘ 3 3 . 4 5
John Doe 1 2 3 4 5etc.
Athletic Ability
Directions: Find your name and draw a line through it.Now, rate each person according to how good you think
. s/he is at recess games and sports. If you think theyare not good at all, circle "1". If you think they aregood a little, circle "E"; if they are 0.K., circle "3";pretty good, "4"; and very good, circle "5".
A Pretty VeryNot at all little 0.K. good good
Jane Doe 1 E 3 4 5
John Doe 1 E 3 4 5etc.
Academic Performance
Directions: Find your name and draw a line through it.Now, rate each of your classmates on how well you thinkhe or she does in school work. If you think they don’tdo well at all, circle "l"; if you think they somewhatpoorly, circle "2"; if they do 0.K., circle "3"S prettywell,"4"; and if you think they do very well, circle "5".
A Pretty VeryNot at all Little 0.K. well 1 well
Jane Doe 1 E 3 4 5
John Doe 1 3 3 4 5etc.
SO
Social Skill
Directions: Find your name and draw a line through it.Now, rate each of your classmates on how well you thinks/he gets along with other children. Circle "1" if youthink the child does not get along with others well atall; circle "2" if you think he or she gets along kind ofbadly; "3" if 0.K.; "A" if pretty good; and "5" if youthink the child gets along with other children real well.
A Pretty VeryNot at all Little 0.K. well well
Jane Doe 1 2 3 A 5
John Doe 1 E 3 A 5 —etc.
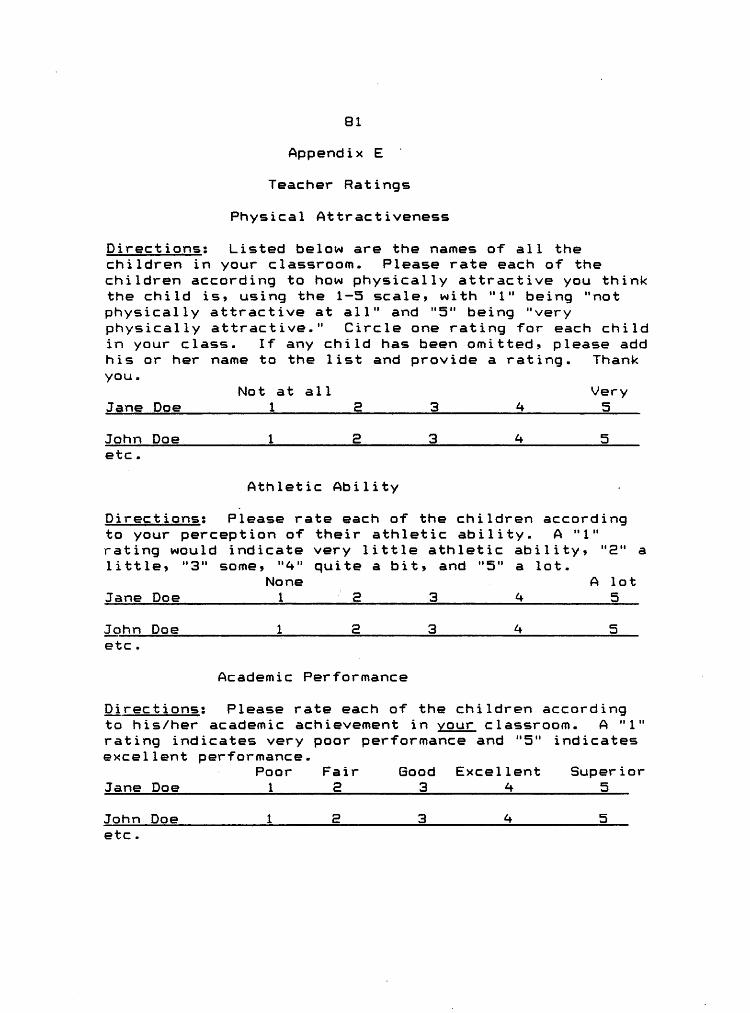
G1
Appendix E °
Teacher Ratings
Physical Attractiveness
Directions: Listed below are the names of all thechildren in your classroom. Please rate each of thechildren according to how physically attractive you thinkthe child is, using the 1-5 scale, with "1" being "notphysically attractive at all" and "5" being "veryphysically attractive." Circle one rating for each childin your class. lf any child has been omitted, please addhis or her name to the list and provide a rating. Thankyou.
Not at all VeryJane Doe 1 E 3 4 5
John Doe 1 E 3 4 5etc.
Athletic Ability -
Directions: Please rate each of the children accordingto your perception of their athletic ability. A "1"rating would indicate very little athletic ability, "E" alittle, "3" some, "4" quite a bit, and "5" a lot.
None _ A lotJane Doe 1 V E 3 4 5
Jghn Doe 1 2 3 4 5etc.
Academic Performance
Directions: Please rate each of the children accordingto his/her academic achievement in your classroom. A "1"rating indicates very poor performance and "5" indicatesexcellent performance.
· Poor Fair Good Excellent SuperiorJane Doe 1 E 3 4 5
John Doe 1 E 3 4 5etc.
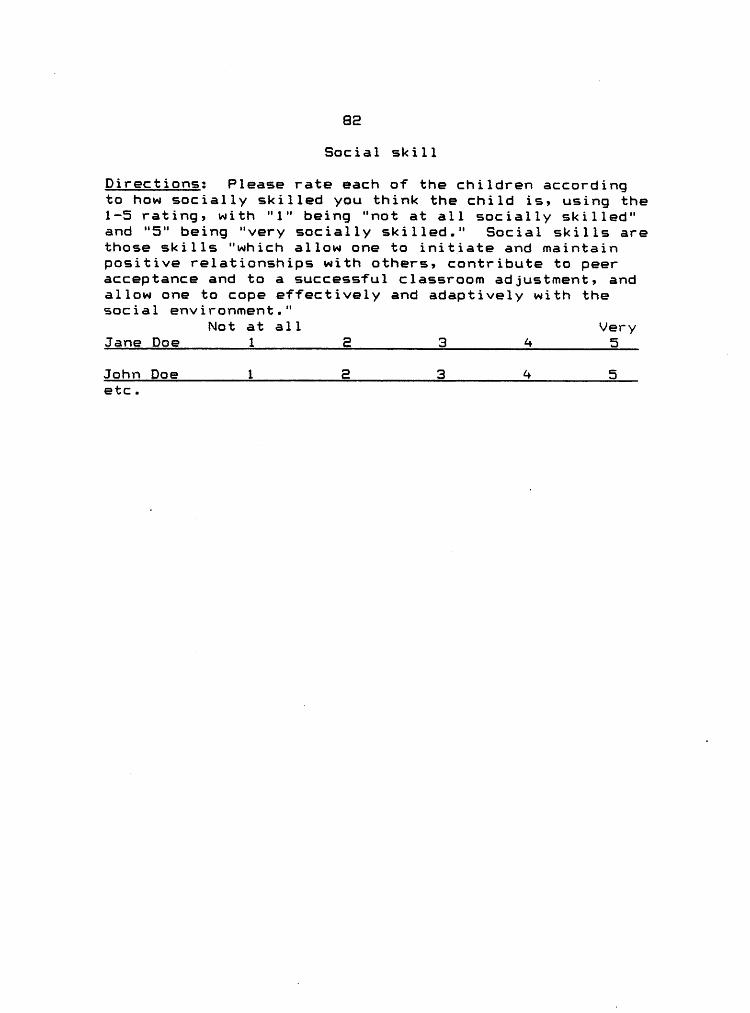
SE
Social skill
Directions: Please rate each of the children accordingto how socially skilled you think the child is, using the1-5 rating, with "1" being "not at all socially skilled"and "5" being "very socially skilled." Social skills arethose skills "which allow one to initiate and maintainpositive relationships with others, contribute to peeracceptance and to a successful classroom adjustment, andallow one to cope effectively and adaptively with thesocial environment."
Not at all VeryJane Doe 1 E 3 4 5
John Doe l E 3 4 5etc.
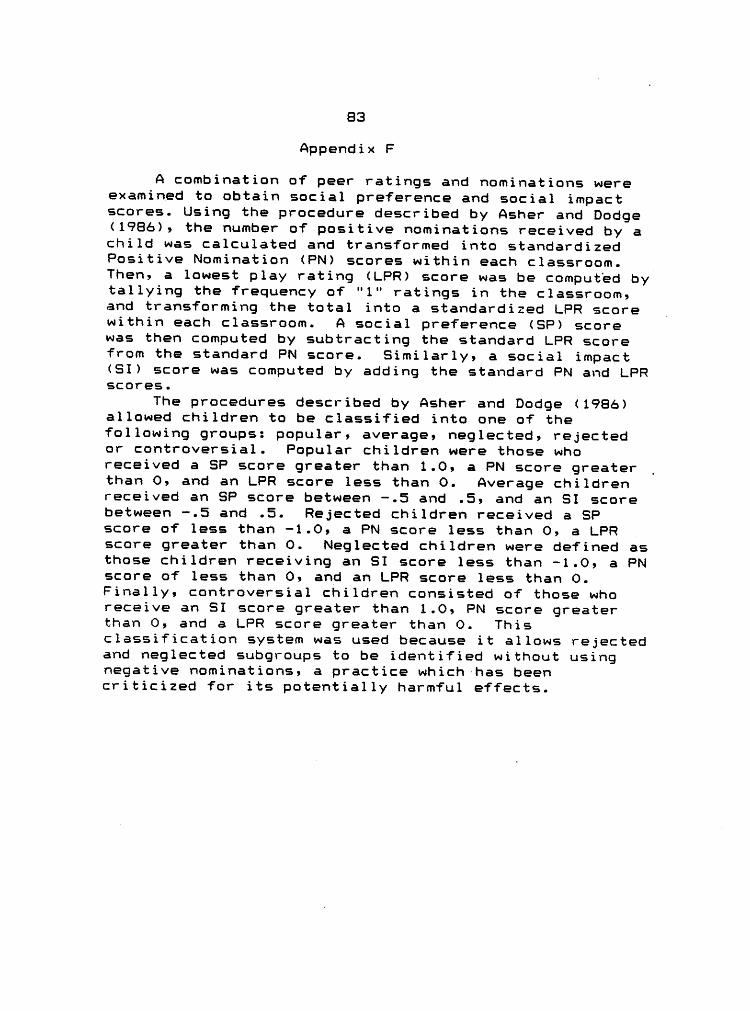
33
Appendix F
A combination of peer ratings and nominations wereexamined to obtain social preference and social impactscores. Using the procedure described by Asher and Dodge(1936), the number of positive nominations received by achild was calculated and transformed into standardizedPositive Nomination (PN) scores within each classroom.Then, a lowest play rating (LPP) score was be computed
by,tallying the frequency of "1" ratings in the classroom,and transforming the total into a standardized LPP score _within each classroom. A social preference (SP) scorewas then computed by subtracting the standard LPP scorefrom the standard PN score. Similarly, a social impact(SI) score was computed by adding the standard PN and LPPscores.
The procedures described by Asher and Dodge (1936)allowed children to be classified into one of thefollowing groups: popular, average, neglected, rejectedor controversial. Popular children were those whoreceived a SP score greater than 1.0, a PN score greater _than 0, and an LPP score less than 0. Average childrenreceived an SP score between -.5 and .5, and an SI scorebetween -.5 and .5. Pejected children received a SPscore of less than -1.0, a PN score less than 0, a LPPscore greater than 0. Neglected children were defined asthose children receiving an SI score less than -1.0, a PNscore of less than 0, and an LPP score less than 0.Finally, controversial children consisted of those whoreceive an SI score greater than 1.0, PN score greaterthan 0, and a LPP score greater than 0. Thisclassification system was used because it allows rejectedand neglected subgroups to be identified without usingnegative nominations, a practice which has beencriticized for its potentially harmful effects.

6


![Dopl Hující pr ozkumy a rozbory - Smolné Pecesmolnepece.unas.cz/files/vykres_zameru_smolne_pece.pdfSV BV SV BV BV BV BV OM BV BV BV PV DS [BV] [PV] [BV] [OX1] [BV] NT NT BV DS NSi](https://img.pdfslide.net/doc/110x75/5ecbc6e1aab05a781359c472/dopl-hujc-pr-ozkumy-a-rozbory-smoln-sv-bv-sv-bv-bv-bv-bv-om-bv-bv-bv-pv.jpg)