Embed Size (px)
Citation preview
Graduate School of Development Studies
AGRICULTURAL PRODUCTION AND PRICING POLICY NEXUS: A REFLECTION OF THE GHANA
COCOA
INDUSTRY
A Research Paper presented by:
AMOS POKU
(GHANA)
in partial fulfilment of the requirements for obtaining the degree of
MASTERS OF ARTS IN DEVELOPMENT STUDIES
Specialisation:
ECONOMICS OF DEVELOPMENT (ECD)
Members of the examining committee:
Dr. PETER DE VALK (supervisor)
Dr. JAN VAN HEEMST (Second reader)
The Hague, The NetherlandsDecember, 2009
1

Disclaimer:
This document represents part of the author’s study programme while at the Institute of Social Studies. The views stated therein are those of the author and not necessarily those of the Institute.Research papers are not made available for circulation outside of the Institute.
Inquiries:
Postal address: Institute of Social Studies P.O. Box 297762502 LT The HagueThe Netherlands
Location: Kortenaerkade 122518 AX The Haguethe Netherlands
Telephone: +31 70 426 0460
Fax: +31 70 426 0799
2
DEDICATION
This research paper is dedicated to my lovely wife, Regina Gyasi and our son, Caleb Dum Poku, my mother and my father, John Kofi Poku and Martha Poku.
3

ACKNOWLEDGEMENT
My first thanks goes to the Almighty God for His favour and abundance grace throughout my studies in the Netherlands. I would also like to extend my profound gratitude to the Dutch Government for his kind gesture in financing my education at the international institute of social studies. My appreciation goes to my supervisor, Dr. Peter De Valk, Dr Jan Van Heemst, my second reader, whose joint support, guidance and encouragement brought me to this far. I am also indebted to my colleague, Fatima Onyanike Ojetunde who assisted me in diverse ways throughout my research. Let me also take the opportunity to extend my profound gratitude to Ghana Education Service (GES) for granting me the study leave to study outside the country.
The above recognition will not be complete without showing my appreciation to the following personalities: my sisters, Esther and Christiana Poku, Samuel Poku, John Kwesi Poku and Emmanuel Poku who are my brothers. The rest are Philip Banahene Thompson, Zelalem Debeebe, Peter Biwott, and Ishmael Ogyefo. Others include the former Headmaster of Dunkwa Senior High, Mr. Kofi Tetteh and his able assistants, Mr. Boadi and Madam Ansah. Assistance from Mr. Amoahi of Cocobod cannot be forgotten. And to all Economics of Development (ECD) students, i say a very big thank you for making me feel great in the class. God bless you all.
4

Contents DEDICATION 3
ACKNOWLEDGEMENT 4
List of Tables 8
List of Figures 8
List of Acronyms 10
ABSTRACT 11
Chapter 1 Introduction 12
1.1 Background 12
1.2 Problem Statement 13
1.3 Main Research Questions 14
1.4 Justification of the Study 14
1.5 Hypothesis 15
1.6 Limitations of the Study 15
1.7 The Organization of the Study 15
Chapter 2 Description of the Cocoa Industry of Ghana 17
And Agricultural intervention Policies
5

2.1 Introduction 17
2.2 Historical Development of the Cocoa Industry in Ghana 17
2.3 Cocoa Production and Marketing 18
2.3.1 Production of Cocoa 18
2.3.2 Marketing of Cocoa 19
2.4 Causes of low Production of Cocoa in Ghana 20
2.5 Effects of low Production of Cocoa in Ghana 22
2.6 Comparison of yields in Ghana with Other Major Producers 23
2.7 Government Agricultural Intervention Policies 24
2.7.1 Trends in Agricultural Policies in Ghana 24
2.7.2 Types of Agricultural Policies 25
2.7.3 Objectives of Agricultural Policies 26
2.7.4 Impact of Agricultural Policies on Production and Producers 27
2.7.5 Conditions necessary for Effective Agricultural Policy 29
Chapter 3 Theoretical Framework 31
3.1 Supply Response Function 31
3.2 Agricultural Supply Response Function 31
3.3 Supply Response Function of Cocoa in Ghana 33
Chapter 4 Methodology 36
4.1 Data Collection Method 36
4.2 Sampling Technique 36
4.3 Analytical Framework
4.3.2 Effects of Price and Production Policy on Cocoa Supply 37
4.3.2 Socioeconomic Characteristics of Cocoa Farmers 38
6

Chapter 5 Analysis of the Effects of Agricultural Price and Production Policy on Cocoa Production and Wealth of the Farmer 39
5.1 Introduction 39
5.2 Descriptive Statistics 39
5.3 Effects of Price and Production Policy on Cocoa Production 43
5.3.1 Test for Unit root 43
5.3.2 Test for Cointegration 45
5.3.3 Cointegration Analysis 45
5.3.4 Error Correction Model 47
5.3.5 Conclusion 49
5.4 Effects of the Price and Production Policy on Socioeconomic Life of the 49
Cocoa Farmer
5.4.1 Profile of the Study Area 49
5.4.2 Descriptive Statistics 50
5.4.2.1 Determining the Extent of Agreement on the Problems 50
of Internal Marketing Constraints
5.4.3 Demographic Characteristics of Respondents 51
5.4.4 Effects of Mass Spraying and Producer Price on Farmers 54
Chapter 6 Summary, Conclusion and Policy Implication 57
6.1 Summary and Conclusion 57
6.2 Policy Implication 58
7

References 59
Appendix 63
Appendix 1: Questionnaire on Cocoa Farmers 63
Appendix 2: Factors Affecting Cocoa Supply 66
List of Tables
Table 2.1: Cocoa production of Major Producing Countries 23
8

Table 5.1: Unit Root Test 44
Table 5.2: Stationarity Test at First Difference 44
Table 5.3: Cointegration Test 45
Table 5.4: Cointegration Analysis 46
Table 5.5: Error Correction Model 48
Table 5.6: Ranked Marketing Constraints 51
Table 5.7: Respondents Age 52
Table 5.8: Number of Bags per Hectare from Different Villages 52
Table 5.9: Educational Level in Relation to Number of Bags per Hectare 53
Table 5.10: Number of Years in the Cocoa Farming 53
Table 5.11: Marital Status 54
Table 5.12: Chi-Square Test 56
List of Figures
Figure 5.1: Trends in Ghana Cocoa Production and Producer Price 39
9

Figure 5.2: Trends in FOB and Ghana’s Producer price of Cocoa 41
Figure 5.3: Trends in Cocoa Production and Producer Price of Maize 41
Figure 5.4: Trends in Cocoa and Maize Production 42
Figure 5.5: Trends in Cocoa and Maize Prices 42
Figure 5.6: Change in Cocoa Production 54
Figure 5.7: Reasons for the Decrease 55
Figure 5.8: Gain in Asset in Relation to Output Increase 55
Figure 5.9: Number of times Farmers had their Farms Sprayed 56
10

List of AcronymsAD Dickey-Fuller
COCOBOD Ghana Cocoa Board
CODAPEC Cocoa Disease and Pest Control Programme
CGE Computable General Equilibrium
CMC Cocoa Marketing Company
ECM Error Correction Model
ERP Economic Recovery Programme
FOB Free On Board
GDP Gross Domestic Product
ICCO International Cocoa Organization
LBCs Licensed Buying Company
MOF Ministry Of Finance
OFY Operation Feed Yourself
PBC Produce Buying Company
PC Purchasing Clerk
PPRC Cocobod Producer Price Review Committee
QCD Quality Control Division
SPSS Statistical Package for Social Science
11

Abstract
Ghana is currently the second major producer of cocoa in the world. Past supply of cocoa to the world market has not been encouraging in the past until recent. After its achievement of a record crop in 1964/65, the country achieved the lowest cocoa production in its history of cocoa export, in 1983/84 season. This was attributed to pest and diseases, and also lower producer price among other factors. This called for government intervention in the industry with policies including high producer price and also cocoa pest and disease control programme (CODAPEC) to stimulate cocoa production.
This paper seeks to examine the effects of these policies. The study used cointegration and error correction modelling technique with time series data. The producer prices were deflated to the period 2000. The findings showed that farmers were more influenced by the price policy both in the short and long run. However, the production policy (CODAPEC) showed a negative responds which is contradictory to economic theory. Enforcing accountability of gang officials and direct distribution of chemicals to farmers would make cocoa supply respond positively to CODAPEC.
In spite of the importance of these policies to cocoa supply, various studies have been biased against CODAPEC, and it is this gap that this study seeks to address.
RELEVANCE TO DEVELOPMENT STUDIES
Most farmers in developing countries are poor as a result of discrimination towards agricultural. It is hoped that policies like higher producer price and introduction of free mass spraying exercise would contribute to higher production and higher revenue to the farmer, and
12
help alleviate poverty. In addition, this would contribute to higher tax revenue to the government to embark on various developmental projects.
KEY WORDS: Cocoa Supply, Agricultural Policy, Price Policy,
Codapec, Ghana, Econometric Analysis.
Chapter 1Introduction1.1 Background
Since 1983, various government of Ghana have intervened substantially in the cocoa industry. This has taken the form of pricing policy and various production policies. The main objective of this study is to examine the effects of production policy and pricing policy on cocoa supply and wealth of the farmer. The approach in achieving this is first to formulate and estimate the model of cocoa supply function based on 1978-2007 time series data. The variable in the model is based on previous study done by other researchers (Abdulai and Rieder 1995; Bateman 1965; Gyimah-Brempong and Apraku 1987). Estimates from the model are used to analyze the effects of the production and the pricing policy on cocoa supply and wealth of the farmer.
Attempts to assess the effects of these policies on cocoa production have been scanty. Although many researchers have estimated the effects of the pricing policy on cocoa supply(Abdulai and Rieder 1995; Gyimah-Brempong 1987), few have tried to consider both policies in the same model(Thompson 2005), and most have been descriptive in analysing the impact of the pricing policy on production in general(A.Meilink 1985;Cuong 2000). Therefore, the point of departure from these researchers is the estimation of the effects of both the pricing policy and the production policy on cocoa supply and wealth of the farmer. The
13
analysis shows that cocoa supply has been more responsive to pricing policy, and this is consistent with most studies done on supply of cocoa.
The cocoa industry in Ghana is an important area to study. Because it is the backbone of the Ghanaian economy: most households in Ghana derive their livelihood from cocoa farming; it provides about 800,000 smallholders farm families with employment in Ghana (Anim-Kwapong and Frimpong 2005). In addition to employment provision, the country derives revenue from foreign exchange, when the dry beans are exported to the world market, and this enables the government to embark on many developmental projects in other sectors of the economy. As a result of the importance of cocoa to the economy of Ghana, among other crops, cocoa sector gives a better study of the effects of Agricultural pricing and production policies. Coupled with that the trends in the cocoa supply in the country have not been smooth in the past, apart from recent resurgence in the industry due to a mixture of factors including higher producer price, fertilizer use and the government cocoa disease and pest control programme in 2001.
1.2 Problem Statement
Ghana is currently the world’s second leading producer of cocoa. The industry employs about 60% of the Agricultural labour force in Ghana (MOF 2004:16). Cocoa output and prices have however been fluctuating over the years with huge revenue and socioeconomic implications following response to governments’ interventions. Thus policy interventions by present and past governments have therefore always been an issue of economic importance in Ghana’s socio-political arena. There have been claims by incumbent and past Governments of Ghana about the impact of their agricultural policies mainly in the cocoa industry and their role in consolidation of Ghana’s position as the second leading cocoa producer in the world over the time. The debate also centres on the subsequent impact of increased output on the socioeconomic development of the citizens of Ghana – the farmer taking
14
the centre stage. Governments upon, governments have implemented host of Agricultural policies with mixed policy emphasis aimed at improving revenue, socio-economic well-being of farmers and to increase their crop productivity with mixed results. Their claim to fame in that area is that their policies have had greater impact on the farmer in addition to increasing production, being it producer prices or subsidising farm inputs.
These policies can, therefore be conceptualise into two: pricing policy of cocoa in the form of producer prices to the farmer and production policies by means of direct and indirect farm subsidies like the Cocoa Diseases and Pest Control Programme (CODAPEC). To emphasise, different political administration push for policies aimed at increased producer prices for the cocoa farmer while others have laid more importance on production policies in addition to minimal increases in price; production policies as direct intervention being the provision of subsidies, fertilizer application, mass spraying exercise, Cocoa Diseases and Pest Control Programme (CODAPEC) as a package to the farmer etc.
In the light of this discourse and in view of the importance of the cocoa industry to Ghana’s foreign exchange earnings and development, one will like to analyse these two measures to find out their impact to the sustainability of Ghana’s agricultural policies. The studies will therefore come out with empirical facts to help address the question about agricultural policies impact.
1.3 Main Research Question
Based on these potentials, the main question is: How has government agricultural policies affected cocoa production and wealth of the farmer?
Specific-questions:
15

i. How has the agricultural pricing and production policies affected cocoa production?
ii. How has the introduction of the cocoa mass spraying disease and pest control programme in 2001, improved the socioeconomic characteristics of farmers? This is determined by improvement in income, wealth etc. of farmers.
1.4 Justification of the Study
Few researches have been done on the benefits of policy interventions in tandem especially in Ghana’s Agric sector and Africa as a whole. Policy impact has huge revenue and governance implication especially in most developing countries. Addressing the issue of poverty in Africa finds resonance in agricultural policy effectiveness. The study will therefore provide the empirical evidence to policy makers in Ghana and most developing countries especially the cocoa producers facing such policy barrage to enhance policy effectiveness and help enhance revenue for socioeconomic development. Further the study will help elucidate the major marketing constraints that farmers face in Ghana and other Developing Countries with similar marketing structure.
Thus using Ghana’s cocoa sub-sector as a case study, the study will elucidate the policy effectiveness in agriculture and inform governments and other aid agencies budget in the agriculture sector as to whether it is more profitable to invest in production enhancing technologies with minimal increase in producer price or concentrate their efforts on price response to output as a policy option. Major socio-economic impact of such policies on farmers will also be brought to light.
Further, the study will provide an analytical and historical overview of Ghana’s Cocoa industry to support its performance or vindicate the claim of smuggling which critics swiftly draw on to explain output performances during period of peak performances. That is findings from this research is expected to support debate on the supposed influx of
16

cocoa from our neighbouring partners and its impact on Ghana’s current and future production levels which will also have great implications on policy. The study will also add knowledge to existing literature like Abdulai and Rieder (1995) and Gyimah-Brempong and Apraku (1987) on Ghana’s cocoa industry.
1.5 Hypothesis
Cocoa production and pricing policies have had a great impact in stimulating cocoa production and improving the socioeconomic life of the cocoa farmer.
1.6 Limitations of the study
A couple of limitations could be identified with this study. The first limitation has to do with respondents. Most of them, whom the researcher came across, were not able to write. The researcher had to interpret the questionnaire in the local language, and write the response given by the respondents. In addition the respondents prolonged a simple answer to a question just to impress. These consumed a lot of time allocated for the survey.
Moreover, the researcher had to meet a lot of dignitaries including agriculture supervisors, the assemblyman and the chiefs before permission could be granted to distribute questionnaire to farmers. This reduced the time the researcher had to conduct the survey, and in addition limited the number of respondents intended for the survey.
The second limitation is the reluctance of section of the farmers to accept to answer the questions. Most were of the view that their farms were not sprayed because of politics, and therefore were reluctant in answering the questionnaire. Therefore the study concentrated on only those who benefitted from the programme. This gave a little bias since the inclusion of those who did not benefitted would have been helpful in assessing the two groups.
17

Lastly, resource constraint was a major problem in terms of travelling and lodging expenses to administer questionnaires in the study areas which was very far from the researcher’s place of residents. Coupled with that, the survey areas were in three different districts. This to a large extent affected the sample size that was intended for the research.
1.7 The Organization of the study
The study was organized into six Chapters. Chapter one captures the background of the study, the problem statement, research questions, justification of the study, hypothesis, limitations, and structure of the paper. Chapter two reviews the historical development of cocoa industry in Ghana, the mechanism of production and marketing of cocoa, factors responsible for low cocoa production in Ghana, comparison of cocoa production in Ghana and other major producers in the world, and government agricultural policies in the cocoa industry. Chapter three recounts the theoretical framework of the paper. Chapter four discusses the data collection method, the sampling technique and the analytical framework of the study. Chapter five outlines, interprets and analyze the main results. The last chapter is a summary of the major findings, conclusions and policy implication.
18

CHAPTER 2 Description of the Cocoa industry of Ghana and Government Agricultural intervention Policies
2.1 IntroductionThis chapter recounts literature on studies done by other researchers and publications relevant to the current study. It consists of two main sections. Section one informs readers about the historical development of Cocoa sector in Ghana. It also looks at the Cocoa production and marketing in Ghana. Comparison of Cocoa production in Ghana and other major producing countries are examined. It reviews the factors that affect Cocoa productivity. Section two looks at government agricultural intervention policies in the cocoa sector. Various gaps within past researches are also unveiled within this section.
2.2 Historical Development of the Cocoa Industry in Ghana
19

The introduction of cocoa seed into the former Gold Coast is believed to have been made possible through the effort of several people. The native farmer who introduces cocoa beans into the country journeyed from the Fernando Po in the Seychelles Island in 1879. Before this successful journey by Tetteh Quarshie, a native of OSU in Accra, the Dutch and the Basel Missionaries were the first to plant cocoa in Ghana. However, the growth of cocoa industry in Ghana cannot be attributed to their effort (COCOBOD 2009:1). The connoisseurs of the history of cocoa industry in Ghana attribute the introduction of cocoa beans into the former gold coast solely to Tetteh Quarshie.
The growth of Cocoa to other parts of the country, especially westwards is partly due to migration from the Akwapim Ridge and the Accra plains. Instrumental to this are two brothers, Sampson Akotua and Philip Afwireng. They set their journey across the Densu River into the Akim forest in 1905 in with the intention of cultivating Cocoa (Hunter 1961:162-3). Further, their aim to spread cocoa was accelerated by the allocation of scattered parcels of forest to the extended families for food and Cocoa cultivation. Since then, Cocoa production has become the main cash crop grown in six out of the ten regions in Ghana.
2.3 Cocoa production and marketing in GhanaCocoa production is carried out in about six out of the ten regions in the country namely the Volta region, central region, Brong Ahafo, Eastern region, Ashanti region, and the Western region which supply about 50% of annual production (Anim-Kwapong and Frimpong 2005:2).Two main seasons have been identified in the production of Cocoa in Ghana- the light crop season which starts from September to June, and the main crop season which runs from October to May/June. The cultivation of Cocoa involves a series of activities ranging from planting, maintenance,
20

harvesting, drying and bagging the beans for marketing. The marketing of the cocoa beans involves the LBC’s purchasing it directly from the farmers through their representatives on behalf of Cocobod (COCOBOB 2009:3).
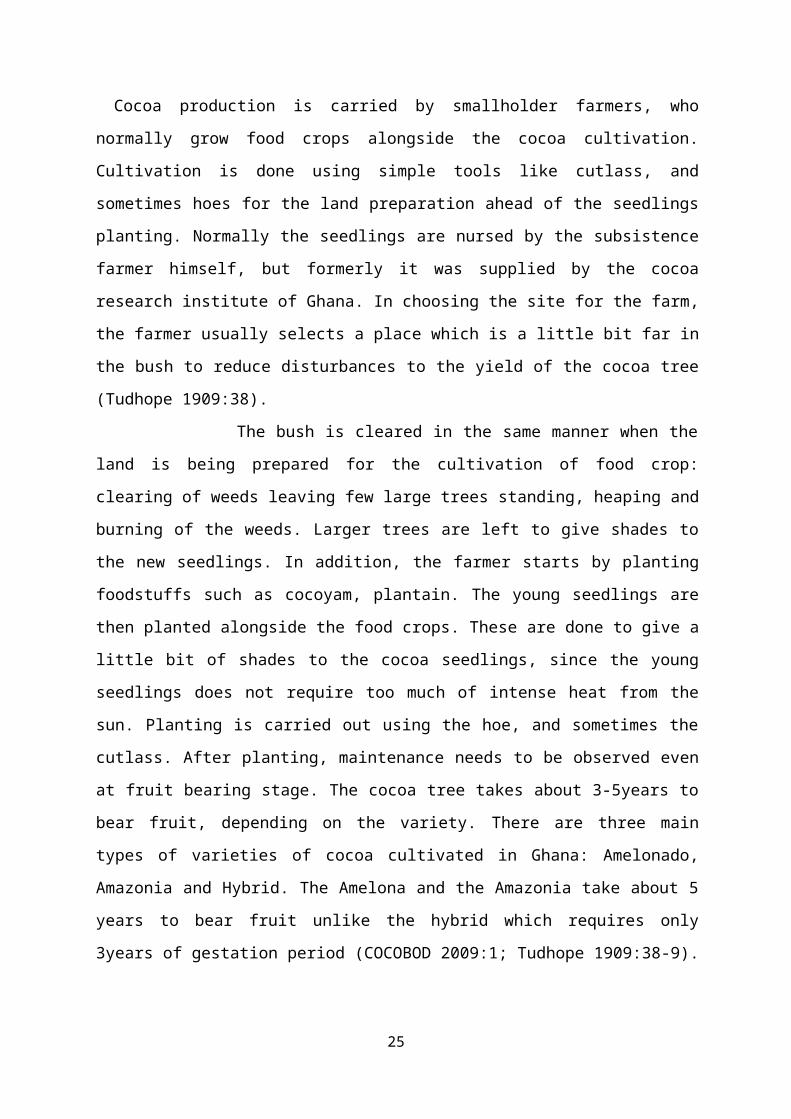
2.3.1 Production of Cocoa Cocoa production is carried by smallholder farmers, who normally grow food crops alongside the cocoa cultivation. Cultivation is done using simple tools like cutlass, and sometimes hoes for the land preparation ahead of the seedlings planting. Normally the seedlings are nursed by the subsistence farmer himself, but formerly it was supplied by the cocoa research institute of Ghana. In choosing the site for the farm, the farmer usually selects a place which is a little bit far in the bush to reduce disturbances to the yield of the cocoa tree (Tudhope 1909:38). The bush is cleared in the same manner when the land is being prepared for the cultivation of food crop: clearing of weeds leaving few large trees standing, heaping and burning of the weeds. Larger trees are left to give shades to the new seedlings. In addition, the farmer starts by planting foodstuffs such as cocoyam, plantain. The young seedlings are then planted alongside the food crops. These are done to give a little bit of shades to the cocoa seedlings, since the young seedlings does not require too much of intense heat from the sun. Planting is carried out using the hoe, and sometimes the cutlass. After planting, maintenance needs to be observed even at fruit bearing stage. The cocoa tree takes about 3-5years to bear fruit, depending on the variety. There are three main types of varieties of cocoa cultivated in Ghana: Amelonado, Amazonia and Hybrid. The Amelona and the Amazonia take about 5 years to bear fruit unlike the hybrid which requires only 3years of gestation period (COCOBOD 2009:1; Tudhope 1909:38-9). Within this period, maintenance is carried out by the farmer to ensure good yield. In this case, the farmer bore the cost of spraying, fertilizing, maintenance and weeding of the farm himself. However, according to Tudhope (1909), many well to do farmers give their farm on
21

contract to caretakers to manage. In that instance, the caretaker takes the responsibility of maintaining the farm whilst the owner gives expenditure out to the caretaker to carry out weeding fertilizing and spraying of the farm. This goes on till the harvesting time (which is determine by the yellowish nature of the cocoa pods), when the yield is divided into three, where the caretaker receives one-third of the crop, while the remaining two-thirds goes to the owner. This is a form of sharecropping. In the Ghanaian language, it is called “Abusa”, meaning division into three. In some communities, the owners pay some fixed proportion of the harvest to the caretaker (MOF 1999:16) After harvesting, which is usually done with cutlass, the pods are broken by means of cutting it into two with a cutlass or hitting it against a stone. The beans are then gathered and heaped in the farm for about 7 days to ferment before it is carried to the house for drying. It is then bag in 62.5kg, which is sold to the Licensed Buying Companies, which have their purchasing clerks in the rural areas.
2.3.2 Marketing of CocoaThe marketing system of Cocoa in Ghana has two main components-the internal marketing system and the external marketing system. According to COCOBOD (2009:44), the internal marketing system has received some modification since 1992/93 light crop season. Formerly the Produce Buying Company (PBC), a subsidiary of the Cocobod was the sole purchaser of Cocoa beans directly from the farmers. However this has changed: many private companies have been given the license to purchase Cocoa directly from the farmers. This was done to introduce competition into purchasing of Cocoa, in order to bring some efficiency in the internal marketing system (COCOBOD 2009:5). In spite of this, it is undeniable fact that the PBC is still the largest purchaser of Cocoa beans in Ghana, even though its market share has been limited to about 68% as at 1997/98 season (MOF 1999:44). Again, Cocobod continues to keep the activities of the private licensed buying companies in check to ensure healthy competition in the internal
22

marketing system. In addition to the discussions of issues concerning the activities of the LBC’s, Thompson (2005:20) notes that the price paid to farmers by the LBC’s is determine by Cocobod Producer Price Review Committee (PPRC) which includes the LBCs, Cocoa hauliers, Quality Control Division(QCD), Cocoa Marketing Company(CMC) and the COCOBOD. This is normally a percentage of the Free On Board (Fob) price, and it takes into accounts the cost of production to the farmer. And attempt is being made, by the Cocobod, to increase this to 70% in future (MOF 1999:80) After the purchase of the Cocoa beans from the farmer the quality of the beans is ensured by the QCDs of Cocobod, and this include the grading and sealing of the beans. Under the request of the Cocobod, this is carried out by the QCDs of the LBCs, which forward the beans to Cocobod for the sale and storage of the beans before it is exported by the CMC. The beans is sold to both international and local companies for processing (COCOBOD 2009:3-4).The external sale of Cocoa is the sole responsibility of the CMC, and every effort push forward by various external for liberalization of Ghana’s external market of Cocoa has been resisted by the Government of Ghana. This is not to say that it has helped Ghana a 100% upward trend in the marketing of the product. This is because there are few problems that have caused fluctuations in the production of Cocoa, and which have negative effects in the marketing of Cocoa. These problems are covered in the next section.
2.4 Causes of low Cocoa Production in GhanaGhana is a force to reckon, when it comes to the production of Cocoa in the world, and the economy depends heavily on the foreign exchange proceeds derived from it. However production levels have not been consistent over the years except in the mid-1980s and early 2000 where the yield seems to have been on track, but this notwithstanding have some elements of inconsistency in it (Dormon et al.:273). The down trend has been due to a number of factors.
23

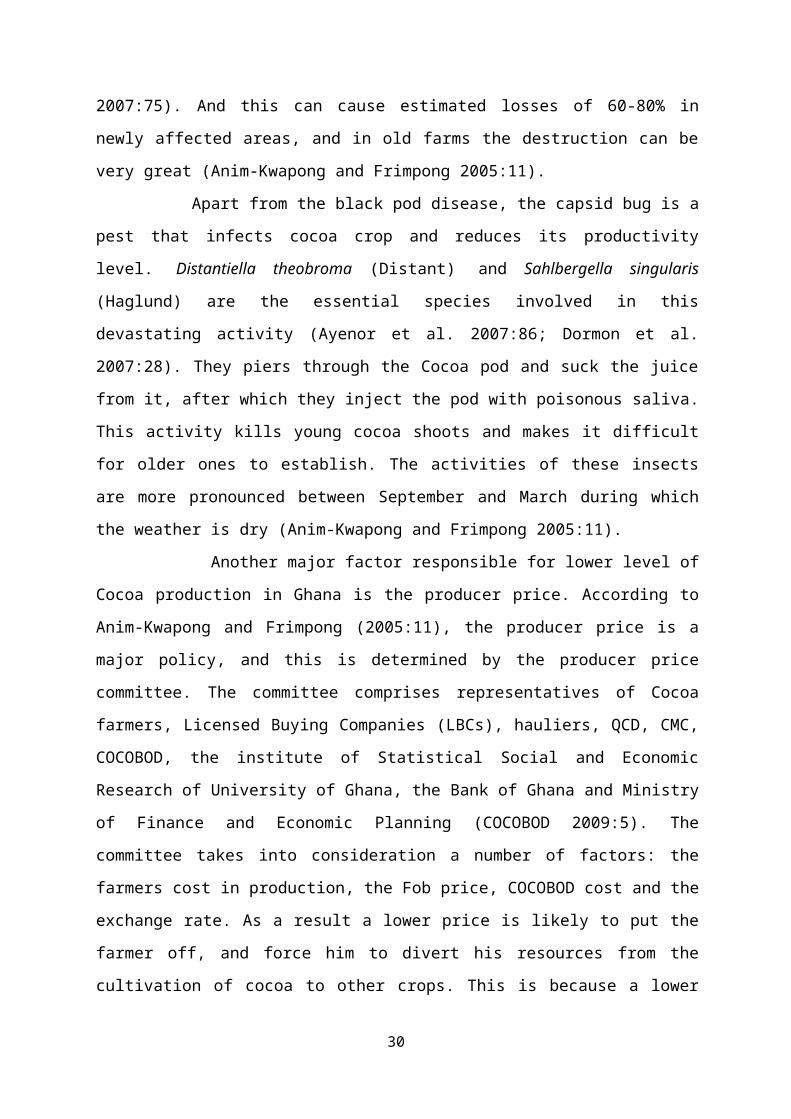
First is drought, which is a major cause of low level of production in the Cocoa sector. During this period bush fires become rampant, and this is triggered by the activities of Marijuana smokers, rat seekers and bad farming practices such as slash and burn method. These normally cause severe fire outbreak which can destroy lots of Cocoa farms. This issue have been discussed by Thompson (2005:12), who advocates that the prolonged drought in 1980s damaged an estimated 30-40% lots of Cocoa farms located in Volta, Ashanti and Brong-Ahafo regions of Ghana causing a drastic reduction in the output level of Cocoa. As a result of that, most farmers became discouraged and abandoned their farms; others took the risk and engaged in replanting exercise. In addition to drought, the second factor which is responsible for the low production of Cocoa in Ghana is aging Cocoa trees. This holds a general truth that, when organisms become old, they tend to diminish in their capacity to be productive. MOF (1999:7) confirm this with a fact that an estimated 30% area under cocoa cultivation has been unproductive due to the old nature of the trees. Moreover the number of cocoa trees that are grown per hectare has not been encouraging: it has been lower than the recommended number. To exacerbate the issue, the third factor stresses on the activities of pest and diseases. The black pod disease has been described by Anim-Kwapong and Frimpong (2005:11) as one of the most destructive among a number of diseases that affect Cocoa production. It is caused mainly by Phytophthora megakarya, and it is the most damaging fungal disease that affects Cocoa production in Ghana (Opoku et al. 2007:601). This is because a huge sum of revenue is lost by farmers in trying to fight against the disease, and others have limited effort to fight against it. As a result of this, the disease is prevalent in five out of the six cocoa regions in the country with an estimated area of 700,000hectares as at 2004(Opoku et al. 2007:75). And this can cause estimated losses of 60-80% in newly affected areas, and in old farms the destruction can be very great (Anim-Kwapong and Frimpong 2005:11).
24
Apart from the black pod disease, the capsid bug is a pest that infects cocoa crop and reduces its productivity level. Distantiella theobroma (Distant) and Sahlbergella singularis (Haglund) are the essential species involved in this devastating activity (Ayenor et al. 2007:86; Dormon et al. 2007:28). They piers through the Cocoa pod and suck the juice from it, after which they inject the pod with poisonous saliva. This activity kills young cocoa shoots and makes it difficult for older ones to establish. The activities of these insects are more pronounced between September and March during which the weather is dry (Anim-Kwapong and Frimpong 2005:11). Another major factor responsible for lower level of Cocoa production in Ghana is the producer price. According to Anim-Kwapong and Frimpong (2005:11), the producer price is a major policy, and this is determined by the producer price committee. The committee comprises representatives of Cocoa farmers, Licensed Buying Companies (LBCs), hauliers, QCD, CMC, COCOBOD, the institute of Statistical Social and Economic Research of University of Ghana, the Bank of Ghana and Ministry of Finance and Economic Planning (COCOBOD 2009:5). The committee takes into consideration a number of factors: the farmers cost in production, the Fob price, COCOBOD cost and the exchange rate. As a result a lower price is likely to put the farmer off, and force him to divert his resources from the cultivation of cocoa to other crops. This is because a lower price reduces the farmer’s ability to undertake maintenance and other agronomic activities. The above factors do not exhaust the factors responsible for low production of cocoa in Ghana. Factors like the nature of the soil, rainfall and even temperature affect cocoa production in Ghana. In addition, all the above researchers failed to account for marketing constraint as a major cause of low cocoa production in Ghana. Many researchers have been silent on this factor, but when producers find it difficult to market their product, it affects their morale and therefore takes decision not to produce or put little effort into it. However in one of the innovative research done on the factors affecting cocoa production in Ghana,
25

Dormon et al. (2004:237,247) categorized the causes into two: biological and socio-economic factors. While he mentioned the biological factors as pest and diseases, he enumerated the socio-economic factors as low producer price, lack of electricity, lack of capital. The rest are indirect causes like cheating by licensed buying companies, which is a constraint in the marketing of cocoa produced. However he fails to be explicit in explaining this constraint. These problems have lead to many negative consequences in the cocoa industry. The next section recounts some of these effects.
2.5 Effects of low production of Cocoa in GhanaThe rate at which farmers respond to price is reflected in the way they intensify their effort on their farms. In other words farmers are motivated by higher price which would enable them to carry out maintenance and other agronomic activities including replanting, weeding, disease and pest control pruning and spraying. As a result, if prices are high enough to cover their variable cost, then farmers will be in a better position to carry out farm management practices. On the other hand, if prices are not high enough to cover harvesting, fermentation and drying, then it is postulated by Anim-Kwapong and Frimpong (2005:5) that harvesting will stop. Then farmers may decide whether to continue with cocoa production or channel their resources to the cultivation of food crops. Others may find farming in general not profitable, and therefore migrate to the urban areas in search of jobs. The low production of cocoa might compel the able-bodied youth to migrate to the cities. This is because most farmers live on hand –to- mouth in most of the cocoa growing areas, meaning that if production is low their income level goes down leaving them with no choice to survive than to migrate to make ends meet. This may lead to shortage of labour and increase cost of hiring labour. Couple with that, the migrants are normally youth, leaving behind the aged farmers. Certain farmers still stay in the village and relocate their farms which have ceased to be productive, to areas where forests are in
26

abundance. A contributing factor to this is the belief that virgin forest is very fertile and productive, and automatically supports the cultivation of cocoa (Thompson 2005:14). Contrary to this, not every forest in western region (which is the largest forest area in Ghana) is capable of supporting cocoa cultivation, even though cultivation is very intense. Moreover, as farmers relocate, they either abandon their old farms or use it to cultivate food crops, and this call for cutting down of trees which have been formally left to provide shades to the cocoa trees (Thompson 2005). Low cocoa production, therefore, leads to deforestation. The above mentioned effects of low production of cocoa are different for different producing countries due to the fact that a major cause of low cocoa production in one country may not be a serious problem in another producing country due to the measures they are able put up to mitigate some of these problems. The next section, therefore, compares yields in some of the major cocoa producing countries.
2.6 Comparison of yields in Ghana with other major producersGhana’s yield in the cocoa sector has not been encouraging when head-to-head comparison is made with other major producing country like Cote d’ Ivoire. Its output as at 1999 was 30% below that of Cote d’Ivoire, while on the average, it fell 13% below that of the Africa continent (MOF 1999:8). Two main reasons have been identified for this down trend. The first reason is due to the old nature of significant percentage of the cocoa-tree stock(Anim-Kwapong and Frimpong 2005:3) and the second reason has been given by MOF(1999:9) as the poor yielding of the variety of the cocoa tree. Most of the tree stocks, as the literature continues, are of the Amazonia and Amelonado varieties, which have a lower yield as compare to the hybrid. Moreover, most major producing countries make use of better modern technology which supersedes that of the method used in Ghana. Majority of farmers hardly make use of fertilizers and pesticides. This
27

situation has calmed down with the introduction of the mass spraying programme in 2001/02(Anim-Kwapong 2005; MOF 1999:9). The characteristics of cocoa production in Ghana seem to merge with other producing country like Cote d’ Ivoire when emphasis is placed on the type of soil and climate. Both countries have the same climate and soil type. All the cocoa growing areas lie in the forest belt. The difference in yield may, therefore, be attributed to the level of input application, the old nature of the trees, farmers’ adherence to maintenance, and the acres of land farmers cultivate. Cultivation in Ghana has been on a smaller scale, and various attempts to embark on plantation in the 70s were failed as a result of difficulty in acquiring land, and in addition shortage of labour (MOF 1999:9).Table 2 .1: cocoa productions (thousand tonnes) of major producing countries in the World
Year /
Countries
99/00 00/01 01/02 02/3 03/4 04/5 05/6 06/7
Brazil 124 163 124 163 163 171 162 126
Indonesia 410 392 455 410 430 460 530 490
Cote d’Ivoire 1409 1212 1265 1352 1407 1286 1408 1292
Ghana 437 395 341 497 737 599 740 614
Malaysia 45 35 25 36 34 29 30 31
Source: ICCO Annual Reports (2002, 2005, 2006, 2008)
However, a look at table1 shows that Ghana’s production has improved as compare to other major producing countries like Indonesia, Brazil and Malaysia. A part from the 2001/02 production level which was lower than Indonesia, the country has performed better than these countries.
2.7 Government Agricultural intervention Policies
2.7.1 Trends in Agricultural Policies in Ghana From 1975 to 2008, various governments have embarked on policy initiatives with some being pushed forward by external agencies. These policies have intention of putting agricultural sector back on tract and improving upon on it. However most have failed due to inconsistencies in
28

its implementation and failure to put in place certain institutional structures. Even though 2001 was a year of total transformation of Agricultural policies in the cocoa sector, Nyanteng and Seini (2000) do not acknowledge that period. A contributing factor to this elimination is that, their paper was published before this remarkable period. To them agriculture policies can be analyzed by considering only the periods of 1970-82, and 1983-95, which is distinguished into pre-and post-structural adjustment periods. The period 70-82, was not a smooth one as far as policies towards agriculture is concern. It saw political instability and rampant changes in economic policies which had a negative effect on Agriculture sector. In a bid to recover the economy, the private sector was chosen as the engine of development. Agricultural inputs like equipment and machines were subsidized. Moreover, farmers were assisted with extension services. Coupled with that development boards were established for many commodities including cocoa. In addition, there was liberalization of the cocoa purchasing. This flourished the country with so many licensed buying companies (LBCs) (Nyanteng and Seini 2000). These policies were reversed after the economy went to the command type again. This was the period between 76 and 82. Policies in this period included a return to monopoly system of cocoa purchase, import controls, subsidization of imported consumer goods. In addition, operation feed yourself (OFY), a policy aim at achieving self sufficiency in food, was instituted. However, this period has been described by Nyanteng and Seine as a period of despair, as it was within this same period that saw farmers smuggling subsidized fertilizers and insecticides to obtain higher prices. Agriculture pricing policy channel revenue from out of agriculture in favour of urban consumers in a form of lower food prices (Hadjimichael et al. 1996:41). Moreover, there was frequent political anarchy through coup d’état, economic mismanagement and deterioration in terms of trade (Abizadeh and Yousefi 1996:206).
29
The period 1983-95 saw the need to revamp the economy. As a result, economic recovery programme (ERP) was lunched. This brought a new era for agriculture. Agricultural policy within this period was characterized by increase in the nominal producer price of cocoa and export crops at the expense of other crops (Naylor 2000:24). However, subsidies on fertilizer, pesticides and farm equipment were removed (Naylor 2000:24; Nyanteng and Seini 2000). The period was organized into two stages. The main objective in the first phase was to stabilize the economy, and improve government finances. And in Agriculture, the main objectives to attain self-sufficiency in cereal production, build up buffer stock for maize and cereals, ensure food security and price stabilization, and to boost cocoa production that would increase foreign exchange earnings (Nyanteng and Seini 2000). In order to review the structures in the economy which was acting as a hindrance to growth, the second phase of the ERP was instituted. It concerned the restructuring of the state’s institutions and practices especially in the cocoa sector. This was achieved with the assistance from the World Bank to increase efficiency in the production and marketing of cocoa. It was therefore dubbed the structural adjustment programme. To complement this effort, cocoa farmers were given a greater share of the world price. Conversely, the size of the cocobod was reduced. In addition there was removal of guaranteed minimum prices for maize and rice. Coupled with that the government no longer subsidized fertilizer, insecticides etc. (Naylor 2000:24; Nyanteng and Seini 2000). However, the situation was reversed during the Golding age of business for the country between 2001-the present day. The sitting government continue to improve the cocoa sector with free distribution of spraying chemicals to cocoa farmers to improve the yield. Furthermore, the producer price of cocoa was increase in 2001 and October, 2009. These were done to control pest and diseases that affect cocoa production, and also to boost the morale of farmers to put in their maximum best in the cocoa industry.
30

2.7.2 Types of agricultural policies Mundia (1991:16) defined agricultural policy as an instrument used to influence the allocation of resources within the agriculture sector and among several sectors of an economy. Cuong (2000:6) also defined pricing policy as a policy that concern the influence of the level of prices received by farmers and paid by consumers for farm products. However, agricultural price policy in simple terms can mean a government intervention that affects the prices of inputs and output of agriculture. The input price relates to fertilizers, studies of tractor prices, interest rates and wage rates (J. M. Rao 1989:6). Krueger (1996:165) distinguished between direct and indirect government policies. To him direct policies are those that are aimed directly at agriculture and include taxes on exports, subsidies on prices, whilst the indirect policies are those aimed at either the economy in general or other parts of the economy but in the long run affect agriculture. They include exchange rate policies, restrictive import licensing, import prohibition. These policies inflate the prices of inputs and food that the farmer purchases. Cuong (2000:6) also enumerated two types of interventions in agricultural price- direct and indirect. The direct include government procurement, import tariff, quota system and subsidies, while the indirect consist of exchange rate and credit policy.
2.7.3 Objectives of agricultural policiesDifferent objectives are outlined by different government towards agriculture in different country. Agricultural price support in United Kingdom in the 50s was intended to improve the net income of farmers so as to enhance their purchasing power. In addition, it was intended to encourage farmers to increase their output so that the country can be self-reliant and save its reserve (Drummond 1951:344). To Mollett (1988:20), the main objectives of the price policy is to stabilize prices for both producers and consumers, improve farmers income and also as output and export incentives. These are not different from Jabara’s
31

(1985:614) views on the objectives of agricultural policies in Kenya. To her, the government of Kenya intervene in the pricing and marketing of agricultural products in order to give producers acceptable and stable prices, and at the same time enable consumers to buy at reasonable cost. The intervention was also intended to protect domestic markets for import substitution crops. Government in both developed and developing countries have intervened in the market of agriculture to stabilize prices, subsidize food, build irrigation dams and support the use of fertilizers. They have been motivated by the incompleteness of the insurance market to give farmers credit, provision of public goods like water projects, imperfect information, externalities and distribution of income (Stiglitz 1987:43-45). Furthermore, in India, the main objective of the agricultural price policy was to target self-sufficiency in food production and to protect consumers (Vyas 1994:A58). To add, Mundia (1991:17-19) enumerated several objectives of the agricultural pricing policy. The main ones he mentioned are: to stabilize producers’ income, allocate resources, bring about desired levels of income distribution and as a means to promote production.
Based on the various objectives mentioned by the above researchers, it can be concluded that the main idea behind intervention of governments in the production and marketing of Agricultural commodities is to motivate farmers to produce and also to stabilize their income levels. Consumers too are not left out, as they also enjoy subsidized price of food.
2.7.4 Impact of Agricultural Policies on Production and Producers A paper by Thompson (2005) on trend analysis of cocoa production in Ghana gave a more elaborate analysis of the relative impact of cocoa disease and pest control programme (CODAPEC) and price policy on cocoa production in Ghana. He used econometric models in his analysis
32

to see the relative impact of production policy and pricing policy on cocoa production. However, his use of nominal producer price does not reflect the actual impact of pricing policy on cocoa production. Therefore nominal producer price is not a good proxy variable for pricing policy. Further, his choice of lag of output as proxy for production policy is suspicious. Lag of output may have a significant effect on supply of cocoa, but as to whether that can perfectly represent production policy is difficult to conceptualize. His justification for the use of that variable is based on Jordan and Anderson’s equation as quoted in Batten and Thornton (1985:420-421). They use lag of monetary and fiscal policy on Gross domestic product (GDP), which is quite different from the model postulated by Philip. In his findings, he argues that production policies in Ghana have had more influence on cocoa production than pricing policy within the study period. However, he also fails to account for the cost involve in each policy. The explanatory variables in his model were few, which indicates an omitted variable.
Continuing the argument, farmers engage in more agronomic activities as a result of favourable agricultural pricing policy and vice versa. Balassa(1990:389) attributes the poor performance of cocoa production in Ghana between 1963/64 and 1979/80 and the corresponding increase in Cote d’ Ivoire to the disparity in the price policy that was existing in these two countries. Citing from (Stryker and Brandt, 1985), he argued that farmers in these two countries were receiving different percentages of producer price to the world price. Farmers in Cote d’ Ivoire received a greater share of the world price than the Ghanaian counterparts: 20% against 84%. He further said that this boosted the farmers’ morale to engage in agronomic activities like replanting, new variety planting etc. This suggests the severe effect of the pricing policy in the two countries. However, things improved for Ghana when the producer price was increased in ’83 during the Economic Recovery Programme (ERP). Furthermore, a study by Abdulai and Rieder (1995:316-317) show that price policy affect the farmer’s decision on the maintenance of his farm in the short run. In trying to
33

estimate the impact of agricultural price policy on cocoa supply, they used time series to estimate their model. However, they fail to incorporate the effects of subsidies like fertilizer, spraying and other production policies. Moreover, they used the natural logs for all their variables which would only indicate responsiveness but not the absolute impact of the pricing policy. In addition, Miller and Tolley (1989:847,855) contrasted two effects of the price policy. They argue that it leads to the adoption of new technology by poor farmers when its prices are decreased.
Conversely, the increase in the producer price of output leads to misallocation of resources. The producer price affects planting and crop outputs. Thus, it informs the farmer on decision to allocate resources for production or not. Citing example from China and India, J. M. Rao (1989:6) asserts that incentives given to farmers in a form of price incentives through the pricing policy boosted their morale to shift resources from food to non-food crops. In addition, while credit facility for farmers in Zambia promoted an increase in production, it also led to misallocation of resources from Sorghum and Millet to Maize irrespective of higher sorghum price. This affected food security as area under cultivation for sorghum and millet declined significantly (Limbwambwa 1992:48). In Maharashtra, farmers preferred to cultivate sugarcane as a result of subsidies of water for irrigation at the expense of wheat which had lower domestic price (Ray and Williams 1999:939). This is meant to increase output as the price policy increase producer price in general (Mamingi 1996:36). The result is that the structure of production is changed. Extending the argument, Cleaver (1985:5) argues that farmers are moved by changes in the prices of inputs and output. From his findings, a 1% rise in the real producer price of cocoa paid to farmers caused output to rise by 0.39% in the short run and 0.77% in the long run. In analysing the findings of these researchers, it suggests that they were too descriptive in their analysis. In addition, their research was concentrated much on the effects of the price policy other than looking at other equally important policies.
34
Arguing further, producer price policy has a greater effect on production through smuggling. The higher the producer prices in a given country relative to the other neighbouring countries the smaller the incidence of smuggling. In their study of structural change in the supply response of Ghanaian cocoa production, Gyimah-Brempong and Apraku (1987:62) used a modified model of Batman’s model to analyse how cocoa output respond to price policy. In their conclusion, increasing producer price will not change production much, unless it is at the expense of food crops. However, their model is biased against production policies, since it laid emphasis on only the pricing policy. Moreover, their use of natural log may not give an absolute impact on the cocoa production, but only responsiveness. In addition, a competitive crop like maize or cassava would have been more appropriate instead of the aggregate food crops in general. Secondly not all crops are substitute to cocoa production.
The price policy is also a basis for cocoa farmers to neglect their farms. The discussions of Krueger (1996:166) show that policies of most Agriculture have been based on the ideology that developing countries can only grow through industrialization resulting in discrimination towards agriculture. He argue a case of Ghana where the price policy reducing the producer price paid to farmers by 20% lower than the existing one at independence, caused a corresponding decrease in the production of cocoa in the 80s. This led to the neglect of cocoa farms by farmers, and caused Ghana’s position in the world rank of cocoa. “of course , if the producer price is below the short run harvesting cost, farmers might choose not to collect their crops” (Bulir 1998:13).
However, further studies also show that farmers are motivated to enlarge their farm size as a result of intervention policies. In Vietnam, findings by Cuong show that government intervention policies have had a positive as well as negative effect on sugarcane production. In his findings, farmers were able to expand their production through access to loans, which was made possible by the credit policy. Area under
35

cultivation according to him increased from 143,200 hectares in 1993 to 224, 800 hectares in 1995. This made the country self-sufficient in sugar production (Cuong 2000:52). However, the high tariff and quantitative restriction also made domestic sugar less competitive because of over value of sugar than the world price.
2.7.5 Conditions necessary for effective Agricultural Policy
Farmers are very responsive to higher price, but at certain times this may not be so in developing countries due to many constraints that surrounds them. Some of these problems include provision of public good, irrigation and transport facilities, extension services, institutions, innovation and infrastructure (Limbwambwa 1992:11; Schiff and Montenegro 1997:393-394).
As a result the assessment of price policy is difficult to judge since policy is not the only determinant of price; market forces play a role (Krishnaji 1990:61). Arguing further, he claims that price support policy has meant increase of income to large farmers and at the same time higher social and private cost. Therefore a complementary package would be government policies in promotion of technology, infrastructure investments and provision of subsidies. This, according to him, would be preferred to depending on the price policy alone. He postulated that investment in irrigation activity supersedes the price incentive in promoting growth.
In addition, Janvry and Sadoulet (1987:230) assessed the Agricultural pricing policy and others on Agricultural prices, food subsidies using six computable general equilibrium model (CGE). In their findings, they stressed that the objectives of the price, productivity and investment policies being able to alleviate poverty will depend on certain determinants: availability of enough access to land for small farmers in order to produce what they consume, if they are to gain from increasing output with price support programmes; bridging the gap between
36

cropping patterns of small and large farmers with new technology if they differ.
Furthermore, Vyas (1994:A58) argue that the price policy has been weak in tackling issues of resource allocation, income distribution and food security. According to him, the policy is not suitable when considering aggregate products. He, therefore, considers the price policy as a weak instrument unless there is consistency between Agricultural price policy, and fiscal, monetary and trade policy.
However, the above researchers did not emphasis on marketing constraints. In addition their research was purely descriptive. Inefficiency in the marketing system or credit arrangements limits the efficiency of the producer price in affecting output (A.Meilink 1985:33).
CHAPTER 3
37

Theoretical Framework3.1 Supply Response Function
According to Salvatore (1991:14-18), the quantity of a commodity that an individual/firm is willing to supply within a specific period of time is a function of the price of the commodity and the producer’s costs of production. Further, in general terms, the supply function specifies the relationship that exists between output supplied and all factors affecting supply (Parkings et al. 2008). These factors include the price of the commodity, the price of other related commodities, prices of inputs, technology, etc. To obtain the supply curve, all these factors are held constant with the exception of the price of the commodity.
Extending the theory briefly, the individual/firm supply of a commodity is the quantity of a commodity that a single producer is willing to supply within a specific period of time at a given price. The sum of these individual/firm supplies gives the market or aggregate supply. Aggregate supply, therefore, shows the alternative amounts of a good supplied over a specific time period at various prices by all the producers of the commodity in the market.
The time period in these definitions distinguish the short run period from the long run. The short run is the period of time in which at least one of the inputs used by a firm is fixed. The fixed input is normally land or capital, but it can also be services of management. In this period the firm/individual can only increase output by varying one or more of the variable inputs (Lipsey and Chrystal 2007:120; McConnell and Bruce 1999:446; Stigler 1939:306). However, Bond (1983:709) contends this definition to be blurred when annual crop like cotton is considered, due to the possibility of altering both the acreage under cultivation and the intensity of farming within the short period. Conversely, the long run is the period long enough to allow a firm to vary all its factors of production (McConnell and Bruce 1999:446).
3.2 Agricultural Supply Response Function38

Agricultural supply is defined by Mamingi (1996:15) as the response of agricultural output to changes in prices, all other factors held constant, while aggregate supply function is defined as the function relating the aggregate agricultural output produced by all producers at different expected agricultural production prices, holding expected money prices, the state of technology, and weather constant with a given horizon (Herdt 1970:512).
Supply of agricultural products can be viewed in terms of aggregate supply, sub sectoral supply and individual crop supply (Mamingi 1996:2). In analyzing these terms, Bond(1983:723) concludes that both individual crop and aggregate crop production show a positive supply response This positive relationship of agricultural output to price is shared by Mamingi (1996:35-36) for both developed and developing countries. In support of these views, a paper by Gafar (1997:216) on how agricultural supply respond to price in Jamaica, concludes on his econometric findings that agricultural output responds positively to price. In addition, the response to changes in price for individual crops is higher than aggregate output, and greater in the long-run than in the short run (Binswanger 1989:232). And this, he said, is due to the fixed nature of some of the factors of production in the short run. Secondly it is easier to shift land, labour, fertilizer etc. from one crop to another than aggregate production.
However, Bond was very sceptical when it comes to agricultural supply response in sub-Saharan African countries. He finds agricultural supply to be unresponsive in the developing countries than the developed countries, and he attributes this to the fact that most of the farmers prefer leisure to income, after attaining a certain income target. Moreover, most farmers are risk-averse. These reasons were given to refute the argument that failure of most government boards to give an acceptable price for agricultural producers, even when the world price of these commodities increases, is responsible for the low agricultural production.
39

In addition to these supply of agricultural output-price relationships, Nerlove (1956:498) believes that farmers react not to last year’s price, instead to the expected price, and this expected price depends solely, to a limited extent, on last year’s price. He, therefore, disagree with many authors who directly attribute current output to last year’s price. This error has accounted for too low supply response to certain commodities.
Apart from the own price factor which affects agricultural supply, the price of other related products that could be produced, the price of inputs, technology advances, the number of individuals/firms producing the product and the weather are equally important factors that can influence agricultural product supply. These factors are also called supply shifters. Other non-price factors identified by Bond (1983) and Hattink et al. (1998:424) as affecting agricultural supply include poor transportation networks, inadequate research and extension facilities, unavailability of credit, shortages of fertilizer and other inputs, and lack of consumer goods on which the farmer can spend his income. However Bond agreed on the difficulty involved in measuring these factors. To him considering only price effect on output will not give a true reflection of the impact, and therefore, other factors have to be included since these factors are affected by government policies.
Further, the responsiveness of agricultural supply to these determinants differs from non-Agricultural products. Agricultural supply equation, Sloman (2006) argued, may relate current supply only to prices in the previous periods because of delays which are incorporated in the process of production. This is typical of perennial agricultural products. For example this year’s quantity of cocoa produced is a reflection of last year’s price. To Lipsey and Harbury (1992:88-89),
“It explicitly takes account of a time-lag in adjusting supply to the current market price. Thus the supply curve relates the quantity produced in any one year to the price ruling in the previous year”. To add, “Biological, technological and decision-making delays lead to the time lags
40
characteristics of the relationship of agricultural commodity market models”. This may take several time periods giving a distributed lag relationship as: St=α+β0Pt+β1Pt-1+β2Pt-2+........+βkPt-k+ut” (Hallam 1990:47).
3.3 Supply Response function of cocoa in Ghana
The supply of cocoa is determined by the number of cocoa trees per hectare, acre etc of land. It is a perennial crop which takes about 3-5 years to be harvested after planting, depending on the type of variety. However, harvesting is done annually once matured. From planting to harvesting involve a lot of time and effort. It is, therefore, a huge sacrifice to invest in it, but yields a lot of revenue to the farmer, and serves as an asset which can be passed on from one generation to another. Farmers are therefore, likely to invest in cocoa cultivation if they are assured of reaping higher returns relative to the cultivation of crops like maize, cassava, coffee etc. This is determined by the producer price. If the producer price is increase, farmers can only increase the size of their farms in the long run due to the fixed nature of the land. However farmers can respond to price increase in the short run by intensifying the use of fertilizers, application of spraying, and proper maintenance.
In his study of structural change in supply response of Ghanaian cocoa production between the period of 1933-1983, Gyimah-Brempong and Apraku (1987:62-64) estimated a supply response function in the logarithmic form to account for elasticities. Their estimated equation is:
LnQt= b0+ b1lnPt-8 + b2lnPt-12 + b3lnRt-1 + b4lnPWt-1 + b5lnFPt-1 + b6T + Ut
[1]
Where PW= world price of cocoa
41

FP= price of local food crops
T= time trend
Ut = error term
However, this model is an earlier improvement on Bateman’s model (Bateman 1965:392). Bateman estimated equation was:
∆Qt = a0+a1Pt-8+a2Pt-12+ a3∆Rt-1+ a4∆Ht-1+ a5Ct-8 + a6Ct-12 + Ut [2]
Where Qt = output in period t,
Pt = real producer price in period t,
R = July to October rainfall
H = Index of soil humidity
Ct = real producer price of coffee
Ut = error term
This study adopts Bateman’s model with few modifications. First, lag of output would be introduced to cater for the effects of previous excess supply on current output. The twelve and the eight year lags would be replaced with three and five year lags respectively to capture the effect of a previous increase in producer price in the third and fifth year of planting. This is done to include the various varieties of cocoa grown in Ghana: the hybrid which takes three years, and the Amazonia which mature after five years of planting. Secondly, i believe that government expenditure on cocoa disease and pest control programme (CODAPEC) has effect on yearly supply of cocoa beans. And since it takes a year/season to realize the effect, it is represented by a year lag. Thirdly, average annual temperature within the year is another determinant that was left out in their model. Temperature varying between 30-320C mean maximum and 18-210c mean minimum and absolute minimum of 100c are conducive for higher yield (Anim-Kwapong and Frimpong 2005:10).
42
However due to inconsistent in data available, temperature and rainfall variable are omitted.
Finally, the supply function is estimated as follows:
Qt=α0+α1Qt-1+α2Pt-1+α3Pt-2+α4Pt-3+α5Pt-5+α6FOBt-1+α7CODAPECt-
1+α8MPt+Ut [3]
Where, Q = harvested cocoa beans in period t,
Ut = error term in period t,
MP = Producer price of maize in period t,
CODAPEC = expenditure on production policy in period t,
FOB = international world price in period t.
Pt-i = Lagged Producer Price
Output is measured as total cocoa production in tonnes in Ghana. Price is the producer price in real terms administered by COCOBOD and paid to farmers. It also serve as an influential economic policy (pricing policy), and is set at the beginning of each crop season. Moreover, the producer price reacts positively to cocoa supply regardless of the fact that weather conditions can hinder supply. Furthermore, MP is measured as the price index of maize. It is included in the model, since maize compete with cocoa for resources. As a result, an increase in the price of maize relative to the producer price of cocoa would stimulate farmers to shift resources from the cultivation of cocoa to maize, if they consider it profitable than cocoa cultivation. In addition, the FOB is introduced to capture the expectation of cocoa farmers on the producer price.
43

CHAPTER 4
Methodology
4.1 Data Collection Method
Both primary and secondary data were used to solicit information from farmers in the study area. The research was conducted in three villages in two municipalities and a district. Questionnaire was administered, consisting of 29 question items, to 58 respondents (farmers) comprising 25 to respondents in Wenchi village and 19 to farmers in Akwadum. The rest of the questionnaire was administered to respondents in Asikuma. The information solicited from the farmers include demographic characteristics, producer price, the mass spraying exercise, socioeconomic characteristics, assets and marketing constraints. The sampling size was selected based on the fact that Wenchi has a population of approximately 500 inhabitants. More so not all the farmers benefitted from the mass spraying exercise. The same reason applies to Asikuma and Akwadum with population of 1640 and 200 inhabitants. In addition not all the inhabitants are cocoa farmers, and not all those who are cocoa farmers benefitted from the programme.
In addition to the primary data, secondary data was gathered to analyse the main objectives of the study, and this covers the period 1978 to 2007.It constitutes data from published sources on government producer price, production levels, constraints in the cocoa industry, challenges of the internal and external marketing and government’s overall policy initiatives in the industry over the study period. Information on the mechanisms of the cocoa industry was solicited. Data
44

on cocoa nominal producer price and output were obtained from the cocobod, as well as expenditure on codapec. Data on maize was taken from the FAO (Food and Agricultural Organization) statistics. Data on FOB was retrieved from Anim-Kwapong and Frimpong (2005). The real producer price of cocoa and maize were obtained by deflating the nominal producer prices to 2000 prices
4.2 Sampling technique Since it was difficult to identify farmers who benefitted from the mass spraying exercise, snowball sample methods were used to solicit information from farmers. This is because the researcher was interested in those who benefitted from the mass spraying exercise. Based on this, the sample size was selected by taking into consideration the population in the villages, the number of acres that farmers cultivate, and the population of those who benefitted from the mass spraying exercise. These were done to overcome time and resource constraints.
Three villages were selected from two different municipalities and a district. The villages were Wenchi in Bibiani Anhwiaso Bekwai district, western region; Akwadum in the New Juaben Municipality, eastern region; and Asikuma in the upper Denkyira east municipality, central region. Wenchi was selected based on the records that western region, out of the six cocoa producing regions in Ghana, produce 50% of the total. The villages, Akwadum and Asikuma were included because of their location in the least produce regions to give disperse of respondents.
4.3 Analytical Framework
4.3.1 Effects of Price and Production policy on Cocoa Supply
In analysing the effects of pricing policy and production policy on supply of cocoa, econometric model, and various statistical tests was estimated using time series. The long-run estimated model is:
Qt=α0+α1Qt-1+α2Pt-1+α3Pt--2+α4Pt-3+α5Pt-5+α6FOBt-1+α7CODAPECt-
1+α8MPt+Ut [4]
45

This is an Autoregressive model due to the fact that supply of cocoa is affected by price and output in the previous period. In addition, since the data involves time series, test on stationarity was very essential. This was done to overcome spurious regression. Test on cointegration was also conducted to establish whether there is a long run relationship between output and the explanatory variables. Beside, the impact and the predictability of the pricing and the production policy was analysed to show the effects of the pricing and production policy using the beta coefficient. This was consolidated by F-test and the coefficient of determination R2.
Unit root test was also conducted for the variables output and its lag, price and its lags, lagged international price, lagged codapec and the price of maize. Augmented Dickey Fuller (ADF) test was used to test for the presence of unit root. The null hypothesis of the test is that the data has a unit root (H0: δ=0) and the alternative hypothesis is that the data is trend stationary (H0: δ<0). To avoid spurious regression due to regression of nonstationary time series on another, unit root test is normally conducted on each of the variables involve. This is similar to the test for cointegration, but they are not identical. While unit root test is perform on univariable tie series, cointegration concerns the relationship among a group of variables with each having a unit root (B.B Rao 1995:11). It therefore involves the process of testing for a unit root. If through this process, a nonstationary series becomes stationary by differencing it once, the series is said to be integrated to order 1, and is denoted by I(1). Further, if the series is difference ‘m’ times, it is said to be integrated to order I (m). In addition, there can be I(2) series that are cointegrated to produce I(1) or I(0) (Maddala and Kim 1998:24). In economic theory, two variables are cointegrated if they have along run relationship (Gugarati 2003:822). ADF test was used to test for the presence of cointegration between cocoa supply, price and other explanatory variables. Residuals were generated and its stationarity was tested if it is in the order of I (1) or I (0). Existence of long-run
46

relationship was realised at first difference, which called for the formulation of the error correction model.
An error correction model enables us to study the short-run dynamics in the relationship between two series (Wooldridge 2003:592). The Engle and Granger two-step error correction model was estimated. This model is presented below:
DQt =α+β1DPricet-1+β2DQt-1+ β5DFOBt-1+β4DPt-1+β5DPt-2 +β3DCodapect-1
+β4PMt + γ (Qt-1- δ1Pt-1+ δ2Pt-5 + δ3FOBt-1 + δ4Codapect-1) + εt
[5]
Where γ is the parameter of error-correction term which is represented in parenthesis, and shows the speed of adjustment to instability conditions; D is a first-difference operator; ε t is an error term. Also the variables in the parenthesis represent the long run part of the model while the rest indicate the short run part. This model is similar to Engle and Granger two-step error correction model.
4.3.2 Socioeconomic characteristics of cocoa farmers
The effects of the production or the pricing policy would also be dependent on its impact on cocoa farmers, who are the sole supplies of cocoa produced. Further, a policy may be more effective but certain negative practices may overshadow farmers from realising the actual benefits. The second question would, therefore, be answered by ascertaining from farmers about the improvement they have chalked within the last eight years in terms of their income level, their spending habits, the number of cocoa bags they used to harvest before the last eight years and the last eight years, their educational background, assets they have been able to acquire in the last eight years, Information about the rate of land litigation of these farmers would also be collected. This information would be acquired using questionnaire. The results would be analysed using bar graphs and tables.
47

CHAPTER 5Analysis of the effects of Agricultural pricing and production policy on cocoa production and wealth of the farmer5.1 Introduction
This chapter analyses and interprets the result to answer the questions asked in the study. Question one: How has the Agricultural pricing and production policy affected cocoa production? Question two: How has the introduction of the cocoa disease and pest control programme in 2001 improved the socioeconomic characteristics of farmers? It begins by first looking at the descriptive characteristics of cocoa production, producer price, international price, price of maize. The results of the model and trend of cocoa production in Ghana are then presented and analysed to answer question one using time series. The effect and the predictability of the pricing policy and production policy are analysed using the beta coefficient to answer the first question. Preceding the second research question is descriptive analysis of the marketing constraints, the profile of the study area and demographic characteristics of the respondents. The second research question on socioeconomic characteristics of the respondents is answered using Chi square, tables and graphs. The range of responses were coded and entered into stata and statistical package for social Science (SPSS), to answer the research question.
5.2 Descriptive StatisticsFigure 5.1: Trends in Ghana Cocoa Production and Prices
48

2000
0040
0000
6000
0080
0000
outp
ut( i
n to
nnes
)
010
0000
0200
0000
3000
0004
0000
00pr
ice
( in
real
term
s)
1970 1980 1990 2000 2010year
price output
Source: Author computation
It can be deduced from figure 5.1 that production levels in Ghana have not seen much increase prior to 2001/2002 crop season. Before 1980 higher production levels were corresponding to low producer price. Farmers were, therefore, not much responsive to the low producer price before this period. Though the country achieved a record crop of 591,031 metric tonnes in 1964/65 season, production fell from 1970/71 crop year to as low as 158,956 metric tonnes in 1983/84 season. Contributing factors to this abysmal performance include low producer price coupled with diseases and pest. Prominent to this is the swollen shoot disease which affected a sizable number of cocoa trees. To solve this unfortunate situation, farmers were asked to cut down their cocoa trees, and this was a major factor that pushed the industry to its lowest level Macroeconomic policies taken at that time, therefore, aggravated the situation. However, production levels have seen some resurgence in recent times following this longer period of severe fluctuations. The country received a production boom between the period of 2001 and 2003, though with mist fluctuations, it was better than the decline between the periods of 1984 and 1999. This boom has been attributed primarily to government sponsored cocoa pest and disease control programme introduced in 2001, and to some extent widespread use of
49

fertilizer by a number of researchers, relegating the effects of producer price within the period from 2001 to present. But caution should be drawn here. Corresponding to the increase in production levels is a continue increase in the real producer price, even though, with mild fluctuations. Therefore this paper disagrees to numerous writers who attribute the higher increase in cocoa production solely to the mass spraying exercise within the period 2001 to present. The mass spraying exercise is a contributing factor but not the only factor. To support this argument further, there was a continual increase in production levels from 1990 to 2000, but with no mass spraying exercise. Therefore both pricing policy and the production policy have a positive effect in stimulating cocoa production. In addition to price-output relationship, the international cocoa price (FOB) also determines what farmers should expect, even though the local price may not always respond to the international price, as compare to other countries like Cote d’ Ivoire and Togo. A look at the relationship between the international price and the local producer price will ‘somehow’ predict what farmers should expect (see figure 5.2)
Figure 5.2: Trends in FOB and producer price of Cocoa in the local currency (Ghana Cedi)
010
0000
0200
0000
3000
0004
0000
00pr
oduc
er p
rice(
in re
al te
rms)
050
0000
010
0000
0015
0000
00In
tern
atio
nal p
rice
1980 1990 2000 2010year
international price producer price
50

Source: Author computation
The international price of cocoa has been smooth and increasing from the period of 1980 to present. Even though 1999/00 and 2003/4 show some bump, it has been smooth throughout. However, the same thing cannot be said of the producer price which has been increasing and at the same time been fluctuating. Therefore to some extent the international price does not give an exact prediction of the producer price. Farmers cannot, therefore expect an increase in producer price in real terms, anytime there is an increase in the international price. This may be explained by cost of living and inflation. In addition, farmers receive only a portion of the increase in international price, and this is determined by cocobod.
Figure 5.3: Trends in Cocoa production (tonnes) and price of Maize (in Ghana Cedi)
2000
0040
0000
6000
0080
0000
prod
uctio
n of
coc
oc(to
nnes
)
050
0000
1000
000
1500
000
pric
e of
Mai
ze(in
real
term
s)
1980 1990 2000 2010year
Price of Maize cocoa production
Source: Author computation
Figure 5.4: Trends in Cocoa (tonnes) and Maize production (tonnes)
51

2000
0040
0000
6000
0080
0000
coco
a pr
oduc
tion
(tonn
es)
050
0000
1000
000
1500
000
mai
ze p
rodu
ctio
n( to
nnes
)
1980 1990 2000 2010year
maize cocoa
Source: Author computation
Figure 5.5: Trends in cocoa and maize prices
Source: Author computation
The price of maize is another factor which can affect the production of cocoa in Ghana. This is because most of the cocoa farmers also grow maize alongside cocoa farming. Further, the price of maize is highly correlated with the price of other staple food in Ghana. As a result, the price of maize relative to the price of cocoa is enough to determine the cocoa supply. Maize price is, therefore, a substitute crop which captures
52
010
0000
020
0000
030
0000
040
0000
0P
rice
of C
ocoa
( C
edi p
er to
nne)
050
0000
1000
000
1500
000
Pric
e of
Mai
ze (C
edi p
er to
nne)
1980 1990 2000 2010year
Maize Cocoa

the effect of shifts from cocoa in times of decline. This can be verified from the three diagrams above. A look at figure 5.5 shows that both the price of maize and that of cocoa show upward trend with few fluctuations. However the maize price seems to be doing well at the early stages of 80s than cocoa price. Nevertheless, cocoa prices have performed better in general terms as compare to the prices of maize. It is therefore unlikely, but it can be possible, that farmers may shift from cocoa production to maize production within the periods indicated. The mere fact that both prices have been increasing will cause output of both commodities to increase (figure 5.4). However, it is believed that instead of farming new cocoa farms, most farmers cultivate maize. Figure4 shows that maize production has been extremely higher than cocoa production before the 2003 period. It was only 2004 to 2007 that cocoa production has been performing better than maize production. Therefore a possible shift from cocoa to maize is infinitesimal, and will not be recognize.
5.3 Effects of Price and production policy on Cocoa production5.3.1 Test for Unit root The results for unit root test are summarized in table 5.1. Using Dickey Fuller test (DA) for stationarity, unit root test was conducted for each of the variables used in the regression. The variables include lag of price, lag of output, lag of price in the second, third, fourth and the fifth year, lag of FOB, lag of Codapec, and the price of maize. The results show that all the variables were not significant at levels except the price of maize. Therefore the results suggest that the researcher failed to reject the null hypothesis of the presence of a unit root. To proceed, the variables were differenced for only once to become stationary. These findings (table 5.2) which reveal that all the variables are integrated to order one, I(1). The series are therefore Autoregressive processes, AR (1). The null hypothesis can therefore be rejected in favour of the
53
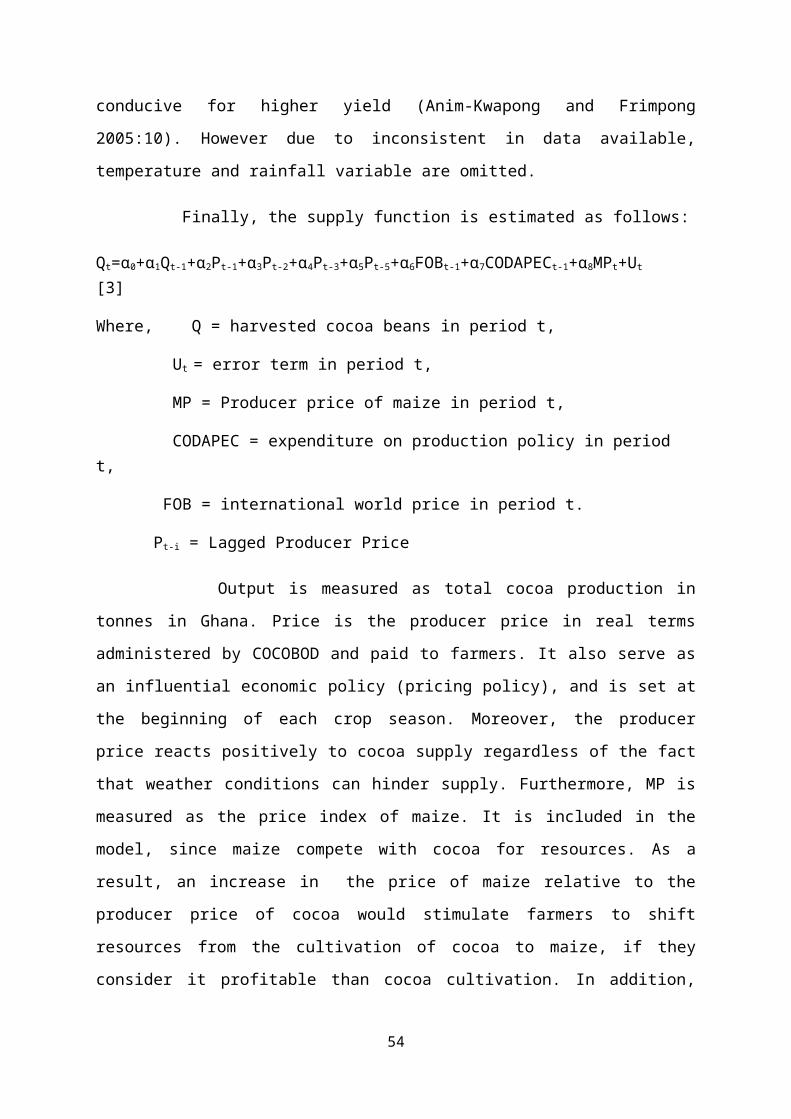
alternative hypothesis, which state that the series are stationary. Consequently, cointegration test is necessary to establish a long run relationship between the supply of cocoa and the other variables in the model.
Table 5.1: Unit root test for all the variables at levels
Variable Test statistics 1%critical 5%critical 10%critical Decision
Pricet-1 -1.500 (0.5333) -3.730 -2.992 -2.626 Non-stationary
trend -2.676(0.2463) -4.352 -3.588 -3.233 ׳׳׳׳
ADF test -2.385(0.9871) -4.371 -3.595 -3.238 ׳׳׳׳
Outputt -0.967(0.7651) -3.723 -2.989 -2.625 ׳׳׳׳
trend -2.863 (0.1747) -4.334 -3.530 -3.228 ׳׳׳׳
ADF -2.198 (0.4909) -4.362 -3.592 -3.235 ׳׳׳׳
Pricet-2 -1.270 (0.6429) -3.736 -2.994 -2.628 ׳׳׳׳
Trend -2.677(0.2460) -4.362 -3.592 -3.235 ׳׳׳׳
ADF -2.027(0.5867) -4.380 -3.600 -3.240 ׳׳׳׳
Pricet-3 -0.795 (0.8207) -3.743 -2.997 -2.629 ׳׳׳׳
Trend -2.361 (0.4008) -4.371 -3.596 -3.238 ׳׳׳׳
ADF -1.365 (0.8709) -4.380 -3.600 -3.240 ׳׳׳׳
Pricet-4 -0.415 (0.9075) -3.750 -3.000 -2.630 ׳׳׳׳
Trend -1.293 (0.8897) -4.380 -3.600 -3.240 ׳׳׳׳
ADF -2.038 (0.5805) -4.380 -3.600 3.240 ׳׳׳׳
Pricet-5 -0.707 (0.8450) -3.750 -3.000 -2.630 ׳׳׳׳
Trend -1.293 (0.8897) -4.380 -3.600 -3.240 ׳׳׳׳
ADF -1.544 (0.8134) -4.380 -3.600 -3.240 ׳׳׳׳
MPt -3.891(0.0021)*** -3.723 -2.989 -2.625 Stationary
Trend -4.930(0.0003)*** -4.343 -3.584 -3.230 ׳׳׳׳
ADF -3.971(0.0097)*** -4.362 -3592 -3.235 ׳׳׳׳
FOBt-1 -2.531 (0.9991) -3.750 -3.000 -2.630 Non-stationary
Trend 0.011 (0.9943) -4.380 -3.600 -3.240 ׳׳׳׳
ADF 0.924 (1.000) -4.380 -3.600 -3.240 ׳׳׳׳
Codapect-1 -0.382 (0.9130) -3.730 -2.992 -2.626 ׳׳׳׳
Trend -1.514 (0.8242) -4.352 -3.588 -3.233 ׳׳׳׳
ADF -1.037 (0.9389) -4.371 -3.596 -3.238 ׳׳׳׳
Notes: Standard errors in parentheses *** p<0.01, ** p<0.05, * p<0.1.
54

Table 5.2: Stationary test at First difference for all variables
Variable Test statistics 1%critical 5%critical 10%critical Decision
outputt -7.241*** (0.000) -4.371 -3.596 -3.238 I(1)
Output-1 -6.606*** (0.000 -3.736 -2.994 -2.628 I(1)
Pricet-1 -5.427*** (0.000) -3.736 -2.994 -2.628 I(1)
Pricet-2 -5.524***(0.000) -3.743 -2.997 -2.629 I(1)
Pricet-3 -5.825*** (0.000) -3.750 -3.000 -2.630 I(1)
Pricet-4 -5.700***(0.000) -3.750 -3.000 -2.630 I(1)
Pricet-5 -5.363*** (0.000) -3.750 -3.000 -2.630 I(1)
Codapect-1 4.301***(0.0004) -3.736 -2.994 -2.628 I(1)
FOBt-1 -3-511**(0.0077) -3.750 -3.000 -2.630 I(1)
Notes: Standard errors in parentheses. *** p<0.01, ** p<0.05, * p<0.1
5.3.2 Test for Cointegration Diagnostic test was conducted on the long run model as summarized in table 5.3. To test for the long run relationship among output, price, and expenditure, residual was generated, and its stationarity was tested to confirm cointegration using Dickey-Fuller test for cointegration. The t-statistic of -4.654 is significant at 1% level of significance, which is above the critical values of -4.380, -3.600 and -2.630 at 1%, 5% and 10% respectively. Moreover, without a trend, the residual is still significant at 1%. Addition of a trend to the model indicates that the model is trend stationary. This was done to add to the error correction model (ECM), if the residual is trend stationary.
Table 5.3: Cointegration Test using Dickey Fuller
Test Statistics 1% Critical 5% Critical 10% Critical Decision
Residual -4.611***
(0.0001)
-3.750 -3.000 -2.630 I(0)
Residual
(Trend)
-4.654***
(0.0008)
-4.380 -3.600 -3.240 Trend
Stationary
Notes: Standard errors in parentheses *** p<0.01, ** p<0.05, * p<0.1
5.3.3 Cointegration Analysis Table 5.4 below shows the summary of the cointegration analysis. The test shows that in the long run, supply of cocoa is
55

responsive to lag of price, lag of five-year price, lag of codapec and the international price. The beta coefficient of 577.8 shows a positive impact of previous price on output. In other words, it indicates that a 10% increase in price in the previous year would increase output of cocoa production by 5778 tonnes, and this is significant at 10% level of significance. Moreover, the coefficient of lag of price in five years is also significant at 10%. Its value is 446.3. This suggests that a Cedi increase in price in the previous five years would increase current output by 446.3 tonnes. The expenditure on codapec is significant at 10%, but with the wrong sign. The explanation to this has been given under the error correction model. However the international price for cocoa has the correct sign and is significantly different from zero. It shows the expectation of farmers about what they would receive as producer price. But the size is too small: about 0.0480. This indicates that farmers would supply additional 4.8 tonnes of cocoa if there is a percentage increase in the international price. Further, the constant shows that if there is no explanatory variable, production levels would remain at 246818 tonnes. Finally, the R-squared shows that the explanatory variables explain about 93% changes in cocoa output in the long-run.
Table 5.4: Cointegration Analysis/Long-run
56

Notes: Standard errors in parentheses *** p<0.01, ** p<0.05, * p<0.1
The above cointegration regression results for cocoa supply (Qt) with lags of real producer price of cocoa (Pt-1, Pt-2, Pt-3, Pt-5), real producer price of maize (PMt), World international price of cocoa (FOBt), lag of cocoa supply (Qt-1) and lag of expenditure on spraying (CODAPECt-1) are presented in the equation below:Qt
s = 246818 – 0.612 Qt-1s + 577.8 Pt-1 + 583.3 Pt-2 - 312.3 Pt-3 + 446.3 Pt-5 -
0.0738 PMt
Se= (89970) (0.361) (277.5) (583.3) (291.6) (236.5) (0.083) t = [2.74] [1.69] [2.08] [1.60] [1.07] [1.89] [0.89]+ 0.0480 FOBt-1 – 6787 CODAPECt-1
(6)
57
Dependent Variable(output)
Independent Variables
Outputt-1 -0.612
(0.361)
Pricet-1 577.8*
(277.5)
Pricet-2 583.3
(364.1)
Pricet-3 -312.3
(291.6)
Pricet-5 446.3*
(236.5)
Maizet -0.0738
(0.083)
Codapect-1 -6787*
(3606)
FOBt-1 0.0480**
(0.0169)
Constant 246818**
(89970)
Observations 30
R-squared 0.925
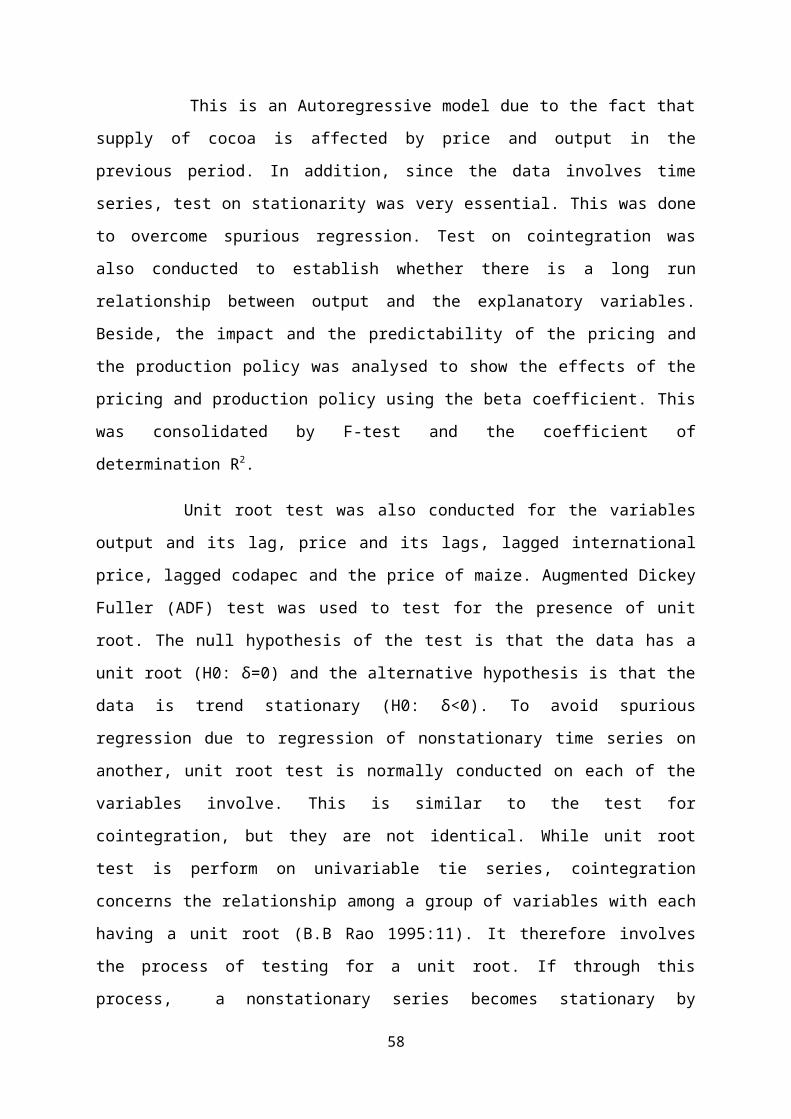
(0.0169) (3606) [2.83] [1.88]R2 = 0.925 R2 = 0.887 n = 30
5.3.4 Error Correction Model The ECM provides a nexus between the long run equilibrium and the short run disequilibria dynamics. The results for the model are presented in table 5.5. This is also shown in equation 7. The F-test was significant at 1% indicating the joint explanatory power of the explanatory variables. Moreover, the R-squared can explain 80% of the changes in cocoa supply due to lags of prices, lag of output and codapec. And this value justifies the statistical fit of the model. The negative value of the lag of residuals confirms the validity of the ECM test. It is the coefficient of the error correction mechanism which was estimated at -0.65, and shows that 65% of disequilibrium in cocoa supply is corrected in a given year. Stated differently, it indicates that the distortions of cocoa supply from its long-run equilibrium level are corrected by about 65% per annum. The lag of price coefficient, 888.4 means that the supply of cocoa in the current year is influence by producer price in the previous year. This means a 10% increase in producer price in the short run would increase cocoa supply by 8884 tonnes in the following year. And this is significant at 10%. This means that farmers’ decision to embark on maintenance, pruning and other agronomic activities is influence to a large extent by the producer price. In addition, the two-year lag of price is also significant at 5%, and suggests that a 10% increase in the producer price in the two previous years would increase cocoa output by 7578 tonnes in the short run. Furthermore, the lagged codapec is significant at 1% but contain the wrong sign. An increase in government expenditure on free mass spraying in the current year should have yielded an increase in cocoa production, this is the opposite. The reason is that the mere fact that expenditure has been allocated for the programme does not mean that the expenditure actually occurred. There were various reports from the
58
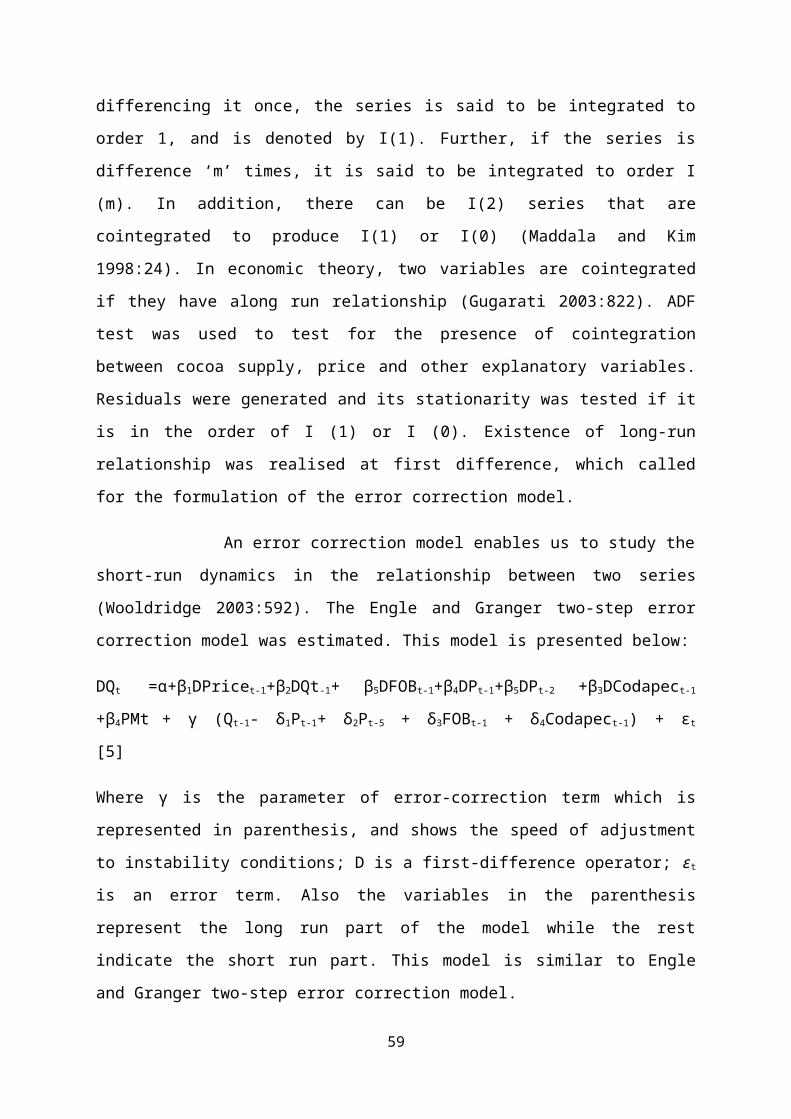
micro data that gangs were reluctant to visit farmers whose farms were very far. Coupled with that, chemicals are normally sold for money at the expense of the programme which is meant for free. Also, reports from individual farmers has it that gangs were using ordinary ‘blue’ for washing as a substitute for spraying chemicals. Consequently, farmers who are not suspicious of any misdeeds will reduce the number of times they spray their farms which will cause a fall in their yield. Further, the price of maize, which is the price of other related commodity to cocoa, was not significant both in the short and long run but has the correct negative sign (Table 5.5). This result is contrary to the one obtained by Abdulai and Rieder (1995:328). The sign for their estimate was negative and significant for the price of maize. This means that the relative price of maize does not affect planting of cocoa trees in the short run. The lagged output is however significant and have the expected sign. This suggests that a 10% increase in over supply of cocoa beans would lead to 7.8% decrease in the current year through the cobweb theory. Lastly, the FOB which is a proxy for producers’ expectation contains the correct sign but is not significant in the short run. And the fact that this is not significant does not mean that farmers are ignorant about the world market price of cocoa. An increase in the international price of cocoa informs the farmers, but unlike the producer price of cocoa, it does not affect cocoa supply directly.
Table 5.5: Short-run Model/Error Correction Model
Independent Variables Doutputt
Doutputt-1 -0.7816**
(0.2083)
DPricet-1 888.4**
(254.5)
DPricet-2 757.8**
(234.2)
MPt -0.101
(0.081)
59

FOBt-1 0.0120
(0.017)
DCodapect-1 -8430.7**
(2859.8)
time 6008.5**
(2012.4)
Lresidual -0.652**
(0.284)
Constant -8090.6
(63386.6)
Observations 24
R-squared 0.802
Notes: Standard errors in parentheses *** p<0.01, ** p<0.05, * p<0.1
DQt = -8090.6 – 0.782DQt-1 + 0.012DFOBt-1 + 888.4DPt-1 + 757.78DPt-2 – 8430.7DCodapect-1 Se = (63386.6) (0.2083) (0.0171) (254.5) (234.2) (2859.8) t = [-0.13] [-3.75] [0.70] [3.49] [3.24] [-2.95]
-0.101PMt – 0.652( Qt-1 - 888.6Pt-1 – 684.5Pt-5 – 0.074FOBt-1 + 10409.5 Codapect-1) + et (0.081) (0.284) [1.24] [2.30] (7) R2 = 0.802 F-test = 0.0004 n=30 5.3.5 Conclusion
60
The results show that the pricing policy of cocoa has had a great impact on cocoa supply. It has helped the farmers to be more responsive in allocating their resources to the production of cocoa. However, the same thing cannot be said of the production policy (Codapec). It has responded negatively to the production of cocoa. This has been due to many negative practices which have been explained above (Page 47).
5.4 Effects of the pricing and production policies on the socioeconomic life of the cocoa farmer
5.4.1 Profile of the study Area
The micro data for the research was obtained from a survey conducted in three villages namely Asikuma, Akwadum, and Wenchi between 2nd July and 19th August, 2009. Asikuma is located in the upper Denkyira east municipality, and lays and ׳50.30 north ׳60.02 of the equator.1 The municipality covers land area of 17000sq km. Asikuma has a population of 1641 as at 2000 census conducted, and dominated by farming activities, with most of the inhabitants being cocoa farmers.2 The mean annual temperatures for the municipal are 24℃ and 29℃. It has a mean annual rainfall of between 1200mm and 2000mm, with vegetation being semi-deciduous forest. The distance from Asikuma to the municipal capital, Dunkwa, is about 4km.3
The second village was Wenchi which is situated in the Bibiani-Anhwiaso-Bekwai District. The district is located between latitude 60N, 30N and longitude 20W, 30W. The district has a population of about 120, 869 with Wenchi having a little below 5000, with a distance of about 4miles from the district capital, Bibiani. The climate district is the equatorial climate with annual rainfall average between 1200mm and 1500mm. The average temperature throughout the year is 26℃ with relative humidity of 75% and 95% in the afternoon and night respectively. Moist-deciduous forest vegetation underlay the area and is
1 http://www.ghanadistricts.com/districts/?r=3&_=60&rlv=location (Accessed 15/10/09) 2 http://www.ghanadistricts.com/pdfs/upper%20denkyira%20-demo..pdf (Accessed 15/10/09) 3 http://www.ghanadistricts.com/districts/?r=4&_=146&rlv=climate (Accessd 15/10/09)
61

endowed with rich forest ochrosols and forest oxysols which are suitable for the cultivation of cocoa and other food crops.4
The final village of the survey is Akwadum which has a population of about 200, and is found in the new Juaben municipality. The distance from Akwadum to the municipal capital, Koforidua is about3km. Rainfall in the area is between 1200mm and 1700mm, with a minimum and maximum temperature of between 22℃ and 32℃. Average sunshine ranges from 2-3 hours in the wet months of July to September, and rises to 5-7 per day from October to June. The semi-deciduous rain forest is suitable for the cultivation of cocoa and other food crops.5
5.4.2 Descriptive statistics5.4.2.1 Determining the extent of agreement on the problems of
internal marketing constraints.An efficient marketing system is needed to promote higher production. It is also a booster to the farmer. The inefficiency in the marketing system obscures the true effects of the policies to be realised. This is because it affects the income of the farmer and in addition his socioeconomic well being. It was therefore necessary to delve into the marketing constraints facing farmers in the study area. 58 cocoa farmers from the selected towns in the 3 different districts were questioned on their mode of operations and problems facing them with regards to marketing of their cocoa beans. Most farmers were indifferent about the constraints faced by their colleagues in the other towns. There was, therefore, the need to identify the major marketing constraints faced by farmers, and in addition estimate the extent of agreement among the constraints identified. From table 5.6, the major constraints that farmers identified were ranked and their respective means presented as shown. The Kendall concordance coefficient (w) calculated was 026(26%) at 5% level of
4 http://www.ghanadistricts.com/districts/?r=5&_=135&sa=2799 (Accessed 15/10/09) 5 http://www.ghanadistricts.com/districts/?r=4&_=146&rlv=climate (Accessd 15/10/09)
62
significant. The low value indicates that the respondents (the farmers) do not collectively agree to the rankings of the identified constraints. This is due to the fact that respondents were selected from different districts and in different towns. What might be a number one problem in one town may not be so in the other. In addition, certain farmers were of the view that they are familiar with some of the purchasing clerks and therefore problems like scale adjustment was not a problem. However, others find this as their number one problem.
Table 5.6: Ranked Marketing Constraints
Constraints Overall Rank Mean Rank
Scale Adjustment 1 1.93
Delay in Payment 2 2.74
Transportation 3 2.76
Rejection of beans 4 3.62
Loan Repayment 5 3.95
Source: Author’s computation
The most pressing constraint was the scale adjustment. The mean for this constraint was 1.93(Table 5.6), and was ranked 1st by the respondents. The second most pressing constraint on the list was delay in payment. In most periods purchasing clerks (PC) were not able to instantly pay for the beans sold by farmers, and farmers have to wait for a number of weeks and months to receive their cash. This constraint was ranked 2nd with a mean score of 2.74. Loan repayment was considered as the least pressing constraint with a mean score of 3.95. Most of the farmers face a problem of dilemma as to how to market their product to the PCs, after taking a loan from them. They, therefore, pass through difficulties trying to find a new PC to get their beans sold.
5.4.3 Demographic Characteristics of RespondentsIn the researcher’s view cocoa farming is likely to be affected by the age, gender, marital status, the number of years one has been farming as well as the educational level of the individual farmer.
63
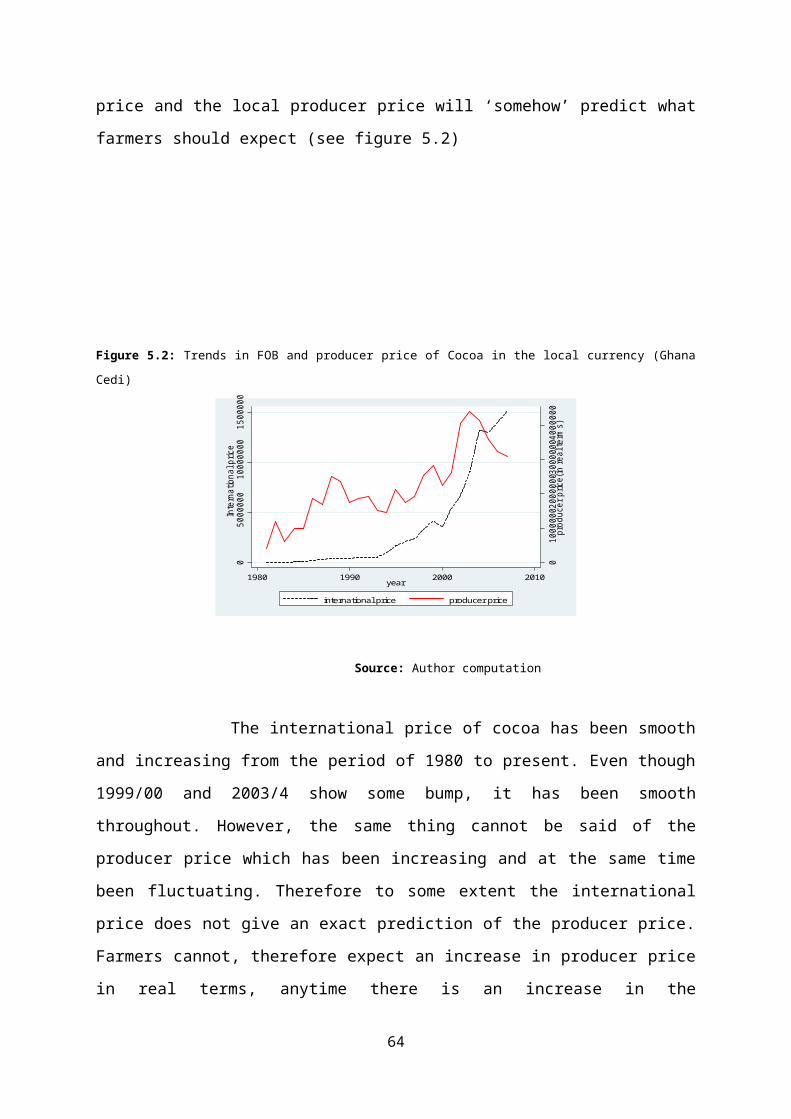
Cocoa farming involves a lot of tedious activities including pruning, weeding, harvesting, and fermentation, and drying, which in that case is expected that the youth involve much in it than the elderly. The effort that the aged may invest in the farming will therefore be limited which will affect their income levels. Contrary to this, as large as 31 respondents constituting about 53.45% out of the 58 respondents were in the aged group with only about 4 respondents in their 30s (table 5.7). This goes on to disprove the assertion that cocoa farming is for the energetic. Since the aged can hire as much labour as he/she can, if funds are available.
Table 5.7: Respondents age
Age Frequency percentage cumulative
20-29 1 1.72 1.72
30-39 4 6.90 8.62
40-49 8 13.79 22.41
50-59 14 24.14 46.55
60+ 31 53.45 100.00
Total 58 100.00
Source: Author’s computation
However, the place where respondents practice cocoa farming in Ghana has a greater influence on the number of output that they produce. The western region is noted for the highest production of cocoa in Ghana, and it is not something new when out of the 31 respondents who were able to produce above 21bags per hectare per annum, 20 respondents were farmers from Wenchi in the Western Region of Ghana.
Table 5.8: Number of bags per hectare produced by respondents from different villages
Bags per hectare
Akwadum Asikuma Wenchi Total
20 and Less 10 12 5 27
64

21+ 4 7 20 31
Total 14 19 25 58
Pearson chi2 (2) =12.6716 pr=0.002
Source: Author’s ComputationThis is supported by the Chi square value of 12.6716 which is significant at 1% level of significance, at a probability value of 0.002. This proves the fact that the village where one resides has a strong relationship with the number of cocoa bag that one produces. On the contrary, educational level was expected to have a close relationship with the number of bags that one produces. The researcher was in support of the fact that the higher one is educated, the more he/she is able to apply the right mechanism in the cocoa farming which will boost his output and improve his income. But this ideology is slightly disputed in the survey area. Even though, Table 5.9 shows that a sizable number of 24 educated elite were able to produce 20 and above number of cocoa bags as against 7 uneducated respondents who could produce that amount. This is about 54% as against 50%, but this number is not significant comparing the number of the respondents of the uneducated.
Table 5.9: Educational level of respondents in relation to the number of bags per hectare
Number of bags per hectare
Educational level
20 and less 20+ Total
educated 20 24 44
uneducated 7 7 14
Total 27 31 58
Pearson Chi 2 (1) =0.0882 pr=0.766
Source: Author’s ComputationThis is supported by the value of the chi square, which is 0.0882 and a probability value of 0.766. At 5% significance level, this value is not significant. This may probably be due to the fact that the educated elite
65

might be involved in other kind of work, and may not have a full concentration on his farm. However, when it comes to the number of years that respondents have been working as cocoa farmers, it matters a lot. The number of years that one has been in the cocoa farming will enable the correspondents to be objective in assessing the performance of various government policies for cocoa farmers. In other words respondents will be able to unravel whether it is the pricing alone or the production policy with a minimal amount of price increases helps them in their production activity. Based on this, the researcher can confidently say that respondents in the study area will be able to distinguish the performance of the pricing policy alone and the production policy with minimal increases in the producer price. Because, out of the number of the respondents that were questioned, about 41 respondents (Table 5.10) have worked for over 20 years which is enough to see how their socioeconomic life have been affected by the two policies. Table 5.10: The number of years respondents have worked in the cocoa farming
Number of years
worked
Frequency percentage cumulative
10 and less 1 1.72 1.72
10-20 16 27.59 29.31
20-30 17 29.31 58.62
30-40 12 20.69 79.31
40+ 12 20.69 100
Total 58 100
Source: Author’s computation
In the researcher’s view, since farming in general is very difficult occupation and the fact that cocoa farming involves a lot of activities, it is expected that majority of the respondents will have partners to assist them in the farming business. This assertion is supported by the fact that a large number of the respondents were married. Out of the 58 respondents, 50 of them constituting 86.21% have partners to assist them in the farming activities (Table5.11)
66
Table 5.11: Marital status of respondents
Marital status Frequency Percentage Cumulative
Married 50 86.21 86.21
Widow 8 13.79 100.00
Total 58 100.00
Source: Author’s computation
5.4.4 Effects of the Mass Spraying and Producer Price on Farmers The introduction of the mass spraying exercise have cut down the amount of expenditure farmers have to spend on spraying chemicals. It has, therefore, been beneficial to some extent, but that is not all. Farmers have increased the frequency of times they spray their own farms as a result of higher real producer prices. Moreover, there have been renaissance in the application of fertilizers by farmers. The trees have become productive and bags which could have been lost can now be added to their current level of their output. Among the 58 respondents that were questioned, a little above 25% were able to add more than 11 bags to their output as against 46% who were able to add 10 and less bags per hectare to their output. This is shown in the figure5 below:
Figure 5.6: change in cocoa production
Source: Author’s computation
However not every respondents was able to have a positive change in their level of output. While some had nothing to add, others really had a decrease in the level of output they used to produce. A little above 25%
67

were faced with this kind of problem. When asked about the reason behind this scenario, they attributed that to replanting exercise and bushfire.Figure 5.7: Reasons for decrease in the level of production
Source: Author’s ComputationApproximately 20% of the farmers claim that their trees were very old, and had to cut down most of them to make way for new ones. Further, bushfire was responsible for the decline in the level of output for some of them. A little above 10% had their farms destroyed by bushfire, making it difficult to realize the actual output. In terms of gain in asset, most of them were frank to say that they have been able to do a lot of things ranging from building, increase in income, new households equipment to investment in their children’s education.
Figure 5.8: Gain in asset as result of increased output
Source: Author’s Computation About 24% farmers were able to keep their kids into school, which was difficult to do formerly since most of them were living from hand-to-mouth. This was making it difficult for most of them to save and invest in their kids or for other purposes. In addition 20% were able to put up various types of building. The main factors behind this success has been
68

the joint effort of farmers spraying and the cocoa mass spraying and disease control programme, the ever increasing producer price and the increase use of fertilizer by most of the farmers. Whether the gain in assets was attributed to gain in output, the researcher used Chi square test to assess if they are related.
Table 5.12: Chi square showing change in asset due to change in number of bags
Change
Asset Change in output none Total
Asset gain 43 4 47
None 2 9 11
total 45 13 58
Pearson Chi2 (1) =27.5461 pr=0.000
Source: Author’s Computation The number of respondents who were able to possess assets as a result of increase in output amounted to 43 respondents representing 74%. This number is highly significant considering the chi square value of 27.5461 at 5% level of significant. This result has been the joint effort of the spraying and the producer price. This is because the higher the price and the higher the output, the greater the wealth that farmers may gain from their farming business. However, the macro data is not in support of the fact that the spraying programme has a positive impact on cocoa production. This is very contradictory, since an increase in expenditure for such programme should have a positive impact. But various reasons have been assigned in the analysis of the econometric model. This made the programme insufficient as most of the farmers had their farms sprayed only once in a season which fall short of the number of times one has to spray his/her farm. A little above 65% had their farms sprayed only once through the programme, which is inadequate to yield high production of cocoa (figure5).
Figure 5.9: Number of times farmers had their farms sprayed
69

Source: Author’s Computation
CHAPTER 6Summary, Conclusion and Policy Implication6.1 Summary and ConclusionGhana earns a substantial amount of revenue from exports of cocoa beans. Coupled with that, the industry provides a sizable number of small farm holdings with employment. However, fluctuations in the export of cocoa called for various government intervention policies notably among them are the price policy and production policy in a form of free spraying exercise, fertilizer application etc. This study has examined the effects of agricultural price and production policies on cocoa production and wealth of the farmer in Ghana, using time series data between the period 1978-2006, and micro data from the study area. In using the time series data, i have modelled and estimated the cocoa supply function. In addition, i have addressed cointegration, Dickey-Fuller (AD) diagnostic tests and error correction test. The AD process for cointegration and ECM are used to test for long-run equilibrium relationship among the cocoa output, producer price and other variables. The study is an extension of the work done previously by other researchers. Previous studies on the effect of government intervention policy in affecting cocoa supply have been based solely on price policy, and some have been too descriptive. In this study, attempts have been made to consider both the effects of price and production policy on cocoa
70

supply and wealth of the farmer. However more needs to be done to investigate omitted variables and structural break. The results show that real producer price which is a proxy for price policy influence farmers’ decision in allocating their resources to the production of cocoa. Farmers double up their effort in pruning, weeding and spraying in the short-run, if real producer price is very motivating. Therefore, the higher the producer price, the more farmers would be willing to allocate their resources to the production of cocoa. The results also indicate that farmers plant more trees of cocoa to increase supply in the long-run, as a result of high real producer price. In addition, little evidence is found of substitution of maize and cocoa supply in the short run. This means that an increase in the producer price of maize relative to cocoa producer price per tonne will not affect planting of cocoa in the short run. Further, it was shown that the coefficient of CODAPEC was significant but has the wrong sign. This is explained by malfeasance activities including the use of fake chemicals, unlawful selling of chemicals and failure on the part of the gangs to visit distant farms. However, the possibility of other non-price factors and constraints in the marketing system cannot be underestimated. There is also evidence that the speed of adjustment to long run equilibrium is very high: more than half of the deviations from the long run equilibrium in the past year are corrected.
6.2 Policy ImplicationThe main problems faced by farmers in the cocoa growing areas are pest and diseases, marketing constraints and lower real producer price relative to the neighbouring, Cote d’Ivoire which normally causes smuggling of cocoa aided by even custom officers. To reduce smuggling, a higher producer price relative to that in Cote d’Ivoire would be in the right direction to reduce the incidence of smuggling. In addition, the spraying exercise has been hail by many cocoa farmers as a very good policy, and therefore its continuity is fully
71

supported. However, its implementation has not been productive as a result of various allegations of selling of chemicals to farmers cannot be over emphasized. Furthermore, gangs are reluctant to visit farms of farmers which are very far. More over the number of times at which farms are sprayed is insufficient: mostly once. To reduce these problems, direct distribution of chemicals to farmers will solve the problem, and distributors should be properly accountable for their actions. Coupled with that, reduction of prices of spraying machines would be in the right direction to enable farmers to do their own spraying. This will even reduce the cost of hiring gangs who would later mismanage the chemicals at their disposal. In addition, enough chemicals should be made available to suffice for the number of times farmers have to spray their farms within the year depending on the farm size.
72

REFERENCES
Abdulai, A. and P. Rieder (1995) 'the Impacts of Agricultural Price Policy on
Cocoa Supply in Ghana: an Error Correction Estimation', Journal of African
Economies 4(3): 315-335.
Abizadeh, S. and M. Yousefi (1996) Fiscal systems and economic development: Case Studies of selected countries. New York: Nova Science publishers, Inc.
Anim-Kwapong, G.J. and E.B. Frimpong (2005) 'Vulnerability of Agriculture to climate change: impact of climate change'. New Tafo Akim: cocoa research institute of Ghana. http://www.nlcap.net/fileadmin/NCAP/Countries/Ghana/COCOA_DRAFT_FINAL_REPORT.pdf.Accessed on 02/09/09.
Ayenor, G.K., A.V. Huis, D. Obeng-Ofori, B. Padi and N.G. Rolling (2007) 'Facilitating the use of alternative capsid control methods sustainable production of organic cocoa in Ghana', International Journal of Tropical Insect Science 27(2): 85-94.
Balassa, B. (1990) 'Incentive Policies and Export Performance in Sub-Saharan Africa', World Development 18(3): 383-391.
Bateman, M.J. (1965) 'Aggregate and Regional Supply Function for Cocoa, 1946-1962', Journal of Farm Economics 47(2): 384-401.
Batten, D.S. and D.L. Thornton (1985) 'The Anderson-Jordan Equation
Revisited', Journal of Macroeconomics 7(3): 419-432.
Binswanger, H. (1989) 'The Policy Response of Agricultural', Paper presented at the conference Proceedings of the World Bank annual Conference on Development Economics, Washington DC (April).
Bond, M.E. (1983) 'Agricultural Responses to Price in Sub-Saharan African
Countries', International Monetary Fund 30(4): 703-726. Bulir, A. (1998) 'The Price Incentive to Smuggle and the Cocoa Supply in Ghana,
1950-96’, IMF Working Paper No. 98/88. Washington DC: International Monetary Fund.
Cleaver, K.M. (1985) 'The Impact of Price and Exchange Rate Policies on Agriculture in Sub-Saharan Africa’, World Bank Staff Working Papers No. 728. Washington DC: World Bank.
COCOBOD (2000) Ghana Cocoa Board Handbook (8th ed.). Accra: Jamiesnon's Cambridge Fax books Ltd, Accra.
73

COCOBOD (2009) Overview of Ghana Cocoa Industry. Unpublished document, Ghana Cocoa Board.
Cuong, V.H. (2000) 'Agricultural pricing policy: The case of sugar cane in
Vietnam in the period of 1990-1999', Master thesis. The Hague: Institute of Social Studies.
Dormon, E.N.A., A.V. Huis and C. Leeuwis (2007) 'Effectiveness and profitability of integrated pest management for improving yield on smallholder cocoa farms in Ghana', International Journal of Tropical Insect Science 27(1): 27-39.
Dormon, E.N.A., A.V. Huis, C. Leeuwis, D. Obeng-Ofori and O. Sakyi-Dawson (2004) 'Causes of low productivity of cocoa in Ghana: farmers ‘perspectives and insights from research and the socio-political establishment', NJAS-Wageningen journal of life sciences 52(3-4): 237-259.
Drummond, W.M. (1951) 'Objectives of an Agricultural Price Support Policy', the Canadian Journal of Economics and Political Science 17(3): 344-351.
FAO (2009) ‘FAOSTAT data’, available at: http://faostat.fao.org/faostat (accessed 09th October, 2009)
Gafar, J. (1997) 'The supply response of aggregate agricultural output in Jamaica', Agricultural Economics 16: 205-217.
Gugarati, D.N. (2003) Basic Econometrics (fourth ed.). New York: Gary Burke.
Gyimah-Brempong, K. and K.K. Apraku (1987) 'Structural Change in Supply Response of Ghanaian Cocoa Production: 1933-1983', The Journal of Developing Areas 22(1): 59-70.
Hadjimichael, M.T., M. Nowak, R. Sharer and A. Tahari (1996) Adjustment for growth: the African experience. Washington DC: International Monetary Fund.
Hallam, D. (1990) Economic modelling of agricultural commodity markets (First ed.). London: Routledge.
Hattink, W., N. Heerink and G. Thijssen (1998) 'Supply Response of Cocoa in Ghana: a Farm-level Profit Function Analysis’, Journal of African Economies 7(3): 424-444.
Herdt, R.W. (1970) 'A Disaggregated Approach to Aggregate Supply', Africa Journal of Agricultural Economics 52(4): 512-520.
Hunter, J.M. (1961) 'Akotuakrom: A case study of a devastated Cocoa Village in Ghana', Transaction and Papers (Institute of British Geographers)(29): 161-186.
ICCO (2005) ' Annual Report 2003/04': International Cocoa Organization.
74

ICCO (2006) 'Annual Report 2004/05': International Cocoa Organization.
ICCO (2008) 'Annual Report 2006/07': International Cocoa Organization.
ICCO (2002) 'Annual Report 2000/01': International Cocoa Organization.
Jabara, C.L. (1985) 'Agricultural Pricing Policy in Kenya', World Development 13(5): 611-626.
Janvry, A.D. and E. Sadoulet (1987) 'Agricultural Price Policy in General Equilibrium Models: Results and Comparisons', American Journal of Agricultural Economics 69(2): 230-246.
Krishnaji, N. (1990) 'Agricultural Price Policy: A survey with Reference to Indian Food grain Economy', Economic and Political Weekly 25(26): 54-63.
Krueger, A.O. (1996) 'Political Economy of Agricultural Policy', Public Choice 87(1/2): 163-175.
Limbwambwa, C. (1992) 'Agricultural Marketing and Pricing Policy in Zambia: How they contributed to Rural Food Insecurity', Master thesis. The Hague: Institute of Social Studies.
Lipsey, R.G. and K.A. Chrystal (2007) Economics (11th ed.): Oxford University Press.
Lipsey, R.G. and C.D. Harbury (1992) First principles of economics (2nd ed.). Oxford: Oxford university press.
Maddala, G.S. and I. M. Kim (1998) Unit roots, Cointegration, and Structural Change. UK: Cambridge University Press.
Mamingi, N. (1996) 'How Prices and Macroeconomic Policies Affect Agricultural Supply and the Environment', World Bank Policy Research Working Paper No.1645. Washington DC: World Bank.
McConnell, C.R. and S.L. Bruce (1999) Economics (14th ed.). USA: The McGraw-Hill.
Meilink, H.A. (1985) 'Agricultural pricing policy in Kenya: Scope and impact' (No. 11/1985): Food and Nutrition Planning Unit, Ministry of Finance and Planning, Nairobi, Kenya; African Studies Centre, Leiden, Netherlands.
Miller, T. and G. Tolley (1989) 'Technology Adoption and Agricultural Price Policy', American Journal of Agricultural Economics 71(4): 847-857.
MOF (1999) Ghana Cocoa Sector Development Strategy. Accra, Ghana: Ministry of Finance.
MOF (2004) a discussion Paper on Overview of Ghana Cocoa Industry. Accra: Ministry of Finance, Cocoa Affairs Division.
,.
75

Mollett, J.A. (1988) 'The Impact of Agricultural Price Policy in Developing Countries', Inter economics 23(1): 19-24.
Mundia, C. (1991) 'Agricultural Price Policy and its effects on Regional marketed production: The case of Zambia (1979-1989)', Master thesis. The Hague: Institute of Social Studies.
Naylor, R. (2000) Ghana (Reprinted ed.). UK: Oxfam GB.
Nerlove, M. (1956) 'Estimates of the Elasticities of supply of selected Agricultural Commodities', Journal of Farm Economics 38(2): 496-509.
Nyanteng, V.K. and A.W. Seini (2000) 'Agricultural policy & the impact on Growth & Productivity 1970-75', in E. Aryeetey et al. (eds), Economic Reforms in Ghana, The Miracle & the Mirage (pp. 267-283). Oxford, UK: James Currey Ltd; Accra, Ghana: Woeli publishing Services; Trendon, USA: Africa World press.
Opoku, I.Y., M.K. Assuah and F. Aneani (2007) 'Management of black pod disease of Cocoa with reduced number of fungicide application and crop sanitation', Africa Journal of Agricultural Research 2(11): 601-604.
Opoku, I.Y., K.O. Frimpong and M.R. Appiah (2004) ' The use of fertilizer and fungicide to sustain cocoa production in severe black pod areas', Journal of tropical science 44(2): 95-99.
Parkins, M., M. Powell and K. Matthew (2008) Economics (7th ed.): Pearson Education Limited.
Rao, B.B. (1994) Cointegration for the Applied Economist (First ed.). London, Great Britain: The Macmillan Press Ltd.
Rao, J.M. (1989) 'Agricultural Supply Response: A survey', Agricultural Economics 3: 1-22.
Ray, I. and J. Williams (1999) 'Evaluation of Price Policy in the Presence of Water Theft', American Journal of Agricultural Economics 81(4): 928-941.
Salvatore, D. (1991) Schaum's outline of theory and problems of microeconomic theory (3rd ed.). USA: McGraw-Hill professional.
Schiff, M. and C.E. Montenegro (1997) 'Aggregate Agricultural Supply
Response in Developing Countries: A survey of Selected Issues', Economic Development and Cultural Change 45(2): 393-410.
Sloman, J. (2006) Economics. Edinburgh, England: Pearson Education Limited.Stigler, G. (June, 1939) 'Production and distribution in the short run', the
journal of Political economy 47(3): 305-327.
Stiglitz, J.E. (1987) 'Some Theoretical Aspects of Agricultural Policies', the World Bank Research Observer 2(1): 43-60.
76

Thompson, P.B. (2005) 'Trend analysis of Cocoa production in Ghana and some selected Cocoa growing district along the Ghana side of the Ghana-Cote d' Ivoire boarder', Master Thesis. Accra: University of Ghana.
Tudhope, W.T.D. (1909) 'The Development of the Cocoa Industry in the Gold Coast and Ashanti', Journal of the Royal Africa Society 9(33): 34-45.
Vyas, V.S. (1994) 'Agricultural Policies for the Nineties: Issues and Approaches', Economic and Political Weekly 29(26): A54-A63.
Wooldridge, J.M. (2003) introductory econometrics: a modern approach (3rd edition). USA: Cengage Learning.
APPENDIX
APPENDIX 1
QUESTIONNAIRE ON RELATIVE IMPORTANCE OF PRICING AND PRODUCTION POLICY, SOCIOECONOMIC CHARACTERISTICS, AND MARKETING CONSTRAINTS
OF COCOA FARMERS IN WENCHI, AKWADUM AND ASIKUMA
77

A. Personal Characteristics1. Marital status..................................a) married b)divorced c)Single
d)Widow(er) e) Other (please specify)...........................
2. Gender: a) Male b)Female 3. Age Range (yrs): a) <20 b) 20-29 c) 30-39 d)40-49
e)50-59 f) 60 and +4. Religious affiliation: a) Christian b) Muslim c) Traditionalist d)
other (specify).............5. Farming
Community.......................................................................................................
6. Is the Community your hometown or you are a migrant farmer.......................................
7. Is Farming your Major Source of Livelihood? A)yes b)No8. If No, specify detail................................................9. Educational level: a) illiterate b) Primary c) Secondary
d)vocational e) Tertiary
B. Effects of pricing and production policies, and socioeconomic characteristics of farmers
1. How long have you been a cocoa farmer?2. Besides income from cocoa farming, do you have any other
sources of income?a) Yesb) No
3. If Yes, Specify? .....................................4. Have you heard of Mass Spraying Exercise (CODAPEC)?
a) Yes b) No
5. If yes, have you benefitted from it, which years and in what form? Comment
...............................................................................................................
............
...............................................................................................................
...........
...............................................................................................................
...........6. Were you using fertilizer before this exercise?
a) Yesb) No
78

7. If yes, how much money were you spending on fertilizer? Specify............
8. How much quantity of fertilizer (in kilogram per acre) were you using? Specify............
9. How much quantity of fertilizer (in kilogram per acre) were you given through the exercise? ..........................
10. Do you spray your farm before the exercise? a) Yes b) No11. If yes, how much money (per year) were you spending on
spraying? Specify................................ 12. How much quantity of spraying chemicals (in litres or
kilograms per year) were you using? Specify................................13. How many times were you spraying your farm per
year? .....................................14. How many times were your farms sprayed through the
exercise? ...........................15. How do you assess the exercise? (a) Satisfactory (b)
Unsatisfactory...................................................................................................................................
16. What was the Size of your farm in acre before the start of the Mass Spraying (CODAPEC)..................................................
17. What is the size of your Farm now? Has there been any recent expansion? Comment...............................................................................................................
18. On average, how many bags of cocoa do you used to harvest per acres before this exercise?
19. Has there been any increment in the Number of bags harvested recently? A)yes b) No
20. If yes or no, specify the reason for the increase or decrease..................................................
21. Currently, how many bags do you harvest per acre? Specify.................
22. Apart from the Government Mass Spraying (CODAPEC) exercise do you see other major factors as being significant in affecting your current output?
a) Yesb) No
23. If yes, what do you think are the other factors responsible for this increase?
a) Higher Producer Price
79

b) The weatherc) Others. Specify...........................
24. Have you seen some positive changes in your assets after the introduction of the mass spraying exercise?
a) Yesb) No
25. If yes, what are some of the things you have been able to own or do which you did not have before? .....................................................................................................................................................................................................................................................
C. Marketing constraints
26. What are some of the internal marketing constraints you were facing before the mass spraying exercise?
a) Scale Adjustment b) Rejection of Beans by PC due to improper fermentation and
dryingc) Delay in payment of cocoa beans sold to the PCsd) Thefte) Transportation problemsf) Others............................
27. Which of these problems have been solved, and which ones are persistent? Use ‘p’ to indicate persist and‘s’ to indicate solved?
a) Scale Adjustment b) Rejection of Beans by PC due to improper fermentation and
dryingc) Delay in payment of cocoa beans sold to the PCsd) Thefte) Transportation problemsf) Others............................
28. Currently, what is the most pressing one in order of
importance?a) .........................................................b) ..........................................................c) .........................................................d) .........................................................e) .........................................................
80

f) .........................................................g) .........................................................
29. What other thing do you have to say to Government which you think can help improve your livelihood and the cocoa industry in specifically? ........................................................................................................................................................................
APPENDIX 2
Factors Affecting Cocoa Production (1978-2007)
Year Maize Price(real)
Per tonne (GH¢)
Cocoa
Production(tonne)
Producer Price(real)
(GH¢) Per tonne
FOB(¢) Codapec per tonne
(GH¢) (real)
1977/8 121100 271339 13
1978/9 171700 265074 27
1979/0 413300 296419 40
1980/1 773600 257974 40 5976
1981/2 797500 224882 120 4947
1982/3 398750 178626 60 4150
1983/4 900000 158956 100 59131
1984/5 666667 174813 100 108733
81

1985/6 833333 219044 189 206662
1986/7 840000 227864 170 313717
1987/8 800000 188171 250 431513
1988/9 511457 300101 236 411511
1989/0 869000 295051 174 415935
1990/1 579000 293352 187 492059
1991/2 642539 242817 193 514759
1992/3 551371 312123 152 548916
1993/4 663762 254655 147 1009995
1994/5 782394 309456 212 1664999
1995/6 683625 403842 175 2098671
1996/7 1037516 322488 194 2372942
1997/8 835338 409359 253 3335000
1998/9 564413 398675 281 4166667
1999/0 936630 436947 225 3515625
2000/1 1129045 389772 261 5429688 15
2001/2 876915 340562 405 6744615 33
2002/3 775643 496846 440 9134328 26
2003/4 971917 736975 413 13235294 21
2004/5 1324606 599318 359 13025894 29
2005/6 839184 740458 324 14066076 27
2006/7 912795 614532 308 15127515 59
Source: a. Producer price of cocoa, cocoa production, Codapec-COCOBOD (2000&2009).
b. Producer price of Maize- FAO data.
c. FOB-COCOBOB in G.J. Anim-Kwapong and E. B. Frimpong (2005)
82