Embed Size (px)
Citation preview

1
The Victory Effect: Is First-Place Seeking Stronger than Last-Place Aversion?
Steven M. Shechter and David J. Hardisty
Sauder School of Business
University of British Columbia
Acknowledgements: The authors would like to thank the Social Sciences and Humanities Research
Council (SSHRC) of Canada, Insight Development Grant, for supporting this research.

2
Abstract
The rise of gamification has increased the ways in which people compete. We examine individuals’
intrinsic motivations to achieve different ranks in competitions. Our first study uses standard gamble
methods to map out utility functions for ranks, finding that consumers are risk seeking for first place, risk-
averse to avoid last place, and that first-place seeking is stronger than last-place aversion. In our second
study, individuals participate in actual competitions with rank feedback provided half-way through the
competition. In a physical competition, we find first-place seeking behavior among men, top-half-
seeking behavior among women, and we do not observe last-place aversion for either gender. In an
intellectual competition, we find first-place seeking among both genders but do not observe last-place
aversion for either.
3
I. Introduction
The rise of gamification has increased the number and variety of ways in which people compete. In
leisurely pursuits, people try outranking each other on leaderboards showing most visits to a restaurant,
most steps taken in a week, or highest score in a video game. Professionally, individuals compete for
prize money and jobs through innovation competitions1, and charitable organizations compete for awards
through fund-raising contests2.
Our research concerns competitions with rank feedback. We focus on settings in which rank is a function
of effort, competitors can see each other’s (anonymized) performance and ranks (e.g., through
leaderboards), and no prizes are awarded. We first use hypothetical scenarios and standard gambles to
elicit individuals’ utilities for different final rankings in a competition. We then run live competitions to
study how individual performance changes in the second half of a competition, after receiving rank
feedback from the first half.
The economics and behavioral science literatures have explored various aspects of rank comparisons.
Normative models have considered questions around optimal contest and tournament design, including
how many entrants to allow, if and how much to charge for entry fees, and how to structure prizes (see,
for example, Che & Gale, 2003; Fullerton & McAfee, 1999; Lazear & Rosen, 1981; Taylor, 1995;
Terwiesch & Xu, 2008). Our work is in line with other studies that seek empirical support for how
individuals make decisions in contests or tournaments. Bull et al. (1987) ran laboratory experiments to
study the degree to which contestants’ effort decisions converge to equilibrium behavior predicted by
tournament theory, while List et al. (2014) conducted laboratory tests and a field experiment to
understand the effect of contest group size on individual effort levels. A study by Dutcher et al. (2015) is
similar to our study, in that they used laboratory experiments to examine first-place seeking (FPS) vs.
last-place aversion (LPA) behavior based on effort in rank-based tournaments. However, the concept of
“effort” in each of these three studies was not based on any real exertion; rather, subjects were asked to
choose an effort level, which was mapped to a cost, an outcome level, and a rank. We run contests (Study
2) in which actual physical or mental exertion leads to rank outcomes. Furthermore, the three studies
discussed above awarded prize money for different rank outcomes. As we justify further below, we focus
on contests with no tangible awards.
Kuziemko et al. (2014) appear to be the first to study individuals’ risk preferences as a function of rank in
social comparisons. In one experiment, they randomly assigned individuals to groups of six, with each
individual in a group randomly endowed with one of six distinct amounts of money. Everyone knew each
other’s amount and, therefore, rank. Subjects were then asked to choose between a certain monetary gain,
which would leave their wealth rank unchanged, or a gamble with the same expected monetary gain, but
4
for which winning increased and losing decreased their rank. Their various analyses established robust
statistical support for the hypothesis of LPA; individuals in last place chose the gamble a significantly
higher proportion of the time than other ranks. Moreover, the authors found no evidence of FPS;
individuals ranked 1 and 2 chose the gamble at a similar rate as those ranked 3-5.
Our work differs from Kuziemko et al. (2014), in that we study risk preferences for ranks in contests that
are inherently merit-based. Kuziemko et al. (2014) noted that they designed their study to specifically
avoid individuals associating rank with merit; hence, they randomly endowed individuals with initial
amounts of money, and therefore initial ranks of wealth. This is an important perspective and study
design for public policy discussions around redistribution of wealth (e.g., minimum wage or social
welfare), the applied focus of their work. In contrast, we design our study to specifically focus on
behavior and response to rank in contests in which skill and effort directly affect one’s final rank. This
can have implications for how firms design contests to improve outcomes; e.g., which individuals to
match together in a monthly sales contest, or which fitness app users to match together in an athletic
competition.
The social psychology literature attributes competitive behavior to social comparisons (Festinger, 1954;
Garcia, Tor, & Schiff, 2013). Particularly relevant to our study, Garcia, Tor, and Gonzalez (2006)
explored the effect of specific rank feedback as a modifier of competitive drive. Based on choices
involving hypothetical tangible outcomes (e.g., profits or grades) for oneself and one’s rival, individuals
exhibited substantially more competitive behavior against a rival when they both ranked consecutively
near the top or bottom of a list, compared to when they ranked consecutively at an intermediate ranking.
This is consistent with FPS and LPA. Furthermore, FPS supports the idea of “competitive arousal,” in
which situational factors can magnify a desire to win (Malhotra, 2010). The results of our work (Study 1)
also demonstrate that individuals exhibit FPS and LPA sentiments when thinking about competitions.
Furthermore, we find evidence for FPS being stronger than LPA.
There are no financial or tangible rewards in our experiments. Most normative models of contest design
have assumed that the contest designer awards financial prizes, and entrants decide whether to join and
how much effort to expend based on net profit or utility calculations (though see Moldovanu, Sela, & Shi,
2007). In an empirical study, Ehrenberg and Bognanno (1990) demonstrated a strong motivating effect of
PGA tour prize amounts on golf player performance. On the other hand, prizes are not a necessary
condition for incentivizing effort in contests or competitions. In another empirical study, Boudreau et al.
(2011) analyzed a large dataset of software development contests, including many that did not offer
financial rewards for the winners. They still found that increasing the number of contestants decreased
entrants’ performance, because the chance of winning goes down. Tran and Zeckhauser (2012) ran a field
5
study in which they randomly assigned students in an English course to one of three groups: control (no
rank feedback given on biweekly practice tests), private (students were told on the phone of their own
rank only), or public (students saw each other’s rank on a university website). Interestingly, the
improvement between initial and final test scores for the “private” group were substantial despite no
external benefits associated with ranks (i.e., no prizes and no public recognition of performance).
Similarly, in an econometric study of how a particular firm’s employees react to receiving rank
performance feedback, Blanes i Vidal and Nossol (2011) concluded that rank feedback in itself led to a
significant improvement in worker productivity (separate from any monetary incentives of rank).
Chapman et al. (2016) demonstrated that rank feedback given during a step-count experiment led to more
steps taken in the remainder of the experiment, relative to a control group that saw only their own step
counts. None of these prior studies, however, examined preferences or performance as a function of
specific ranks. Our study seeks to understand the extent to which individuals intrinsically care about and
respond to rank outcomes in competition.
Perhaps the closest work to our study of behavior in actual competitions (Study 2) is a recent paper by
Gill et al. (2018), in which the authors also ran real effort competitions, with no prizes awarded, to
examine the pure effect of rank feedback on subsequent effort. The authors fit an econometric model to
their competition data and found a strong effect of increased effort levels for individuals ranked first and
last, but a decreased level of effort for those with middle ranks. They also found that gender and other
demographics did not modify these results. Our results differ from Gill et al. (2018) in some key respects.
We do not find support for LPA, and we only find support for FPS among men. Furthermore, we find that
individuals ranked near the 50th percentile of ranks expend extra effort to finish in the top-half.
Given the prevalence and increasing concern about the gender gap in society (e.g., fewer senior executive
positions and lower salaries for women), the past 15 years have produced several studies on gender
differences in competition (e.g., Buser, Niederle, & Oosterbeek, 2014; Gneezy, Niederle, & Rustichini,
2003; Niederle & Vesterlund, 2007; Sutter & Glätzle-Rützler, 2014). The general consensus of these
studies is that men embrace, and seek out, competition more often than women. Our results are similar in
spirit, as we find that men appear more FPS than women in actual physical competition.
As discussed above, our paper contains two primary studies. In Study 1 (Section II), we survey
individuals to assess their risk preferences for different ranks in hypothetical competitions. Specifically,
we construct utility curves (over rank) for each individual and analyze the patterns observed. In Study 2
(Section III), subjects in a treatment group participate in actual competitions, with rank feedback given
half way through the competitions. We examine individuals’ change in performance between rounds 1
and 2, as a function of round 1 rank, and compare this to a control group. We discuss concluding remarks
6
in Section IV. Appendix A contains supplemental tables and graphs, and Appendix B contains all of the
experimental materials for our studies.
II. Study 1: Utilities of Rank Outcomes
Since the seminal work of von Neumann and Morgenstern (1944) on expected utility theory (EUT), most
utility curves have been described as functions of monetary outcomes. Multi-attribute utility theory
extended these ideas to consider how individuals value non-monetary measures such as safety or health
(Keeney & Raiffa, 1993). While some papers have incorporated rank as an independent variable in utility
function specifications (e.g., Hopkins & Kornienko, 2009; Kuziemko et al., 2014), to our knowledge,
there has been no prior empirical work that estimates individuals’ utility for different ranks.
Using the probability-equivalent method described further in Section II.A, we construct within-subjects’
utility curves over ranks. We tell subjects that the hypothetical contests do not award prizes and that their
identity would be anonymous. If individuals did not care about rank outcomes in this setting, we would
expect flat utility curves. Instead, we hypothesize that individuals still want to rank higher than others,
even if there are no immediate tangible outcomes associated with higher ranks.
Hypothesis 1: Individuals care about rank in contests without prizes. Specifically, their utility for second
place is greater than their utility for second-to-last place.
Note that Hypothesis 1 is not a foregone conclusion. While our utility estimation exercise of Study 1
anchors the utilities of ranks first and last to 1 and 0, respectively, the utilities for ranks second and
second-to-last can theoretically come out to any value between 1 and 0. We did not tell the subjects their
estimated utilities at each rank, so they were unlikely to consciously enforce a decreasing pattern for
worse ranks.
We further hypothesize that the general shape of utility curves over rank will be in some sense opposite to
the shape proposed in Prospect Theory (Kahneman & Tversky, 1979). While Prospect Theory suggests
individuals are risk averse over (financial) gains and risk-seeking over losses, we make the following
hypothesis regarding risk preferences over changes in rank:
Hypothesis 2: a) Individuals are risk-seeking when in second place, b) risk-averse when in second-to-last
place, and c) more risk-seeking in second place than risk-averse in second-to-last place.
Evidence in support of this hypothesis would be convexity in the utility curve over the top three ranks,
concavity over the bottom three ranks, and more often the former than the latter. Drawing an analogy
between better/worse ranks and financial gains/losses, our hypothesized shape of the utility curve
seemingly contrasts with Prospect Theory’s concavity over gains and convexity over losses. However, it
7
may actually be consistent if individuals adopt different reference points depending on their rank. If an
individual in second place adopts first place as the reference point, then second place is in the domain of
losses, and risk-seeking is expected. Likewise, if an individual in second-to-last adopts last place as the
reference point, then second-to-last is in the domain of gains, and risk aversion is expected.
The notion of risk preferences, concavity, and convexity for categorical data (rank outcomes) requires
further discussion. Although rank is categorical, it is also ordinal, and therefore one can apply the axioms
and conclusions of EUT. In particular, one can define a real-valued, utility function over the discrete
ranks. While continuous derivatives do not apply in this case, we say the utility function is discretely
concave at rank m if U(m+1) - U(m) < U(m) - U(m-1) (and is discretely convex at rank m if the inequality
> holds instead). If discrete concavity holds at rank m, one can say that the individual prefers to finish in
rank m for certain rather than take a 50-50 chance of finishing in rank m-1 or rank m+1. However, the
usual notion of a risk-averse individual preferring the expected value of a lottery for certain, rather than
receiving the lottery itself, no longer makes sense for this setting (i.e., we would not say that rank m is the
expected value of the 50-50 chance of finishing in m-1 or m+1 place). A transformation is first required to
map the ranks to real-valued numbers (i.e., associate random variables with the ranks), and the utility
curve over this transformed variable may or may not retain a shape similar to the utility curve over
equally-spaced ranks. This caveat should be kept in mind when we associate discrete concavity
(convexity) with risk aversion (seeking) over rank outcomes.
Another distinguishing feature of Prospect Theory’s utility curve is “loss aversion”; individuals
experience a larger drop in utility when losing some amount of money, compared to the gain in utility
when winning the same amount. Again, we hypothesize an apparent contrast in utility curves when
outcomes are ranks:
Hypothesis 3: Individuals experience a greater decrease in utility from first to second place, compared to
the decrease in utility from second-to-last to last place.
II.A. Experimental Design
We ran different versions of Study 1 to ensure robustness and replicability (Table I). Each study involved
a hypothetical contest in which the participant competed against other people to either 1) take the most
steps (the “athletic” frame) or 2) solve the most puzzles over a period of time (the “intelligence” frame).
For example, subjects in a hypothetical athletic contest among six people read:
Suppose you and five other people of similar fitness level (either gender) are matched up in a
competition to see who takes the most steps over the next month (from a combination of walking,
running, and stairs). Imagine that there are no prizes given out in this competition, and that
8
rankings and performance would be displayed through an anonymized leaderboard (i.e., you will
not know the identity of anyone else in your competition group, nor will anyone else in your
group know your identity; however, you will know which rank is yours).
The following questions are designed to assess your preference between using a strategy that
would guarantee a certain outcome (e.g., third place out of 6) vs. using another strategy that gives
you a chance of finishing in first place (out of 6) and a chance of finishing in last place (out of 6).
Assume each of these two strategies involves the same amount of effort. Also, note that first
place means the most steps taken and last place means the least. We will vary the chances
approximately five times, to estimate the percentage chance that makes you indifferent between
choosing the certain rank outcome and the uncertain rank outcome.
Subjects were randomly assigned to one of 8 conditions of a 2x2x2 full factorial design. The first factor
was the athletic vs. intelligence frame. Subjects randomized to the intelligence frame read that they were
matched up in a competition to see who can correctly solve the most puzzles in 10 minutes. The second
factor was a word vs. numerical formatting of rank information. The above example shows the word
format; in the numerical format, subjects decided between a guaranteed outcome of “rank #3 out of 6” vs.
a chance of finishing in “rank #1 (out of 6)” vs. “rank #6 (out of 6).” The third factor counterbalanced the
order in which we elicited rank utilities. In the ascending version, we elicited utilities in the order of ranks
2,3,4,5 and in the descending version we started with rank 5 and finished with rank 2.
Assuming the axioms of EUT hold, individuals’ preferences can be identified through a utility function.
Because utility functions are unique up to a positive linear transformation, we arbitrarily anchored the
utility of last place at 0 and the utility of first place at 1. We then applied the “probability equivalent”
method (Hershey & Schoemaker, 1985) for eliciting an individual’s utilities for other ranks between first
and last. For example, to elicit an individual’s utility for finishing in third place (out of 6), we began by
asking her to choose between the following two options: A) “a strategy that guarantees you will finish
third place (out of 6),” or B) “a strategy in which you have a 50% chance of finishing in first place (out of
6) and a 50% chance of finishing in last place (out of 6).” If the individual selected A, then we asked her
to choose between options A and B again, but this time option B was presented as a 75% and 25% chance
of finishing in first and last place, respectively. We proceeded with this bisection approach until we
identified the percentage p such that the individual was indifferent between option A (finishing in third
place for certain) or option B (p chance of finishing in first and 1-p chance of finishing in last). By fixing
the utility of first place at 1 and last place at 0, this final value of p (divided by 100) estimated the
9
individual’s utility for finishing the contest in third place3. We then repeated the same process to assess
each individual’s utility for other ranks.
II.B. Results
The results of each Study 1a-c yielded the same general findings and insights. We detail the results of
Study 1a here and leave the details of Studies 1b and c for Appendix A (Figure A1, A2, and Table A1).
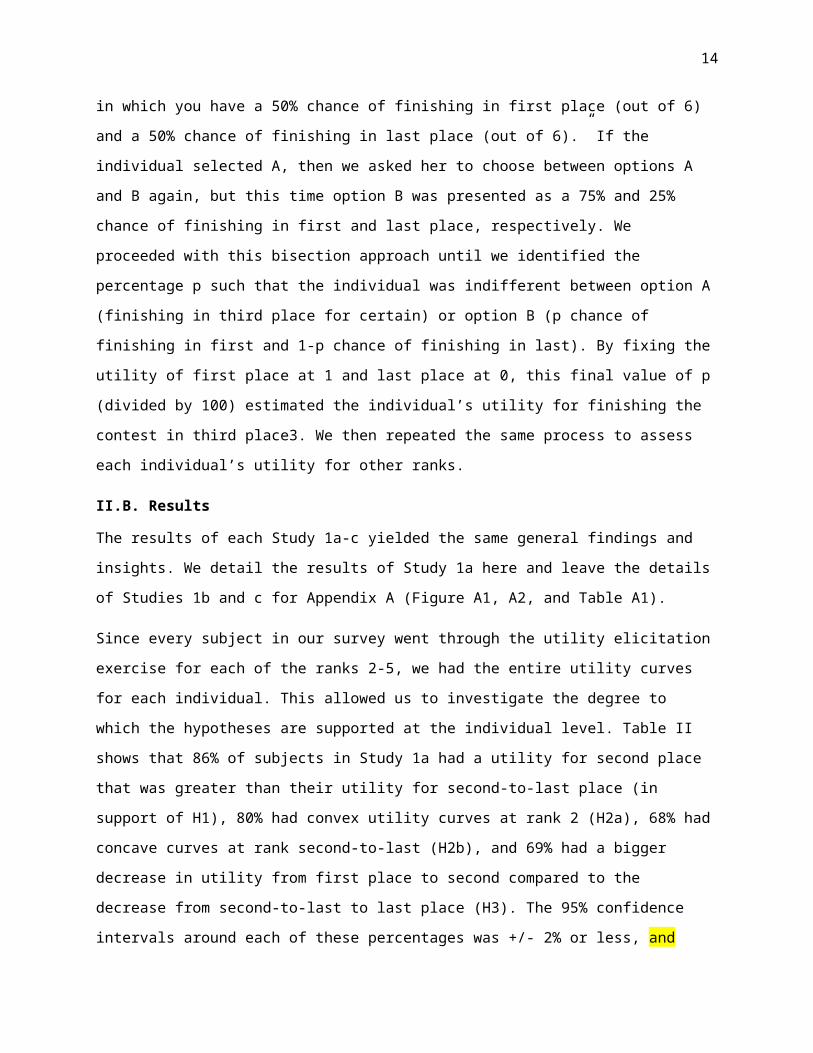
Since every subject in our survey went through the utility elicitation exercise for each of the ranks 2-5, we
had the entire utility curves for each individual. This allowed us to investigate the degree to which the
hypotheses are supported at the individual level. Table II shows that 86% of subjects in Study 1a had a
utility for second place that was greater than their utility for second-to-last place (in support of H1), 80%
had convex utility curves at rank 2 (H2a), 68% had concave curves at rank second-to-last (H2b), and 69%
had a bigger decrease in utility from first place to second compared to the decrease from second-to-last to
last place (H3). The 95% confidence intervals around each of these percentages was +/- 2% or less, and
tests of the population percentages being greater than 50% were highly significant (p < .001), supporting
H1, H2, and H3.
Whereas Table II shows the percentage of individuals that exhibit these utility patterns, Table III
measures the magnitudes of differences. For example, within-subjects, the utility of second place was on
average 0.35 utils higher than the utility of second-to-last place (p < .001), and the loss in utility from first
to second was on average 0.22 utils higher than the loss in utility from second-to-last to last place (p
< .001). The confidence interval around the second column of Table III also shows that the 12% more
individuals who exhibit risk seeking behavior at second place (80%, as noted in previous paragraph)
compared to risk aversion as second-to-last place (68%) is highly significant (p < .001), in support of
H2c. Figure I shows the average utilities across different ranks for Study 1a, providing descriptive
support for the above findings on the aggregate level.
There were no statistically significant interaction effects among the three factors used for randomization
(frame: athletic vs. intelligence; format: word vs. numerical; rank order: ascending vs. descending), and
the high-level insights of Table II held for each level of the three factors. For example, the majority of
individuals exhibited each of the four conditions (denoted by the columns of Table II), regardless of
whether their hypothetical scenario involved stepping or solving puzzles.
Figure II is similar to Figure I, but separated by gender. We see descriptive support for Hypotheses 1-3
for both male and female subjects, and inferential statistical support can be found in the gender-specific
versions of Table II, which appear as Tables A2 and A3 in Appendix A. The non-overlapping confidence
intervals shown in Figure II also suggest that women had higher average utilities than men at every rank
10
(except for first and last place, which we anchored to 1 and 0, respectively, for both genders). Put another
way, women appear to be more LPA and less FPS than men.
II. C. Discussion
We associate the concave utility curves at second-to-last place with LPA and the convex utility curves at
second place with FPS behavior. The concavity at second-to-last suggests most people would rather
remain in second-to-last place for sure than risk ending up in last place. At the other end of the rank
spectrum, most people would rather take the chance of gaining first place than staying in second place for
sure.
As noted in Section I, Kuziemko et al. (2014) also found evidence of LPA, in the context of wealth
comparisons. We find that LPA also holds when people think about rank in competitions. Furthermore,
we find strong support for FPS behavior, whereas Kuziemko et al. (2014) found no evidence of this
phenomenon. We believe that the competition focus of our setting, in which rank is earned, is a key driver
of this difference. Moreover, while subjects demonstrate both behaviors, we find a significantly greater
proportion demonstrate FPS than LPA. They also experience a greater utility drop between first and
second place, compared to second-to-last and last place. Finally, in addition to the utility elicitation
exercise, we also asked subjects which would feel better during a six-person competition: rising from
second place to first, or rising from last place to fifth. On a scale of 1 to 7, with 1 meaning rising from
second to first would feel much better, 7 meaning rising from last to fifth place would feel much better,
and 4 meaning they would feel equally good, the average response was 2.11. Together, these findings
support the idea of a “victory effect,” in which the thrill of victory looms larger than the agony of defeat.
Our main findings (Hypotheses 1-3) hold for each version of Study 1 (Table I) and under each factor we
examined. In particular, both men and women demonstrate similar patterns of utility vs. rank. However,
as seen in Figure II, women appear to be more satisfied than men with any given rank, suggesting that
women are more LPA and less FPS than men. Putting this in terms of decision making differences, for
example, Figure II shows that women offered a choice between finishing in 5th place for sure vs. a
20%/80% chance of first/last place would prefer the sure thing, whereas men would prefer the gamble.
III. Study 2: Responses to Rank Outcomes in Actual Contests
Study 2 takes the ideas and insights of Study 1 to the lab, to observe if and how individual effort and
performance might change in response to rank feedback in actual contests. This is relevant to many real-
world settings in which individuals can see each other’s rank and performance measures at intermediate
time points, before a final winner or set of winners is determined. For example, a realty company
11
displaying monthly sales may motivate realtors to sell more properties, or a fitness app with a leaderboard
of weekly activity may motivate individuals to exercise more.
Our contests involve individuals working on a task in two separate rounds, with rank and performance
measures provided after the first round. Final contest results are based on the aggregate score from both
rounds. Specifically, we create and analyze the results of step-counting and puzzle-solving contests.
Recall from Section I that Chapman et al. (2016) also ran a stepping study and found an incentivizing
effect of rank feedback given to subjects part way through the study. There are two key differences
between our study and that of Chapman et al. (2016). First, we explicitly frame the stepping task as being
part of a contest to see who can take the most steps over a set period (two rounds). Second, we focus on
how subsequent effort varies by specific rank feedback. For example, we are interested in how an
individual’s effort level (i.e., steps taken) changes after finding out she is ranked near the top, middle, or
bottom after one round.
Consider for a moment a game-theoretic perspective of this problem. Suppose the contest is a head-to-
head matchup between two individuals, and assume they are tied (on some performance measure) after
round 1. For simplicity, assume that for the same effort, both contestants would improve their
performance by the same amount and that both of them have the same maximum effort level. Then the
two contestants face a Prisoner’s Dilemma. If they both exert no effort in round 2, they will remain tied.
If contestant A exerts effort and contestant B does not, then contestant A takes sole possession of first
place, and vice-versa. Therefore, the Nash equilibrium is for both contestants to exert the maximum
effort, resulting in another tie after round 2. On the other hand, coordination would have achieved the
same result without expending effort.
A coordination strategy is nearly impossible in our experimental design (described in Sections III.A.1 and
III.B.1), because contestants only find out their rank and performance measures upon arriving for round 2.
While we do not believe individuals are explicitly thinking about Nash strategies, based on our
observations from Study 1, we expect that high and low ranks will motivate larger increases in effort and
performance. This leads to our next hypothesis:
Hypothesis 4: a) Individuals in the top-two and bottom-two ranks after one round will have greater
performance gains relative to other ranks. b) Furthermore, those in the top-two ranks will have greater
performance gains compared to those in the bottom-two ranks.
The idea behind H4a is that individuals ranked first and second after round 1 are in a better position of
finishing in first place by the end of round 2 and therefore, will try harder to achieve that goal (i.e., they
are FPS). Similarly, those ranked second-to-last and last after round 1 are at higher risk of finishing in last
12
place, and thus will try harder in round 2 to avoid that outcome (i.e., they are last-place averse). H4b
reflects the Study 1 support for even greater FPS behavior compared to LPA.
III.A. Step Competition
III.A.1 Experimental Design
Subjects were recruited from a university campus (see Table IV for summary). Participants in the
treatment group arrived to the lab in round 1 and read the following on a computer screen:
Today you will be grouped with 5 other UBC students in a continuous step climbing competition.
You will be doing the first round of the study and repeatedly climbing a step for 5 minutes, taking
as many steps as you can. You will then need to return to the lab at a future date to participate in
the second round of the study. Before you start your second round, we will show you the rankings
and scores from the first round. You will then proceed to complete the second round of the study,
in which you will again climb as many steps as you can in 5 minutes.
We will use participant identification numbers to anonymize the results. We will show you your
own participant identification number so that you can see where you are ranked and how you
scored. However you will not know the identity of anyone else in your competition group, nor will
anyone else in your group know your identity. Although it is true that you are competing against
real students, the people in this room may or may not be in your competition group.
Once your second round score is tabulated, we will send you an e-mail announcing the final
rankings and scores (based on both rounds) of every contestant in your group. There are no
prizes given out in this contest.
Subjects then started a five-minute timer on the computer and repeatedly stepped up and down from a
platform similar to the kind used in step aerobics classes. Each subject was alone in the room for the five
minutes of stepping, which was recorded on video camera (video recordings were used to count the steps
later). The treatment groups of six subjects each were created in the order students signed up for the
study.
Round 2 typically took place one week later, so that there were no fatigue carry-over effects from round
1. Upon entering the lab for round 2, subjects received a slip of paper indicating everyone in their
competition group’s round 1 scores (number of steps) and ranks, with the individual’s own performance circled (anonymized with numerical IDs, so no one’s name was shown). They were then asked to take as
many steps as they could for another five-minute round.
13
We denote our primary output variable by ∆, the change in performance measure for an individual (in this
case, round 2 steps - round 1 steps). Our main goal is to understand how ∆ changes based on round 1
leaderboard feedback. However, regression to the mean suggests that those who perform well in round 1
will tend not to perform quite as well in round 2, and those who perform poorly in round 1 will tend to
perform better in round 2. This could lead one to erroneously conclude that rank feedback hurts those
ranked near first and helps those ranked near last (Kahneman, 2011)4. Therefore, we also created groups
of controls.
Individuals participating in the control arm read that they were partaking in an exercise to step as many
times as they could in two 5-minute rounds, that both rounds were individual assessments, that they
would see their performance after round 1, and that only they and the researchers would see their scores
(actual survey appears in Appendix B). In other words, there was no suggestion that the individuals of the
control arm were partaking in a contest with other people. Although they were not involved in a
competition, we could still pit the controls against each other (unbeknownst to them) in a pseudo-
competition and analyze how their ∆ varied by round 1 rank. Specifically, we pooled all of the controls
and randomly selected (without replacement) six of them to form a group. Based on their round 1 steps,
we assigned each of them a round 1 rank, and based on their round 2 (and round 1) steps, we calculated
their∆. To obtain tight confidence intervals, we repeated this bootstrapping process to create 5,000
artificial control groups of six individuals each. The average ∆ vs. round 1 rank for the controls reflects a
baseline statistical regression to the mean; i.e., a baseline for assessing how ∆ varies in the absence of
competition. We then compared this against the ∆ vs. round 1 rank of the treatment group (i.e., those
competing against others and receiving rank feedback).
III.A.2 Results
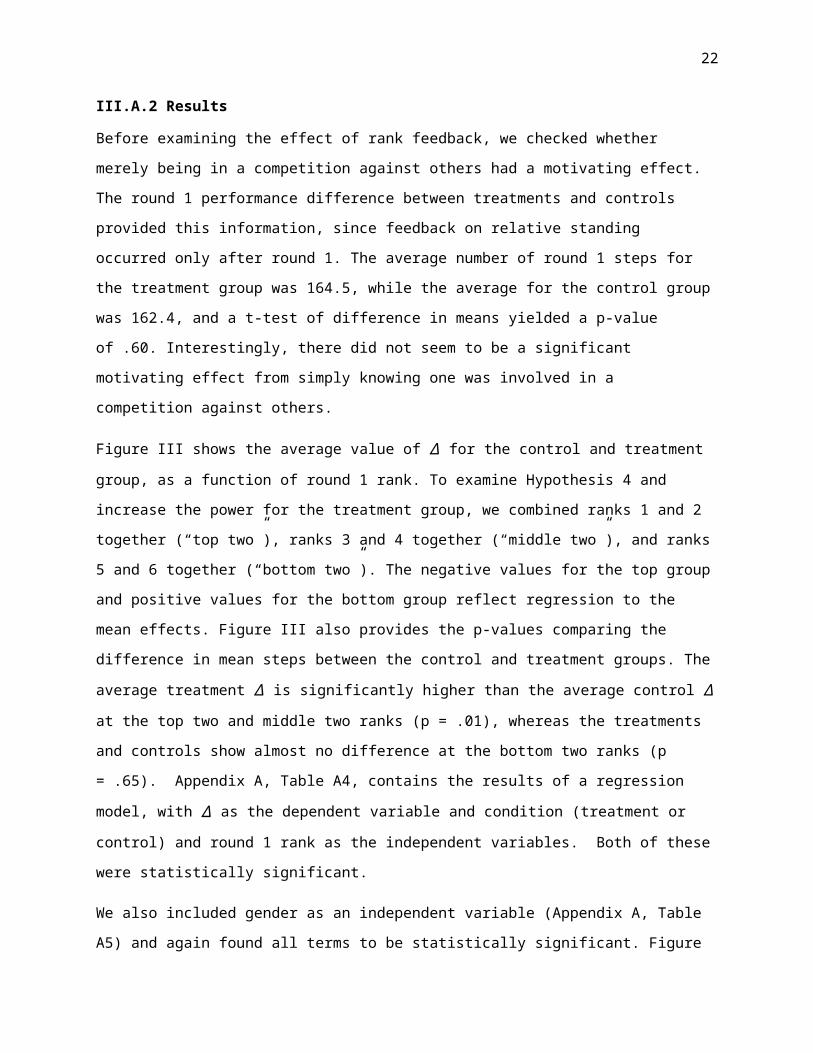
Before examining the effect of rank feedback, we checked whether merely being in a competition against
others had a motivating effect. The round 1 performance difference between treatments and controls
provided this information, since feedback on relative standing occurred only after round 1. The average
number of round 1 steps for the treatment group was 164.5, while the average for the control group was
162.4, and a t-test of difference in means yielded a p-value of .60. Interestingly, there did not seem to be a
significant motivating effect from simply knowing one was involved in a competition against others.
Figure III shows the average value of ∆ for the control and treatment group, as a function of round 1 rank.
To examine Hypothesis 4 and increase the power for the treatment group, we combined ranks 1 and 2
together (“top two”), ranks 3 and 4 together (“middle two”), and ranks 5 and 6 together (“bottom two”).
The negative values for the top group and positive values for the bottom group reflect regression to the
14
mean effects. Figure III also provides the p-values comparing the difference in mean steps between the
control and treatment groups. The average treatment ∆ is significantly higher than the average control ∆
at the top two and middle two ranks (p = .01), whereas the treatments and controls show almost no
difference at the bottom two ranks (p = .65). Appendix A, Table A4, contains the results of a regression
model, with ∆ as the dependent variable and condition (treatment or control) and round 1 rank as the
independent variables. Both of these were statistically significant.
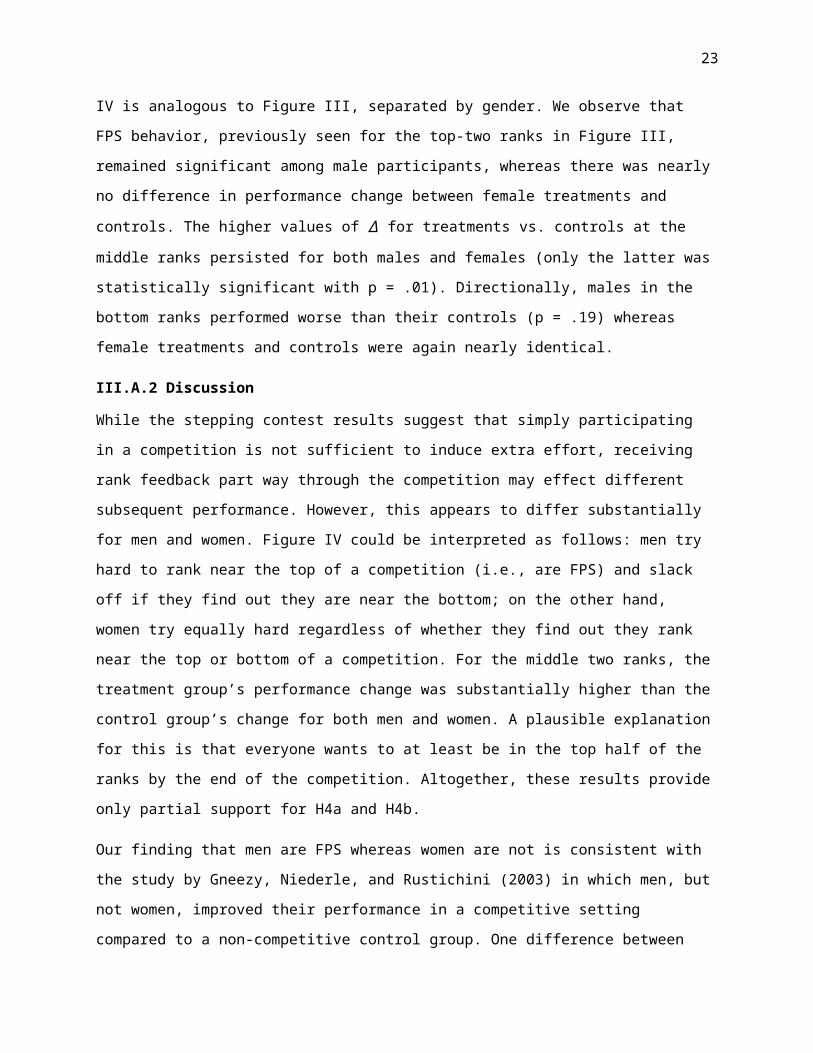
We also included gender as an independent variable (Appendix A, Table A5) and again found all terms to
be statistically significant. Figure IV is analogous to Figure III, separated by gender. We observe that FPS
behavior, previously seen for the top-two ranks in Figure III, remained significant among male
participants, whereas there was nearly no difference in performance change between female treatments
and controls. The higher values of ∆ for treatments vs. controls at the middle ranks persisted for both
males and females (only the latter was statistically significant with p = .01). Directionally, males in the
bottom ranks performed worse than their controls (p = .19) whereas female treatments and controls were
again nearly identical.
III.A.2 Discussion
While the stepping contest results suggest that simply participating in a competition is not sufficient to
induce extra effort, receiving rank feedback part way through the competition may effect different
subsequent performance. However, this appears to differ substantially for men and women. Figure IV
could be interpreted as follows: men try hard to rank near the top of a competition (i.e., are FPS) and
slack off if they find out they are near the bottom; on the other hand, women try equally hard regardless
of whether they find out they rank near the top or bottom of a competition. For the middle two ranks, the
treatment group’s performance change was substantially higher than the control group’s change for both
men and women. A plausible explanation for this is that everyone wants to at least be in the top half of
the ranks by the end of the competition. Altogether, these results provide only partial support for H4a and
H4b.
Our finding that men are FPS whereas women are not is consistent with the study by Gneezy, Niederle,
and Rustichini (2003) in which men, but not women, improved their performance in a competitive setting
compared to a non-competitive control group. One difference between the studies is that the winner of
their study received payment, whereas no one receives awards in our study.
Interestingly, we do not find evidence of LPA in the actual stepping contest. Individuals who learn they
are near the bottom of the competition do not appear to expend more effort. As discussed above, if
anything, it appears the effect may go in the opposite direction for men.

15
III.B Puzzle Competition
III.B.1 Experimental Design
The design of this experiment was analogous to that of the step competition; 462 subjects were randomly
assigned to control vs. treatment groups and participated in two separate rounds, separated by a week.
Instead of the athletic task of the step study, subjects in this study read that they were to solve as many
puzzles as they could in ten minutes (Appendix B contains exact wording of the surveys). Specifically,
the subjects worked on different Raven’s matrices, a classic non-verbal puzzle to test intelligence levels
(Raven 2000). Note that because the Raven’s matrices task was designed to measure raw intelligence as a
stable individual difference, it should not be very sensitive to contextual factors, and as such, represents a
conservative test of the impact of rank feedback on motivation and performance.
We created two distinct sets of these puzzles for the two rounds and internally tested them so that they
were of similar difficulty level. We also ensured that each set had enough questions so that it was unlikely
anyone could solve all of the puzzles in ten minutes. To discourage guessing, subjects were told that they
would get 1 point for each puzzle solved correctly, but lose ½ point for each puzzle answered incorrectly
(with no penalty for leaving a puzzle unanswered). Again, our primary output of interest was the change
in performance between rounds; i.e., round 2 score - round 1 score. Whereas the step study involved
competition groups of six individuals each, we created groups of ten each for the puzzle study, and we
again bootstrapped the controls to create 5,000 artificial groups of 10 each. Subjects were recruited from a
university campus (see Table A6 of Appendix A for a summary of the subject pool).
III.B.2 Results
As with the step study, we began by testing whether merely knowing one is in a competition affects
overall performance, and again we did not find evidence for this. The mean score for the control group in
round 1 was 14.9, and the mean score for the treatment groups was 15.1. The p-value of the t-test for the
difference of these means was .59. Furthermore, participants who performed well in round 1 performed
similarly well in round 2 (r = .71, p < .001).
Next, we examined whether being at a certain rank in a puzzle competition (and knowing it) influenced
subsequent performance. To do this, we examined the performance change from round 1 to round 2 as a
function of each participant’s rank after round 1. As summarized in Table A7 and Figure A3 in Appendix
A, participants generally regressed to the mean, with below average participants (those in ranks 10-6)
generally improving, and above average participants (in ranks 5-1) generally deteriorating. However,
there was a notable exception at rank 2, where participants directionally improved, rather than regressing
to the mean. These participants improved by an average of 0.72, outperforming matched controls who
16
worsened by an average of -1.33, t(26.32) = 3.27, p = .002 5. In contrast, none of the other ranks differed
from control, with all p = .11 or greater. These findings lend support to the idea that the desire for first
place is greater than the desire to avoid last place (supporting H3 and H4b).
Breaking the results down by gender, there were not any notable differences, as seen in Appendix A,
Table A7 and Figures A4 and A5). The smallest p-value was for females showing a relatively stronger
performance at rank 2 compared with controls (p = .02); however, this was not statistically significant
when applying the Bonferroni correction factor.
III.B.3 Discussion
In summary, in a puzzle competition with groups of 10, we found modest evidence of FPS but no
significant evidence for LPA, lending support to H3b and H4. The results were conceptually similar to the
results of the step competition in section III.A, but weaker. Several factors may have contributed to the
weaker effects of rank on performance in III.B: First, the puzzles used in III.B were designed as a stable
individual difference measure of intelligence, and as such may not respond as strongly to contextual
factors such as leaderboard rankings. Therefore, the puzzle competition represents a conservative test of
the effects of rank on motivation. Support for this idea comes from the high correlation between T1
performance and T2 performance in III.B. Second, we used groups of ten in III.B, which reduced the
number of groups we could form with a limited sample size (even with 230 participants in the
competition, this made only 23 groups, with 23 participants at each rank), resulting in larger confidence
intervals. Third, there is evidence that greater motivation and effort improves performance for simple
physical tasks (such as pressing a button) but not intellectual tasks (such as adding numbers) (Ariely,
Gneezy, Loewenstein, & Mazar, 2009). Therefore, rank feedback may have an equal impact on
motivation in physical and mental contests, as seen in Study 1, but the additional effort may better
translate into improved performance for physical (vs mental) contests, as seen in Study 2.
IV. Conclusions
Our results support the notion that individuals inherently care about rank in competitions. Despite
subjects’ identities remaining anonymous and no tangible benefits from any of the final rankings in our
contests, individuals demonstrate patterns of preference and effort in response to rank outcomes. In the
hypothetical surveys of Study 1, the following patterns of utility emerged: greater preference for higher
ranks, risk aversion at second-to-last place, risk seeking at second place, and greater utility loss between
first and second compared to second-to-last and last place. In summary, our utility studies suggest that
individuals exhibit both FPS and LPA, with FPS appearing to be an even stronger desire.
17
Our stepping contests of Study 2, however, did not demonstrate support for LPA (neither for men nor
women), and for males only, we found strong evidence of FPS behavior. There was also a drive to get
into the “top half” of the ranks for both genders. These results contrast with some of the findings of Gill et
al. (2018) (discussed in Section 1). For example, they did not find any gender effects and found strong
evidence of both FPS and LPA. The authors also found reductions in subsequent effort levels in response
to middle ranks, whereas we found that the middle ranks exhibited increased effort. We hypothesized
that those in the middle are striving to place in the top-half of the final rankings. However, it is plausible
that this effect depends on the number of competitors; we had competitions groups of 6 each, whereas
Gill et al. (2018) ran competition groups of 17 each. While they found support for both FPS and LPA,
Figure II of their study suggests that individuals have a stronger drive for FPS than LPA (the authors did
not discuss this though). This is consistent with our overall findings.
In our puzzle study with 10 competitors, we observed increased performance among those currently in
second place (consistent with Berger & Pope, 2011), but no additional motivation at any other rank, again
suggesting that FPS may be stronger than LPA. Such effects are likely to be larger to the extent that
motivation is translated directly into performance, which may explain why the effects of rank were
stronger in the step study than the puzzle study. Further research is needed to understand better how
different competition factors (e.g., type of competition, number of competitors) may accentuate or
dampen FPS, LPA, and behavior of those ranked further away from first and last place.
As noted above, individuals imagining competing in the hypothetical competitions of Study 1
demonstrated LPA, whereas individuals competing in the actual competitions of Study 2 did not. This
might be explained by research findings that show that loss aversion is often observed in choice tasks
(prospection), but not in retrospective ratings, because people tend to rationalize losses after they occur
(Kermer et al.2006). Similarly, our participants may have been more motivated to avoid the possibility of
last place (Study 1) than to escape actually being in or near last place (Study 2).
Because we showed treatment subjects their competition group’s leaderboard with everyone’s rank as
well as number of steps taken in round 1, changes in performance may depend not just on rank, but also
the number of steps ahead/behind the next lower/higher rank. For example, consider again a head-to-head
matchup between contestant A and contestant B, and suppose that A leads B by X steps after round 1.
Then a reasonable hypothesis is that both A and B decrease their round 2 effort as X increases. While the
effect of performance measure differences in combination with rank would be rather interesting to
uncover, our study was not powered enough to estimate this effect. The main challenge is that we would
need a matching group of controls who had similar step differences between ranks after round 1.
18
Finally, an interesting prescriptive question concerns the optimal number of competitors to group
together. For example, a fitness app may want to match users with each other in a week-long stepping
competition so as to maximize total steps taken across the group. A sales manager may want to create
competition groups among a salesforce so as to increase overall sales for the month. Prescriptive models
of tournament design in the economics literature have shown that contestant effort decreases in the
number of contestants (Taylor, 1995) and that under a variety of contest settings, the optimal number of
contestants is two (Fullerton & McAfee, 1999), (Che & Gale, 2003). Similarly, a paper in the psychology
literature found that a competitor’s motivation and effort decrease when there are more competitors
(Garcia & Tor, 2009). However, each of these studies considered settings in which competitors make
effort decisions without receiving any performance feedback (e.g., leaderboard information) along the
way. It is plausible that, after receiving rank feedback, the effect of group size goes in the opposite
direction. For example, perhaps those ranked near first place half-way through a competition try even
harder to finish in first when there are more competitors, because the glory is even greater if they finish at
or near the top.
19
References
Ariely, D., Gneezy, U., Loewenstein, G., & Mazar, N. (2009). Large stakes and big mistakes. The Review of Economic Studies, 76(2), 451-469.
Berger, J., & Pope, D. (2011). Can losing lead to winning? Management Science, 57(5), 817-827.
Blanes i Vidal, J., & Nossol, M. (2011). Tournaments Without Prizes: Evidence from Personnel Records. Management Science, 57(10), 1721-1736.
Boudreau, K. J., Lacetera, N., & Lakhani, K. R. (2011). Incentives and Problem Uncertainty in Innovation Contests: An Empirical Analysis. Management Science, 57(5), 843-863.
Bull, C., Schotter, A., & Weigelt, K. (1987). Tournaments and Piece Rates: An Experimental Study. Journal of Political Economy, 95(1), 1-33.
Buser, T., Niederle, M., & Oosterbeek, H. (2014). Gender, Competitiveness, and Career Choices. The Quarterly Journal of Economics, 129(3), 1409-1447.
Chapman, G. B., Colby, H., Convery, K., & Coups, E. J. (2016). Goals and Social Comparisons Promote Walking Behavior. Medical Decision Making, 36(4), 472-478.
Che, Y.-K., & Gale, I. (2003). Optimal Design of Research Contests. American Economic Review, 93(3), 646-671.
Dutcher, E. G., Balafoutas, L., Lindner, F., Ryvkin, D., & Sutter, M. (2015). Strive to be first or avoid being last: An experiment on relative performance incentives. Games and Economic Behavior, 94, 39-56.
Ehrenberg, R. G., & Bognanno, M. L. (1990). The Incentive Effects of Tournaments Revisited: Evidence from the European Pga Tour. ILR Review, 43(3), 74-S-88-S.
Festinger, L. (1954). A Theory of Social Comparison Processes. Human Relations, 7(2), 117-140.
Fullerton, R. L., & McAfee, R. P. (1999). Auctioning Entry into Tournaments. Journal of Political Economy, 107(3), 573-605.
Garcia, S. M., & Tor, A. (2009). The N-Effect: More Competitors, Less Competition. Psychological Science, 20(7), 871-877.
Garcia, S. M., Tor, A., & Gonzalez, R. (2006). Ranks and Rivals: A Theory of Competition. Personality and Social Psychology Bulletin, 32(7), 970-982.
Garcia, S. M., Tor, A., & Schiff, T. M. (2013). The Psychology of Competition: A Social Comparison Perspective. Perspectives on Psychological Science, 8(6), 634-650.
Gill, D., Kissová, Z., Lee, J., & Prowse, V. (2018). First-place loving and last-place loathing: How rank in the distribution of performance affects effort provision. Management Science, To appear.
Gneezy, U., Niederle, M., & Rustichini, A. (2003). Performance in Competitive Environments: Gender Differences. The Quarterly Journal of Economics, 118(3), 1049-1074.
20
Hershey, J. C., & Schoemaker, P. J. H. (1985). Probability Versus Certainty Equivalence Methods in Utility Measurement: Are They Equivalent? Management Science, 31(10), 1213-1231.
Hopkins, E., & Kornienko, T. (2009). Status, Affluence, and Inequality: Rank-Based Comparisons in Games of Status. Games and Economic Behavior, 67(2), 552-568.
Kahneman, D. (2011). Thinking, Fast and Slow. New York: Farrar, Straus and Giroux.
Kahneman, D., & Tversky, A. (1979). Prospect Theory: An Analysis of Decision Under Risk. Econometrica, 47(2), 263-292.
Keeney, R. L., & Raiffa, H. (1993). Decisions with multiple objectives: preferences and value trade-offs: Cambridge university press.
Kermer, D. A., Driver-Linn, E., Wilson, T. D., & Gilbert, D. T. (2006). Loss Aversion is an Affective Forecasting Error. Psychological Science, 17(8), 649-653.
Kuziemko, I., Buell, R. W., Reich, T., & Norton, M. I. (2014). “Last-Place Aversion”: Evidence and Redistributive Implications. The Quarterly Journal of Economics, 129(1), 105-149.
Lazear, E. P., & Rosen, S. (1981). Rank-Order Tournaments as Optimum Labor Contracts. Journal of Political Economy, 89(5), 841-864.
List, J., Van Soest, D., Stoop, J., & Zhou, H. (2014). On the Role of Group Size in Tournaments: Theory and Evidence from Lab and Field Experiments. Retrieved from
Malhotra, D. (2010). The Desire to Win: The Effects of Competitive Arousal on Motivation and Behavior. Organizational Behavior and Human Decision Processes, 111(2), 139-146.
Moldovanu, B., Sela, A., & Shi, X. (2007). Contests for Status. Journal of Political Economy, 115(2), 338-363.
Niederle, M., & Vesterlund, L. (2007). Do Women Shy Away from Competition? Do Men Compete Too Much? The Quarterly Journal of Economics, 122(3), 1067-1101.
Sutter, M., & Glätzle-Rützler, D. (2014). Gender Differences in the Willingness to Compete Emerge Early in Life and Persist. Management Science, 61(10), 2339-2354.
Taylor, C. R. (1995). Digging for Golden Carrots: An Analysis of Research Tournaments. The American Economic Review, 872-890.
Terwiesch, C., & Xu, Y. (2008). Innovation Contests, Open Innovation, and Multiagent Problem Solving. Management Science, 54(9), 1529-1543.
Tran, A., & Zeckhauser, R. (2012). Rank as an Inherent Incentive: Evidence from a Field Experiment. Journal of Public Economics, 96(9-10), 645-650.
Von Neumann, J., & Morgenstern, O. (1944). Theory of Games and Economic Behavior (Vol. 51): Princeton University Press.
21
Table I
Summary of different studies. The “number of contestants per group” indicates the group sizes in which
treatment subjects were to imagine they were participating. “Avg comp” (male and female) indicates a
self-rated competitiveness level, on a scale of 1 (not at all competitive) - 7 (very competitive).
Table II
Summary of individuals’ utility function behavior. Column 1 indicates the percentage of subjects who had
a utility for second place strictly greater than their utility for second-to-last place (H1). Column 2
indicates the percentage of subjects whose utility function between first and third place was strictly
convex (i.e., U(Rank 2) - U(Rank 3) < U(Rank 1) - U(Rank 2); H2a). Column 3 indicates the percentage
of subjects whose utility function between third-to-last and last place was strictly concave (i.e., U(Rank 5)
- U(Rank 6) > U(Rank 4) - U(Rank 5); H2b). The last column indicates the percentage of subjects who
had a greater drop in utility from first to second place, compared to the drop in utility from second-to-last
to last place (H3). 95% confidence intervals for the population percentage of each column are within +/-
2% of the values shown.
Study label Subject pool
Number of contestants per group
Sample size
% male
Avg age
Avg male comp
Avg female comp
1a. MTurk 6 1001 50 36 5.0 4.51b. MTurk 6 1960 52 35 5.0 4.41c. undergraduate
students10 423 36 21 5.7 5.2
Utility Second > Utility Second-to-Last
Convex at Second
Concave at Second-to-Last
Drop from First >Drop to Last
86% 80% 68% 69%
22
Utility Second - Utility Second-to-Last
Convex at Second - Concave at Second-to-Last
Drop from First -Drop to Last
0.35 (0.33, 0.37) 0.12 (0.08, 0.16) 0.22 (0.19, 0.24)
Table III
Average within-subject differences related to the columns of Table II, with 95% confidence intervals in
parentheses. For example, whereas the first column of Table II shows the percent of individuals who
satisfied the inequality indicated (within-subjects), column 1 of this table shows the average of each
individual’s U(Rank 2) - U(Rank 5). Column two is the average the individuals’ I(Convex at Second) -
I(Concave at Second-to-Last), where I() is the indicator function. The third column is the average of the
individuals’ [U(Rank 1) - U(Rank 2)] – [U(Rank 5) - U(Rank 6)], where U(Rank 1) and U(Rank 6) are set
to 1 and 0, respectively.
23
Treatment or Control
Sample size
% male
Avg age
Avg male comp
Avg female comp
Treatment 231 36 19.9 5.6 4.8Control 162 48 19.8 5.6 5.1
Table IV
Summary of subjects participating in the step competition of Study 2.
24
Figure I
Average utility by rank, for Study 1a. Ranks are shown from last place on the left, to first place on the
right. The bars show the 95% confidence intervals around the mean utility (n = 1001).
25
Figure II
Analogous to Figure I, separated by gender.
26
Figure III
Difference in steps between rounds, grouped by round 1 rank and treatment condition. The numbers
above each control/treatment comparison is the p-value of a t-test for difference of means at that rank.
p = 0.65p < .01
p = .01
27
(a) (b)
Figure IV
a) Δ by (grouped) round 1 rank for males, and b) Δ by (grouped) round 1 rank for females. The p-values are for a t-test of difference between averages within each tier (bottom, middle, top).
p = .94
p = .01
p = .90
p = .19
p = .20
p < .01
28
Endnotes
1 For example, Netflix sponsored a $1 million prize to improve predictions of customers’ movie
preferences (netflixprize.com). Kaggle (kaggle.com) allows firms to sponsor data science competitions.2 For example, crowdrise.com
3 We estimate the indifference probability to within 0.02, which happens after 5 choice tasks.
4 This would be akin to Kahneman’s (2011) story of an Israeli Air Force instructor believing that praising
good cadet aerial performance leads to worse subsequent performance, while criticizing poor performance
yields improvements.
5 Note that this is significant even with a conservative Bonferroni correction (for the 10 rank
comparisons), for which the usual α = .05 significance threshold would be reduced to α = .05/10 = .005.