Embed Size (px)
Citation preview

1
CHAPTER I
2
INTRODUCTION
Finance is said to be ‘the science of money’. Finance implies funds
necessary for carrying on the activities of an organization. The funds include;
• Fixed capital for procuring fixed assets, i.e., plant, machinery, building,
tools and equipments.
• Working capital for procuring raw materials, payment of wages, overhead
etc.
Working capital (WC) is a financial metric which represents available to a
business, organization or other entity, including governmental entity. Working
capital may be regarded as the lifeblood of a business firm. Along with fixed assets
such as plant and equipment, working capital is considered a part of operating
capital. Working capital refers to firm’s investment in short term assets such as
cash, short term securities, amount receivables, inventories of raw materials, work
in progress and finished goods. There might not be many business firms in the
world where, besides investment in fixed assets, funds would not be needed for
carrying on day-to-day operations of the business. It can also be regarded as that
portion of the firm’s total capital that is employed in short term operations. It
refers to all aspects of current assets and current liabilities. Net working capital is
calculated as If current assets are less than current liabilities; an entity has a
working capital deficiency, also called a working capital deficit.
Technically, Working capital management is an integral part of the
financial management. Decisions relating to working capital and short term
financing are referred to as working capital management. The financial manager
must determine the optimum level of working capital funds and also the optimum
composition of current assets and current liabilities. He must ensure that the
appropriate sources of funds are used to finance working capital and also see that
short term liabilities of the business are met well in time. The goal of working
capital management is to ensure that the firm is able to continue its operations and
that it has sufficient cash flow to satisfy both maturing short-term debt and
3
upcoming operational expenses.
A firm may exist without making profits but cannot survive without
liquidity. A firm not making profits may be treated as sick but one having no
liquidity may soon meet with its downfall and ultimate die. Working capital has
thus become a basic and broad measure of judging the performance of a business
firm.
State Bank of Travancore (SBT) is a subsidiary of the State Bank Group
and also has private shareholders. In 1960, it became a subsidiary of State Bank of
India under the SBI Subsidiary Banks Act 1959, enacted by the Parliament of
India. It is the premier bank of Kerala, India. Where it has 777 branches spread
over 16 Indian States. It provide services in the areas of Investment banking,
Consumer banking, Commercial Banking, Retail banking, Private banking, Asset
management, Pensions, mortgages etc.,
This project is undertaken to study the present mode of working capital
management and utilization in SBT. Main objective of this study is to suggest
optimization and improvisation strategies, if any to represent mode of working
capital management.
STATEMENT OF THE PROBLEM
This study has been undertaken to know whether the management of
working capital employed by State Bank of Travancore is satisfactory or not. To
have a clear understanding about the management of working capital, profitability
and financial position of the business, the financial statements should be analyzed
and interpreted.
Every business activities require finance. Finance is needed to establish a
business, to run it, to modernize it, to expand or to diversify it. A firm can attain
growth and development only by performing in a better way in all the fields. If the
performance is not up to the satisfactory level proper, precautionary measures have
to be adopted in the sick or inefficient areas.
4
In this context an attempt is made to evaluate the overall working capital
position of STATE BANK OF TRAVANCORE (SBT), one of the subsidiaries of
SBI. The study is carried on by giving more emphasize on the working capital
management of SBT.
SCOPE AND SIGNIFICANCE OF THE STUDY
The financial sector reforms and the rapid structural changes taking place in
the Indian economy are having very positive impact on the banking sector. It made
the banking industry in India a less predictive but a more competitive one.
As banking sector is different from other conventional industries with
regard to its operation and working, the procurement and utilization of working
capital is also different. A study of working capital is of major importance to
internal and external analysis, because of its close relationship with the current day
–to-day operation of an entity. The inefficient management of working capital is
one of the main causes for sickness and failure of many entities. Thus, in the light
of the present performance of the public sector banks, the present study on
working capital management with reference to State Bank of Travancore has got
special significance.
OBJECTIVES OF THE STUDY
The main objective of this study is to examine the operating and working
capital performance of State Bank of Travancore with proper stress on the
following specific objectives.
� To study the effect of working capital on SBT’s profitability and liquidity.
� To study the working capital position of SBT.
� To evaluate the capital structure of SBT.
5
METHODOLOGY OF THE STUDY
The study is partially descriptive and partially analytical. It is descriptive as
it traces the theoretical frame work of working capital management. It is analytical
in the sense that it makes an appraisal of working capital management in SBT.
The study is mainly based on secondary data. The secondary data were
collected mainly from the audited annual reports of the bank, books, periodicals
etc.
In order to analyze the data statistical tools like ratios, percentages, tables
and graphs are used.
PERIOD OF THE STUDY
For overall analysis of the performance of bank, data related to 5 years that
is, from the financial year 2008 – 2009 to the financial year 2010 -2013 were
considered.
LIMITATIONS OF THE STUDY
� The data available for study have been restricted to few years’ annual
reports. The in-house data has been very secretive and confidential. This
shortcoming is reflected in the study.
� The study would have been more useful if primary data were collected from
the customers and officials of the bank.
� Again, owing to time constraint, carrying out an in depth study was not
possible.
6
CHAPTERIZATOIN
The project report is presented in five chapters:
Chapter 1 Introduction: It deals with meaning and significance of working
capital, statement of the problem, scope and significance of the study, objectives of
the study, methodology followed, period and limitation of the study.
Chapter 2 State Bank of Travancore: A profile: This includes origin and
development, organization structure, objective and activities performed by the
bank such as deposits schemes, credit schemes, etc.
Chapter 3 Theory on ‘Working Capital Management’: This chapter deals with
working capital, concepts of working capital, need of working capital, operating
cycle, factors influencing working capital, kinds of working capital, working
capital management, Excess or inadequate working capital, disadvantages of
excess or inadequate working capital, principles of working capital management,
importance of working capital management, advantages of working capital
management, working capital financing policy.
Chapter 4 Analysis and interpretation: This chapter deals with data analysis of
the SBT to assess the working capital position through the ratios of liquidity,
profitability, efficiency and solvency and statement of changes in working capital
for the past five years.
Chapter 5 Findings, Suggestions and Conclusion: In this chapter summarizes the
findings of the study and certain remedial measures and conclusions are
incorporated.

7
CHAPTER II

STATE BANK OF TRAVANCORE
The State Bank of Travancore, the premier banking
one of 27 public sector banks of country. It belongs to the State Bank Group
comprising the State Bank of India and 7 Associated Banks. The bank was
originally known as Travancore Bank Ltd, until it became a subsidiary of The
State Bank of India (SBI) on 01/01/1960 from which date it came to be called the
State Bank of Travancore.
Origin and Development
The bank was originally established as the Travancore Bank Ltd on the 12
September 1945 with the support and patronage of the M
The bank had 8 branches in the year 1946 and acted as the central bank of the
state. The bank was accorded the status of a scheduled bank in the same year.
The bank became a subsidiary of State Bank of India as per The State Bank
of India (subsidiary bank act 1959) may of the old private bank of Kerala like
Travancore forward bank, Kottayam orient bank, Bank of India, Cochin Nayar
Bank, Latin Christian bank etc were amalgamated with the bank between 1961 to
1965 and State Bank of Travancore emerged as the premier banking institution in
the state Kerala with wide network of branches. The chief executives of the
Travancore Bank Ltd in the earlier days were
executives were Indians drawn from The Imperial Bank of India or The State Bank
of India.
State Bank of Travancore (2010)
8
STATE BANK OF TRAVANCORE – A PROFILE
ate Bank of Travancore, the premier banking institution in Kerala, is
one of 27 public sector banks of country. It belongs to the State Bank Group
comprising the State Bank of India and 7 Associated Banks. The bank was
originally known as Travancore Bank Ltd, until it became a subsidiary of The
e Bank of India (SBI) on 01/01/1960 from which date it came to be called the
Origin and Development
The bank was originally established as the Travancore Bank Ltd on the 12
September 1945 with the support and patronage of the Maharaja of Travancore.
The bank had 8 branches in the year 1946 and acted as the central bank of the
state. The bank was accorded the status of a scheduled bank in the same year.
The bank became a subsidiary of State Bank of India as per The State Bank
of India (subsidiary bank act 1959) may of the old private bank of Kerala like
Travancore forward bank, Kottayam orient bank, Bank of India, Cochin Nayar
bank etc were amalgamated with the bank between 1961 to
1965 and State Bank of Travancore emerged as the premier banking institution in
the state Kerala with wide network of branches. The chief executives of the
Travancore Bank Ltd in the earlier days were Europeans. From 1995 the
executives were Indians drawn from The Imperial Bank of India or The State Bank
State Bank of Travancore State Bank of Travancore (2010)
institution in Kerala, is
one of 27 public sector banks of country. It belongs to the State Bank Group
comprising the State Bank of India and 7 Associated Banks. The bank was
originally known as Travancore Bank Ltd, until it became a subsidiary of The
e Bank of India (SBI) on 01/01/1960 from which date it came to be called the
The bank was originally established as the Travancore Bank Ltd on the 12th
aharaja of Travancore.
The bank had 8 branches in the year 1946 and acted as the central bank of the
state. The bank was accorded the status of a scheduled bank in the same year.
The bank became a subsidiary of State Bank of India as per The State Bank
of India (subsidiary bank act 1959) may of the old private bank of Kerala like
Travancore forward bank, Kottayam orient bank, Bank of India, Cochin Nayar
bank etc were amalgamated with the bank between 1961 to
1965 and State Bank of Travancore emerged as the premier banking institution in
the state Kerala with wide network of branches. The chief executives of the
Europeans. From 1995 the
executives were Indians drawn from The Imperial Bank of India or The State Bank
State Bank of Travancore (2010)
9
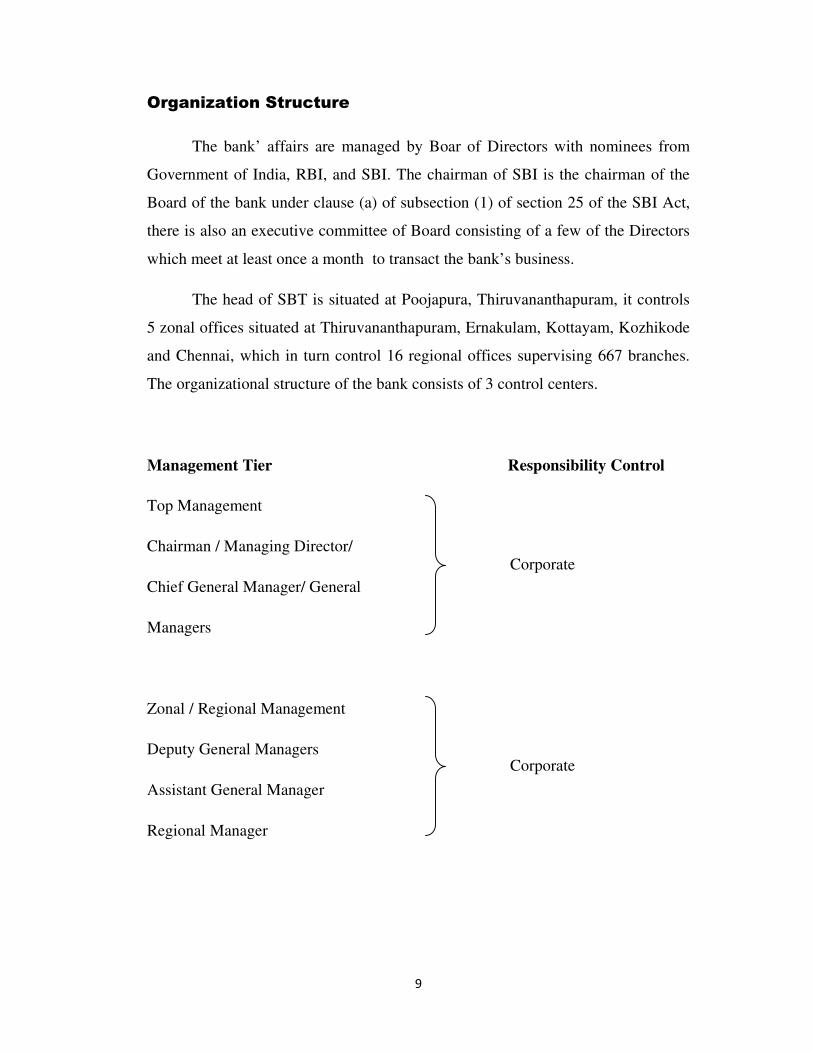
Organization Structure
The bank’ affairs are managed by Boar of Directors with nominees from
Government of India, RBI, and SBI. The chairman of SBI is the chairman of the
Board of the bank under clause (a) of subsection (1) of section 25 of the SBI Act,
there is also an executive committee of Board consisting of a few of the Directors
which meet at least once a month to transact the bank’s business.
The head of SBT is situated at Poojapura, Thiruvananthapuram, it controls
5 zonal offices situated at Thiruvananthapuram, Ernakulam, Kottayam, Kozhikode
and Chennai, which in turn control 16 regional offices supervising 667 branches.
The organizational structure of the bank consists of 3 control centers.
Management Tier Responsibility Control
Top Management
Chairman / Managing Director/
Chief General Manager/ General
Managers
Zonal / Regional Management
Deputy General Managers
Assistant General Manager
Regional Manager
Corporate
Corporate
10
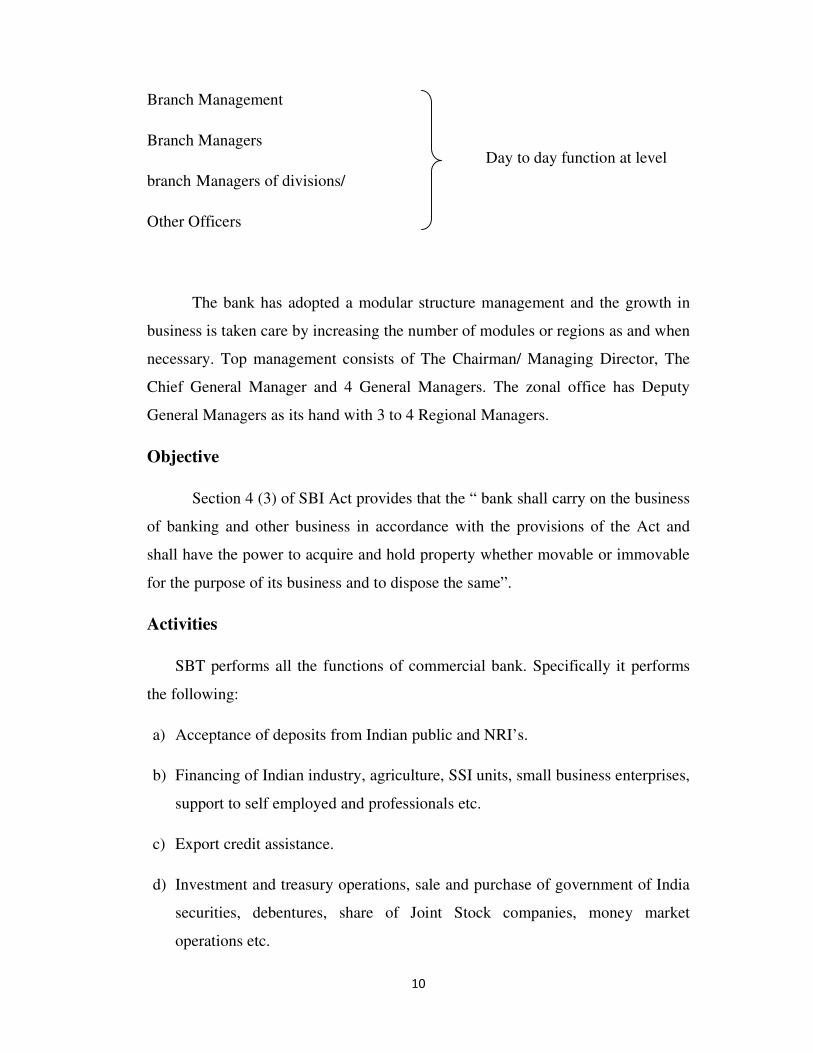
Branch Management
Branch Managers
branch Managers of divisions/
Other Officers
The bank has adopted a modular structure management and the growth in
business is taken care by increasing the number of modules or regions as and when
necessary. Top management consists of The Chairman/ Managing Director, The
Chief General Manager and 4 General Managers. The zonal office has Deputy
General Managers as its hand with 3 to 4 Regional Managers.
Objective
Section 4 (3) of SBI Act provides that the “ bank shall carry on the business
of banking and other business in accordance with the provisions of the Act and
shall have the power to acquire and hold property whether movable or immovable
for the purpose of its business and to dispose the same”.
Activities
SBT performs all the functions of commercial bank. Specifically it performs
the following:
a) Acceptance of deposits from Indian public and NRI’s.
b) Financing of Indian industry, agriculture, SSI units, small business enterprises,
support to self employed and professionals etc.
c) Export credit assistance.
d) Investment and treasury operations, sale and purchase of government of India
securities, debentures, share of Joint Stock companies, money market
operations etc.
Day to day function at level
11
e) Merchant Banking: issue management, underwriting, and acting as a
collecting banker to primary issues.
f) Foreign exchange dealings: sale and purchase of rupee and foreign currency.
g) Other services: Acting as bankers for state Government, RBI, and SBI,
providing safe deposit locker services and custodian services.
Some other activities of SBT are given below:
1) Lead Bank Scheme
SBT has lead bank responsibility in three districts in Kerala viz, Alappuzha,
Kottayam and Pathanamthitta. The bank conducted several programmes like SHG
linkages, formation of farmers clubs, Kudumbasree awareness classes,
Bhavanasree loan melas etc. Revenue Recovery melas were conducted in all the
three lead districts allotted to the bank.
2) Community Service Banking
Voluntary participation of staff members in social action programmes
through social circles is the unique feature in the community service policy of the
bank. The concept has promoted innovative thinking, concern for the society,
better team spirit and more opportunities for staff fulfillment.
3) Consumer Service
A fully fledged grievance redressal mechanism to address issues relating to
customer complaints is in place. The customer service committee at the branches,
zonal offices and head offices are quite active to ensure that there is no deficiency
in this regard. SBT is indeed seen today as a customer sender and a customer
friendly bank.
4) Technology Up gradation and ITR initiative
Continuing its thrust in leveraging the benefits of computerization in
business growth, the bank undertaken a number of IT initiatives for technology up
12
gradations and providing value added products and services. One of the major IT
initiatives launched recently was the introduction of Core Banking Solutions with
centralized database management.
5) Risk Management System
The bank has structured risk management architecture to address various
risks. At the apex level, a Risk Management Committee Board (RMCB) oversees
the policy and strategy for integrated risk management relative to various risk
exposures. Risk Management Initiatives are being taken keeping in mind the
demands made by the new capital adequacy framework, which is more risk
sensitive.
Deposits Schemes
State Bank of Travancore offers the following deposit schemes:
a) Savings Deposit
• Best suited for all classes of people.
• Minors above 10 years can open and operate the account.
• Quarterly average minimum balance to be maintained in SB account is
Rs.1000 with cheque book facility and Rs.500 without cheque book facility.
• Liberal withdrawal facilities.
• No tax deduction at source on interest.
• Nomination facility is available.
• Internet banking or ATM or mobile banking facilities are also available.
b) Term Deposits
• Deposits for periods of 7 days to 120 months.
• Minimum deposit is Rs.1000 at multiples of Rs.100.
13
• Interest normally paid quarterly, half yearly or yearly. Monthly payment
can be had at discount rates.
• Premature withdrawal permitted with applicable penalty.
• Loans are available up to 90% of the deposit, with interest 1% above the
deposit rate.
• Minors above the age of 10 can deposit up to Rs.2 lakhs in their names
independently.
c) SBT Reinvestment plan (Special Term Deposits)
• Ideal for maximum return.
• Care free long term investment with safety and liquidity.
• Interest accrued is compounded quarterly.
• Premature withdrawal permitted with applicable penalty.
• Loans are available up to 90% of the deposit, with interest 1% above the
deposit rate.
• Minors above the age of 10 can deposit up to Rs.2 lakhs in their names
independently.
• Existing deposits accounts can freely be converted into special term
deposit accounts and vice versa.
d) Short Term Automatically renewable (STAR) Deposit Scheme
• Minimum deposit Rs.5000 accepted in multiples of Rs.100 only.
• Short term deposit scheme with automatic renewal facility.
• Premature withdrawal permitted.
14
e) Thrift Deposits
• Recurring deposit scheme for a period of 12 months to 120 months with
fixed monthly remittances.
• No income tax deducted at source.
• Ideal for regular monthly income earners, traders, pensioners etc.
f) Unit Deposit Scheme
• Amount deposited is held in units of Rs.1000each
• Accounts can be opened with Rs.10000 and thereafter in multiples of
Rs.100.
• No maximum limit.
g) Variable Deposit Scheme (Super Surplus)
• Recurring deposit scheme for a period of 12 months to 120 months.
• Offers flexibility in the amount of monthly remittance.
• Interest credited to the account half yearly.
• Ideal for those persons whose monthly savings vary from month to month.
Credit Schemes
The following are the credit schemes of SBT:
a) Gyan Jyothi (Educational Loan)
� Provides financial assistance to deserving students.
� Loan up to 705 lakhs for studies in India and up to 15 lakhs for studies
abroad.
� Repaid in 5 to 7 years after commencement of repayment.
15
b) SBT Gold Loan:
� Loans against Gold ornaments or gold bullion.
� Amount of loan – maximum 5 lakhs.
� Period of loan – 6 to 12 months.
c) SBT Festival Loan:
� For celebrating festivals and important functions.
� Loan amount minimum Rs.5000 and maximum Rs.50000.
� Repayment period 1year.
� Repayable in 10 equated monthly installments.
d) Sahaya Varsha
� A loan scheme to meet short term financial needs.
� Amount of loan – minimum RS.100000 and maximum Rs.200000.
� Repaid in 6 to 60 months in equated monthly installments.
e) Suvidha Loans
� General purpose loan.
� Amount of loan – minimum Rs.50000 and maximum Rs.25 lakhs.
� Repayable in 7 years in equated monthly installments.
� Age of the borrower should not exceed 60 years.
f) SBT Computer Loan
� For purchasing home computer, personal computer and other accessories.
� Maximum amount of loan Rs.1 lakh.
� Maximum repayment period – 72 months.
16
g) SBT Car Loan
� For purchase of new as well as second hand cars.
� Maximum amount of loan Rs.12 lakhs.
� Repayment – For new cars 84 equal monthly installments, for second hand
cars 60 equated monthly installments.
h) SBT Two Wheeler Loans
� Both for residents and NRI’s.
� Maximum amount of loan Rs.5 lakhs.
� Repayable in 72 equated monthly installments.
State Bank of Travancore (SBT) received
• National Award for Excellence in MSME Lending
• National Award for Excellence in Lending To Micro Enterprises for
the Year 2011 – 12.
The Bank opened 134 new branches during the financial year, taking the total
number of branches to 1013. Bank has 758 branches in the state of Kerala which is
75% of Bank’s total network. The Bank has plans to open about 200 branches to
take its network to 1200 during the current year. Alternative channel reach was
also expanded further; by installing 36 new ATMs during the financial year, taking
the total ATMs to 965. A new Zonal office has been opened in Kollam taking the
total number of Zonal Offices to seven. The branches under Kollam and
Alappuzha districts are under the control of this Zone. The Bank has also opened a
Platinum Point Personal segment branch at Banjara Hills, Hyderabad.The Bank
has also opened 21 Specialised Gold Point Branches covering 14 districts in Kerala
17
and one in Kanyakumari district of Tamil Nadu to facilitate speedy and easy
disbursement of Gold Loans for the customers.
Bank also proposes to open a new Zonal Office at Bangaluru. The Bangaluru
Zonal Office will have jurisdiction of branches in Karnataka, Andhra Pradesh and
Orissa States. Five more Regional Offices are proposed at Hyderabad,Madurai,
Pala, Kottarakara and a second Regional Office at Kannur.
RSETIs are functioning at Wayanad, Pathanamthitta, Alappuzha, and Kottayam
for providing skill upgradation training to the rural youth with focus on BPL
category. The four institutes had trained 15,582 beneficiaries since inception and
87% of the people are women beneficiaries and majority of the trainees are
reported to be successful in starting self-employment ventures. Out of 10,363
beneficiaries contacted as follow up, 7803 were well settled. The important
courses includes beautician, electrical wiring, ornaments manufacturing, tally
accounting, Computer hardware servicing, aluminum fabrication, kitchen
gardening, mushroom cultivation with vegetable growing, mural painting etc.

18
CHAPTER III
19
REVIEW OF LETRATURE
Working Capital
Every business needs funds for two purposes – for its establishment and to
carry out its day to day operations. Long term funds are required to create
production facilities through purchase of fixed assets such as plant and machinery,
land, building, furniture, etc. Investment in these assets represent that part of firms
capital which is blocked on a permanent or fixed basis is called fixed capital.
Funds are also needed for short – term purposes for the purchase of raw materials,
payment of wages and other day to day expenses, etc. These funds are known as
working capital. In simple words, working capital refers to that part of the firm’s
capital which is required for financing short – term or current assets such as cash,
marketable securities, debtors and inventories. Funds thus invested in current
assets keep revolving fast and are being constantly converted in to cash and this
cash flows out again in exchange for other current assets. Hence, it is also known
as revolving or circulating capital or short-term capital.
According to Genestenberg, “Circulating capital means current assets of a
company that are changed in ordinary course of business from one form to another,
as for example, from cash to inventories, inventories to receivables, receivables in
to cash.”
Concepts of Working Capital
There are two concepts of working capital:
� Balance Sheet Concept
� Operating Cycle or Circular Flow Concept
20
Balance Sheet Concept
There are two interpretations of working capital under the balance sheet concept:
• Gross Concept
• Net Concept
In the broad sense, the term working capital refers to the gross working
capital and represents the amount of funds invested in current assets. Thus, the
gross working capital is the capital invested in total current assets of the enterprise.
Current assets are those assets which in the ordinary course business can be
converted in to cash within a short period of normally one accounting year. For
example, cash in hand and bank balances, bills receivables, sundry debtors,
inventories, etc.
In a narrow sense, the term working capital refers to the net working capital.
Net working capital is the excess of current assets over current liabilities. Or say :
Net working capital = Current Assets – Current Liabilities.
Net working capital may be positive or negative. When the current assets
exceed the current liabilities the working capital is positive and the negative
working capital results when the current liabilities are more than the current assets.
Current liabilities are those liabilities which are intended to be paid in the ordinary
course of business within a short period of normally one accounting year out of the
current assets or the income of the business. For example, bills payables, sundry
creditors, outstanding expenses, etc.
The gross working capital concept is financial or going concern concept
whereas net working capital is an accounting concept of working capital.
Operating Cycle or Circular Flow Concept
Working capital refers to that part of the firm’s capital which is required for
financing short – term or current assets such as cash, marketable securities, debtors
and inventories. Funds thus invested in current assets keep revolving fast and are
21
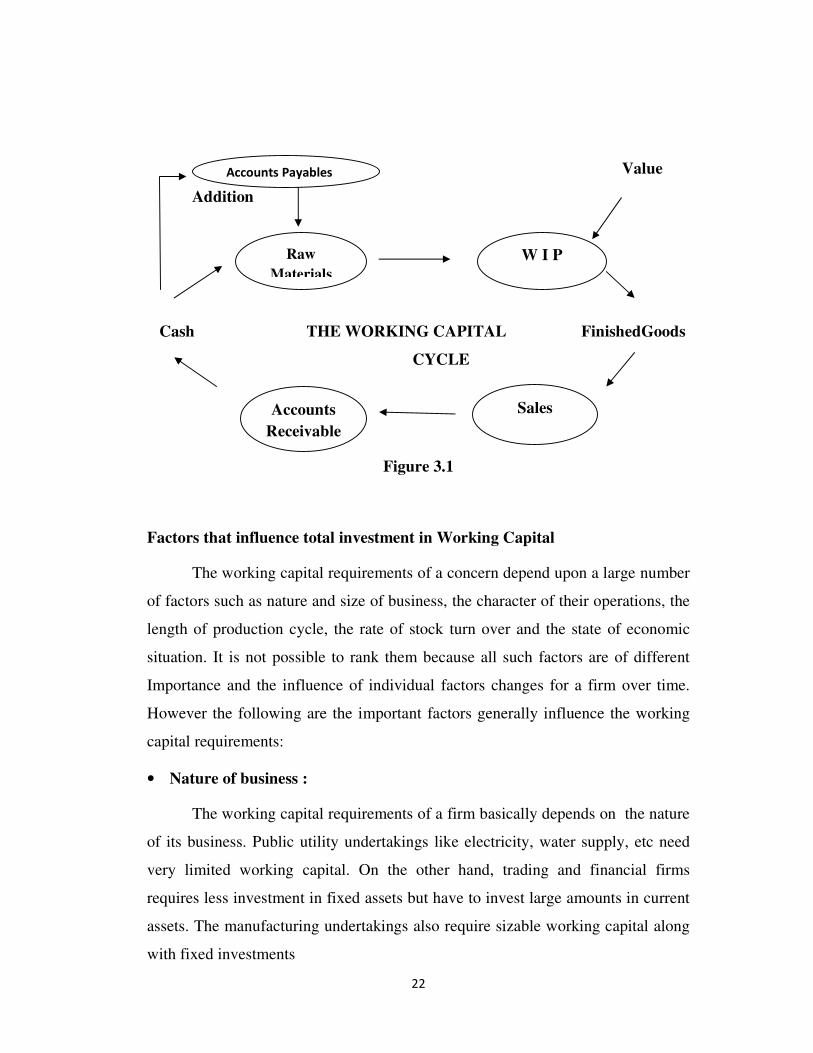
being constantly converted in to cash and this cash flows out again in exchange for
other current assets. Hence, it is also known as revolving or circulating capital. The
circular flow concept of working capital is based upon this operating or working
capital cycle of a firm. The cycle starts with the purchase of raw materials and
other resources and ends with the realization of cash from the sale of finished
goods. It involves purchase of raw materials and stores, its conversion into stock of
finished goods through work in progress with progressive increment of labor and
service cost, conversion of finished stock into sales, debtors and receivables and
ultimately realization of cash and this cycle continues again from cash to purchase
of raw materials and so on. The speed / time duration required to complete one
cycle determines the requirements of working capital - longer the period of cycle,
larger is the requirement of working capital.
The duration of time needed to complete the following chain of events in
case of a manufacturing company is called operating cycle.
• Conversion of cash in to raw materials.
• Conversion of raw materials in to work-in-progress.
• Conversion of work-in-progress in to finished goods.
• Conversion of finished goods in to accounts receivables through sales.
• Conversion of accounts receivables in to cash.
Operating Cycle = O = R + W + F + D – C
O Duration of Operating Cycle
R Raw Materials and Storage Period
W Work In Progress
F Finished Goods and Storage Period
D Debtor’s Collection Period
C Creditor’s Payment Period
22
Value
Addition
Cash THE WORKING CAPITAL FinishedGoods
CYCLE
Figure 3.1
Factors that influence total investment in Working Capital
The working capital requirements of a concern depend upon a large number
of factors such as nature and size of business, the character of their operations, the
length of production cycle, the rate of stock turn over and the state of economic
situation. It is not possible to rank them because all such factors are of different
Importance and the influence of individual factors changes for a firm over time.
However the following are the important factors generally influence the working
capital requirements:
• Nature of business :
The working capital requirements of a firm basically depends on the nature
of its business. Public utility undertakings like electricity, water supply, etc need
very limited working capital. On the other hand, trading and financial firms
requires less investment in fixed assets but have to invest large amounts in current
assets. The manufacturing undertakings also require sizable working capital along
with fixed investments
Accounts Payables
Raw
Materials
Accounts
Receivable
W I P
Sales
23
• Manufacturing process :
In manufacturing business, the requirements of working capital increase in
direct proportion to length of manufacturing process. Longer the process period of
manufacture, larger is the amount of working capital required.
• Size of business :
The working capital requirements of a concern are directly influenced by
the size of its business which may be measured in terms of scale of operations.
Greater the size of a business unit, generally larger will be the requirements of
working capital.
• Production policy :
In certain industries the demand is subject to wide fluctuations due to
seasonal variations. The requirements of working capital, in such cases depend
upon the production policy. If the policy is to keep production steady by
accumulating inventories it will require higher working capital.
• Seasonal Variations :
In certain industries raw material is not available throughout the year. They
have to buy the raw materials in bulk during the season to ensure uninterrupted
flow and process them during the entire year. Generally during the busy season, a
firm requires larger working capital than in the slack season.
• Working Capital Cycle :
In a manufacturing concern, the working capital cycle starts with the
purchase of raw material and ends with the realization of cash from the sale of
finished products. The speed with which the working capital completes one cycle
determines the requirements of working capital.
• Rate of Stock Turnover :
There is a high degree of inverse co-relationship between the quantum of
working capital and the velocity or speed with which the sales are affected. A firm
24
having rate of stock turnover will need lower amount of working capital as
compared to a firm having a low rate of turnover.
• Business Cycle :
Business cycle refers to alternate expansion and contraction in general
business activity. In a period of boom i.e., when the business is prosperous, there is
a need for larger amount of working capital due to increase in sales, rise in prices,
optimistic expansion of business, etc. On the contrary in the times of depression,
the business contracts, sale decline and the firm may have large amount of working
capital lying idle.
• Rate of Growth of Business :
The working capital requirements of a concern increase with the growth and
expansion of its business activities. Although it is difficult to determine the
relationship between the growth in the volume of business and the growth in the
working capital of the business.
• Price Level Changes :
Changes in the price levels also affect the working capital requirements.
Generally the rising prices will require the firm to maintain larger amount of
working capital as more funds will be required to maintain the same current assets.
The effect of rising prices may be different for different firms.
• Earning Capacity and Dividend Policy :
The firms with high earning capacity may generate cash profits from
operations and contribute to their working capital. The dividend policy of a
concern also influences the requirements of its working capital. A firm that
maintains a steady high rate of cash dividend irrespective of its profits needs more
working capital than the firm that retains larger part of its profits.
• Repayment Ability :
A firm’s repayment ability determines level of its working capital. The
usual practice of a firm is to prepare cash flow projections according to its plan of
repayment and to fix the working capital levels accordingly.
25
• Credit Policy :
The credit policy of a concern in its dealings with debtors and creditors
influence the working capital position. A concern that purchases its requirements
on credit and sells its products/services on cash requires lesser amount of working
capital. On the other hand a concern buying its requirements for cash and allowing
credit to its customers, need larger amount of working capital.
• Other Factors :
Certain other factors such as operating efficiency, management ability,
irregularities of supply, import policy, asset structure, importance of labour,
banking facilities, etc., also influence the requirements of working capital.
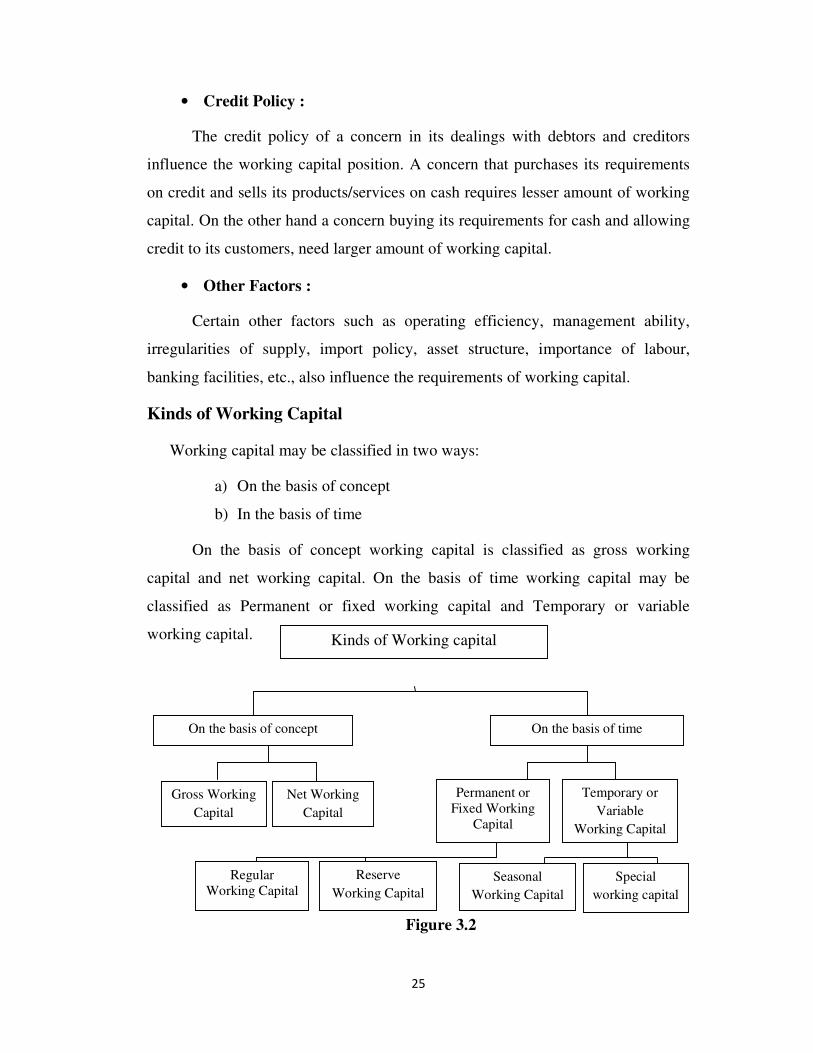
Kinds of Working Capital
Working capital may be classified in two ways:
a) On the basis of concept
b) In the basis of time
On the basis of concept working capital is classified as gross working
capital and net working capital. On the basis of time working capital may be
classified as Permanent or fixed working capital and Temporary or variable
working capital.
Figure 3.2
Kinds of Working capital
On the basis of concept On the basis of time
Gross Working
Capital
Net Working
Capital
Permanent or
Fixed Working
Capital
Temporary or
Variable
Working Capital
Regular
Working Capital
Reserve
Working Capital
Seasonal
Working Capital
Special
working capital
26
1. Gross Working Capital :
Gross working capital is the amount of funds invested in the various
components of current assets.
2. Net Working Capital :
The net working capital is the difference between current assets and current
liabilities. The concept of net working capital enables to determine how much
amount is left for operational requirements.
3. Permanent or Fixed Working Capital :
Permanent or fixed working capital is the minimum amount which required
ensuring effective utilization of fixed facilities and for maintaining the circulation
of current assets. There is always a minimum level of current assets which is
continuously required by the enterprise to carryout its normal business operations.
This minimum level of current asset is called as permanent or fixed working
capital.
The permanent working capital can further be classified as regular working
capital and reserve working capital required to ensure circulation of current assets
from cash to inventories, from inventories to receivables, and from receivables to
cash and so on.
Reserve working capital is the excess amount over the requirement for
regular working capital which may be provided for contingencies that may arise at
unstated period such as strikes, rise in prices, depression, etc.
4. Temporary or Variable Working Capital :
Temporary or variable working capital is the amount of working capital
which is required to meet the seasonal demands and some special exigencies.
Viable working capital can be further classified as seasonal working capital and
special working capital. Most of the enterprises have to provide additional working
capital to meet seasonal and special needs.
The capital required to meet the seasonal needs of the enterprise is called
seasonal working capital. Special working capital is that part of working capital
which is required to meet special exigencies such as launching of extensive
marketing campaigns for conducting research etc.
27
Working Capital Management
Working capital, in general practice, refers to the excess of current assets
over current liabilities. Management of working capital therefore, is concerned
with the problems that arise in attempting to manage the current assets, the current
liabilities and the inter-relationship that exist between them. In other words, it
refers to all aspects of administration of both current assets and current liabilities.
The basic goal of working capital management is to manage the current assets and
current liabilities of a firm in such a way that a satisfactory level of working
capital is maintained, i.e., it is neither inadequate nor excessive. This is so because
both inadequate as well as excessive working capital positions are bad for any
business. Inadequacy of working capital may lead the firm to insolvency and
excessive working capital implies idle funds which earn no profit for the business.
Working capital management policies of a firm have a great effect on its
profitability, liquidity and structural health of the organization.
Excess or Inadequate Working Capital
Every business concern should have adequate working capital to run its
business operations. It should have either redundant or excess working capital nor
inadequate or shortage of working capital. Both excess as well as short working
capital positions are bad for any business. However, out of two, it is the
inadequacy of working capital which is more dangerous from the point of view of
the firm.
Disadvantages of Redundant or excessive Working capital
• Excessive working capital means idle funds which earn no profits for the
business and hence the business can not earn a proper rate of return on its
investment.
• When there is a redundant working capital, it may lead to unnecessary
purchasing and accumulation of inventories causing more chances of theft,
waste and losses.
• Excessive working capital implies excessive debtors and defective credit policy
which may cause higher incidence of bad debts.
28
• It may result in to overall inefficiency in the organization.
• When there is excessive working capital, relations with banks and other
financial institutions may not be maintained.
• Due to low rate of return on investments, the value of shares may also fall.
• The redundant working capital gives rise to speculative transactions.
Disadvantages of Inadequate Working Capital
• A concern which has inadequate working capital cannot pay its short term
liabilities in time. Thus, it will lose its reputation and shall not be able to get
good credit facilities.
• It can not buy its requirements in bulk and cannot avail of discounts, etc.
• It becomes difficult for the firm to exploit favorable market conditions and
undertake profitable projects due to lack of working capital.
• The firm cannot pay day to day expenses of its operations and it creates
inefficiencies, increases costs and reduces the profits of the business.
• It becomes impossible to utilize efficiently the fixed assets due to non
availability of liquid funds.
• The rate of return on investments also falls with the shortage of working
capital.
Principles of Working Capital Management
The following are the general principles of a sound working capital
management policy:
Figure 3.3
Principles of Working Capital Management
Principle of risk
variation
Principle of cost
of capital
Principle of
equity position
Principle of maturity
of payment
29
� Principle of Risk Variation (Current Assets Policies)
Risk here refers to the inability of affirm to meet its obligations as and when
they become due for payment. Larger investment in current assets with less
dependence on short term borrowings increases liquidity, reduces dependence on
short term borrowings increases liquidity, reduces risk and there by decreases the
opportunity for gain or loss. On the other hand, less investment in current assets
with greater dependence on short term borrowings reduces liquidity and increases
profitability. In other words, there is a definite inverse relationship between the
degree of risk and profitability.
� Principle of Cost of Capital
The various sources of raising working capital finance have different cost of
capital and the degree of risk involved. Generally, higher the risk lower is the cost
and lower the risk higher is the cost. A sound working capital management should
always try to achieve a proper balance between these two.
� Principle of Equity Position
This principle is concerned with planning the total investment in current
assets. According to this principle, the amount of working capital invested in each
component should be adequately justified by a firm’s equity position. Every rupee
invested in the current asset should contribute to the net worth of the firm. The
level of current assets may be measured with the help of two ratios: current assets
as a percentage of total assets and current assets as a percentage of total sales.
� Principle of Maturity of Payment
This principle is concerned with planning the sources of finance for
working capital. According to this principle, a firm should make every effort to
relate maturities of payment to its flow of internally generated funds. Maturity
pattern of various current obligations is an important factor in risk assumptions and
risk assessments. Generally, shorter the maturity schedule of current liabilities in
30
relation to expected cash inflows, the greater the inability to meet its obligations in
time.
Importance of Working Capital Management
Working capital is the life blood of every concern, whether it is
manufacturing or non manufacturing one. Without adequate working capital there
can be no progress in the industry. Inadequate working capital means shortage of
raw materials, labour etc., resulting in partial utilization of available machinery.
On the other hand, more working capital may lead to less control over workers
performances, inefficient store keeping, excessive stock of raw materials and
finished goods, delay in the flow of work-in-progress and lack of co-ordination in
the enterprise.
In times of rising capital costs and scarce funds, the area of working capital
management assumes added importance. A firm’s profitability and liquidity are
deeply influenced by the way its working capital is being managed. The main
objective of the working capital management is to arrange the needed funds
adequately from the sources and for the time period involved, so that trade-off
between liquidity and profitability may be realized.
The volume of working capital required is determined by the level of
production unlike fixed asset investment which is determined by the scale of
production. The precise level of working capital investment depends upon the
management’s attitude towards risk and the factors that influence the levels of
cash, inventories and receivables required to support a given volume of output.
Advantages of Working capital management
The use of general principles and techniques for planning and controlling
working capital results in following benefits:
i. Control of cost of holding current assets :
Holding inventory level and debtors involves cost. Poor control of inventory
and debtors can result in loss. In the case of inventory, it may be absolute and not
31
saleable at profitable prices. Holding of such absolute inventory causes loss.
Managing working capital aims at reducing such investments and therefore,
minimizing cost of holding current assets.
ii. Control of technical insolvency :
The inability to repay debts at their maturity dates leads to technical
insolvency and eventually to liquidation. Legal insolvency is the state when the
realized value of assets is less than the amount of debts to be paid. Technical
insolvency is the state when assets are equal or more than the liabilities to convert
assets into cash so as to pay its creditors. Avoidance of technical insolvency is a
significant benefit from managing working capital.
iii. Adequate working capital :
Inadequate working capital has a cost. This cost arises due to loss of potential
sales and loss of customers. If the level of inventory is so low that customer’s
requirements cannot be earned on such potential sales are lost. Added to this is loss
due to diversion of customers to other suppliers for their longer term requirements.
Similarly, customers will be lost if competitive credit terms are not offered by a
firm, when it is trying to reduce receivables to a below than normal level by strict
credit policy.
iv. Credibility with the outside world :
Working capital management helps in maintaining solvency in the eyes of
trade creditors, bankers, fixed interest investors, and equity share holders. These
persons analyze the financial position of the firm to evaluate its credit worthiness.
Management of working capital directs attention to alternative managerial
decisions. Some of these are:
a) Obtaining adequate long term financing by making necessary
arrangements well in time.
b) Arranging credit from suppliers and banks.
32
c) Restructuring the selling prices and pricing policies.
d) Shortening of period of credit allowed and revising discount rates
and discount periods.
e) Monitoring the level of inventory.
In shortly, confidence of outside world is an important factor which should be
considered in working capital management to ensure credibility with outside
world.
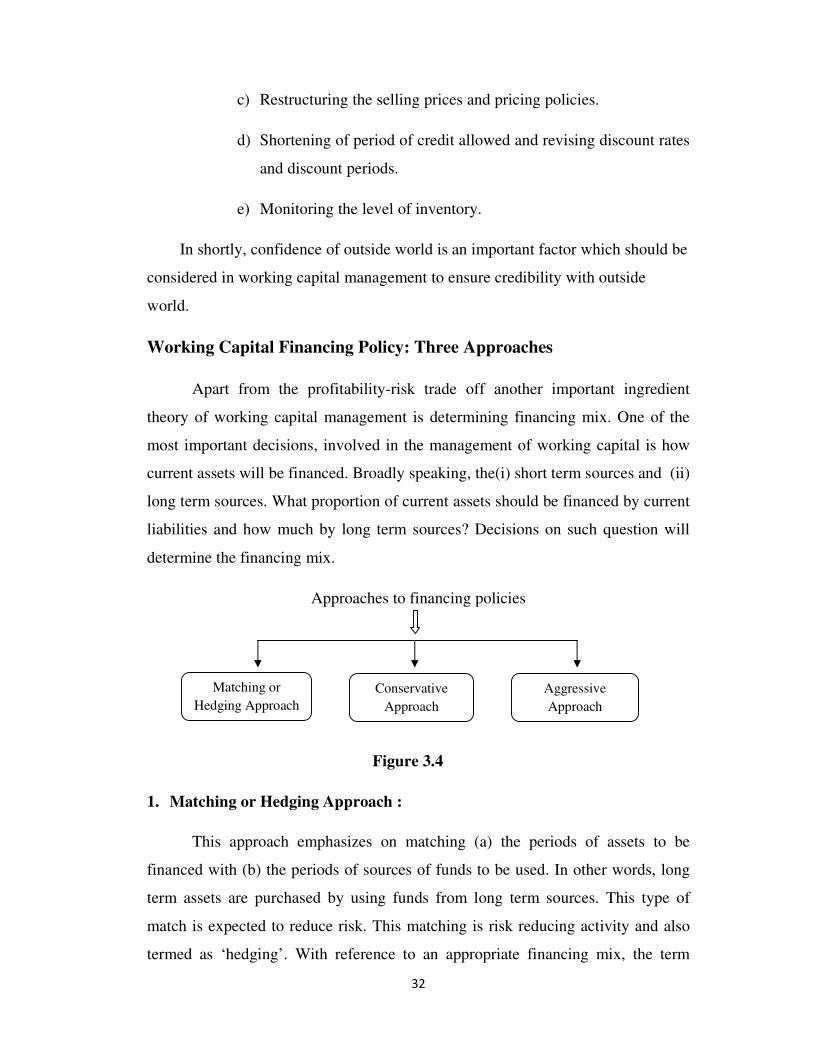
Working Capital Financing Policy: Three Approaches
Apart from the profitability-risk trade off another important ingredient
theory of working capital management is determining financing mix. One of the
most important decisions, involved in the management of working capital is how
current assets will be financed. Broadly speaking, the(i) short term sources and (ii)
long term sources. What proportion of current assets should be financed by current
liabilities and how much by long term sources? Decisions on such question will
determine the financing mix.
Approaches to financing policies
Figure 3.4
1. Matching or Hedging Approach :
This approach emphasizes on matching (a) the periods of assets to be
financed with (b) the periods of sources of funds to be used. In other words, long
term assets are purchased by using funds from long term sources. This type of
match is expected to reduce risk. This matching is risk reducing activity and also
termed as ‘hedging’. With reference to an appropriate financing mix, the term
Matching or
Hedging Approach
Conservative
Approach
Aggressive
Approach
33
hedging can be said to refer to the process of matching of debt with the maturities
of financial needs.
According to this approach, the maturity of source of funds should match
the nature of assets to be financed. For the purpose of analysis, the current
assets can be broadly classified in to two classes:
a) Those which are required in a certain amount for a given level of operation
and hence, do not vary over time. (permanent working capital)
b) Those which fluctuate over time. (variable working capital)
The hedging approach suggest that long term funds should be used to finance the
fixed portion of current assets requirements as spelt out in (a) above, in a manner
similar to the financing of fixed assets. The purely temporary requirements, that is,
the seasonal variations over and above the permanent financing needs should be
appropriately financed with short term funds (current liabilities). With this
approach, the short term financing requirements (current assets) would be just
equal to the short term financing available (current liabilities). There would,
therefore be no net working capital.
2. Conservative Approach :
This approach suggest that the estimated requirements of total funds should be
met from long term sources; the use of short term funds should be restricted to
only emergency situations or when there is an unexpected outflow of funds.
Under this method:
I. Risk is minimized.
II. Cost of financing is relatively more.
III. Liquidity is relatively is greater.
34
3. Aggressive Approach:
This approach suggests that (a) a major part of the total current assets
investment is financed by short-term sources, and (b) a part of fixed assets
investments is also financed by short-term sources.
In aggressive approach, the bias is towards use of short-term sources, even
for long-term uses. The larger the ratio of short-term funds to total investments in
assets (fixed + current assets), the more the aggressive approach of financing.

35
CHAPTER IV
36
DATA ANALYSIS
This chapter deals with the analysis of working capital of The State Bank of
Travancore based on the analysis of secondary data. Analysis is done with the help
of various financial ratios and statements or schedules of changes in working
capital.
Under ratio analysis various components of current assets and current
liabilities are taken into account and their relationships expressed in mathematical
terms for interpreting financial position. It is a powerful tool of financial analysis.
It is defined as the systematic use of ratio to interpret the financial statements, so
that the strength and weakness of a firm as well as its historical performance and
current financial condition can be determined.
Schedule of changes in working capital is prepared to show the changes in
working capital between the two balance sheet dates. This statement is prepared
with the help of current assets and current liabilities derived from the two balance
sheets. It is resulted in either increase or decrease in net working capital.
Financial Ratios
Financial ratios are useful indicators of a firm’s performance and financial
situation. It is used as a device to analyze and interpret the financial health of the
enterprise. Most ratios can be calculated from information provided by the
financial statements. A financial ratio is the relationship between two accounting
figures expressed mathematically. Financial ratios can be used to analyze trends
and to compare the firm’s financial position to those of other firms. In some cases,
ratio analysis can predict future bankruptcy.
Financial ratios can be classified according to the information they provided. The
following types of ratios frequently are used.
37
I. Liquidity Ratios
These are the ratios which measure the short term solvency or financial
position of the firm. These ratios are calculated to comment upon the short term
paying capacity of a concern or the firm’s ability to meet its current obligations.
The frequently used liquidity ratios are the current ratios, quick ratios and absolute
liquid ratios.
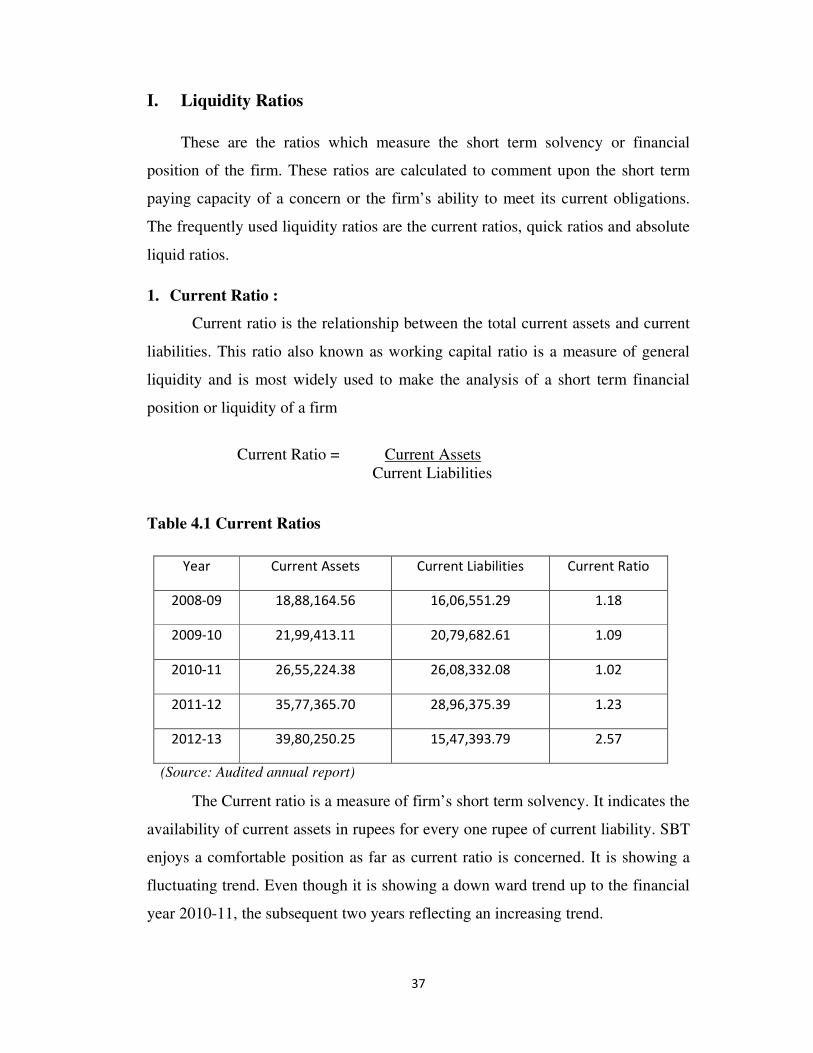
1. Current Ratio :
Current ratio is the relationship between the total current assets and current
liabilities. This ratio also known as working capital ratio is a measure of general
liquidity and is most widely used to make the analysis of a short term financial
position or liquidity of a firm
Current Ratio = Current Assets
Current Liabilities
Table 4.1 Current Ratios
The Current ratio is a measure of firm’s short term solvency. It indicates the
availability of current assets in rupees for every one rupee of current liability. SBT
enjoys a comfortable position as far as current ratio is concerned. It is showing a
fluctuating trend. Even though it is showing a down ward trend up to the financial
year 2010-11, the subsequent two years reflecting an increasing trend.
Year Current Assets Current Liabilities Current Ratio
2008-09 18,88,164.56 16,06,551.29 1.18
2009-10 21,99,413.11 20,79,682.61 1.09
2010-11 26,55,224.38 26,08,332.08 1.02
2011-12 35,77,365.70 28,96,375.39 1.23
2012-13 39,80,250.25 15,47,393.79 2.57
(Source: Audited annual report)
38
Figure 4.1 Current Ratios
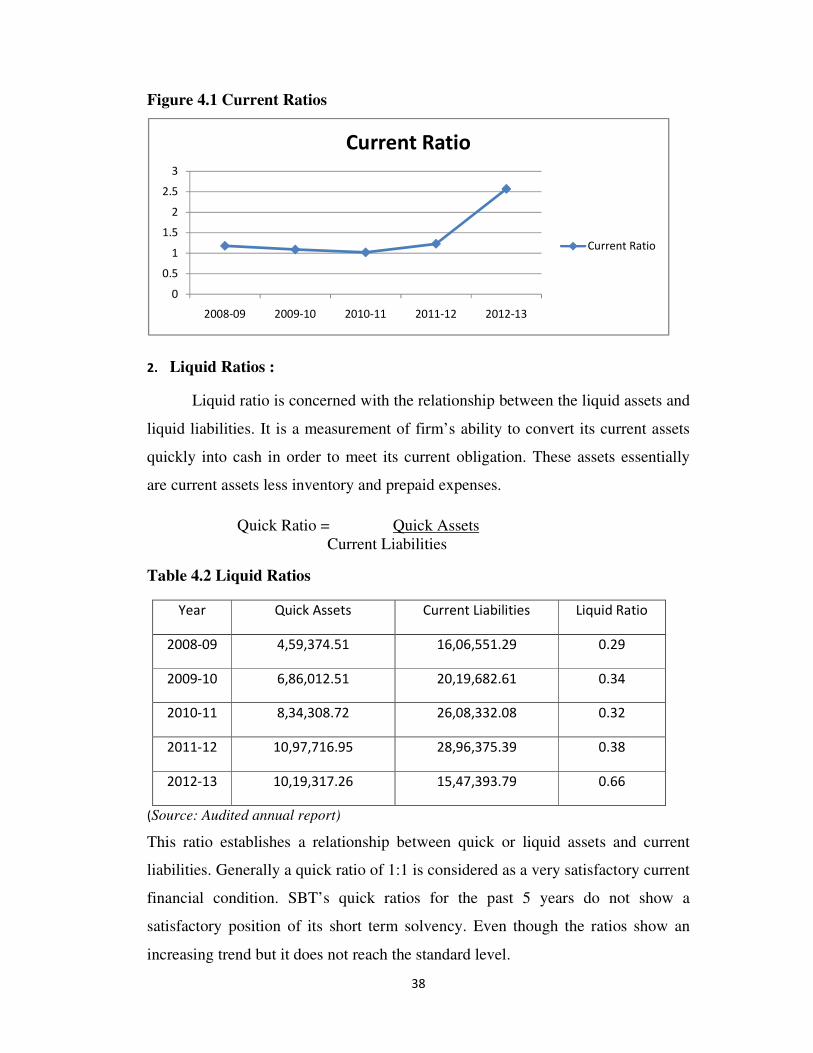
2. Liquid Ratios :
Liquid ratio is concerned with the relationship between the liquid assets and
liquid liabilities. It is a measurement of firm’s ability to convert its current assets
quickly into cash in order to meet its current obligation. These assets essentially
are current assets less inventory and prepaid expenses.
Quick Ratio = Quick Assets
Current Liabilities
Table 4.2 Liquid Ratios
Year Quick Assets Current Liabilities Liquid Ratio
2008-09 4,59,374.51 16,06,551.29 0.29
2009-10 6,86,012.51 20,19,682.61 0.34
2010-11 8,34,308.72 26,08,332.08 0.32
2011-12 10,97,716.95 28,96,375.39 0.38
2012-13 10,19,317.26 15,47,393.79 0.66
(Source: Audited annual report)(
This ratio establishes a relationship between quick or liquid assets and current
liabilities. Generally a quick ratio of 1:1 is considered as a very satisfactory current
financial condition. SBT’s quick ratios for the past 5 years do not show a
satisfactory position of its short term solvency. Even though the ratios show an
increasing trend but it does not reach the standard level.
0
0.5
1
1.5
2
2.5
3
2008-09 2009-10 2010-11 2011-12 2012-13
Current Ratio
Current Ratio
39
Figure 4.2 Liquid Ratio
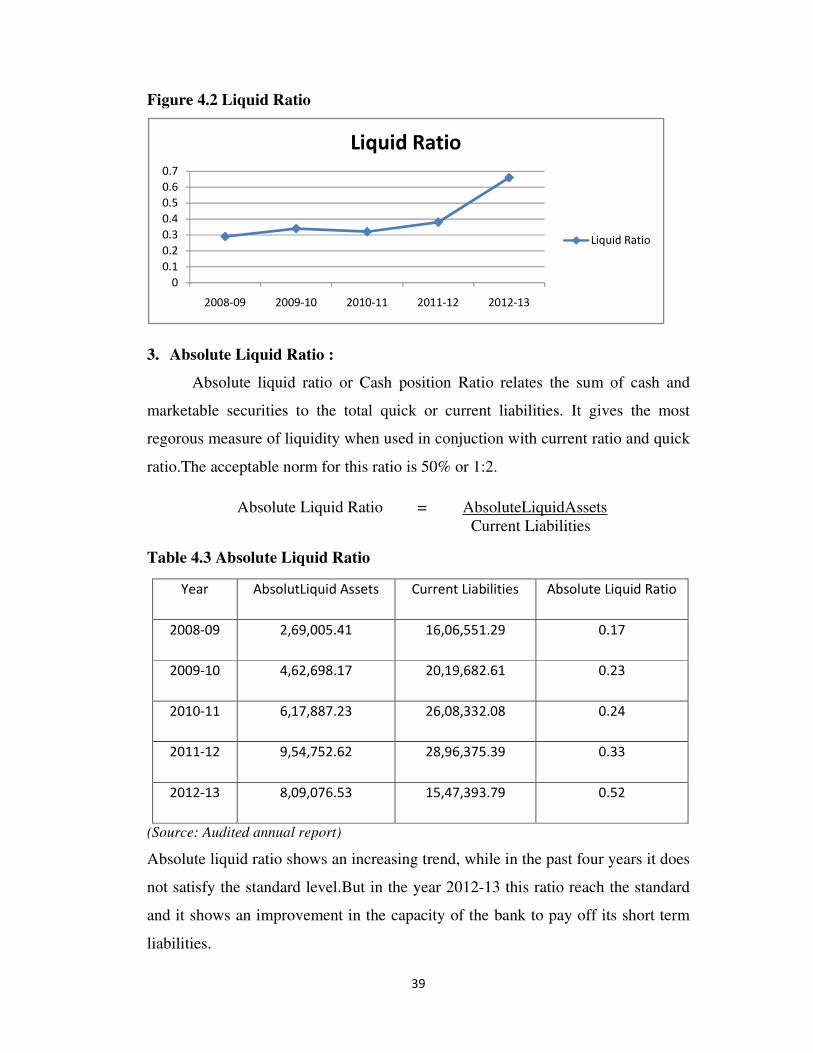
3. Absolute Liquid Ratio :
Absolute liquid ratio or Cash position Ratio relates the sum of cash and
marketable securities to the total quick or current liabilities. It gives the most
regorous measure of liquidity when used in conjuction with current ratio and quick
ratio.The acceptable norm for this ratio is 50% or 1:2.
Absolute Liquid Ratio = AbsoluteLiquidAssets
Current Liabilities
Table 4.3 Absolute Liquid Ratio
Year AbsolutLiquid Assets Current Liabilities Absolute Liquid Ratio
2008-09 2,69,005.41 16,06,551.29 0.17
2009-10 4,62,698.17 20,19,682.61 0.23
2010-11 6,17,887.23 26,08,332.08 0.24
2011-12 9,54,752.62 28,96,375.39 0.33
2012-13 8,09,076.53 15,47,393.79 0.52
(Source: Audited annual report)
Absolute liquid ratio shows an increasing trend, while in the past four years it does
not satisfy the standard level.But in the year 2012-13 this ratio reach the standard
and it shows an improvement in the capacity of the bank to pay off its short term
liabilities.
0
0.1
0.2
0.3
0.4
0.5
0.6
0.7
2008-09 2009-10 2010-11 2011-12 2012-13
Liquid Ratio
Liquid Ratio
40
Figure 4.3 Absolute Liquid Ratio
II. Profitability Ratios :
Profits are useful measure of overall efficiency of a business concern.
Profits to management are the test of efficiency and a measurement of control, to
owners a measure of worth of their investment, to an enterprise less cumbersome
source of finance for growth and existence. Profitability ratios offer several
measures of the success of the firm at generating profits. It indicates in a nutshell
the effectiveness of the decision taken by the management from time to time.
These ratios are calculated to enlighten the end results of business activities which
is the sole criterion of the overall efficiency of a business concern.
1. Net Profit ratio :
Net profit ratio establishes a relationship between net profit (after tax) and
sales, and indicates the efficiency of the management in the activities of the firm.
This ratio is the overall measure of firm’s profitability.
Net Profit Ratio = Net Profit after Tax
Net Sales
Here, the bank’s loans and advances are considered for calculating sales.
0
0.1
0.2
0.3
0.4
0.5
0.6
2008-09 2009-10 2010-11 2011-12 2012-13
AbsoluteLiquidRatio
AbsoluteLiquidRatio
41
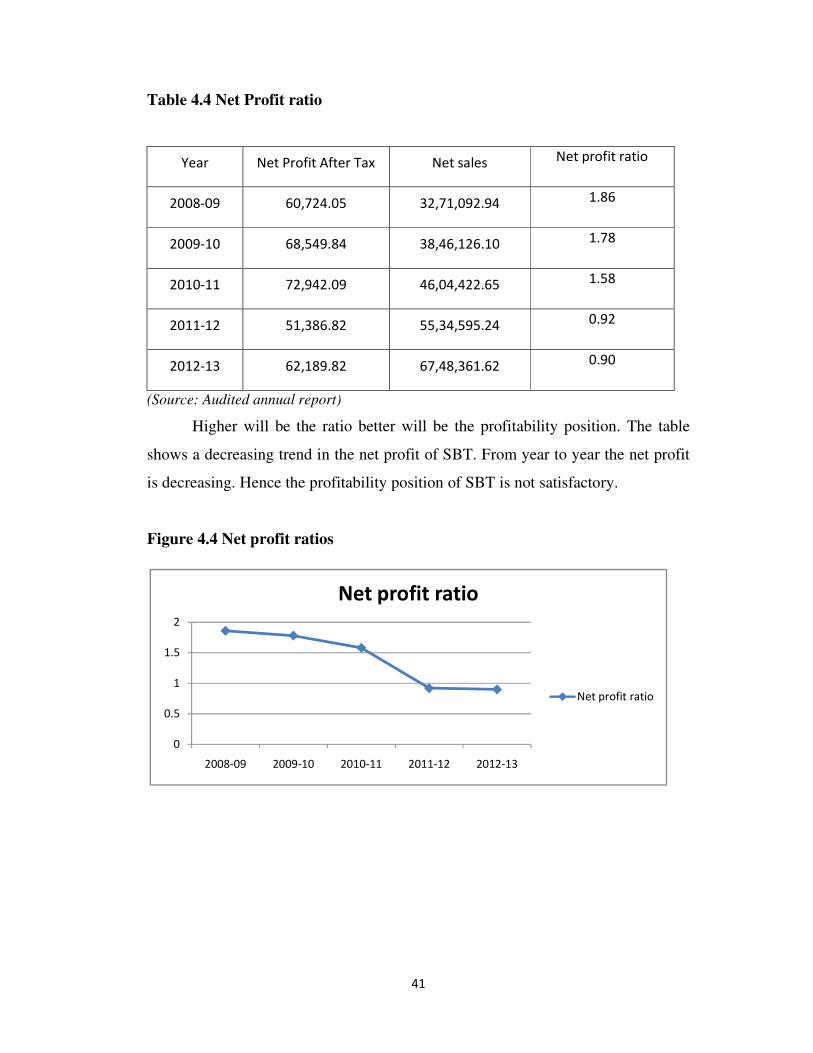
Table 4.4 Net Profit ratio
Year Net Profit After Tax Net sales Net profit ratio
2008-09 60,724.05 32,71,092.94 1.86
2009-10 68,549.84 38,46,126.10 1.78
2010-11 72,942.09 46,04,422.65 1.58
2011-12 51,386.82 55,34,595.24 0.92
2012-13 62,189.82 67,48,361.62 0.90
(Source: Audited annual report)
Higher will be the ratio better will be the profitability position. The table
shows a decreasing trend in the net profit of SBT. From year to year the net profit
is decreasing. Hence the profitability position of SBT is not satisfactory.
Figure 4.4 Net profit ratios
0
0.5
1
1.5
2
2008-09 2009-10 2010-11 2011-12 2012-13
Net profit ratio
Net profit ratio
42
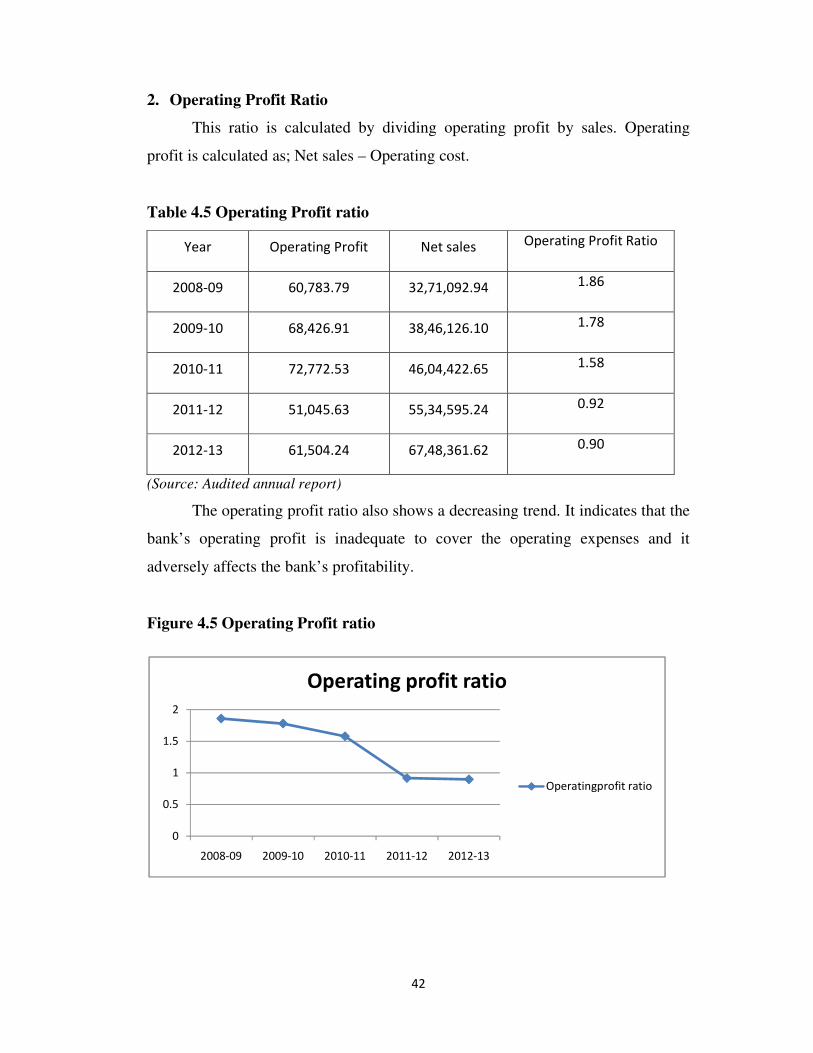
2. Operating Profit Ratio
This ratio is calculated by dividing operating profit by sales. Operating
profit is calculated as; Net sales – Operating cost.
Table 4.5 Operating Profit ratio
Year Operating Profit Net sales Operating Profit Ratio
2008-09 60,783.79 32,71,092.94 1.86
2009-10 68,426.91 38,46,126.10 1.78
2010-11 72,772.53 46,04,422.65 1.58
2011-12 51,045.63 55,34,595.24 0.92
2012-13 61,504.24 67,48,361.62 0.90
(Source: Audited annual report)
The operating profit ratio also shows a decreasing trend. It indicates that the
bank’s operating profit is inadequate to cover the operating expenses and it
adversely affects the bank’s profitability.
Figure 4.5 Operating Profit ratio
0
0.5
1
1.5
2
2008-09 2009-10 2010-11 2011-12 2012-13
Operating profit ratio
Operatingprofit ratio
43
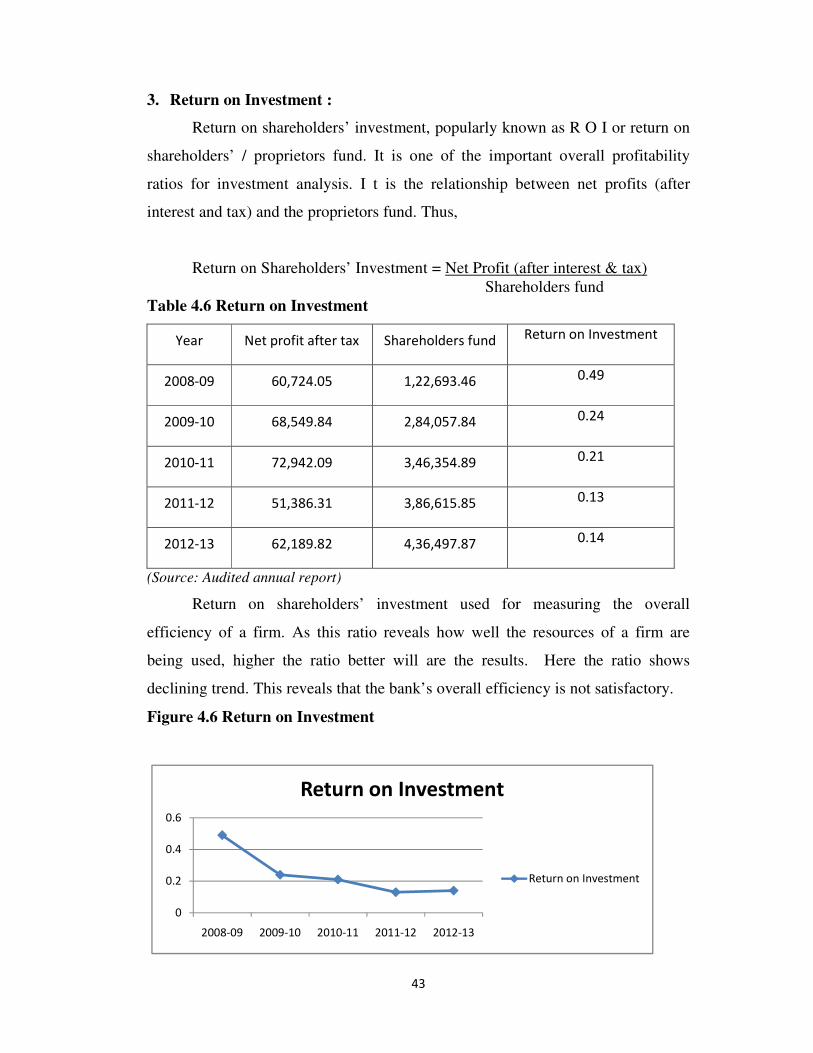
3. Return on Investment :
Return on shareholders’ investment, popularly known as R O I or return on
shareholders’ / proprietors fund. It is one of the important overall profitability
ratios for investment analysis. I t is the relationship between net profits (after
interest and tax) and the proprietors fund. Thus,
Return on Shareholders’ Investment = Net Profit (after interest & tax)
Shareholders fund
Table 4.6 Return on Investment
Year Net profit after tax Shareholders fund Return on Investment
2008-09 60,724.05 1,22,693.46 0.49
2009-10 68,549.84 2,84,057.84 0.24
2010-11 72,942.09 3,46,354.89 0.21
2011-12 51,386.31 3,86,615.85 0.13
2012-13 62,189.82 4,36,497.87 0.14
(Source: Audited annual report)
Return on shareholders’ investment used for measuring the overall
efficiency of a firm. As this ratio reveals how well the resources of a firm are
being used, higher the ratio better will are the results. Here the ratio shows
declining trend. This reveals that the bank’s overall efficiency is not satisfactory.
Figure 4.6 Return on Investment
0
0.2
0.4
0.6
2008-09 2009-10 2010-11 2011-12 2012-13
Return on Investment
Return on Investment
44
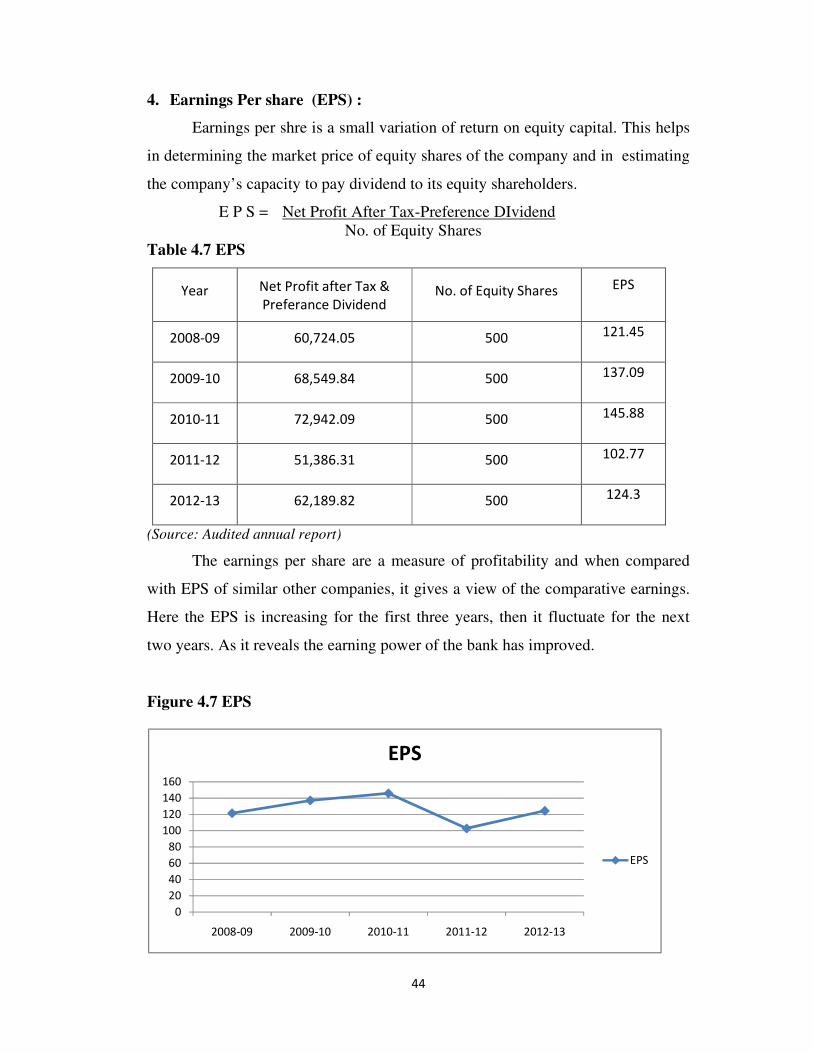
4. Earnings Per share (EPS) :
Earnings per shre is a small variation of return on equity capital. This helps
in determining the market price of equity shares of the company and in estimating
the company’s capacity to pay dividend to its equity shareholders.
E P S = Net Profit After Tax-Preference DIvidend
No. of Equity Shares
Table 4.7 EPS
Year Net Profit after Tax &
Preferance Dividend No. of Equity Shares EPS
2008-09 60,724.05 500 121.45
2009-10 68,549.84 500 137.09
2010-11 72,942.09 500 145.88
2011-12 51,386.31 500 102.77
2012-13 62,189.82 500 124.3
(Source: Audited annual report)
The earnings per share are a measure of profitability and when compared
with EPS of similar other companies, it gives a view of the comparative earnings.
Here the EPS is increasing for the first three years, then it fluctuate for the next
two years. As it reveals the earning power of the bank has improved.
Figure 4.7 EPS
0
20
40
60
80
100
120
140
160
2008-09 2009-10 2010-11 2011-12 2012-13
EPS
EPS
45
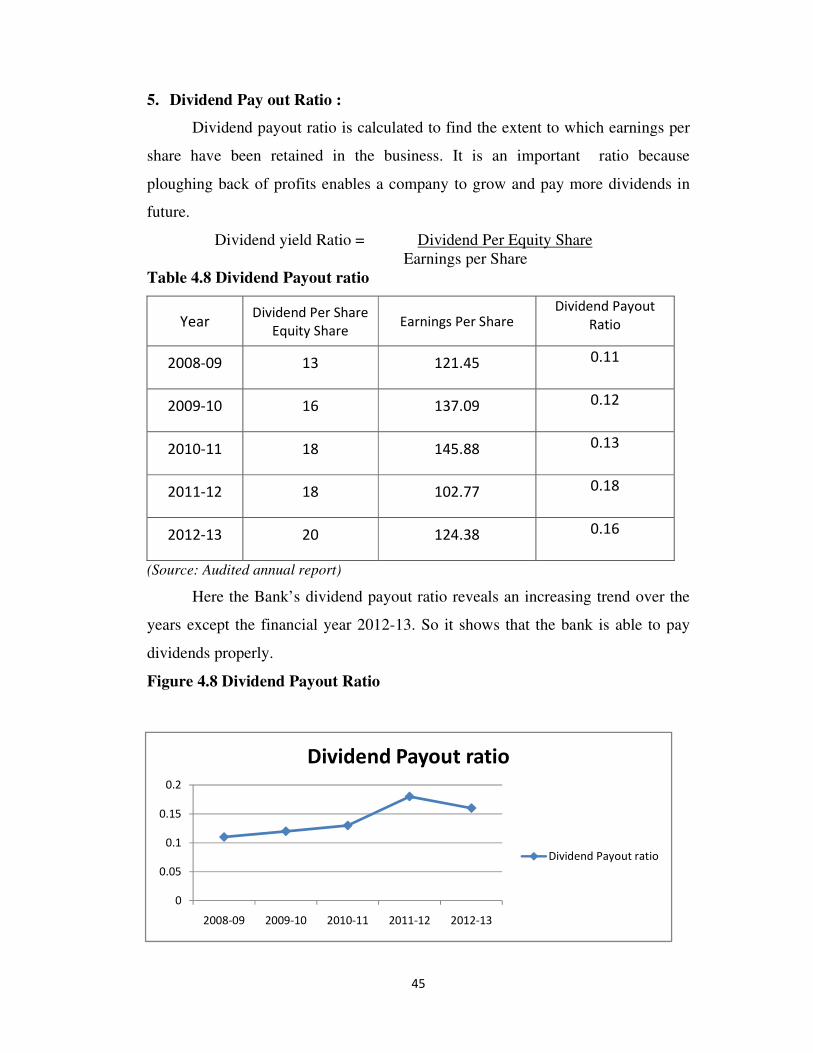
5. Dividend Pay out Ratio :
Dividend payout ratio is calculated to find the extent to which earnings per
share have been retained in the business. It is an important ratio because
ploughing back of profits enables a company to grow and pay more dividends in
future.
Dividend yield Ratio = Dividend Per Equity Share
Earnings per Share
Table 4.8 Dividend Payout ratio
Year Dividend Per Share
Equity Share Earnings Per Share
Dividend Payout
Ratio
2008-09 13 121.45 0.11
2009-10 16 137.09 0.12
2010-11 18 145.88 0.13
2011-12 18 102.77 0.18
2012-13 20 124.38 0.16
(Source: Audited annual report)
Here the Bank’s dividend payout ratio reveals an increasing trend over the
years except the financial year 2012-13. So it shows that the bank is able to pay
dividends properly.
Figure 4.8 Dividend Payout Ratio
0
0.05
0.1
0.15
0.2
2008-09 2009-10 2010-11 2011-12 2012-13
Dividend Payout ratio
Dividend Payout ratio
46
III. Efficiency or Assets Management ratios :
Activity ratios measure the efficiency or effectiveness with which a firm
manages its resources or assets. These ratios are also called Turn over ratios
because they indicate the speed with which assets are converted or turned over into
sales. It is important to calculate the turn over or efficiency ratios to comment
upon the liquidity or the efficiency with which the liquid resources are being used
by a firm.
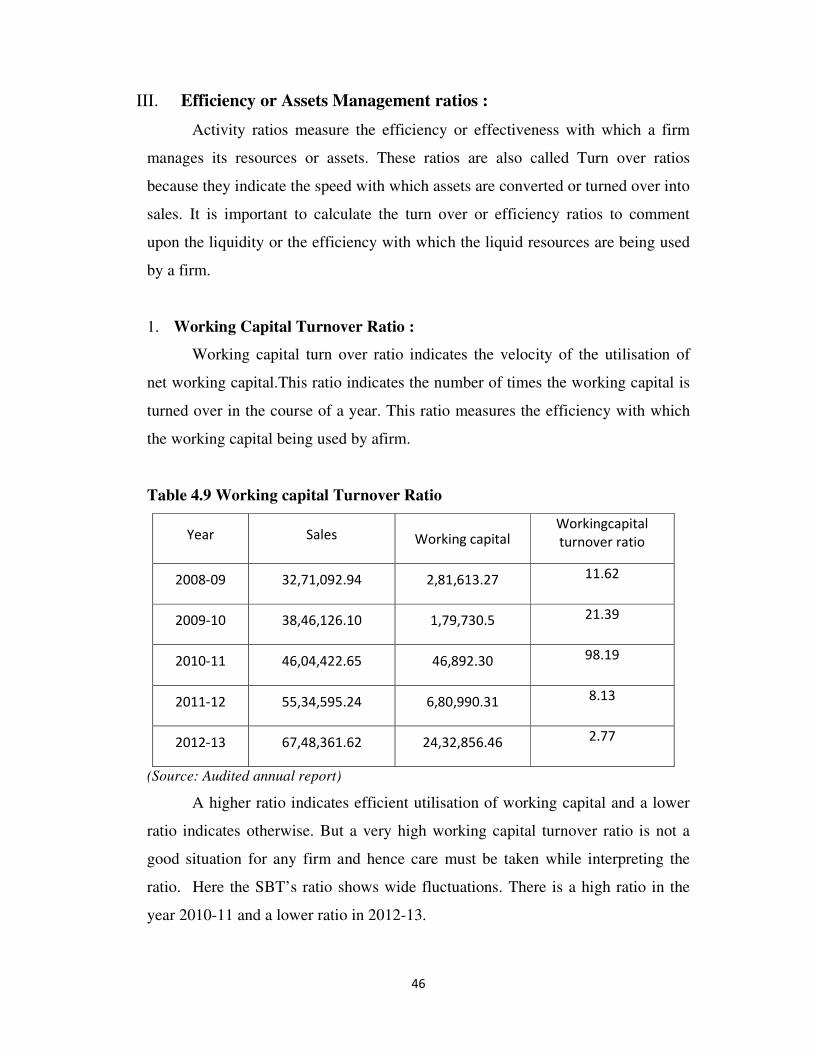
1. Working Capital Turnover Ratio :
Working capital turn over ratio indicates the velocity of the utilisation of
net working capital.This ratio indicates the number of times the working capital is
turned over in the course of a year. This ratio measures the efficiency with which
the working capital being used by afirm.
Table 4.9 Working capital Turnover Ratio
Year Sales Working capital Workingcapital
turnover ratio
2008-09 32,71,092.94 2,81,613.27 11.62
2009-10 38,46,126.10 1,79,730.5 21.39
2010-11 46,04,422.65 46,892.30 98.19
2011-12 55,34,595.24 6,80,990.31 8.13
2012-13 67,48,361.62 24,32,856.46 2.77
(Source: Audited annual report)
A higher ratio indicates efficient utilisation of working capital and a lower
ratio indicates otherwise. But a very high working capital turnover ratio is not a
good situation for any firm and hence care must be taken while interpreting the
ratio. Here the SBT’s ratio shows wide fluctuations. There is a high ratio in the
year 2010-11 and a lower ratio in 2012-13.
47
Figure 4.9 Working Capital Turnover ratios
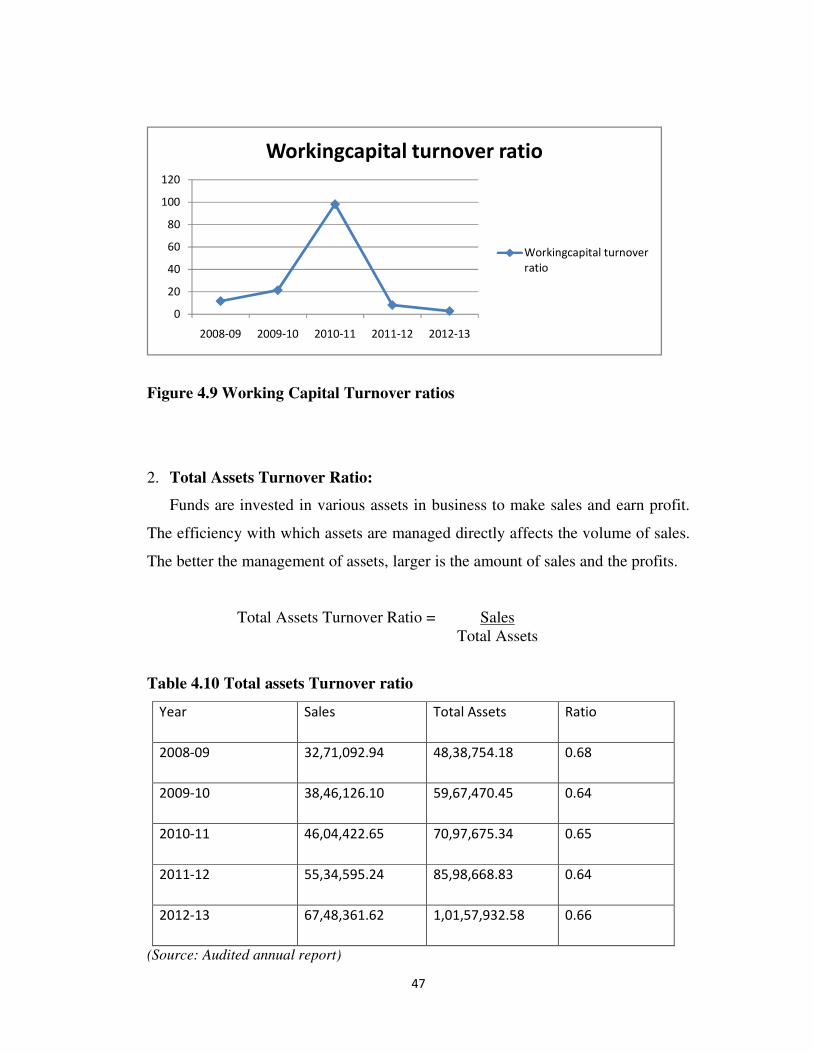
2. Total Assets Turnover Ratio:
Funds are invested in various assets in business to make sales and earn profit.
The efficiency with which assets are managed directly affects the volume of sales.
The better the management of assets, larger is the amount of sales and the profits.
Total Assets Turnover Ratio = Sales
Total Assets
Table 4.10 Total assets Turnover ratio
Year Sales Total Assets Ratio
2008-09 32,71,092.94 48,38,754.18 0.68
2009-10 38,46,126.10 59,67,470.45 0.64
2010-11 46,04,422.65 70,97,675.34 0.65
2011-12 55,34,595.24 85,98,668.83 0.64
2012-13 67,48,361.62 1,01,57,932.58 0.66
(Source: Audited annual report)
0
20
40
60
80
100
120
2008-09 2009-10 2010-11 2011-12 2012-13
Workingcapital turnover ratio
Workingcapital turnover
ratio
48
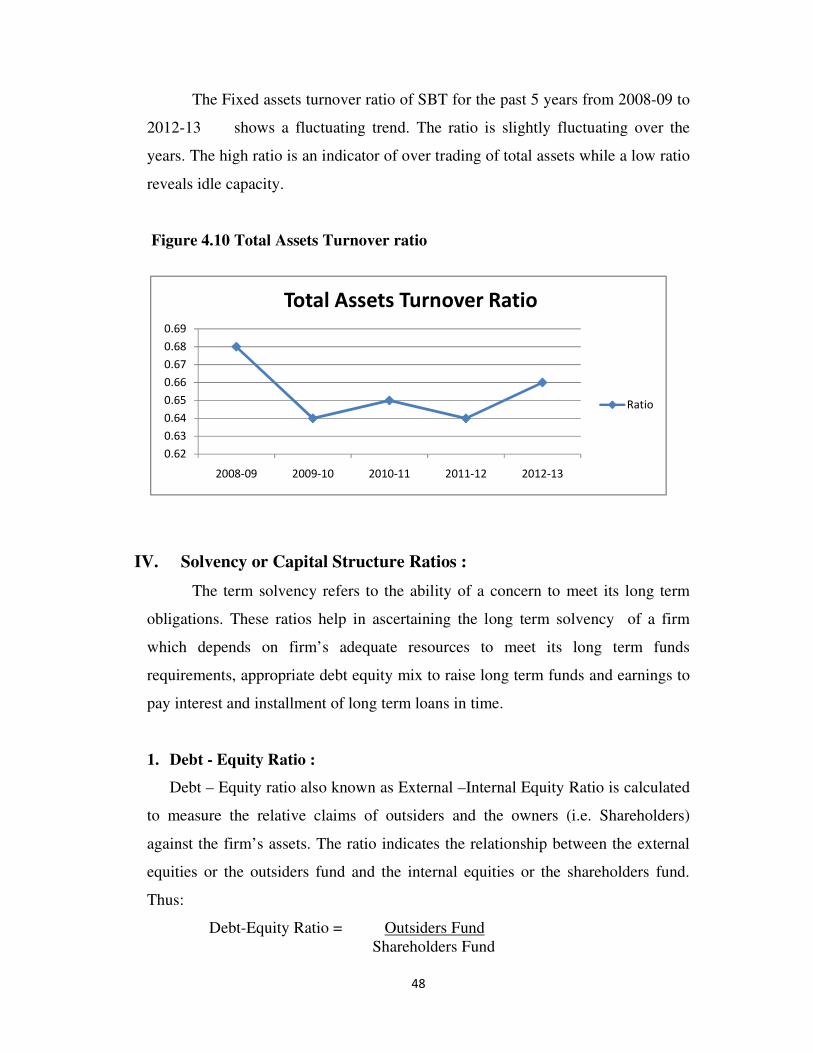
The Fixed assets turnover ratio of SBT for the past 5 years from 2008-09 to
2012-13 shows a fluctuating trend. The ratio is slightly fluctuating over the
years. The high ratio is an indicator of over trading of total assets while a low ratio
reveals idle capacity.
Figure 4.10 Total Assets Turnover ratio
IV. Solvency or Capital Structure Ratios :
The term solvency refers to the ability of a concern to meet its long term
obligations. These ratios help in ascertaining the long term solvency of a firm
which depends on firm’s adequate resources to meet its long term funds
requirements, appropriate debt equity mix to raise long term funds and earnings to
pay interest and installment of long term loans in time.
1. Debt - Equity Ratio :
Debt – Equity ratio also known as External –Internal Equity Ratio is calculated
to measure the relative claims of outsiders and the owners (i.e. Shareholders)
against the firm’s assets. The ratio indicates the relationship between the external
equities or the outsiders fund and the internal equities or the shareholders fund.
Thus:
Debt-Equity Ratio = Outsiders Fund
Shareholders Fund
0.62
0.63
0.64
0.65
0.66
0.67
0.68
0.69
2008-09 2009-10 2010-11 2011-12 2012-13
Total Assets Turnover Ratio
Ratio
49
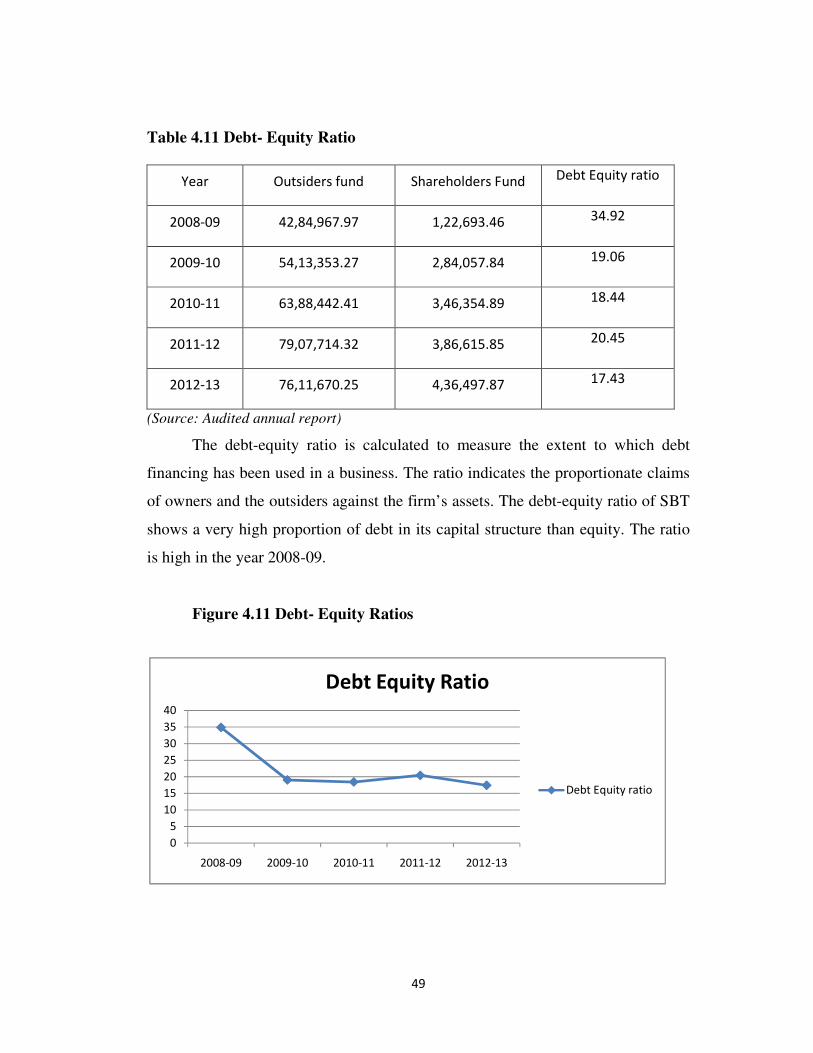
Table 4.11 Debt- Equity Ratio
Year Outsiders fund Shareholders Fund Debt Equity ratio
2008-09 42,84,967.97 1,22,693.46 34.92
2009-10 54,13,353.27 2,84,057.84 19.06
2010-11 63,88,442.41 3,46,354.89 18.44
2011-12 79,07,714.32 3,86,615.85 20.45
2012-13 76,11,670.25 4,36,497.87 17.43
(Source: Audited annual report)
The debt-equity ratio is calculated to measure the extent to which debt
financing has been used in a business. The ratio indicates the proportionate claims
of owners and the outsiders against the firm’s assets. The debt-equity ratio of SBT
shows a very high proportion of debt in its capital structure than equity. The ratio
is high in the year 2008-09.
Figure 4.11 Debt- Equity Ratios
0
5
10
15
20
25
30
35
40
2008-09 2009-10 2010-11 2011-12 2012-13
Debt Equity Ratio
Debt Equity ratio
50
2. Equity Ratio :
A varient to the debt-equity ratio is the Equity ratio Which is also known as
Propritory ratio or Networth to Total assets ratio. This ratio establishes the
relationship between Shareholders funds to total assets of the firm.The ratio of
propritors funds to total funds is an important ratio for determining long term
solvency of the firm.
Equity Ratio = Shareholders Funds
Total Assets
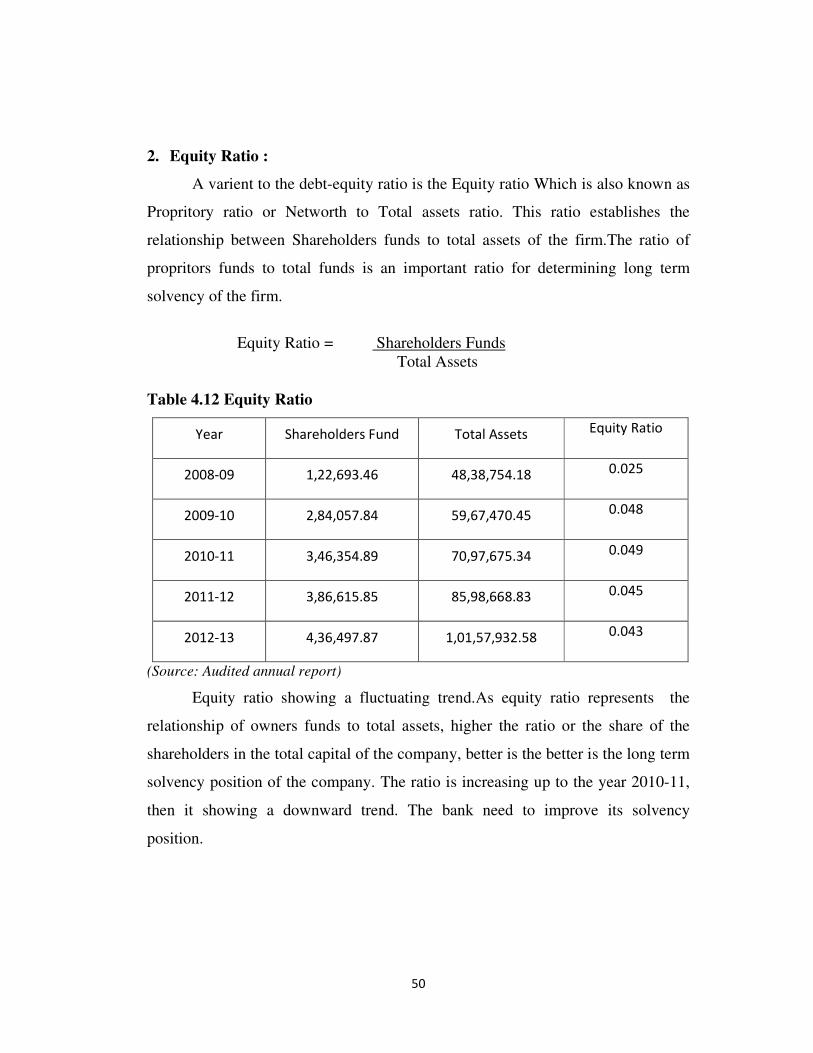
Table 4.12 Equity Ratio
Year Shareholders Fund Total Assets Equity Ratio
2008-09 1,22,693.46 48,38,754.18 0.025
2009-10 2,84,057.84 59,67,470.45 0.048
2010-11 3,46,354.89 70,97,675.34 0.049
2011-12 3,86,615.85 85,98,668.83 0.045
2012-13 4,36,497.87 1,01,57,932.58 0.043
(Source: Audited annual report)
Equity ratio showing a fluctuating trend.As equity ratio represents the
relationship of owners funds to total assets, higher the ratio or the share of the
shareholders in the total capital of the company, better is the better is the long term
solvency position of the company. The ratio is increasing up to the year 2010-11,
then it showing a downward trend. The bank need to improve its solvency
position.
51
Figure 4.12 Equity ratio
3. Solvency Ratio :
Solvency ratio otherwise called as The ratio of total liabilities to total
assets.This ratio is small varient of equity ratio. It indicates the relationship
between the total liabilities to outsiders to total assets of a firm.
Solvency Ratio = Total Liabilities to outsiders
Total Assets
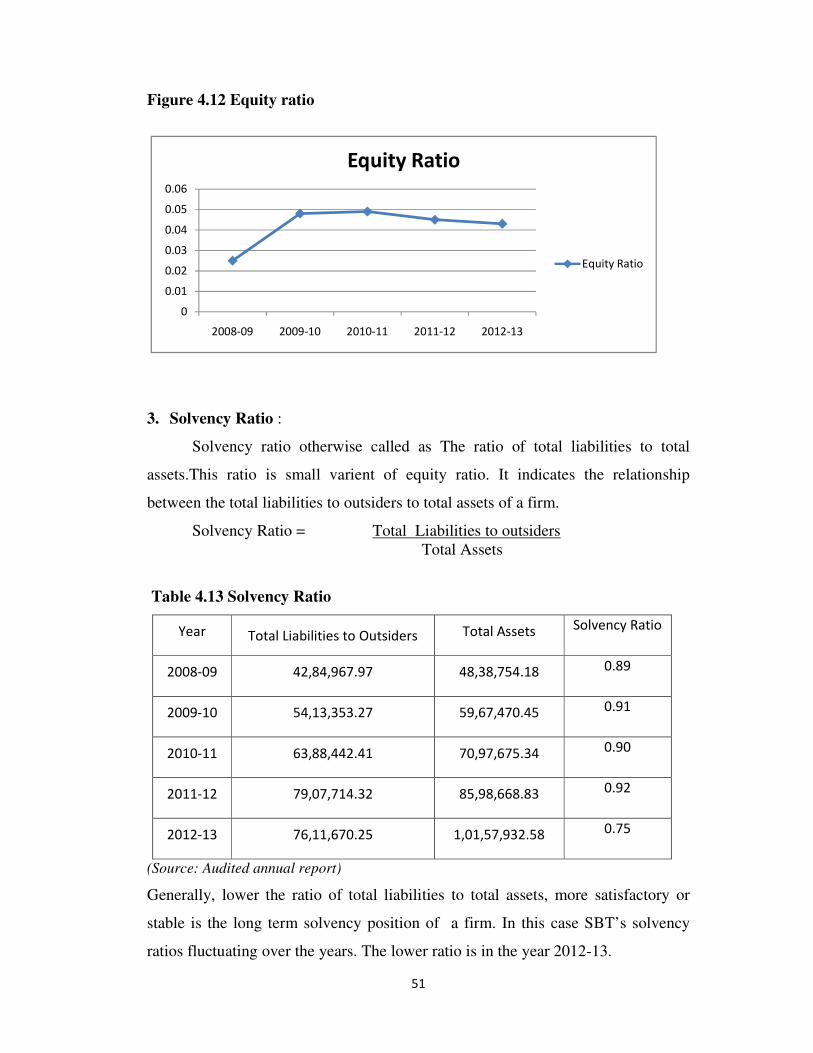
Table 4.13 Solvency Ratio
Year Total Liabilities to Outsiders Total Assets Solvency Ratio
2008-09 42,84,967.97 48,38,754.18 0.89
2009-10 54,13,353.27 59,67,470.45 0.91
2010-11 63,88,442.41 70,97,675.34 0.90
2011-12 79,07,714.32 85,98,668.83 0.92
2012-13 76,11,670.25 1,01,57,932.58 0.75
(Source: Audited annual report)
Generally, lower the ratio of total liabilities to total assets, more satisfactory or
stable is the long term solvency position of a firm. In this case SBT’s solvency
ratios fluctuating over the years. The lower ratio is in the year 2012-13.
0
0.01
0.02
0.03
0.04
0.05
0.06
2008-09 2009-10 2010-11 2011-12 2012-13
Equity Ratio
Equity Ratio
52
Figure 4.13 Solvency ratio
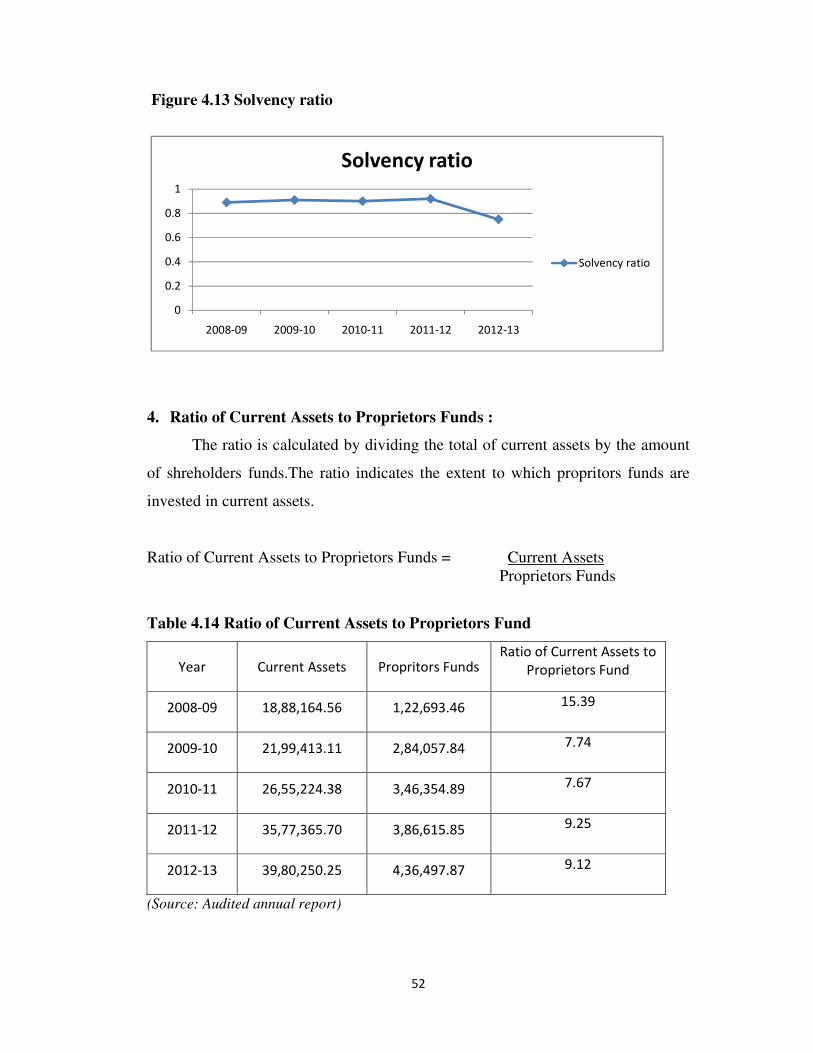
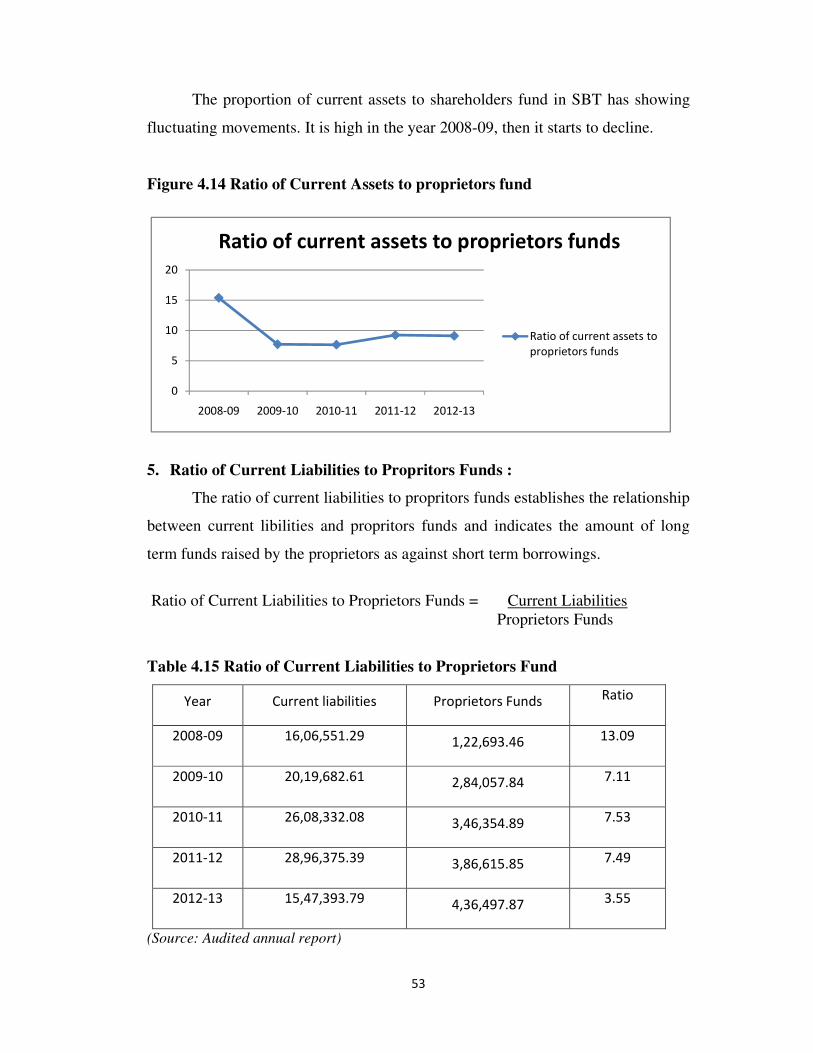
4. Ratio of Current Assets to Proprietors Funds :
The ratio is calculated by dividing the total of current assets by the amount
of shreholders funds.The ratio indicates the extent to which propritors funds are
invested in current assets.
Ratio of Current Assets to Proprietors Funds = Current Assets
Proprietors Funds
Table 4.14 Ratio of Current Assets to Proprietors Fund
Year Current Assets Propritors Funds Ratio of Current Assets to
Proprietors Fund
2008-09 18,88,164.56 1,22,693.46 15.39
2009-10 21,99,413.11 2,84,057.84 7.74
2010-11 26,55,224.38 3,46,354.89 7.67
2011-12 35,77,365.70 3,86,615.85 9.25
2012-13 39,80,250.25 4,36,497.87 9.12
(Source: Audited annual report)
0
0.2
0.4
0.6
0.8
1
2008-09 2009-10 2010-11 2011-12 2012-13
Solvency ratio
Solvency ratio
53
The proportion of current assets to shareholders fund in SBT has showing
fluctuating movements. It is high in the year 2008-09, then it starts to decline.
Figure 4.14 Ratio of Current Assets to proprietors fund
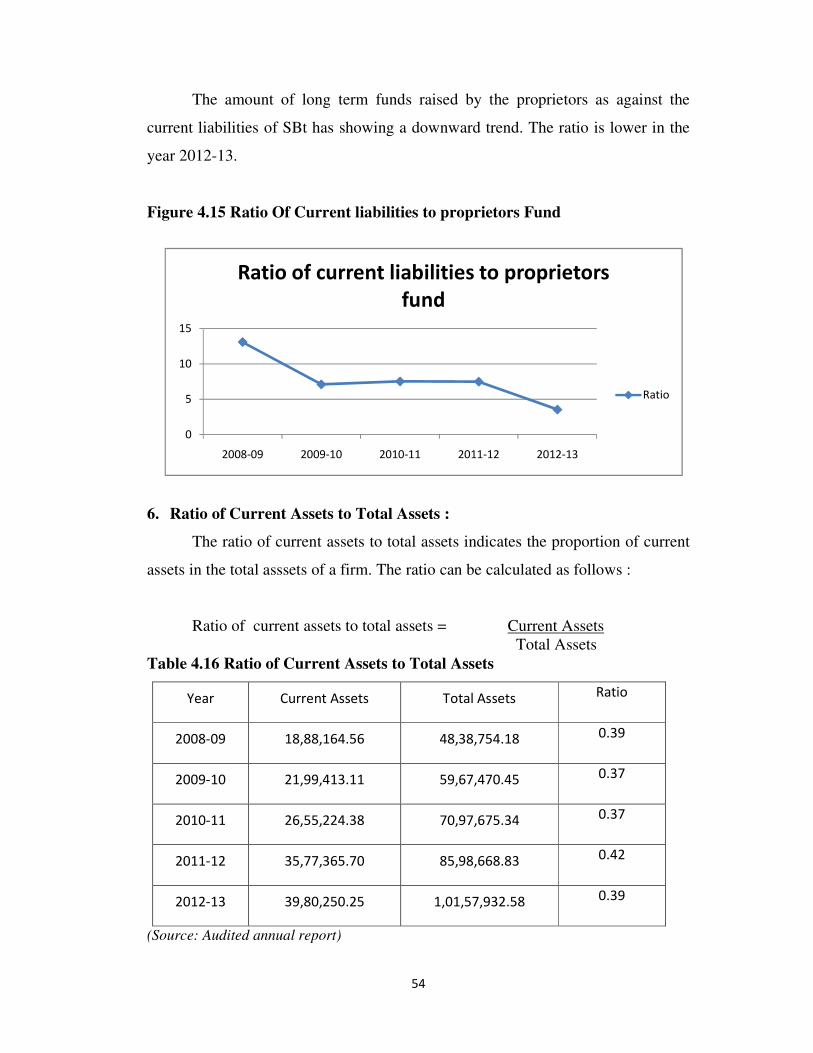
5. Ratio of Current Liabilities to Propritors Funds :
The ratio of current liabilities to propritors funds establishes the relationship
between current libilities and propritors funds and indicates the amount of long
term funds raised by the proprietors as against short term borrowings.
Ratio of Current Liabilities to Proprietors Funds = Current Liabilities
Proprietors Funds
Table 4.15 Ratio of Current Liabilities to Proprietors Fund
Year Current liabilities Proprietors Funds Ratio
2008-09 16,06,551.29 1,22,693.46 13.09
2009-10 20,19,682.61 2,84,057.84 7.11
2010-11 26,08,332.08 3,46,354.89 7.53
2011-12 28,96,375.39 3,86,615.85 7.49
2012-13 15,47,393.79 4,36,497.87 3.55
(Source: Audited annual report)
0
5
10
15
20
2008-09 2009-10 2010-11 2011-12 2012-13
Ratio of current assets to proprietors funds
Ratio of current assets to
proprietors funds
54
The amount of long term funds raised by the proprietors as against the
current liabilities of SBt has showing a downward trend. The ratio is lower in the
year 2012-13.
Figure 4.15 Ratio Of Current liabilities to proprietors Fund
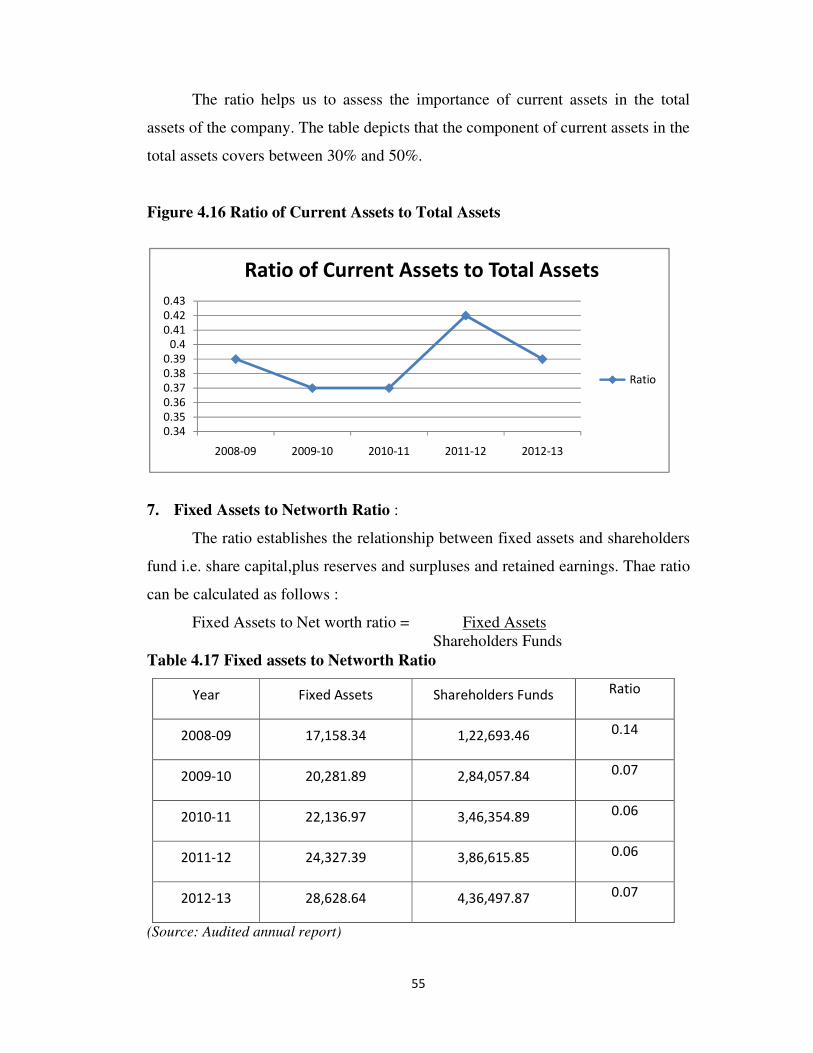
6. Ratio of Current Assets to Total Assets :
The ratio of current assets to total assets indicates the proportion of current
assets in the total asssets of a firm. The ratio can be calculated as follows :
Ratio of current assets to total assets = Current Assets
Total Assets
Table 4.16 Ratio of Current Assets to Total Assets
Year Current Assets Total Assets Ratio
2008-09 18,88,164.56 48,38,754.18 0.39
2009-10 21,99,413.11 59,67,470.45 0.37
2010-11 26,55,224.38 70,97,675.34 0.37
2011-12 35,77,365.70 85,98,668.83 0.42
2012-13 39,80,250.25 1,01,57,932.58 0.39
(Source: Audited annual report)
0
5
10
15
2008-09 2009-10 2010-11 2011-12 2012-13
Ratio of current liabilities to proprietors
fund
Ratio
55
The ratio helps us to assess the importance of current assets in the total
assets of the company. The table depicts that the component of current assets in the
total assets covers between 30% and 50%.
Figure 4.16 Ratio of Current Assets to Total Assets
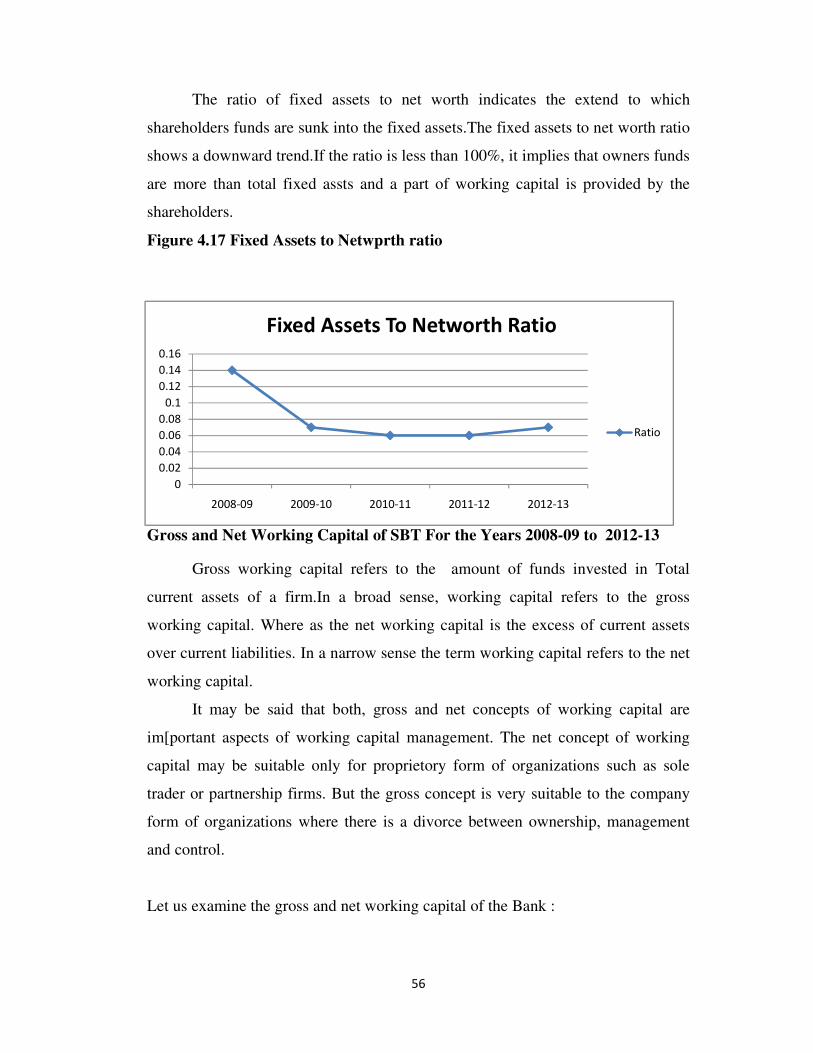
7. Fixed Assets to Networth Ratio :
The ratio establishes the relationship between fixed assets and shareholders
fund i.e. share capital,plus reserves and surpluses and retained earnings. Thae ratio
can be calculated as follows :
Fixed Assets to Net worth ratio = Fixed Assets
Shareholders Funds
Table 4.17 Fixed assets to Networth Ratio
Year Fixed Assets Shareholders Funds Ratio
2008-09 17,158.34 1,22,693.46 0.14
2009-10 20,281.89 2,84,057.84 0.07
2010-11 22,136.97 3,46,354.89 0.06
2011-12 24,327.39 3,86,615.85 0.06
2012-13 28,628.64 4,36,497.87 0.07
(Source: Audited annual report)
0.34
0.35
0.36
0.37
0.38
0.39
0.4
0.41
0.42
0.43
2008-09 2009-10 2010-11 2011-12 2012-13
Ratio of Current Assets to Total Assets
Ratio
56
The ratio of fixed assets to net worth indicates the extend to which
shareholders funds are sunk into the fixed assets.The fixed assets to net worth ratio
shows a downward trend.If the ratio is less than 100%, it implies that owners funds
are more than total fixed assts and a part of working capital is provided by the
shareholders.
Figure 4.17 Fixed Assets to Netwprth ratio
Gross and Net Working Capital of SBT For the Years 2008-09 to 2012-13
Gross working capital refers to the amount of funds invested in Total
current assets of a firm.In a broad sense, working capital refers to the gross
working capital. Where as the net working capital is the excess of current assets
over current liabilities. In a narrow sense the term working capital refers to the net
working capital.
It may be said that both, gross and net concepts of working capital are
im[portant aspects of working capital management. The net concept of working
capital may be suitable only for proprietory form of organizations such as sole
trader or partnership firms. But the gross concept is very suitable to the company
form of organizations where there is a divorce between ownership, management
and control.
Let us examine the gross and net working capital of the Bank :
0
0.02
0.04
0.06
0.08
0.1
0.12
0.14
0.16
2008-09 2009-10 2010-11 2011-12 2012-13
Fixed Assets To Networth Ratio
Ratio
57
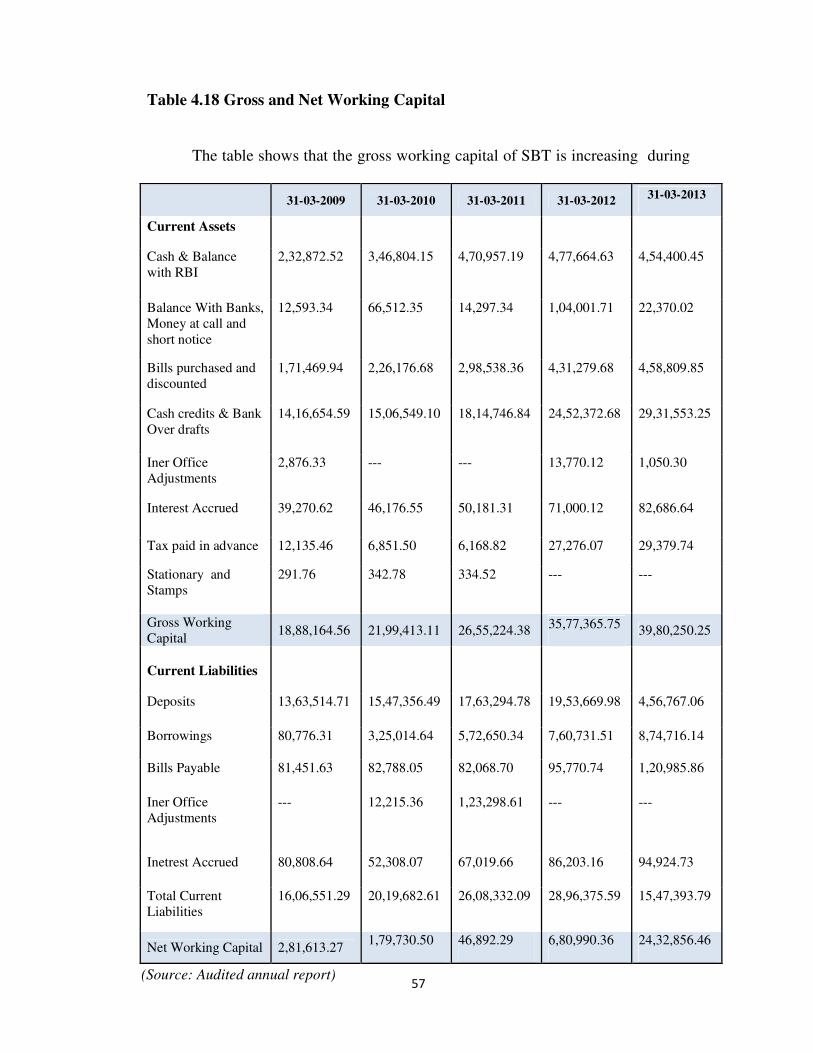
Table 4.18 Gross and Net Working Capital
The table shows that the gross working capital of SBT is increasing during
31-03-2009 31-03-2010 31-03-2011 31-03-2012
31-03-2013
Current Assets
Cash & Balance
with RBI
2,32,872.52 3,46,804.15 4,70,957.19 4,77,664.63 4,54,400.45
Balance With Banks,
Money at call and
short notice
12,593.34 66,512.35 14,297.34 1,04,001.71 22,370.02
Bills purchased and
discounted
1,71,469.94 2,26,176.68 2,98,538.36 4,31,279.68 4,58,809.85
Cash credits & Bank
Over drafts
14,16,654.59 15,06,549.10 18,14,746.84 24,52,372.68 29,31,553.25
Iner Office
Adjustments
2,876.33 --- --- 13,770.12 1,050.30
Interest Accrued 39,270.62 46,176.55 50,181.31 71,000.12 82,686.64
Tax paid in advance 12,135.46 6,851.50 6,168.82 27,276.07 29,379.74
Stationary and
Stamps
291.76 342.78 334.52 --- ---
Gross Working
Capital 18,88,164.56 21,99,413.11 26,55,224.38
35,77,365.75 39,80,250.25
Current Liabilities
Deposits 13,63,514.71 15,47,356.49 17,63,294.78 19,53,669.98 4,56,767.06
Borrowings 80,776.31 3,25,014.64 5,72,650.34 7,60,731.51 8,74,716.14
Bills Payable 81,451.63 82,788.05 82,068.70 95,770.74 1,20,985.86
Iner Office
Adjustments
--- 12,215.36 1,23,298.61 --- ---
Inetrest Accrued 80,808.64 52,308.07 67,019.66 86,203.16 94,924.73
Total Current
Liabilities
16,06,551.29 20,19,682.61 26,08,332.09 28,96,375.59 15,47,393.79
Net Working Capital 2,81,613.27 1,79,730.50 46,892.29 6,80,990.36 24,32,856.46
(Source: Audited annual report)
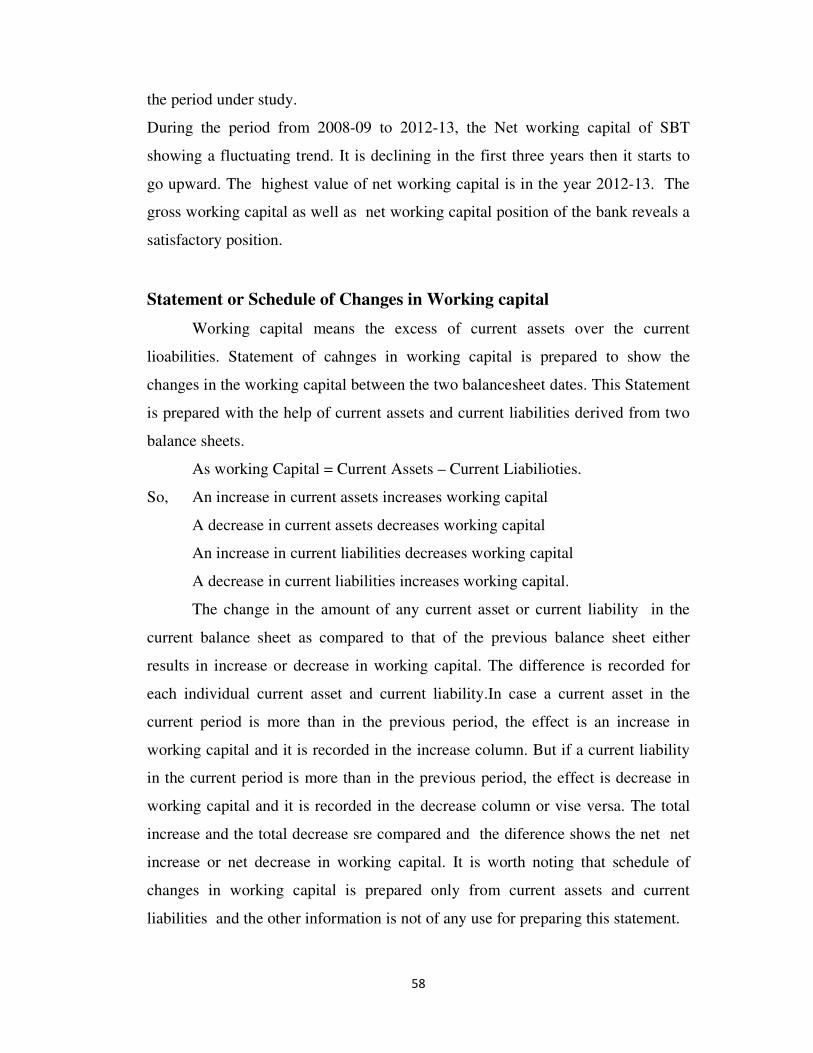
58
the period under study.
During the period from 2008-09 to 2012-13, the Net working capital of SBT
showing a fluctuating trend. It is declining in the first three years then it starts to
go upward. The highest value of net working capital is in the year 2012-13. The
gross working capital as well as net working capital position of the bank reveals a
satisfactory position.
Statement or Schedule of Changes in Working capital
Working capital means the excess of current assets over the current
lioabilities. Statement of cahnges in working capital is prepared to show the
changes in the working capital between the two balancesheet dates. This Statement
is prepared with the help of current assets and current liabilities derived from two
balance sheets.
As working Capital = Current Assets – Current Liabilioties.
So, An increase in current assets increases working capital
A decrease in current assets decreases working capital
An increase in current liabilities decreases working capital
A decrease in current liabilities increases working capital.
The change in the amount of any current asset or current liability in the
current balance sheet as compared to that of the previous balance sheet either
results in increase or decrease in working capital. The difference is recorded for
each individual current asset and current liability.In case a current asset in the
current period is more than in the previous period, the effect is an increase in
working capital and it is recorded in the increase column. But if a current liability
in the current period is more than in the previous period, the effect is decrease in
working capital and it is recorded in the decrease column or vise versa. The total
increase and the total decrease sre compared and the diference shows the net net
increase or net decrease in working capital. It is worth noting that schedule of
changes in working capital is prepared only from current assets and current
liabilities and the other information is not of any use for preparing this statement.
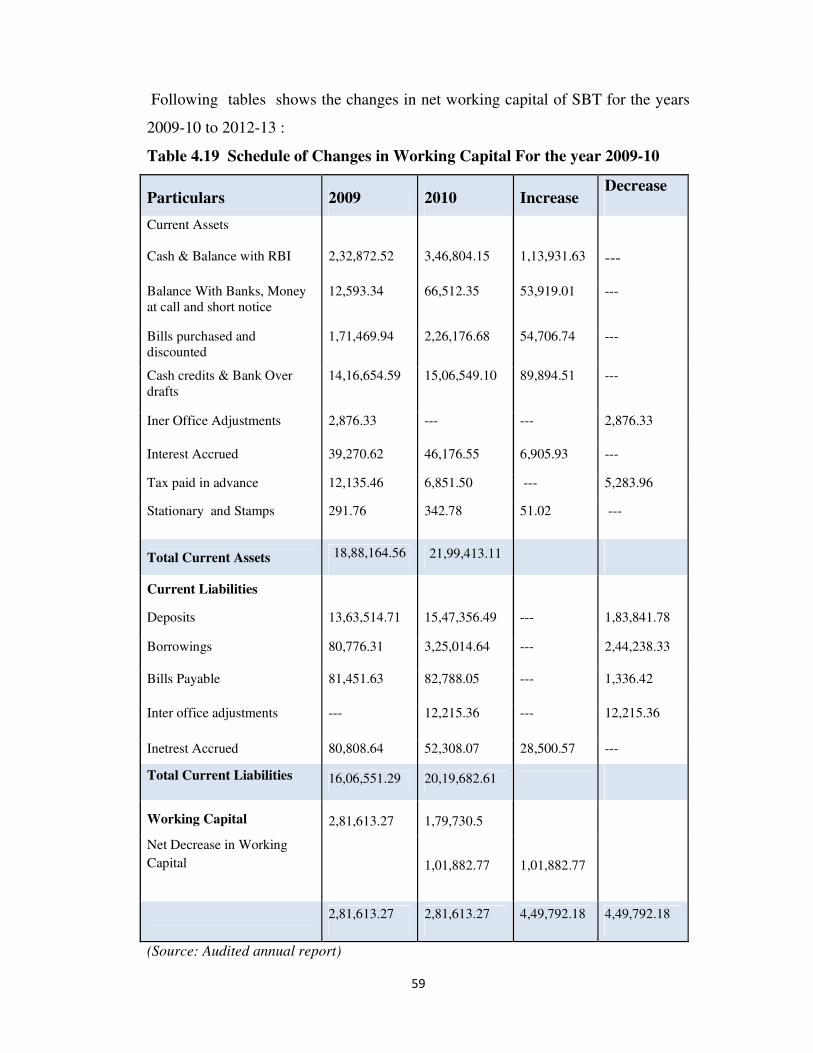
59
Following tables shows the changes in net working capital of SBT for the years
2009-10 to 2012-13 :
Table 4.19 Schedule of Changes in Working Capital For the year 2009-10
Particulars 2009 2010 Increase Decrease
Current Assets
Cash & Balance with RBI 2,32,872.52 3,46,804.15 1,13,931.63 ---
Balance With Banks, Money
at call and short notice
12,593.34 66,512.35 53,919.01 ---
Bills purchased and
discounted
1,71,469.94 2,26,176.68 54,706.74 ---
Cash credits & Bank Over
drafts
14,16,654.59 15,06,549.10 89,894.51 ---
Iner Office Adjustments 2,876.33 --- --- 2,876.33
Interest Accrued 39,270.62 46,176.55 6,905.93 ---
Tax paid in advance 12,135.46 6,851.50 --- 5,283.96
Stationary and Stamps 291.76 342.78 51.02 ---
Total Current Assets 18,88,164.56 21,99,413.11
Current Liabilities
Deposits 13,63,514.71 15,47,356.49 --- 1,83,841.78
Borrowings 80,776.31 3,25,014.64 --- 2,44,238.33
Bills Payable 81,451.63 82,788.05 --- 1,336.42
Inter office adjustments --- 12,215.36 --- 12,215.36
Inetrest Accrued 80,808.64 52,308.07 28,500.57 ---
Total Current Liabilities 16,06,551.29 20,19,682.61
Working Capital 2,81,613.27 1,79,730.5
Net Decrease in Working
Capital
1,01,882.77 1,01,882.77
2,81,613.27 2,81,613.27 4,49,792.18 4,49,792.18
(Source: Audited annual report)
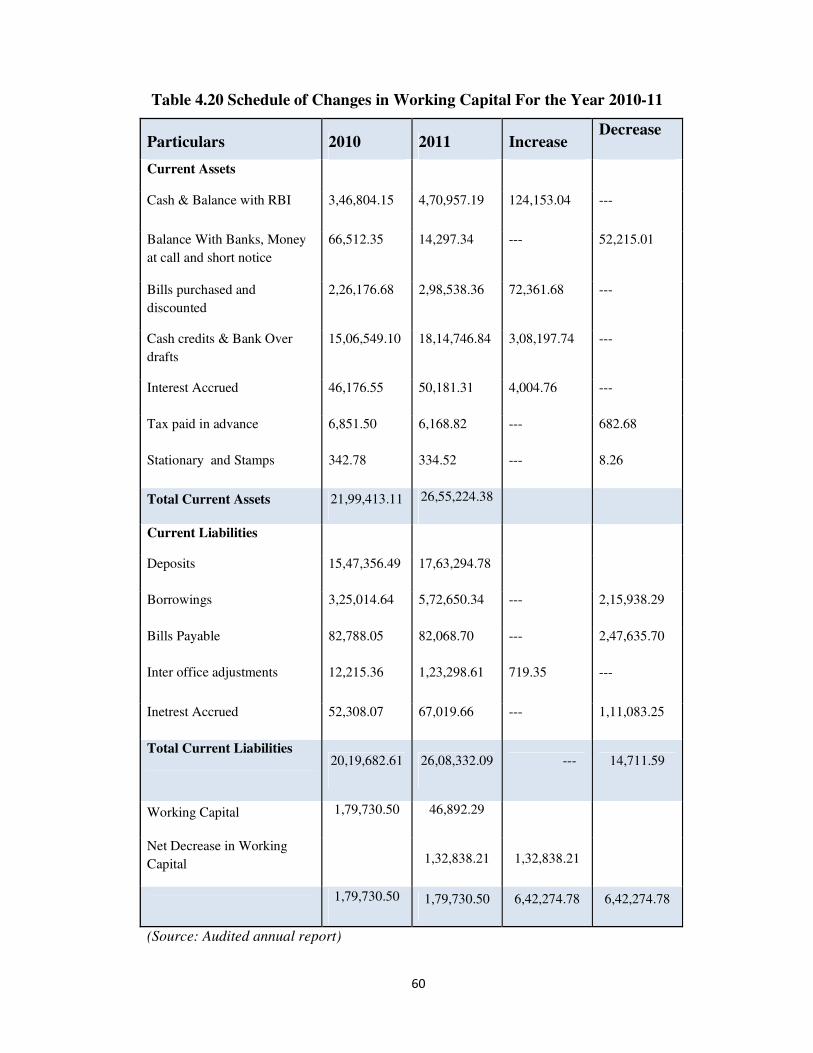
60
Table 4.20 Schedule of Changes in Working Capital For the Year 2010-11
Particulars 2010 2011 Increase Decrease
Current Assets
Cash & Balance with RBI 3,46,804.15 4,70,957.19 124,153.04 ---
Balance With Banks, Money
at call and short notice
66,512.35 14,297.34 --- 52,215.01
Bills purchased and
discounted
2,26,176.68 2,98,538.36 72,361.68 ---
Cash credits & Bank Over
drafts
15,06,549.10 18,14,746.84 3,08,197.74 ---
Interest Accrued 46,176.55 50,181.31 4,004.76 ---
Tax paid in advance 6,851.50 6,168.82 --- 682.68
Stationary and Stamps 342.78 334.52 --- 8.26
Total Current Assets 21,99,413.11 26,55,224.38
Current Liabilities
Deposits 15,47,356.49 17,63,294.78
Borrowings 3,25,014.64 5,72,650.34 --- 2,15,938.29
Bills Payable 82,788.05 82,068.70 --- 2,47,635.70
Inter office adjustments 12,215.36 1,23,298.61 719.35 ---
Inetrest Accrued 52,308.07 67,019.66 --- 1,11,083.25
Total Current Liabilities
20,19,682.61 26,08,332.09 --- 14,711.59
Working Capital 1,79,730.50 46,892.29
Net Decrease in Working
Capital 1,32,838.21 1,32,838.21
1,79,730.50 1,79,730.50 6,42,274.78 6,42,274.78
(Source: Audited annual report)
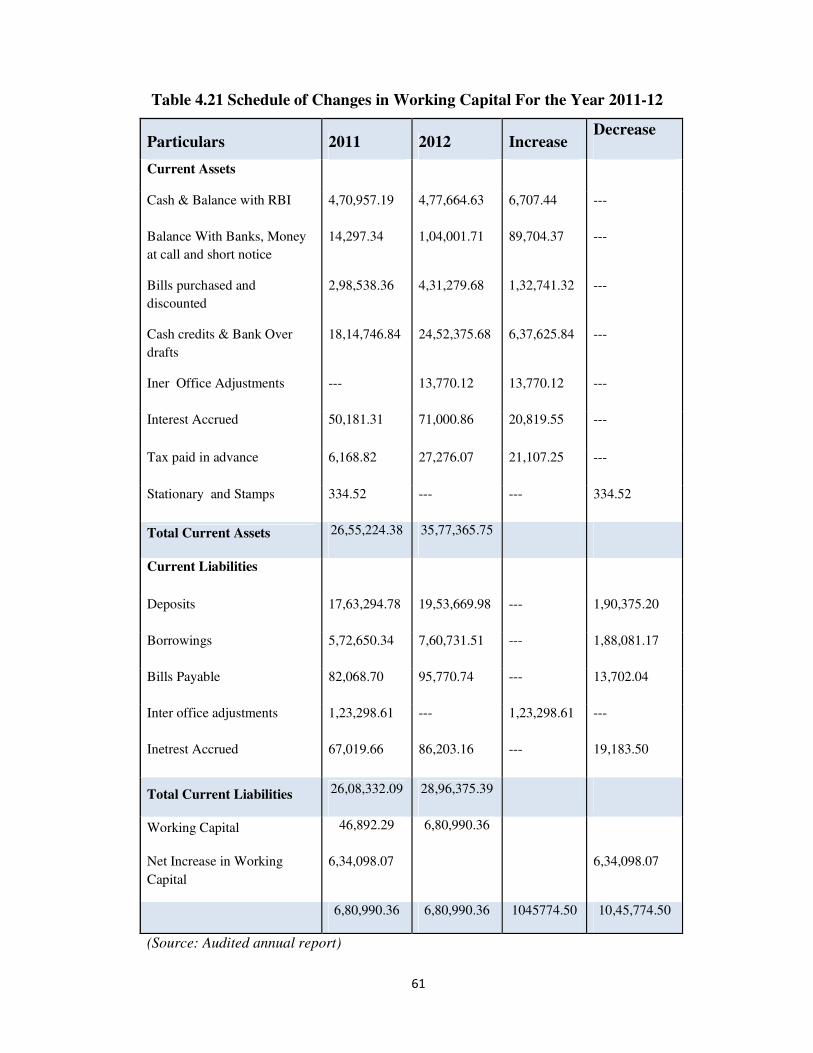
61
Table 4.21 Schedule of Changes in Working Capital For the Year 2011-12
Particulars 2011 2012 Increase Decrease
Current Assets
Cash & Balance with RBI 4,70,957.19 4,77,664.63 6,707.44 ---
Balance With Banks, Money
at call and short notice
14,297.34 1,04,001.71 89,704.37 ---
Bills purchased and
discounted
2,98,538.36 4,31,279.68 1,32,741.32 ---
Cash credits & Bank Over
drafts
18,14,746.84 24,52,375.68 6,37,625.84 ---
Iner Office Adjustments --- 13,770.12 13,770.12 ---
Interest Accrued 50,181.31 71,000.86 20,819.55 ---
Tax paid in advance 6,168.82 27,276.07 21,107.25 ---
Stationary and Stamps 334.52 --- --- 334.52
Total Current Assets 26,55,224.38 35,77,365.75
Current Liabilities
Deposits 17,63,294.78 19,53,669.98 --- 1,90,375.20
Borrowings 5,72,650.34 7,60,731.51 --- 1,88,081.17
Bills Payable 82,068.70 95,770.74 --- 13,702.04
Inter office adjustments 1,23,298.61 --- 1,23,298.61 ---
Inetrest Accrued 67,019.66 86,203.16 --- 19,183.50
Total Current Liabilities 26,08,332.09 28,96,375.39
Working Capital 46,892.29 6,80,990.36
Net Increase in Working
Capital
6,34,098.07 6,34,098.07
6,80,990.36 6,80,990.36 1045774.50 10,45,774.50
(Source: Audited annual report)
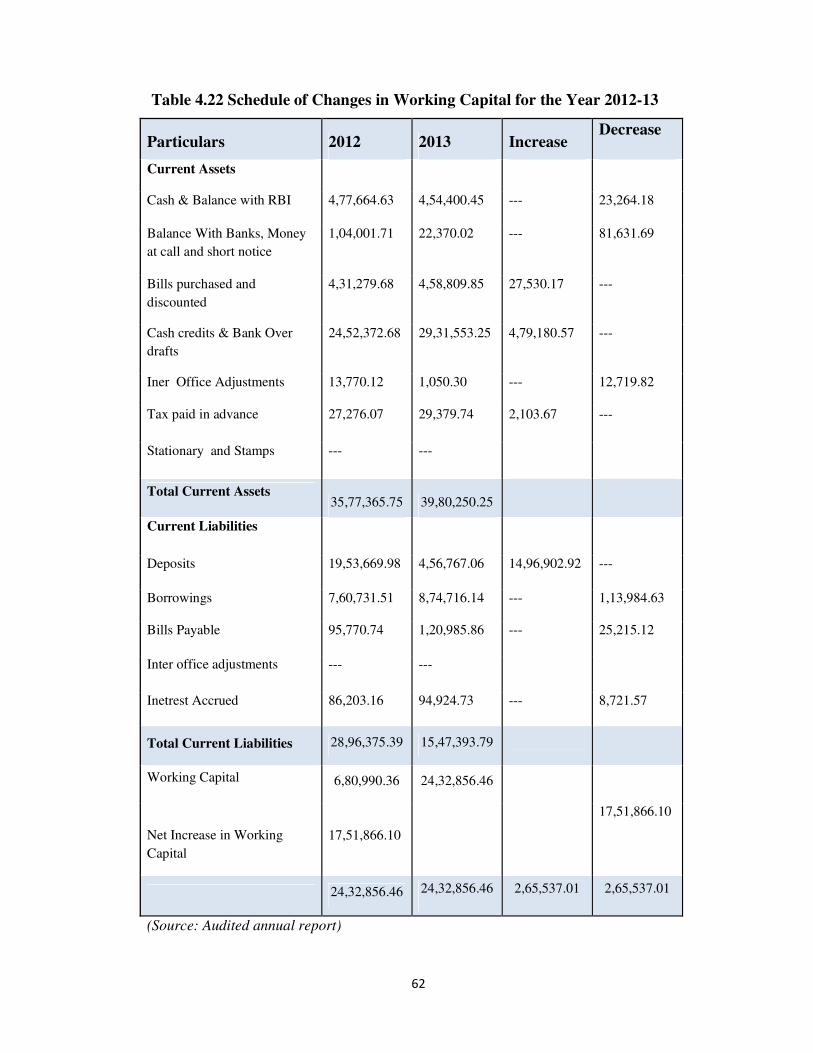
62
Table 4.22 Schedule of Changes in Working Capital for the Year 2012-13
Particulars 2012 2013 Increase Decrease
Current Assets
Cash & Balance with RBI 4,77,664.63 4,54,400.45 --- 23,264.18
Balance With Banks, Money
at call and short notice
1,04,001.71 22,370.02 --- 81,631.69
Bills purchased and
discounted
4,31,279.68 4,58,809.85 27,530.17 ---
Cash credits & Bank Over
drafts
24,52,372.68 29,31,553.25 4,79,180.57 ---
Iner Office Adjustments 13,770.12 1,050.30 --- 12,719.82
Tax paid in advance 27,276.07 29,379.74 2,103.67 ---
Stationary and Stamps --- ---
Total Current Assets 35,77,365.75 39,80,250.25
Current Liabilities
Deposits 19,53,669.98 4,56,767.06 14,96,902.92 ---
Borrowings 7,60,731.51 8,74,716.14 --- 1,13,984.63
Bills Payable 95,770.74 1,20,985.86 --- 25,215.12
Inter office adjustments --- ---
Inetrest Accrued 86,203.16 94,924.73 --- 8,721.57
Total Current Liabilities 28,96,375.39 15,47,393.79
Working Capital 6,80,990.36 24,32,856.46
Net Increase in Working
Capital
17,51,866.10
17,51,866.10
24,32,856.46 24,32,856.46 2,65,537.01 2,65,537.01
(Source: Audited annual report)
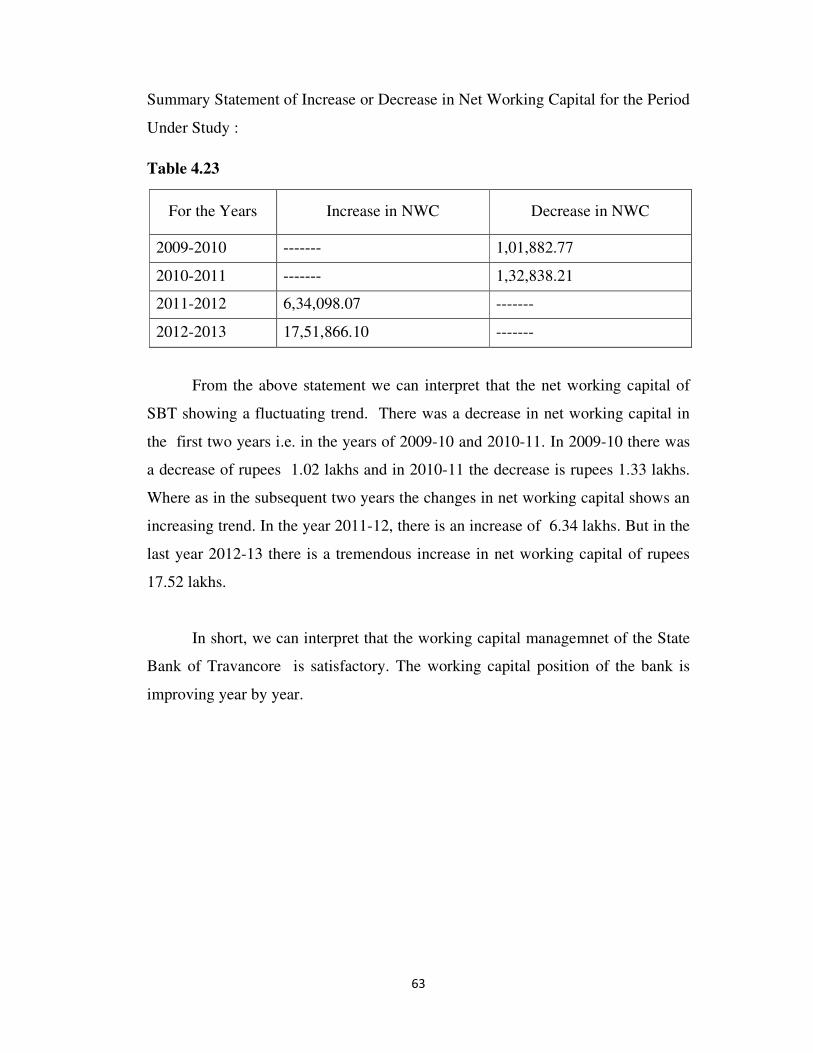
63
Summary Statement of Increase or Decrease in Net Working Capital for the Period
Under Study :
Table 4.23
From the above statement we can interpret that the net working capital of
SBT showing a fluctuating trend. There was a decrease in net working capital in
the first two years i.e. in the years of 2009-10 and 2010-11. In 2009-10 there was
a decrease of rupees 1.02 lakhs and in 2010-11 the decrease is rupees 1.33 lakhs.
Where as in the subsequent two years the changes in net working capital shows an
increasing trend. In the year 2011-12, there is an increase of 6.34 lakhs. But in the
last year 2012-13 there is a tremendous increase in net working capital of rupees
17.52 lakhs.
In short, we can interpret that the working capital managemnet of the State
Bank of Travancore is satisfactory. The working capital position of the bank is
improving year by year.
For the Years Increase in NWC Decrease in NWC
2009-2010 ------- 1,01,882.77
2010-2011 ------- 1,32,838.21
2011-2012 6,34,098.07 -------
2012-2013 17,51,866.10 -------

64
CHAPTER V
65
FINDINGS, SUGGESTIONS AND CONCLUSIONS
Working capital regarded as the life blood of every concern has greater
importance in the successful operation of a firm, then the fixed capital. Importance
of working capital can be judged from the fact that many a time the main cause of
failure of business enterprise has been found to be shortage of current assets and
their misleading. Inadequate working capital is a serious handicap business. To
remove these, it is necessary to find out the optimum amount of working capital.
For this purpose proper management of working capital is essential.
Management of working capital in an enterprise has profitability and
liquidity implications. No firm can survive without liquidity. Lack of profit may
cause a firm to be treated as sick but lack of liquidity could cause its downfall and
death over a period of time. Working capital management thus has become a basic
and broader measure of judging the performance and the manner of management
of working capital to a very large extent determines the success of operations of a
concern. So the amount of working capital in a business should be neither more
nor less than what is required.
In the previous chapter of this study we have analyzed the management of
working capital of SBT by using certain ratios and schedules of changes in
working capital. It is desirable to review the various aspects of the study and sum
up the important observations. As such this chapter relates to observational
findings and recommendations suggested to improve the status of the concern on
the basis of the above study. The main objectives of the study are: To study the
effect of working capital on SBT’s profitability and liquidity, to study the working
capital position on SBT and to evaluate the capital structure of SBT.
Major Findings:
� The liquidity position of the bank is quite satisfactory as regard the liquid ratios
of the bank.
� The bank’s profitability position has showing a downward trend. It needs to
improve its profitability.
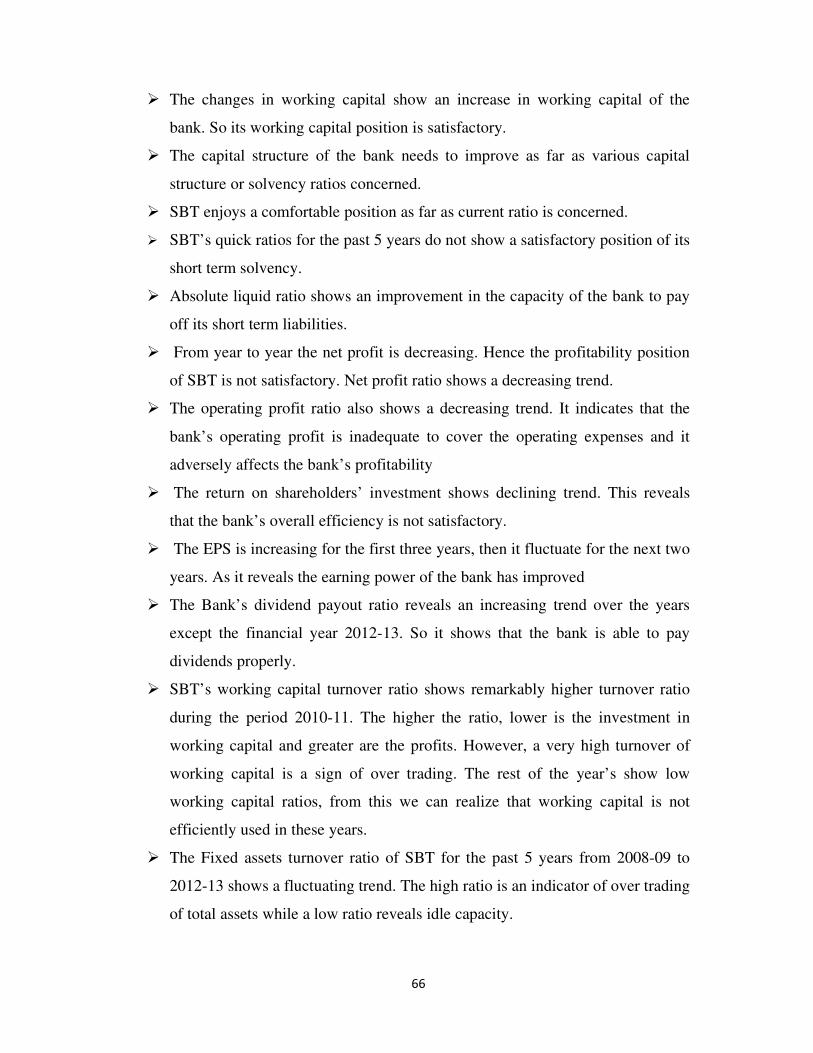
66
� The changes in working capital show an increase in working capital of the
bank. So its working capital position is satisfactory.
� The capital structure of the bank needs to improve as far as various capital
structure or solvency ratios concerned.
� SBT enjoys a comfortable position as far as current ratio is concerned.
� SBT’s quick ratios for the past 5 years do not show a satisfactory position of its
short term solvency.
� Absolute liquid ratio shows an improvement in the capacity of the bank to pay
off its short term liabilities.
� From year to year the net profit is decreasing. Hence the profitability position
of SBT is not satisfactory. Net profit ratio shows a decreasing trend.
� The operating profit ratio also shows a decreasing trend. It indicates that the
bank’s operating profit is inadequate to cover the operating expenses and it
adversely affects the bank’s profitability
� The return on shareholders’ investment shows declining trend. This reveals
that the bank’s overall efficiency is not satisfactory.
� The EPS is increasing for the first three years, then it fluctuate for the next two
years. As it reveals the earning power of the bank has improved
� The Bank’s dividend payout ratio reveals an increasing trend over the years
except the financial year 2012-13. So it shows that the bank is able to pay
dividends properly.
� SBT’s working capital turnover ratio shows remarkably higher turnover ratio
during the period 2010-11. The higher the ratio, lower is the investment in
working capital and greater are the profits. However, a very high turnover of
working capital is a sign of over trading. The rest of the year’s show low
working capital ratios, from this we can realize that working capital is not
efficiently used in these years.
� The Fixed assets turnover ratio of SBT for the past 5 years from 2008-09 to
2012-13 shows a fluctuating trend. The high ratio is an indicator of over trading
of total assets while a low ratio reveals idle capacity.
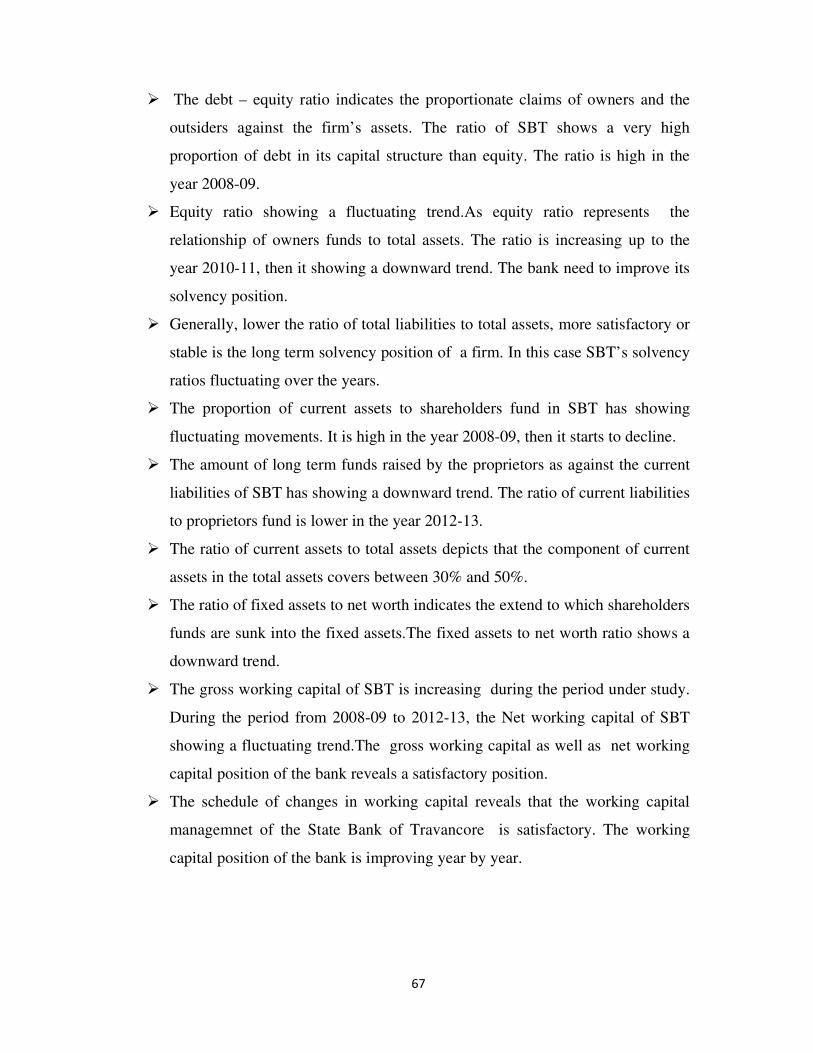
67
� The debt – equity ratio indicates the proportionate claims of owners and the
outsiders against the firm’s assets. The ratio of SBT shows a very high
proportion of debt in its capital structure than equity. The ratio is high in the
year 2008-09.
� Equity ratio showing a fluctuating trend.As equity ratio represents the
relationship of owners funds to total assets. The ratio is increasing up to the
year 2010-11, then it showing a downward trend. The bank need to improve its
solvency position.
� Generally, lower the ratio of total liabilities to total assets, more satisfactory or
stable is the long term solvency position of a firm. In this case SBT’s solvency
ratios fluctuating over the years.
� The proportion of current assets to shareholders fund in SBT has showing
fluctuating movements. It is high in the year 2008-09, then it starts to decline.
� The amount of long term funds raised by the proprietors as against the current
liabilities of SBT has showing a downward trend. The ratio of current liabilities
to proprietors fund is lower in the year 2012-13.
� The ratio of current assets to total assets depicts that the component of current
assets in the total assets covers between 30% and 50%.
� The ratio of fixed assets to net worth indicates the extend to which shareholders
funds are sunk into the fixed assets.The fixed assets to net worth ratio shows a
downward trend.
� The gross working capital of SBT is increasing during the period under study.
During the period from 2008-09 to 2012-13, the Net working capital of SBT
showing a fluctuating trend.The gross working capital as well as net working
capital position of the bank reveals a satisfactory position.
� The schedule of changes in working capital reveals that the working capital
managemnet of the State Bank of Travancore is satisfactory. The working
capital position of the bank is improving year by year.
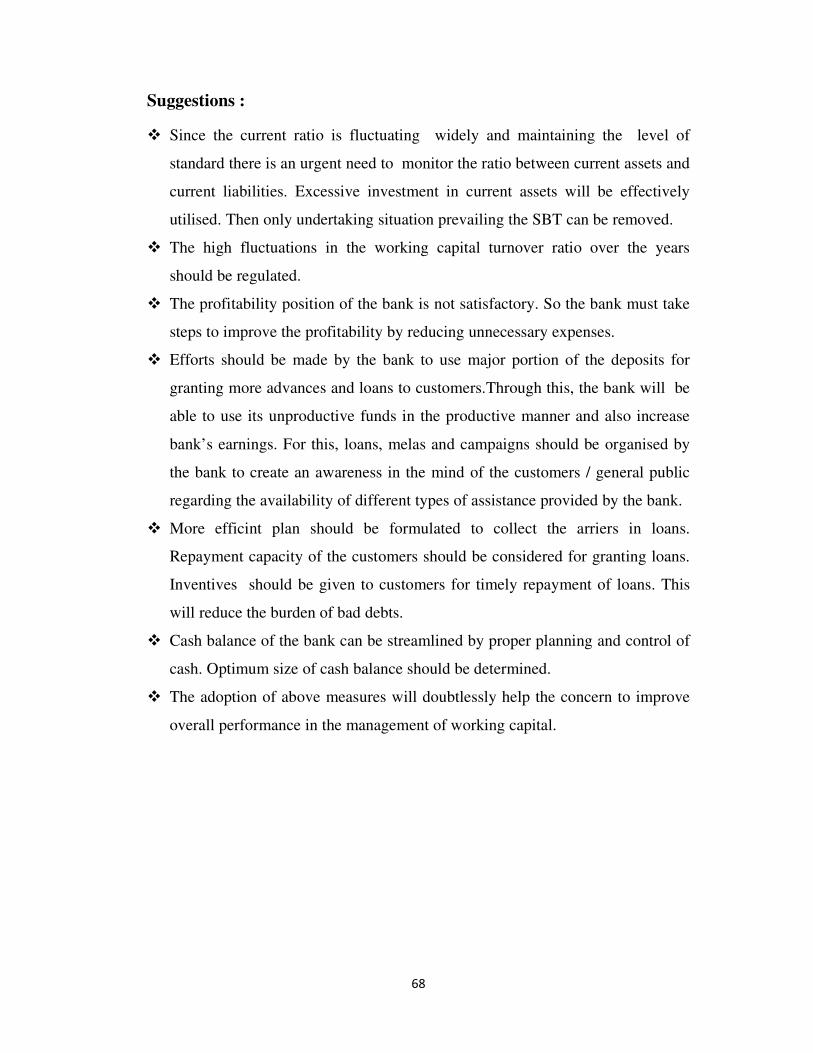
68
Suggestions :
� Since the current ratio is fluctuating widely and maintaining the level of
standard there is an urgent need to monitor the ratio between current assets and
current liabilities. Excessive investment in current assets will be effectively
utilised. Then only undertaking situation prevailing the SBT can be removed.
� The high fluctuations in the working capital turnover ratio over the years
should be regulated.
� The profitability position of the bank is not satisfactory. So the bank must take
steps to improve the profitability by reducing unnecessary expenses.
� Efforts should be made by the bank to use major portion of the deposits for
granting more advances and loans to customers.Through this, the bank will be
able to use its unproductive funds in the productive manner and also increase
bank’s earnings. For this, loans, melas and campaigns should be organised by
the bank to create an awareness in the mind of the customers / general public
regarding the availability of different types of assistance provided by the bank.
� More efficint plan should be formulated to collect the arriers in loans.
Repayment capacity of the customers should be considered for granting loans.
Inventives should be given to customers for timely repayment of loans. This
will reduce the burden of bad debts.
� Cash balance of the bank can be streamlined by proper planning and control of
cash. Optimum size of cash balance should be determined.
� The adoption of above measures will doubtlessly help the concern to improve
overall performance in the management of working capital.
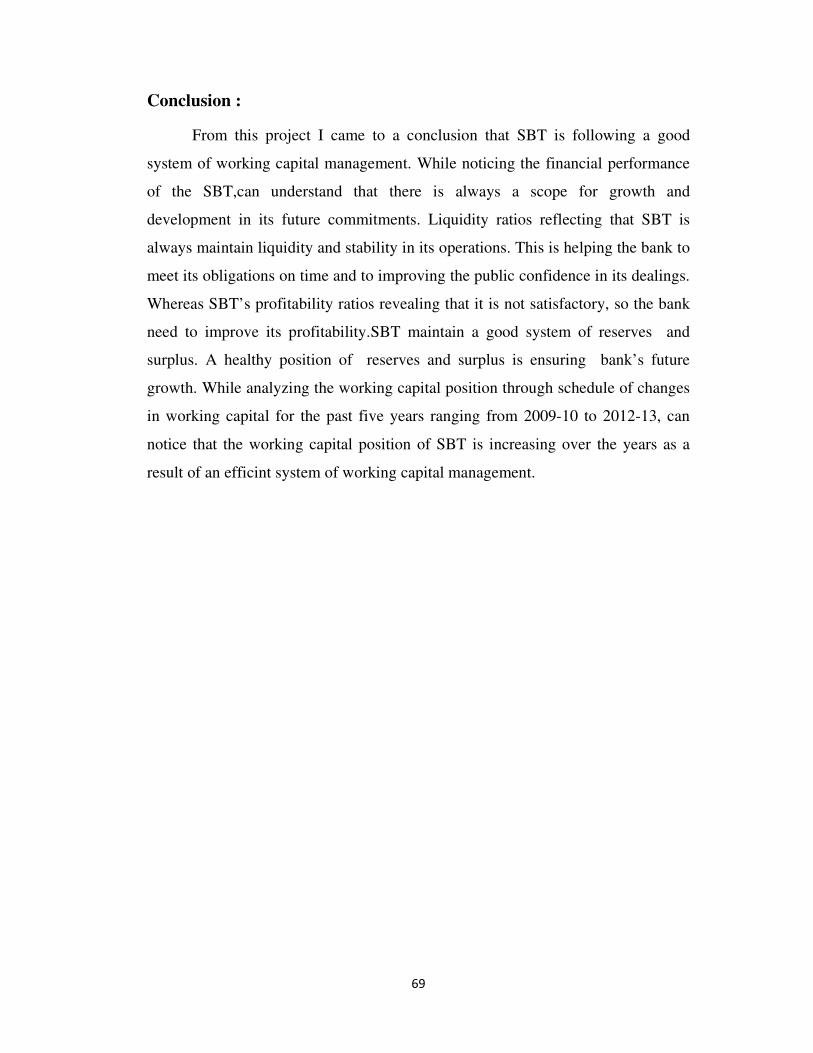
69
Conclusion :
From this project I came to a conclusion that SBT is following a good
system of working capital management. While noticing the financial performance
of the SBT,can understand that there is always a scope for growth and
development in its future commitments. Liquidity ratios reflecting that SBT is
always maintain liquidity and stability in its operations. This is helping the bank to
meet its obligations on time and to improving the public confidence in its dealings.
Whereas SBT’s profitability ratios revealing that it is not satisfactory, so the bank
need to improve its profitability.SBT maintain a good system of reserves and
surplus. A healthy position of reserves and surplus is ensuring bank’s future
growth. While analyzing the working capital position through schedule of changes
in working capital for the past five years ranging from 2009-10 to 2012-13, can
notice that the working capital position of SBT is increasing over the years as a
result of an efficint system of working capital management.
70
BIBLIOGRAPHY
1. Anuj Gupta, Sharma, R.K. & Shashi, K. Gupta (2013). Management
Accounting (6th
Ed.).New Delhi: Kalyani Publishers.
2. Bardia, S.C. (2008). Working Capital Management. New Delhi: Kalyani
Publishers.
3. Jain, S.P. & Narang, K.L. (2012). Specialized Accounting. New Delhi:
Kalyani Publishers.
4. Pandey, I.M. (2009). Financial Management. New Delhi: Kalyani
Publishers.
5. Prasanna Chandra (2010). Financial Management. New Delhi: Kalyani
Publishers.
6. Shashi, K. Gupta & Sharma, R.K. (2010). Financial Management. New
Delhi: Kalyani Publishers.
Websites
• www.statebankoftravancore.com
• www.bankinginfo.com
• www.studyfinance.com
• www.allbankingsolutions.com
• www.managementstudyguide.com