Embed Size (px)
Citation preview
01 July 2002 slide number SSA-1
HIV/AIDS in sub-Saharan Africa
July 2002
01 July 2002 slide number SSA-2
• Trends in the HIV/AIDS Epidemic• Different Sectors of the Population• HIV/AIDS and Youth• Impact of HIV/AIDS• Knowledge and Behavior• Success Stories
01 July 2002 slide number SSA-3
Trends in the HIV/AIDS Epidemic
01 July 2002 slide number SSA-4
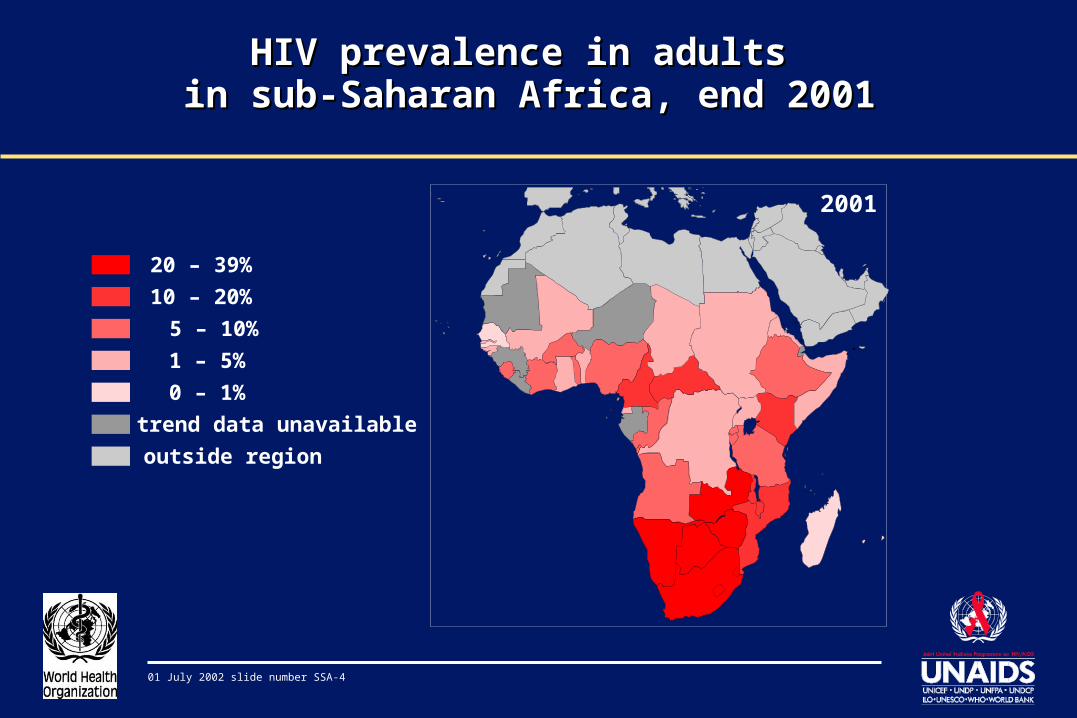
HIV prevalence in adults HIV prevalence in adults in sub-Saharan Africa, end 2001in sub-Saharan Africa, end 2001
20 – 39%
10 – 20%
5 – 10%
1 – 5%
0 – 1%
trend data unavailable
outside region
2001
01 July 2002 slide number SSA-5
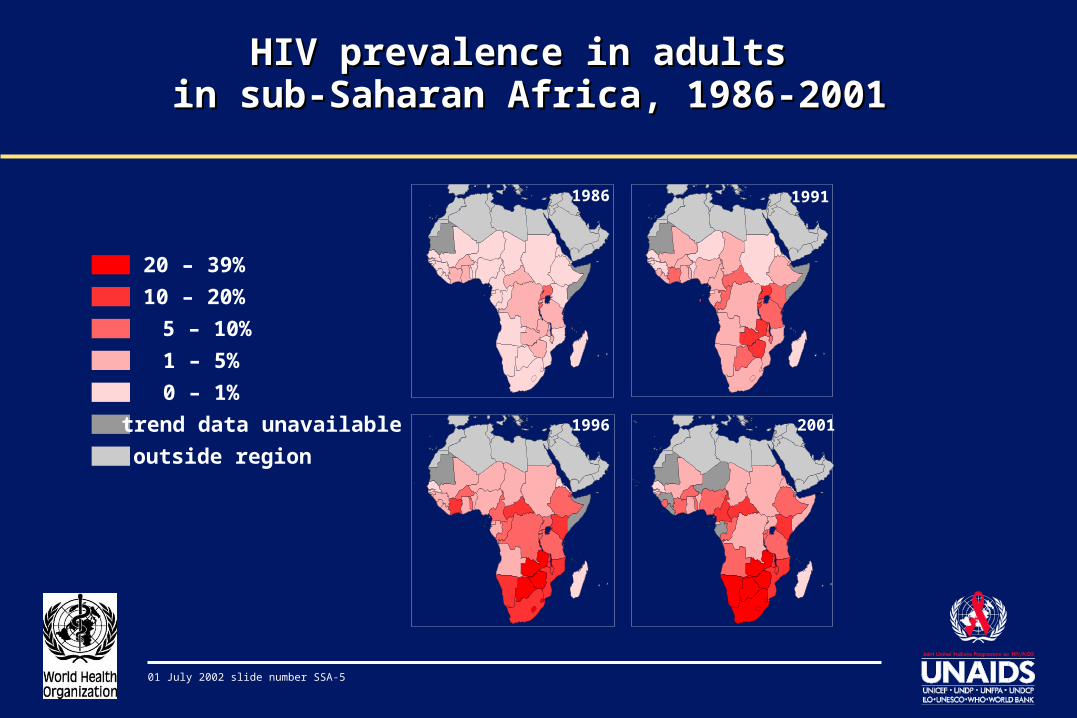
HIV prevalence in adults HIV prevalence in adults in sub-Saharan Africa, 1986-2001in sub-Saharan Africa, 1986-2001
20 – 39%
10 – 20%
5 – 10%
1 – 5%
0 – 1%
trend data unavailable
outside region
1986 1991
1996 2001
01 July 2002 slide number SSA-6
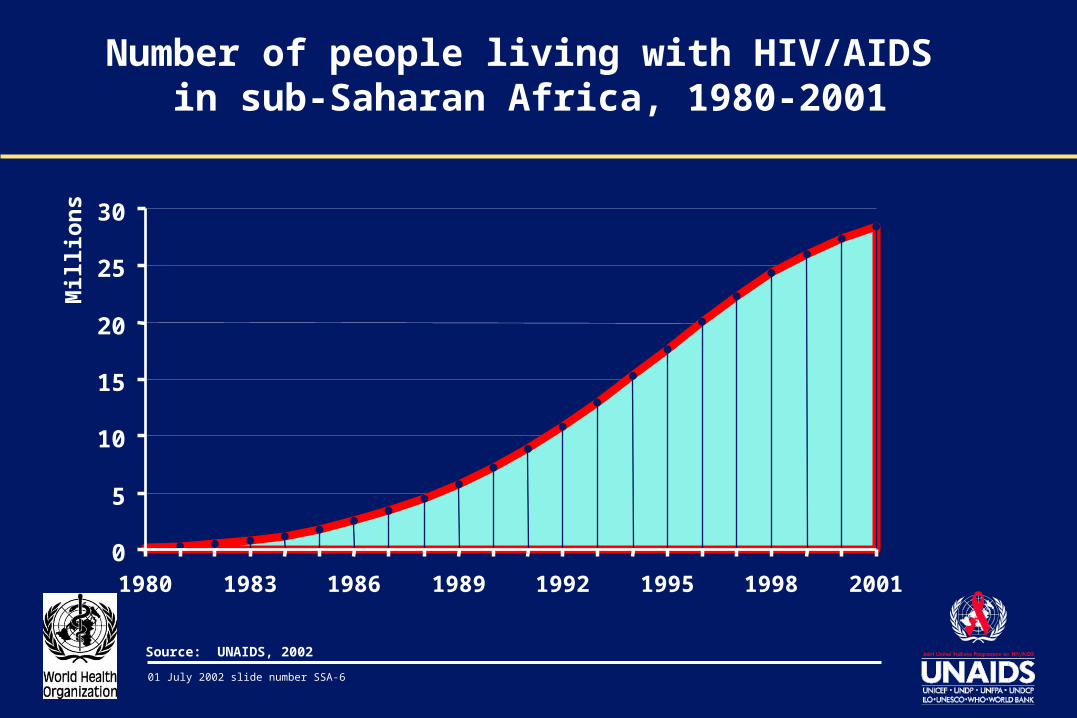
Number of people living with HIV/AIDS in sub-Saharan Africa, 1980-2001
0
5
10
15
20
25
30
1980 1983 1986 1989 1992 1995 1998 2001
Mill
ion
s
Source: UNAIDS, 2002
01 July 2002 slide number SSA-7
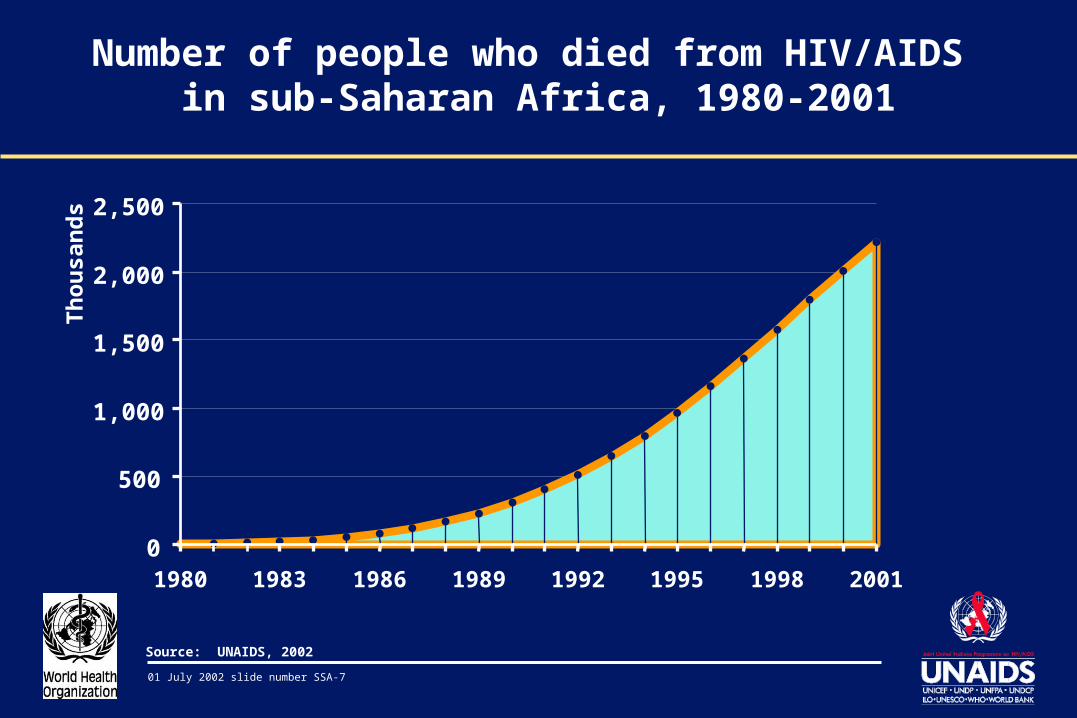
Number of people who died from HIV/AIDS in sub-Saharan Africa, 1980-2001
0
500
1,000
1,500
2,000
2,500
1980 1983 1986 1989 1992 1995 1998 2001
Th
ou
san
ds
Source: UNAIDS, 2002
01 July 2002 slide number SSA-8
0
5
10
15
20
25
30
1990 2000‘91 ‘92 ‘93 ‘94 ‘95 ‘96 ‘97 ‘98 ‘99 ‘01
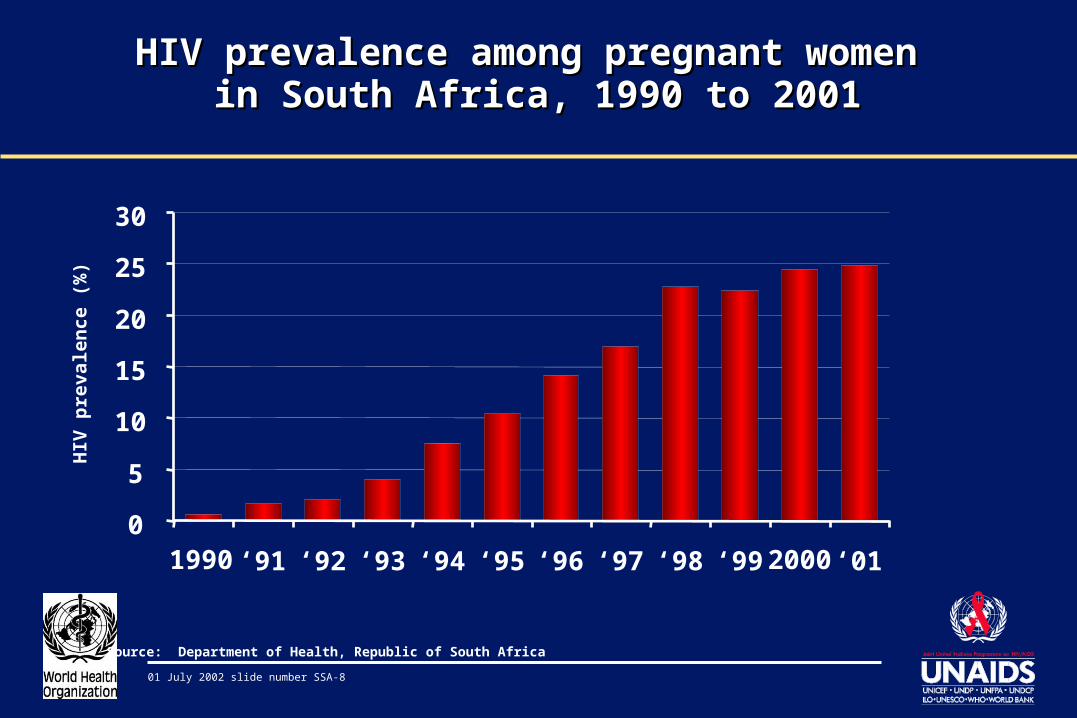
Source: Department of Health, Republic of South Africa
HIV prevalence among pregnant women HIV prevalence among pregnant women in South Africa, 1990 to 2001in South Africa, 1990 to 2001
HIV
pre
vale
nc
e (%
)
01 July 2002 slide number SSA-9
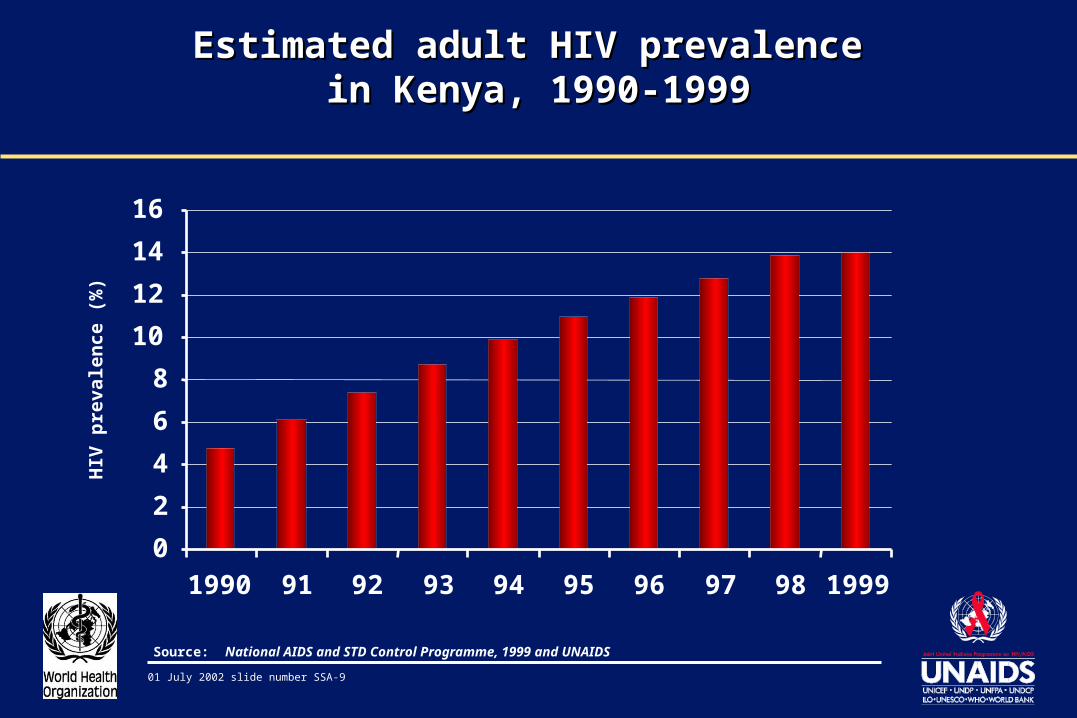
Estimated adult HIV prevalence Estimated adult HIV prevalence in Kenya, 1990-1999in Kenya, 1990-1999
Source: National AIDS and STD Control Programme, 1999 and UNAIDS
0
2
4
6
8
10
12
14
16
1990 91 92 93 94 95 96 97 98 1999
HIV
pre
vale
nc
e (%
)
01 July 2002 slide number SSA-10
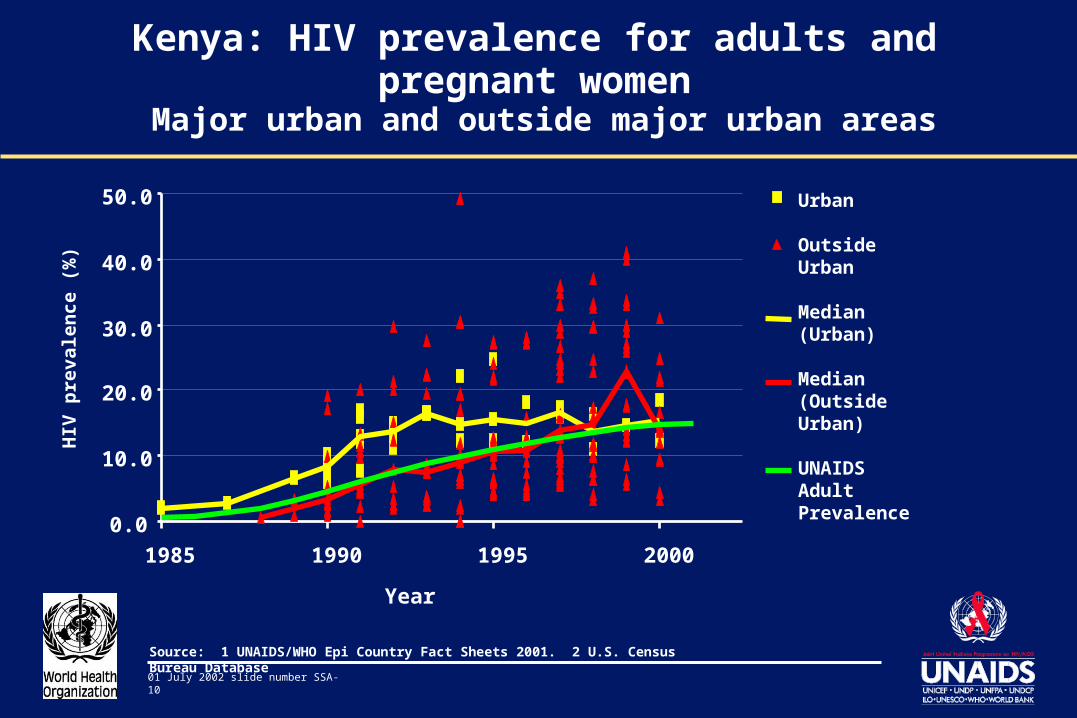
Kenya: HIV prevalence for adults and pregnant women Major urban and outside major urban areas
Year
0.0
10.0
20.0
30.0
40.0
50.0
1985 1990 1995 2000
Urban
OutsideUrban
Median(Urban)
Median(OutsideUrban)
UNAIDSAdult Prevalence
HIV
pre
vale
nc
e (%
)
Source: 1 UNAIDS/WHO Epi Country Fact Sheets 2001. 2 U.S. Census Bureau Database
01 July 2002 slide number SSA-11
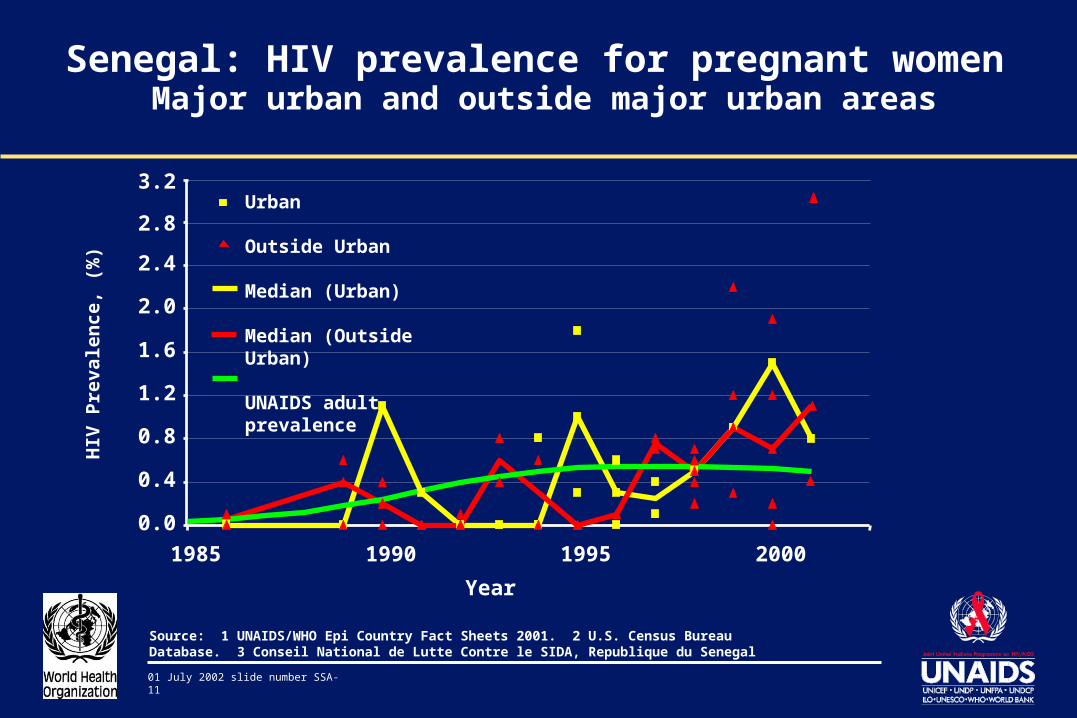
Senegal: HIV prevalence for pregnant women Major urban and outside major urban areas
0.0
0.4
0.8
1.2
1.6
2.0
2.4
1985 1990 1995 2000
Year
2.8
3.2Urban
Outside Urban
Median (Urban)
Median (Outside Urban)
UNAIDS adult prevalence
HIV
Pre
vale
nce
, (%
)
Source: 1 UNAIDS/WHO Epi Country Fact Sheets 2001. 2 U.S. Census Bureau Database. 3 Conseil National de Lutte Contre le SIDA, Republique du Senegal
01 July 2002 slide number SSA-12
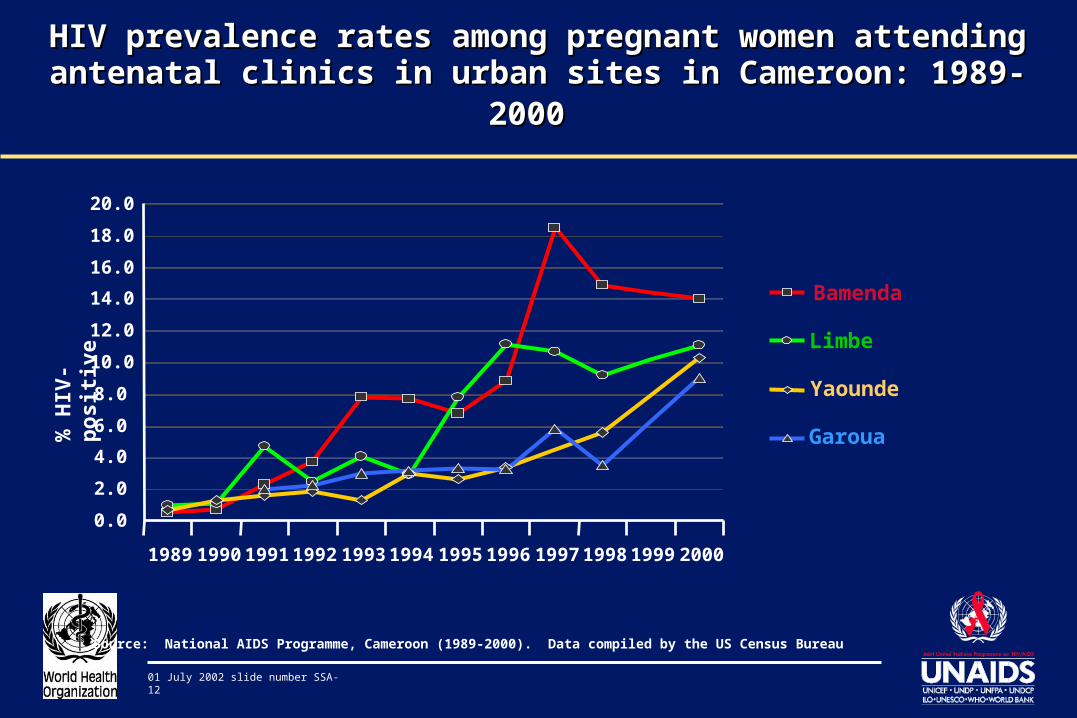
HIV prevalence rates among pregnant women attending HIV prevalence rates among pregnant women attending antenatal clinics in urban sites in Cameroon: 1989-2000antenatal clinics in urban sites in Cameroon: 1989-2000
0.0
2.0
4.0
6.0
8.0
10.0
12.0
14.0
16.0
18.0
20.0
1989 1990 1991 1992 1993 1994 1995 1996 1997 1998 1999 2000
Bamenda
Limbe
Yaounde
Garoua
% H
IV-
po
siti
ve
Source: National AIDS Programme, Cameroon (1989-2000). Data compiled by the US Census Bureau
01 July 2002 slide number SSA-13
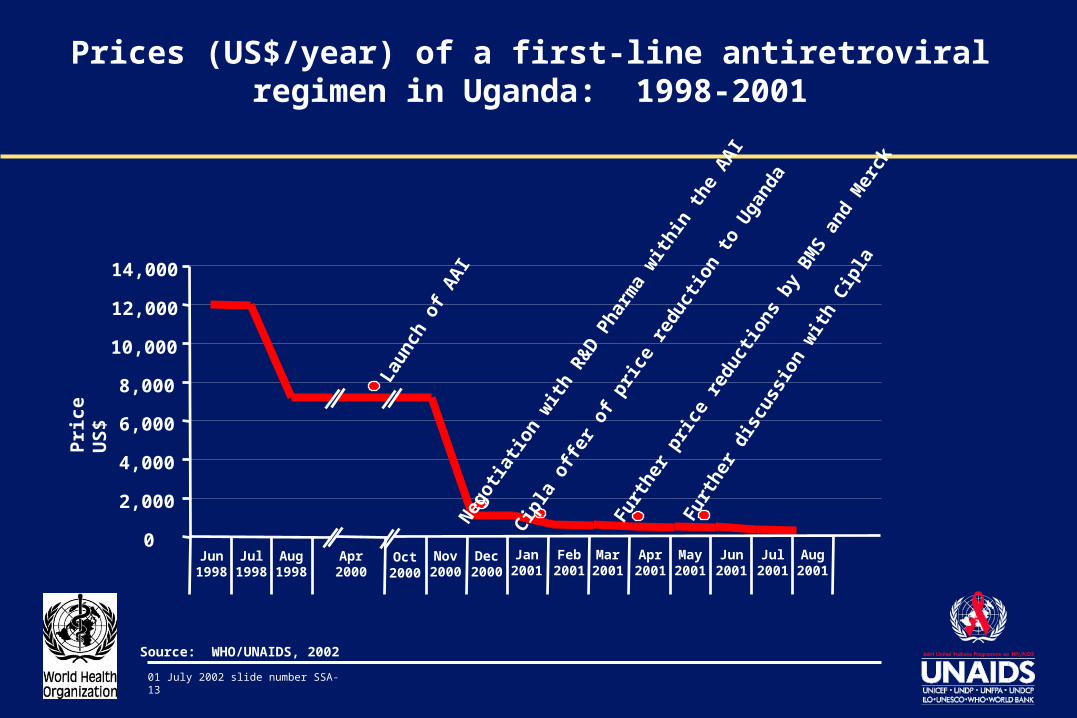
Laun
ch o
f AA
I
Neg
otia
tion
with
R&
D P
harm
a w
ithin
the
AA
I
Cip
la o
ffer o
f pric
e re
duct
ion
to U
gand
a
Furt
her p
rice
redu
ctio
ns b
y B
MS
and
Mer
ck
Furt
her
disc
ussi
on w
ith C
ipla
0
2,000
4,000
6,000
8,000
10,000
12,000
14,000
Pri
ce
US
$
Jun1998
Jul1998
Aug1998
Apr2000
Nov2000
Dec2000
Jan2001
Feb2001
Mar2001
Apr2001
May2001
Jun2001
Jul2001
Aug2001
Oct2000
Source: WHO/UNAIDS, 2002
Prices (US$/year) of a first-line antiretroviral regimen in Uganda: 1998-2001
01 July 2002 slide number SSA-14
Different Sectors of the Population
01 July 2002 slide number SSA-15
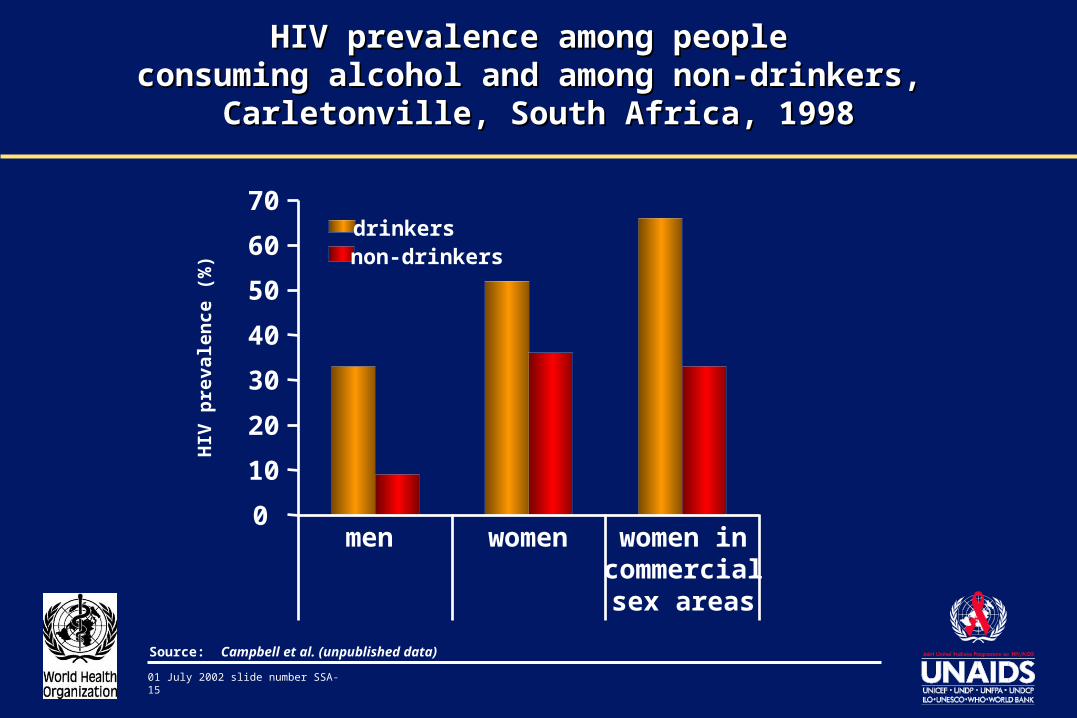
HIV prevalence among people HIV prevalence among people consuming alcohol and among non-drinkers, consuming alcohol and among non-drinkers,
Carletonville, South Africa, 1998Carletonville, South Africa, 1998
0
10
20
30
40
50
60
70
men women women in commercial
sex areas
drinkersnon-drinkers
Source: Campbell et al. (unpublished data)
HIV
pre
vale
nc
e (%
)
01 July 2002 slide number SSA-16
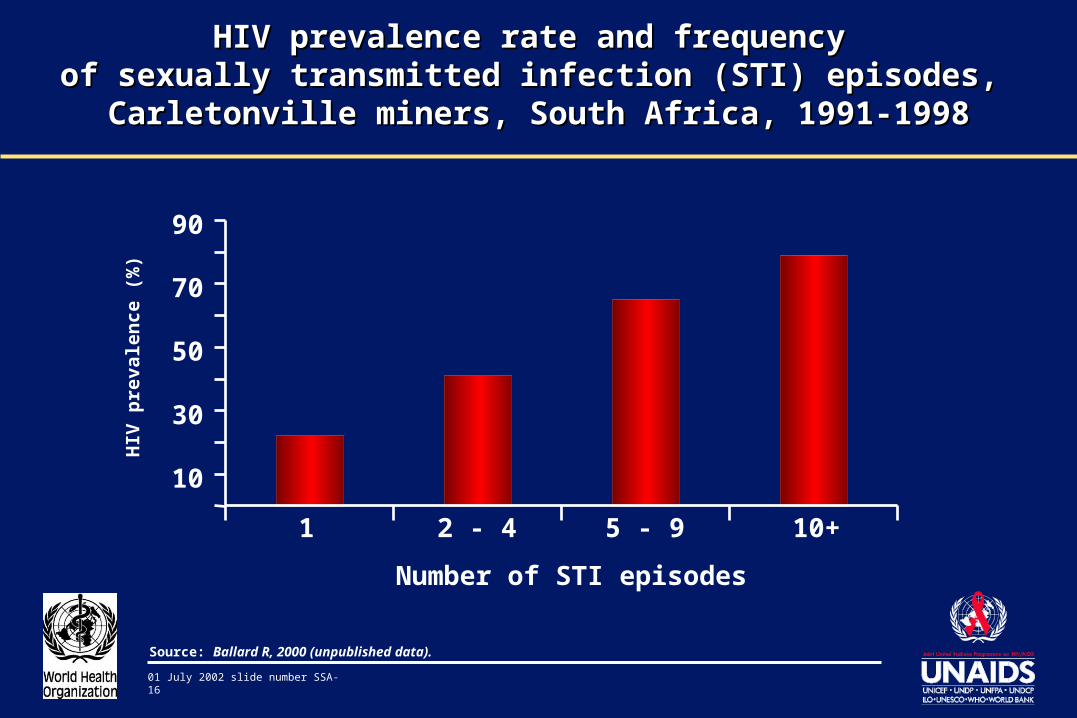
HIV prevalence rate and frequency HIV prevalence rate and frequency of sexually transmitted infection (STI) episodes, of sexually transmitted infection (STI) episodes,
Carletonville miners, South Africa, 1991-1998Carletonville miners, South Africa, 1991-1998
10
30
50
70
90
1 2 - 4 5 - 9 10+
Number of STI episodes
Source: Ballard R, 2000 (unpublished data).
HIV
pre
vale
nc
e (%
)
01 July 2002 slide number SSA-17
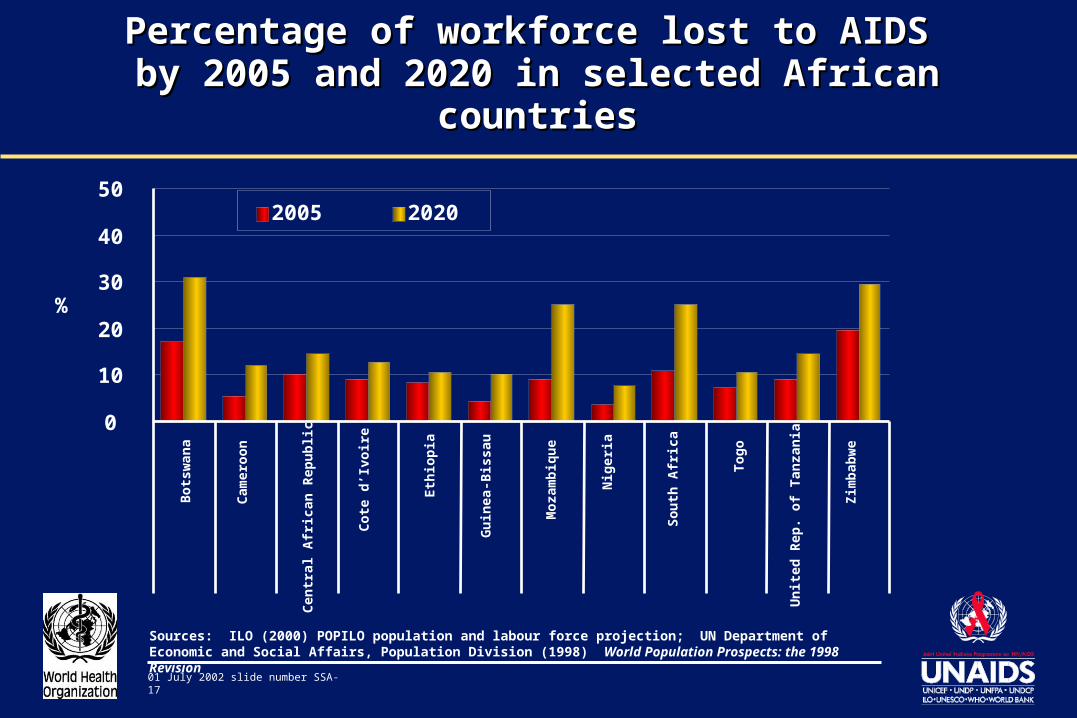
Percentage of workforce lost to AIDS Percentage of workforce lost to AIDS by 2005 and 2020 in selected African countriesby 2005 and 2020 in selected African countries
0
10
20
30
40
50
%
2005 2020
Bo
tsw
ana
Cam
ero
on
Cen
tral
Afr
ican
Rep
ub
lic
Co
te d
’Ivo
ire
Eth
iop
ia
Gu
inea
-Bis
sau
Mo
zam
biq
ue
Nig
eria
So
uth
Afr
ica
To
go
Un
ited
Rep
. of
Tan
zan
ia
Zim
bab
we
Sources: ILO (2000) POPILO population and labour force projection; UN Department of Economic and Social Affairs, Population Division (1998) World Population Prospects: the 1998 Revision
01 July 2002 slide number SSA-18
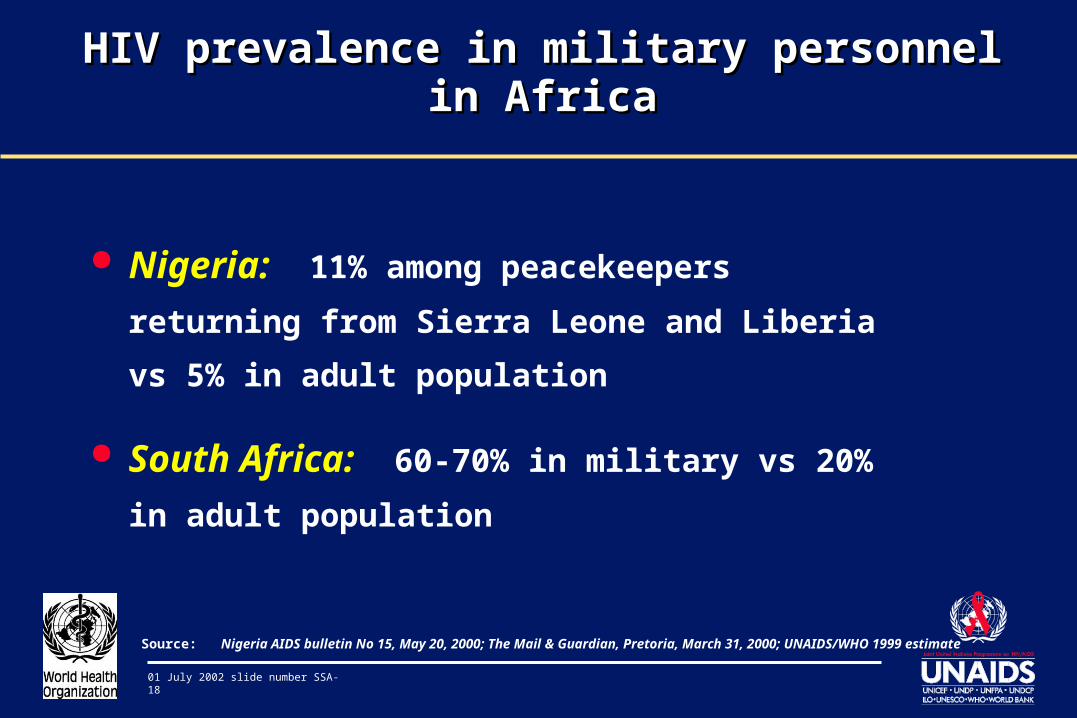
HIV prevalence in military personnel in AfricaHIV prevalence in military personnel in Africa
Nigeria: 11% among peacekeepers returning from
Sierra Leone and Liberia vs 5% in adult population
South Africa: 60-70% in military vs 20% in adult
population
Source: Nigeria AIDS bulletin No 15, May 20, 2000; The Mail & Guardian, Pretoria, March 31, 2000; UNAIDS/WHO 1999 estimate
01 July 2002 slide number SSA-19
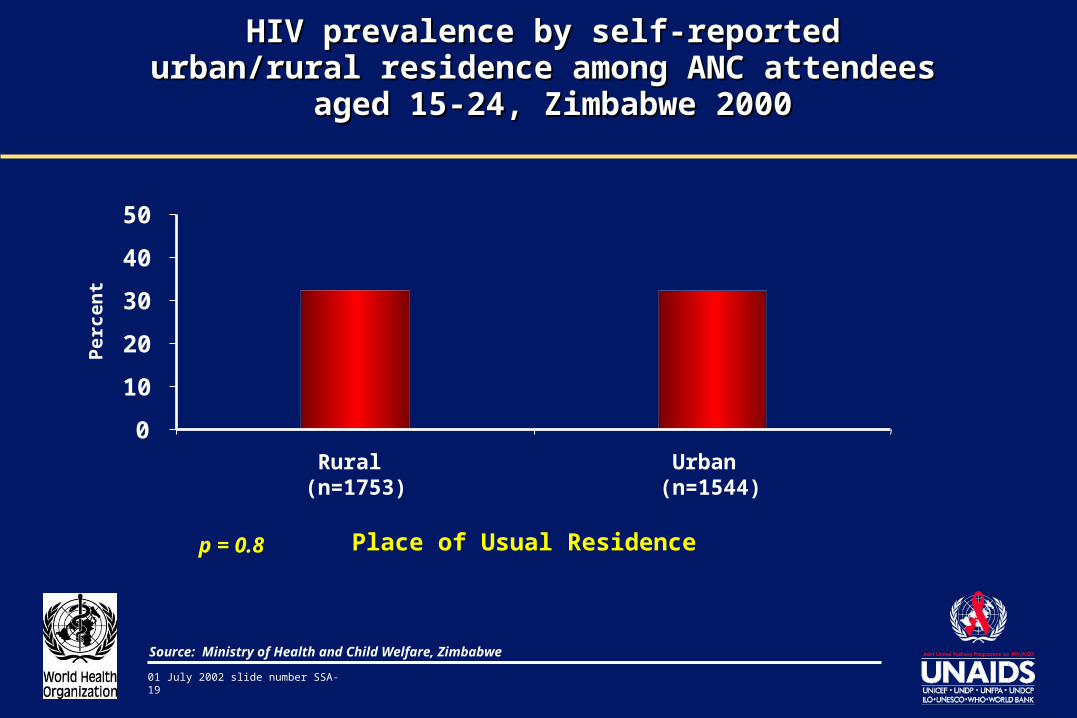
HIV prevalence by self-reported HIV prevalence by self-reported urban/rural residence among ANC attendees urban/rural residence among ANC attendees
aged 15-24, Zimbabwe 2000aged 15-24, Zimbabwe 2000
p = 0.8
Source: Ministry of Health and Child Welfare, Zimbabwe
0
10
20
30
40
50
Rural (n=1753)
Urban (n=1544)
Place of Usual Residence
Per
cen
t
01 July 2002 slide number SSA-20
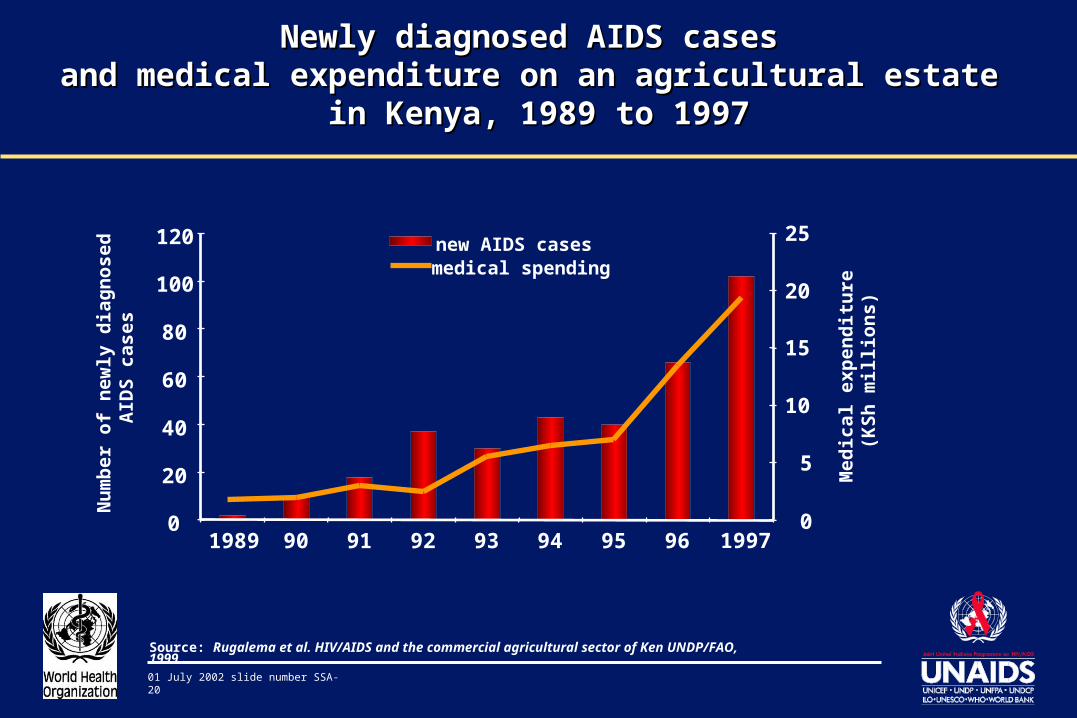
Newly diagnosed AIDS cases Newly diagnosed AIDS cases and medical expenditure on an agricultural estate and medical expenditure on an agricultural estate
in Kenya, 1989 to 1997in Kenya, 1989 to 1997
0
20
40
60
80
100
120
Nu
mb
er o
f n
ewly
dia
gn
ose
d
AID
S c
ases
0
5
10
15
20
25
Med
ical
exp
end
itu
re
(KS
h m
illi
on
s)
1989 90 91 92 93 94 95 96 1997
new AIDS casesmedical spending
Source: Rugalema et al. HIV/AIDS and the commercial agricultural sector of Ken UNDP/FAO, 1999
01 July 2002 slide number SSA-21
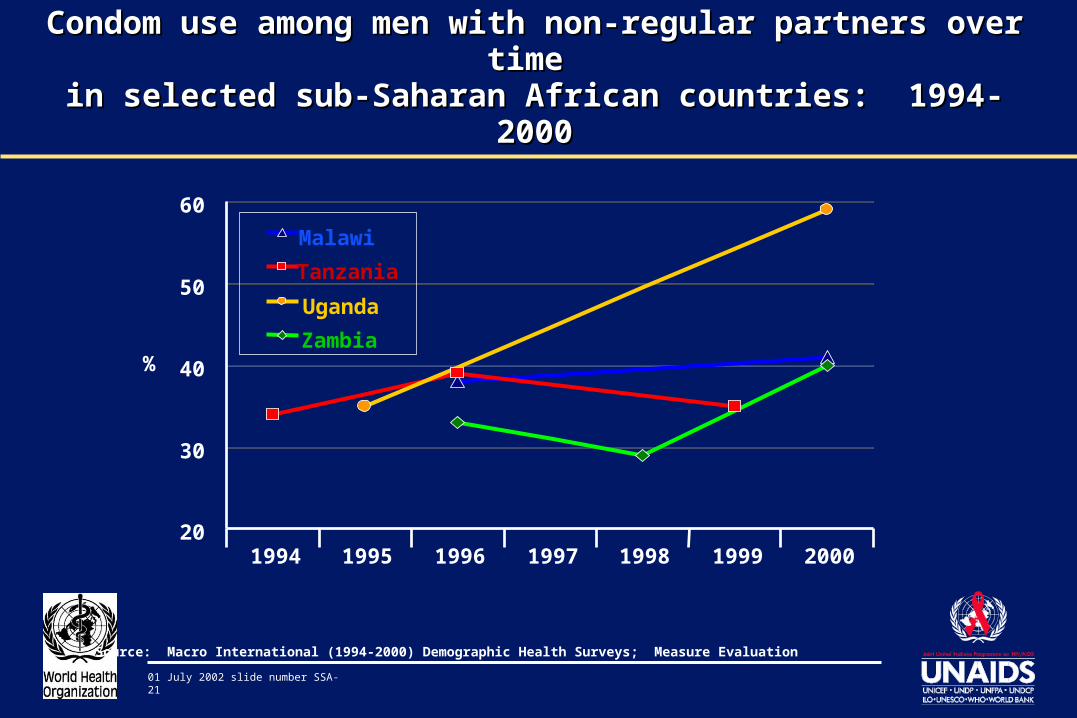
Condom use among men with non-regular partners over time Condom use among men with non-regular partners over time in selected sub-Saharan African countries: 1994-2000in selected sub-Saharan African countries: 1994-2000
20
30
40
50
60
1994 1995 1996 1997 1998 1999 2000
Malawi
Tanzania
Uganda
Zambia%
Source: Macro International (1994-2000) Demographic Health Surveys; Measure Evaluation
01 July 2002 slide number SSA-22
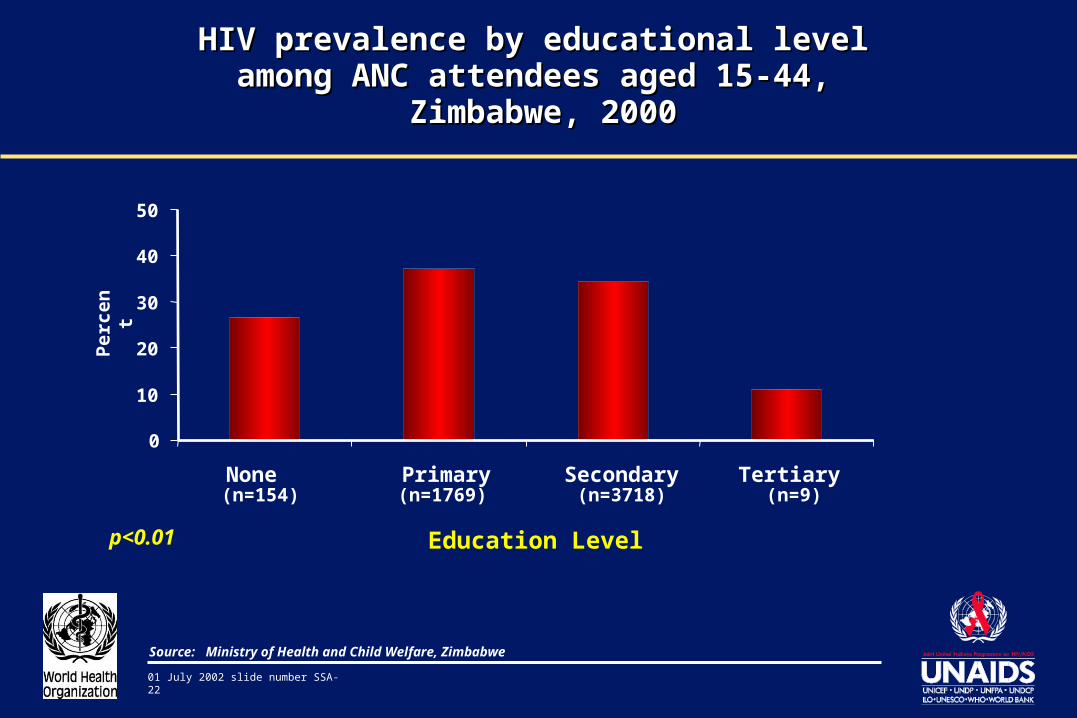
HIV prevalence by educational level HIV prevalence by educational level among ANC attendees aged 15-44, among ANC attendees aged 15-44,
Zimbabwe, 2000Zimbabwe, 2000
p<0.01
Source: Ministry of Health and Child Welfare, Zimbabwe
0
10
20
30
40
50
None (n=154)
Primary(n=1769)
Secondary(n=3718)
Tertiary (n=9)
Education Level
Per
cen
t
01 July 2002 slide number SSA-23
HIV/AIDS and Youth
01 July 2002 slide number SSA-24
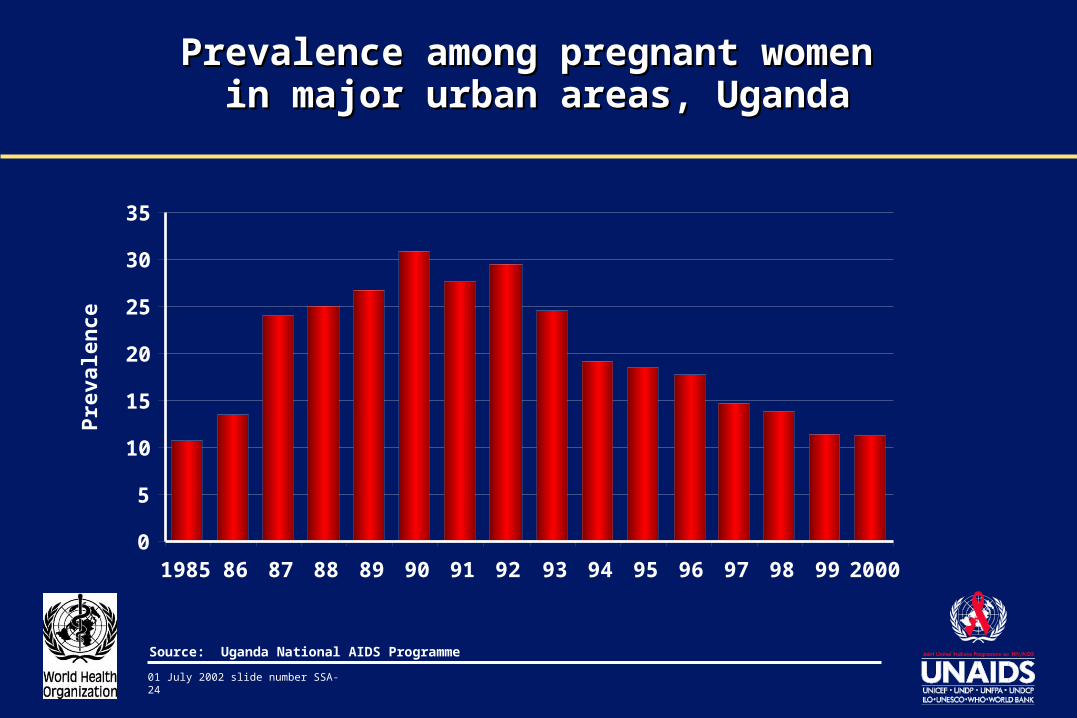
Prevalence among pregnant women Prevalence among pregnant women in major urban areas, Ugandain major urban areas, Uganda
Source: Uganda National AIDS Programme
0
5
10
15
20
25
30
35
1985 86 87 88 89 90 91 92 93 94 95 96 97 98 99 2000
Pre
vale
nce
01 July 2002 slide number SSA-25
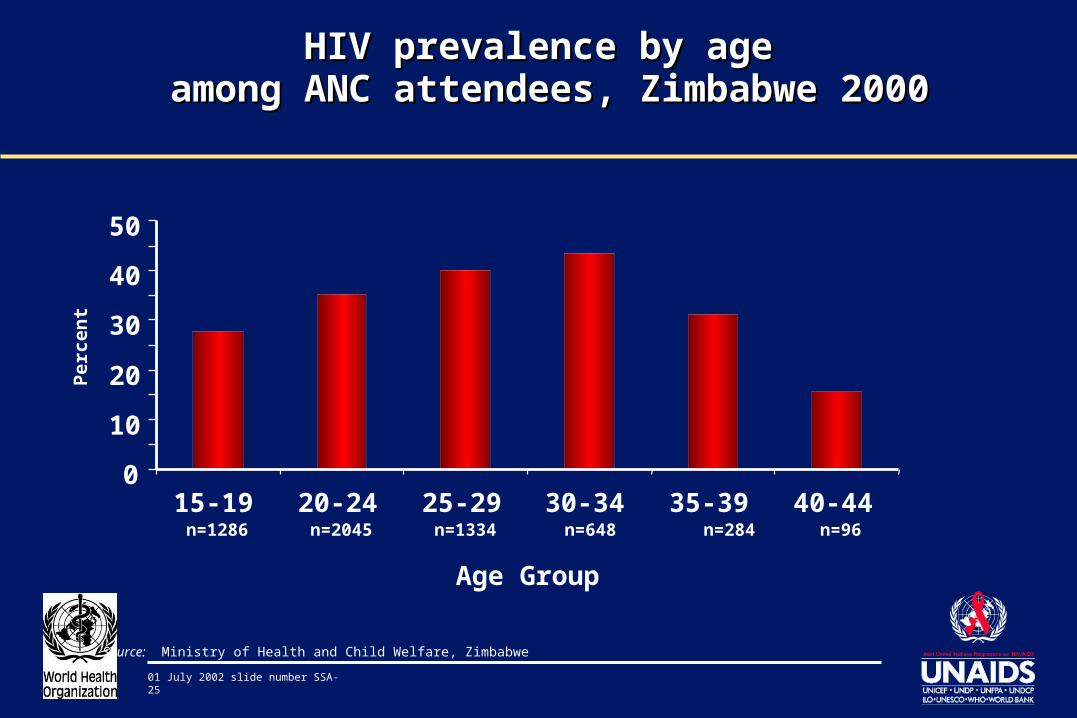
HIV prevalence by age HIV prevalence by age among ANC attendees, Zimbabwe 2000among ANC attendees, Zimbabwe 2000
Source: Ministry of Health and Child Welfare, Zimbabwe
0
10
20
30
40
50
15-19 n=1286
20-24 n=2045
25-29 n=1334
30-34 n=648
35-39 n=284
40-44 n=96
Age Group
Per
cen
t
01 July 2002 slide number SSA-26
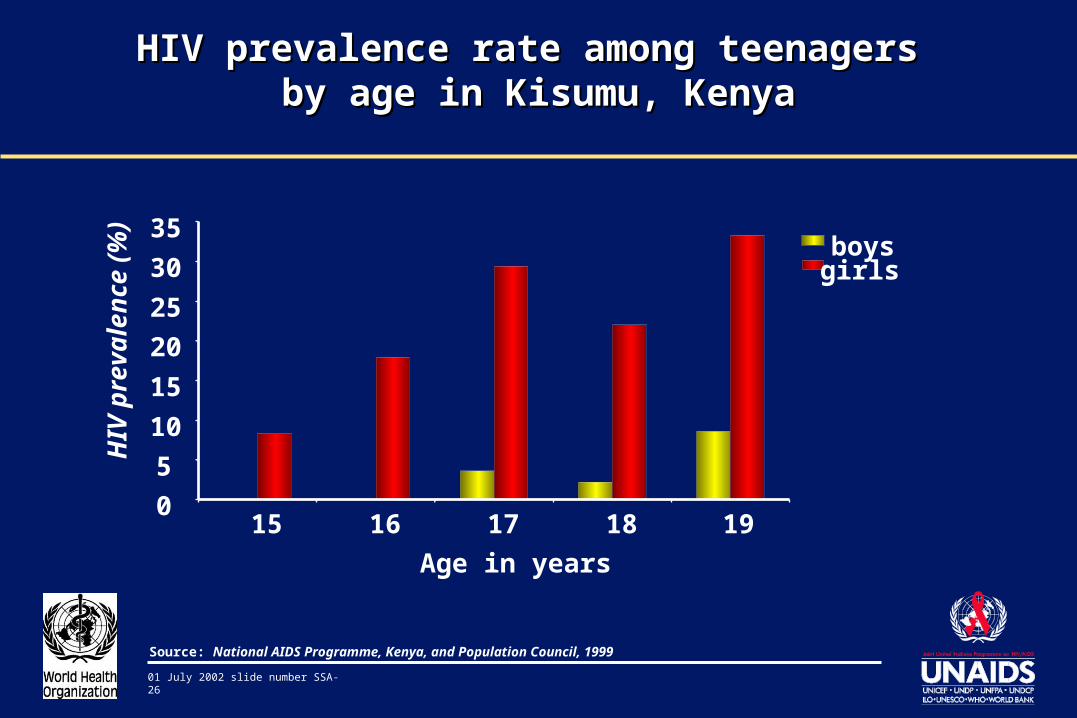
HIV prevalence rate among teenagers HIV prevalence rate among teenagers by age in Kisumu, Kenyaby age in Kisumu, Kenya
0
5
10
15
20
25
30
35
15 16 17 18 19
Age in years
HIV
pre
va
len
ce
(%)
boysgirls
Source: National AIDS Programme, Kenya, and Population Council, 1999
01 July 2002 slide number SSA-27
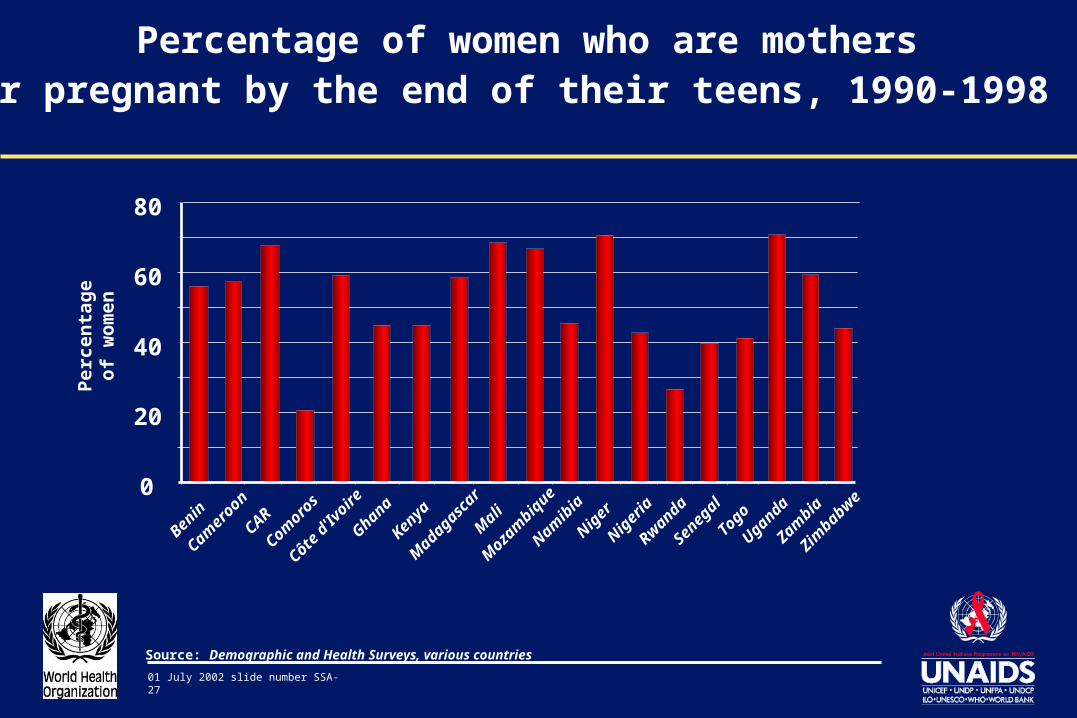
Percentage of women who are mothers or pregnant by the end of their teens, 1990-1998
Source: Demographic and Health Surveys, various countries
0
20
40
60
80
Benin
Camer
oon
CAR
Comoro
s
Côte d
'Ivoire
Ghana
Kenya
Mad
agas
car
Mal
i
Moza
mbiq
ue
Namib
ia
Niger
Niger
ia
Rwanda
Seneg
al
Togo
Uganda
Zambia
Zimbab
we
Per
cen
tag
e o
f w
om
en
01 July 2002 slide number SSA-28
The Impact of HIV/AIDS
01 July 2002 slide number SSA-29
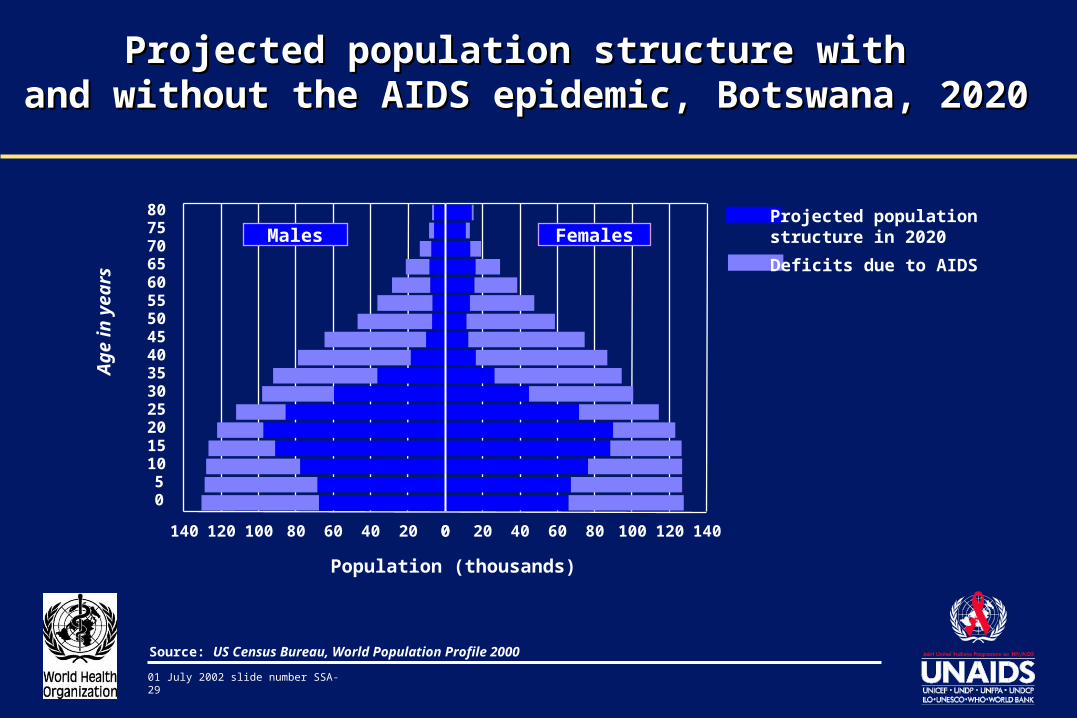
Projected population structure with Projected population structure with and without the AIDS epidemic, Botswana, 2020and without the AIDS epidemic, Botswana, 2020
80757065605550454035302520151050
020406080100120140 0 20 40 60 80 100 120 140
Males Females
Deficits due to AIDS
Projected population structure in 2020
Population (thousands)
Ag
e in
yea
rs
Source: US Census Bureau, World Population Profile 2000
01 July 2002 slide number SSA-30
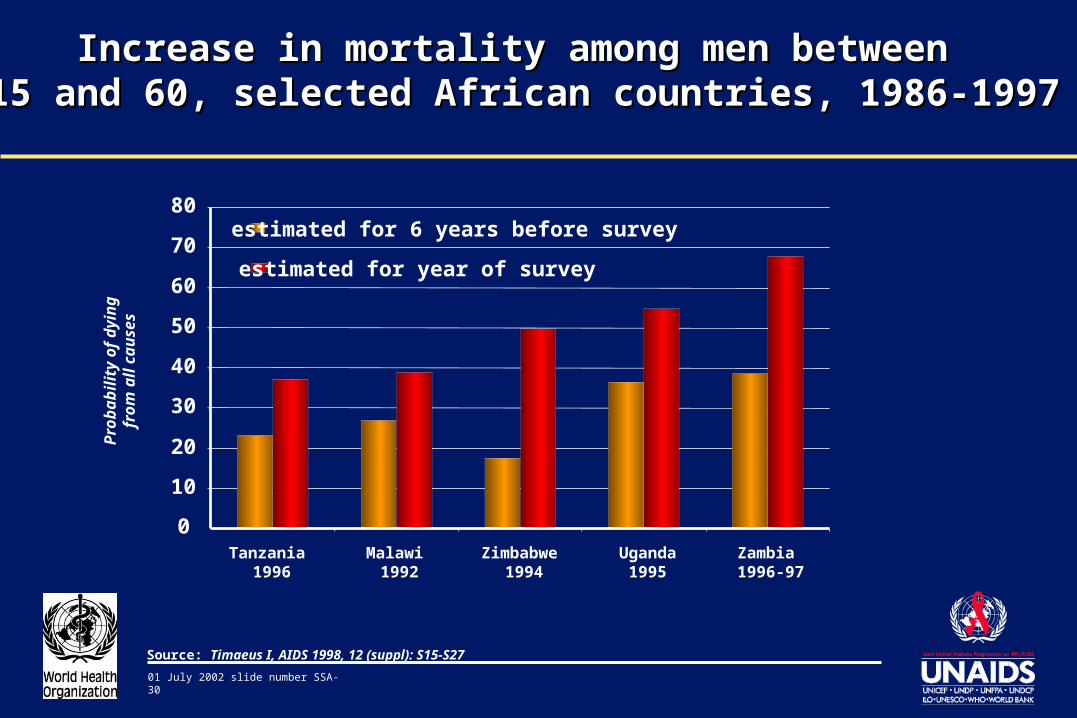
Increase in mortality among men between Increase in mortality among men between 15 and 60, selected African countries, 1986-199715 and 60, selected African countries, 1986-1997
0
10
20
30
40
50
60
70
80
Tanzania 1996
Malawi 1992
Zimbabwe 1994
Uganda1995
Zambia 1996-97
Pro
ba
bil
ity
of
dy
ing
fr
om
all
ca
us
es
estimated for 6 years before survey
estimated for year of survey
Source: Timaeus I, AIDS 1998, 12 (suppl): S15-S27
01 July 2002 slide number SSA-31
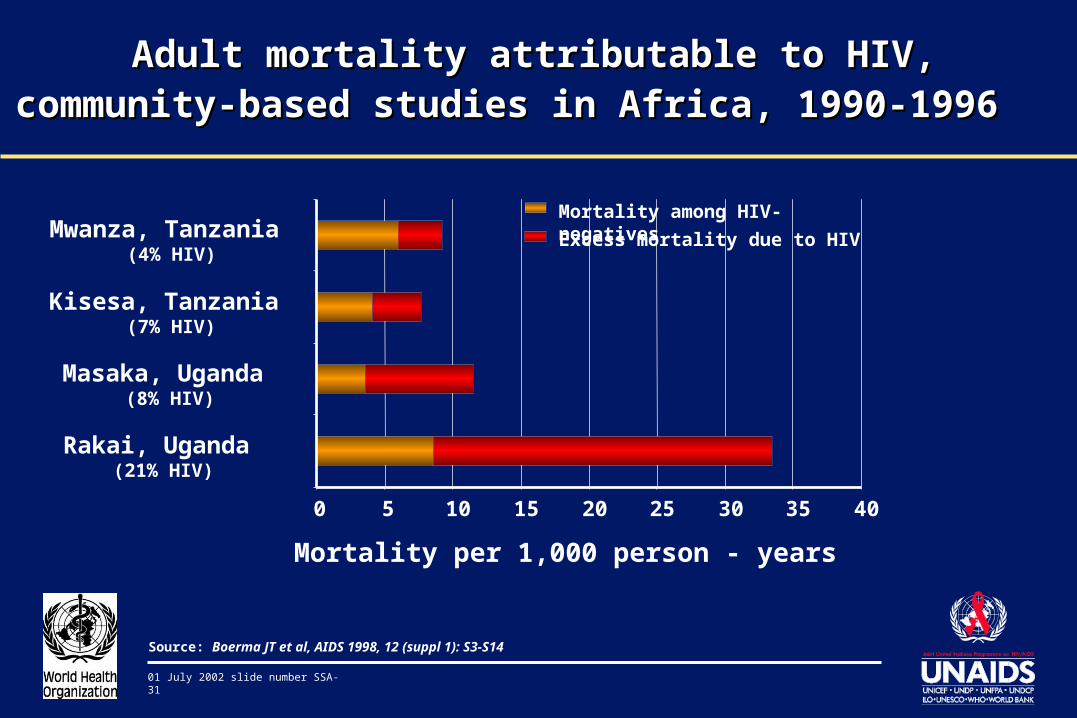
Adult mortality attributable to HIV, Adult mortality attributable to HIV, community-based studies in Africa, 1990-1996community-based studies in Africa, 1990-1996
Source: Boerma JT et al, AIDS 1998, 12 (suppl 1): S3-S14
0 5 10 15 20 25 30 35 40
Rakai, Uganda (21% HIV)
Masaka, Uganda (8% HIV)
Kisesa, Tanzania (7% HIV)
Mwanza, Tanzania (4% HIV)
Mortality per 1,000 person - years
Mortality among HIV-negatives
Excess mortality due to HIV
01 July 2002 slide number SSA-32
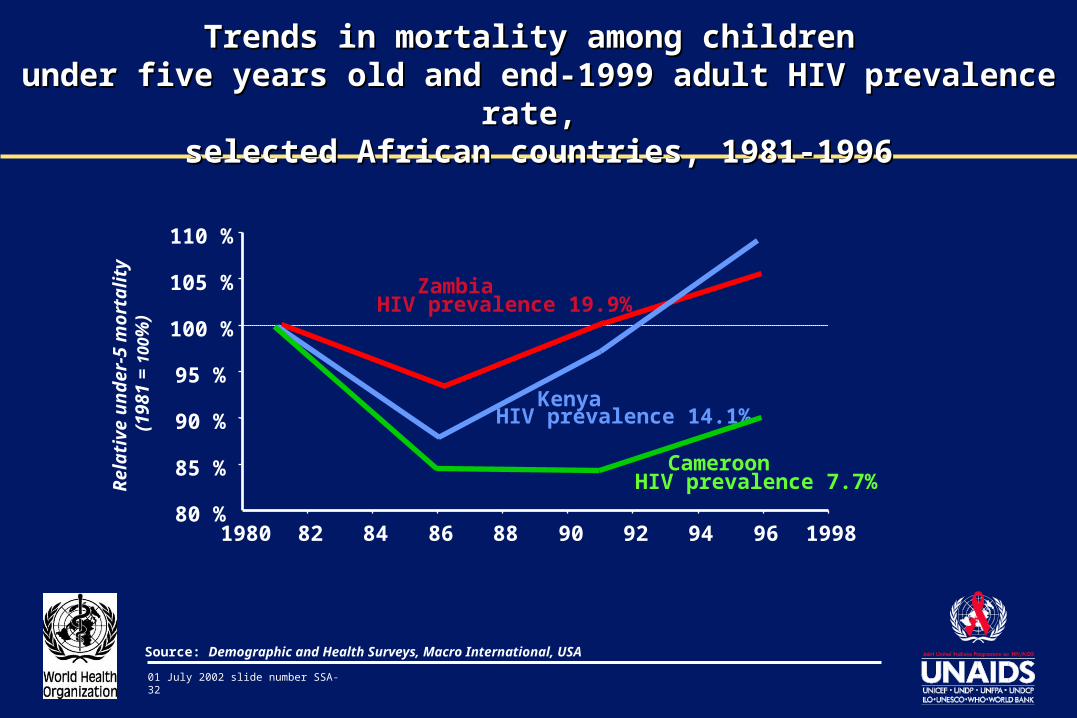
Trends in mortality among children Trends in mortality among children under five years old and end-1999 adult HIV prevalence rate, under five years old and end-1999 adult HIV prevalence rate,
selected African countries, 1981-1996selected African countries, 1981-1996
Source: Demographic and Health Surveys, Macro International, USA
KenyaHIV prevalence 14.1%
ZambiaHIV prevalence 19.9%
CameroonHIV prevalence 7.7%
80 %
85 %
90 %
95 %
100 %
105 %
110 %
1980 82 84 86 88 90 92 94 96 1998
Rel
ati
ve
un
der
-5 m
ort
alit
y
(198
1 =
10
0%
)
01 July 2002 slide number SSA-33
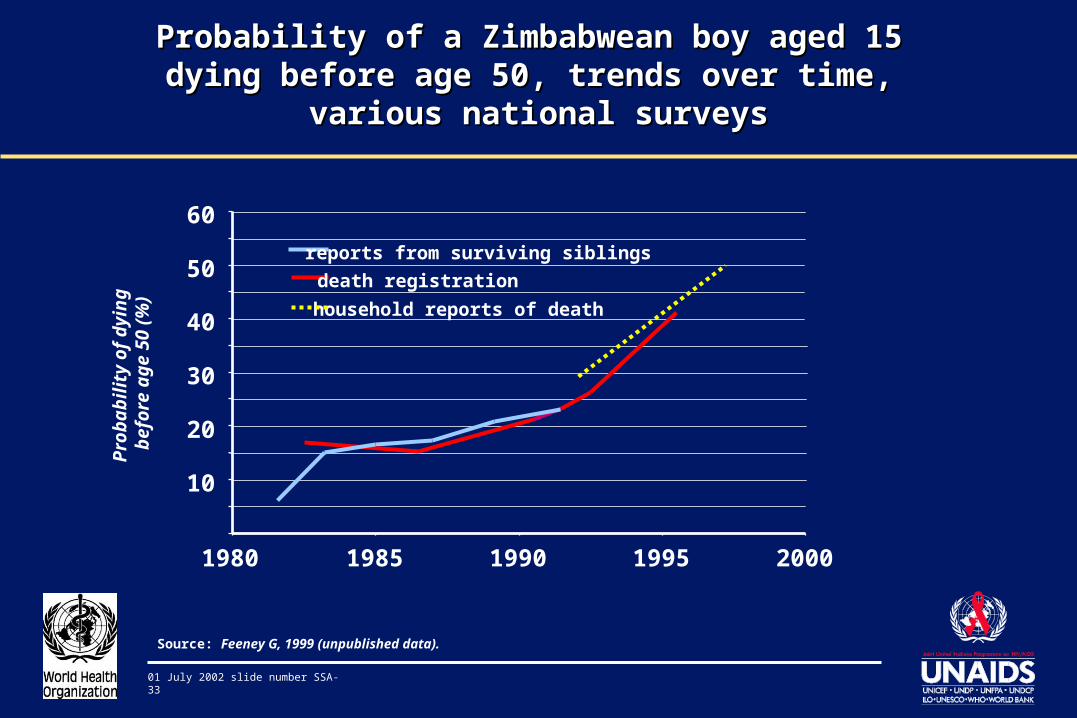
Probability of a Zimbabwean boy aged 15 Probability of a Zimbabwean boy aged 15 dying before age 50, trends over time, dying before age 50, trends over time,
various national surveysvarious national surveys
Source: Feeney G, 1999 (unpublished data).
10
20
30
40
50
60
1980 1985 1990 1995 2000
Pro
bab
ilit
y o
f d
yin
g
bef
ore
ag
e 50
(%
)
reports from surviving siblings
death registration
household reports of death
01 July 2002 slide number SSA-34
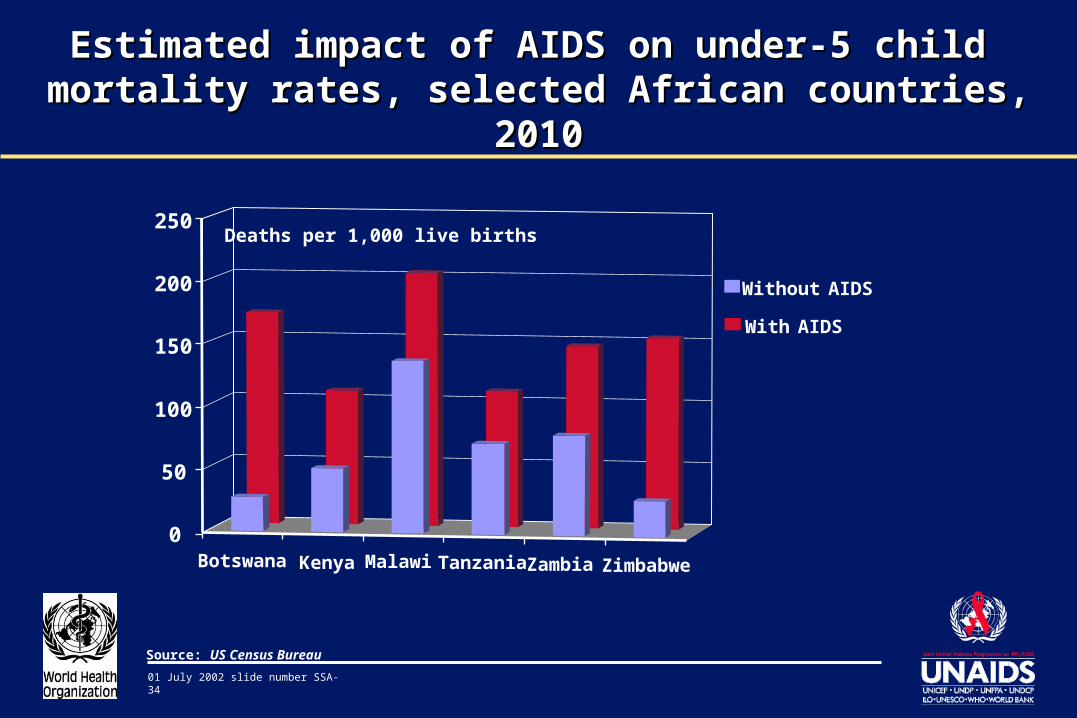
Estimated impact of AIDS on under-5 child Estimated impact of AIDS on under-5 child mortality rates, selected African countries, 2010mortality rates, selected African countries, 2010
Botswana Kenya Malawi Tanzania Zambia Zimbabwe
0
50
100
150
200
250Deaths per 1,000 live births
Without AIDS
With AIDS
Source: US Census Bureau
01 July 2002 slide number SSA-35
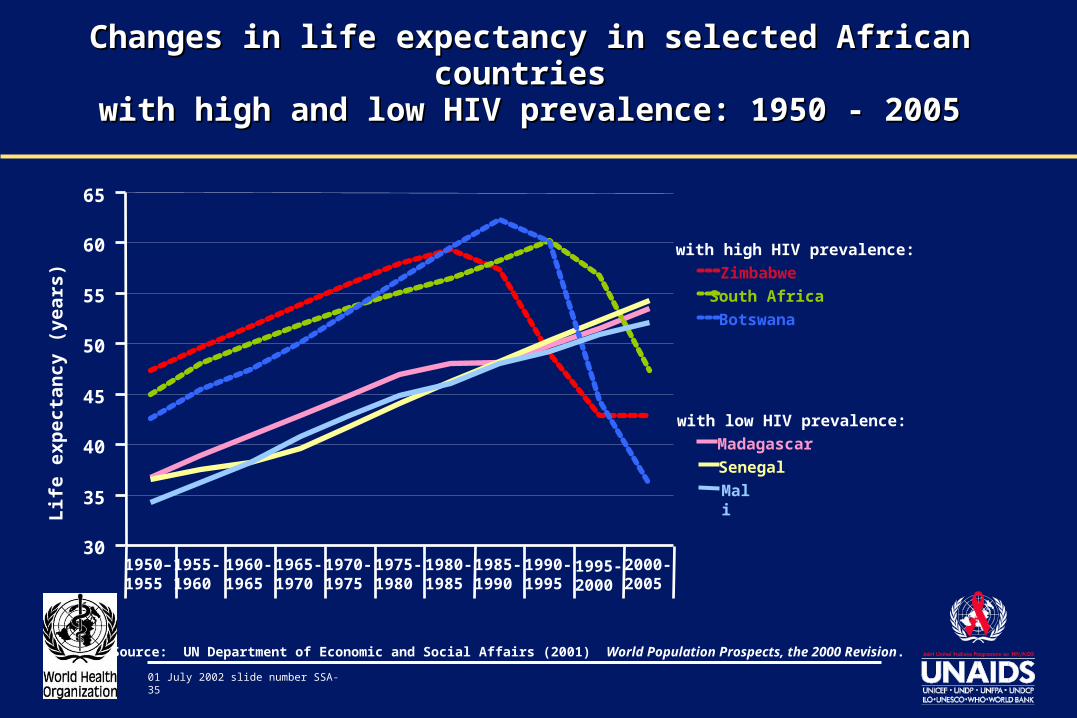
Changes in life expectancy in selected African countries Changes in life expectancy in selected African countries with high and low HIV prevalence: 1950 - 2005with high and low HIV prevalence: 1950 - 2005
with high HIV prevalence:
Zimbabwe
South Africa
Botswana
with low HIV prevalence:
Madagascar
Senegal
Mali
Source: UN Department of Economic and Social Affairs (2001) World Population Prospects, the 2000 Revision.
30
35
40
45
50
55
60
65
Lif
e e
xp
ecta
ncy
(y
ears
)
1950– 1955
1955- 1960
1960-1965
1965-1970
1970-1975
1975-1980
1980-1985
1985-1990
1990-1995
1995-2000
2000-2005
01 July 2002 slide number SSA-36
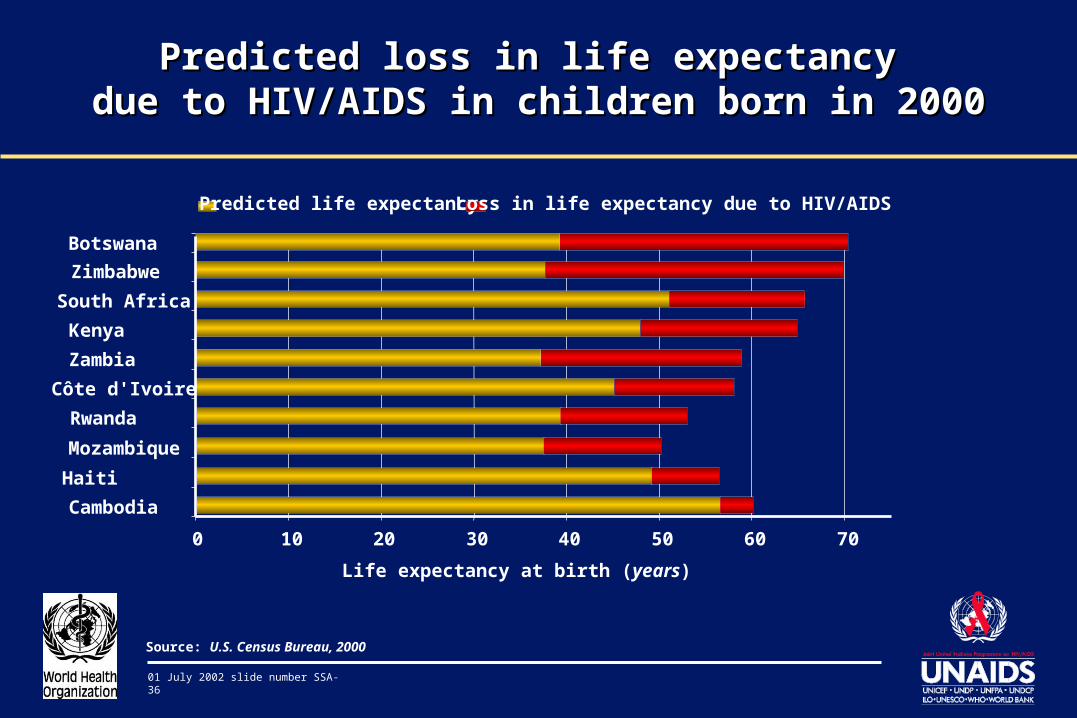
0 10 20 30 40 50 60 70
Cambodia
Haiti
Mozambique
Rwanda
Côte d'Ivoire
Zambia
Kenya
South Africa
Zimbabwe
Botswana
Life expectancy at birth (years)
Predicted life expectancy Loss in life expectancy due to HIV/AIDS
Source: U.S. Census Bureau, 2000
Predicted loss in life expectancy Predicted loss in life expectancy due to HIV/AIDS in children born in 2000due to HIV/AIDS in children born in 2000
01 July 2002 slide number SSA-37
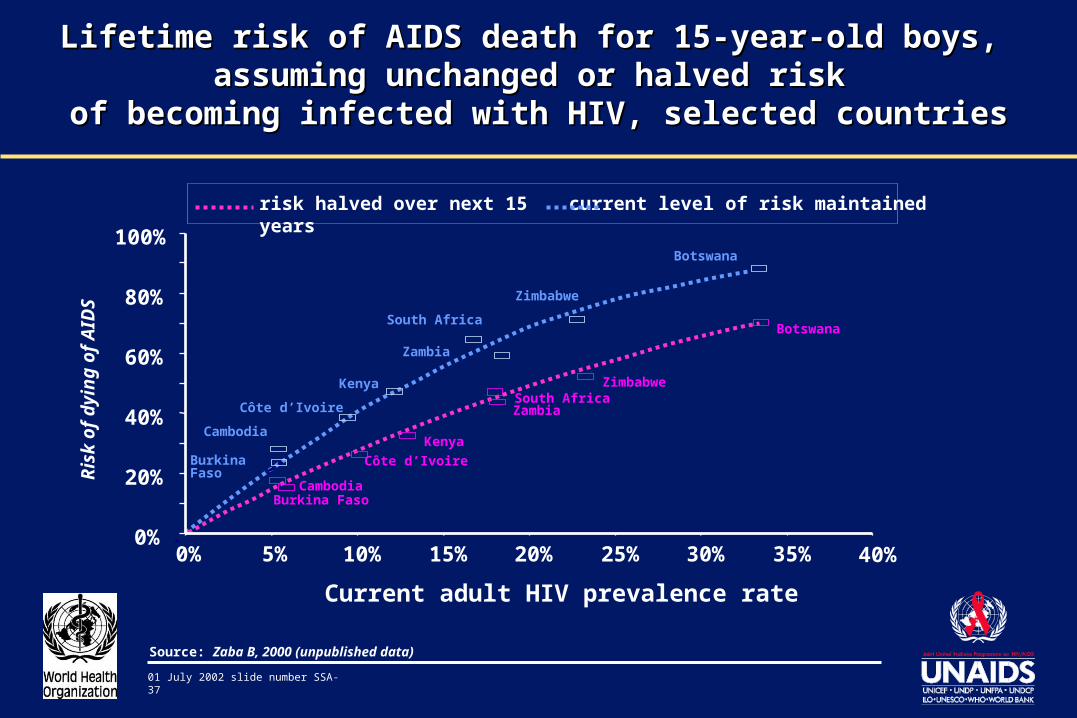
Lifetime risk of AIDS death for 15-year-old boys, Lifetime risk of AIDS death for 15-year-old boys, assuming unchanged or halved risk assuming unchanged or halved risk
of becoming infected with HIV, selected countriesof becoming infected with HIV, selected countries
Source: Zaba B, 2000 (unpublished data)
Current adult HIV prevalence rate
Burkina Faso
Cambodia
Côte d’Ivoire
Kenya
South Africa
Zambia
Zimbabwe
Botswana
Burkina FasoCambodia
Côte d’Ivoire
Kenya
South AfricaZambia
Zimbabwe
Botswana
0%
20%
40%
60%
80%
100%
0% 5% 10% 15% 20% 25% 30% 35% 40%
Ris
k o
f d
yin
g o
f A
IDS
risk halved over next 15 years
current level of risk maintained
01 July 2002 slide number SSA-38
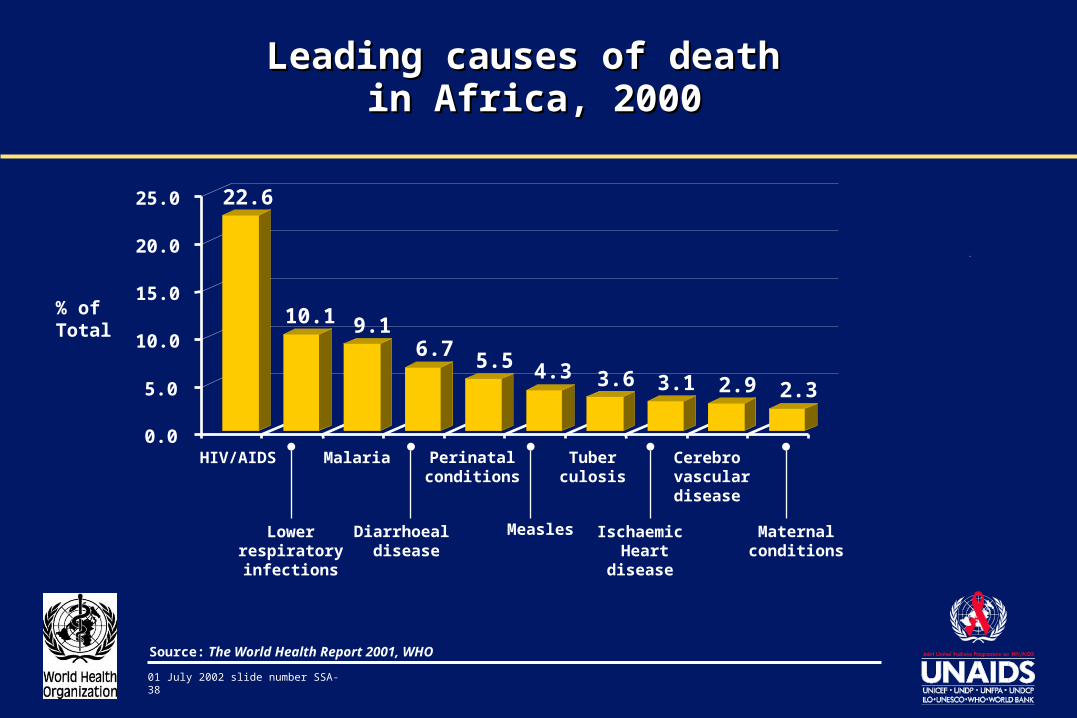
LeadingLeading causes of death causes of death in Africa, 2000in Africa, 2000
Source: The World Health Report 2001, WHO
22.6
10.1 9.16.7
5.5 4.3 3.6 3.1 2.9 2.3
0.0
5.0
10.0
15.0
20.0
25.0
HIV/AIDS Malaria Perinatalconditions
Tuberculosis
Cerebrovascular disease
Diarrhoeal disease
Lowerrespiratory infections
Measles Ischaemic Heart
disease
Maternalconditions
% ofTotal
01 July 2002 slide number SSA-39
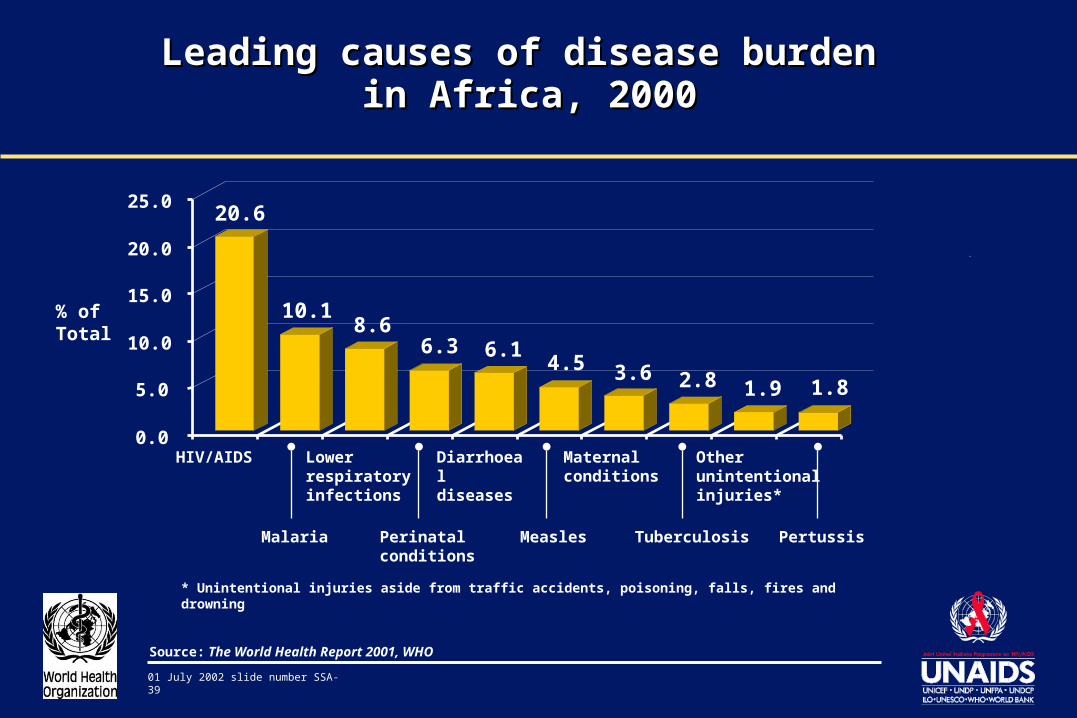
Leading causes of disease burden Leading causes of disease burden in Africa, 2000in Africa, 2000
Source: The World Health Report 2001, WHO
* Unintentional injuries aside from traffic accidents, poisoning, falls, fires and drowning
20.6
10.18.6
6.3 6.14.5 3.6 2.8 1.9 1.8
0.0
5.0
10.0
15.0
20.0
25.0
HIV/AIDS
Malaria
Lowerrespiratoryinfections
Perinatalconditions
Diarrhoealdiseases
Measles
Maternalconditions
Tuberculosis
Otherunintentionalinjuries*
Pertussis
% ofTotal
01 July 2002 slide number SSA-40
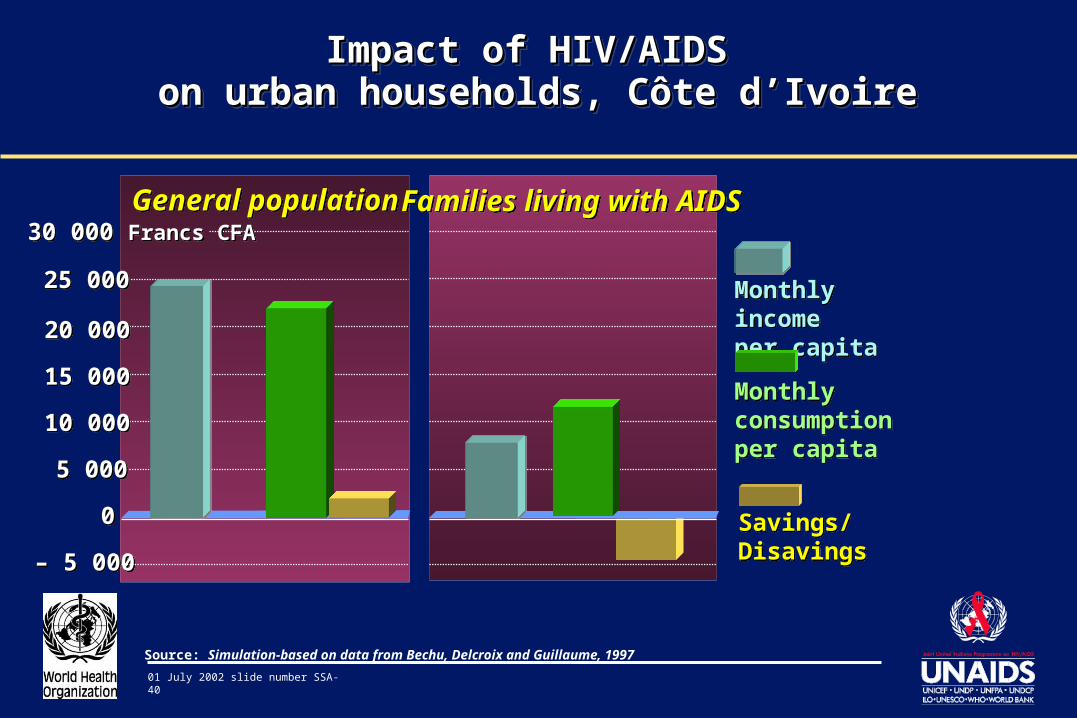
Impact of HIV/AIDS Impact of HIV/AIDS on urban households, Côte d’Ivoireon urban households, Côte d’Ivoire
Impact of HIV/AIDS Impact of HIV/AIDS on urban households, Côte d’Ivoireon urban households, Côte d’Ivoire
Source: Simulation-based on data from Bechu, Delcroix and Guillaume, 1997
General populationGeneral population Families living with AIDSFamilies living with AIDS
Monthly income per capitaMonthly income per capita
Monthly consumptionper capita
Monthly consumptionper capita
00
5 0005 000
10 00010 000
15 00015 000
20 00020 000
25 00025 000
– 5 000– 5 000
30 000 Francs CFA30 000 Francs CFA
Savings/DisavingsSavings/Disavings
01 July 2002 slide number SSA-41
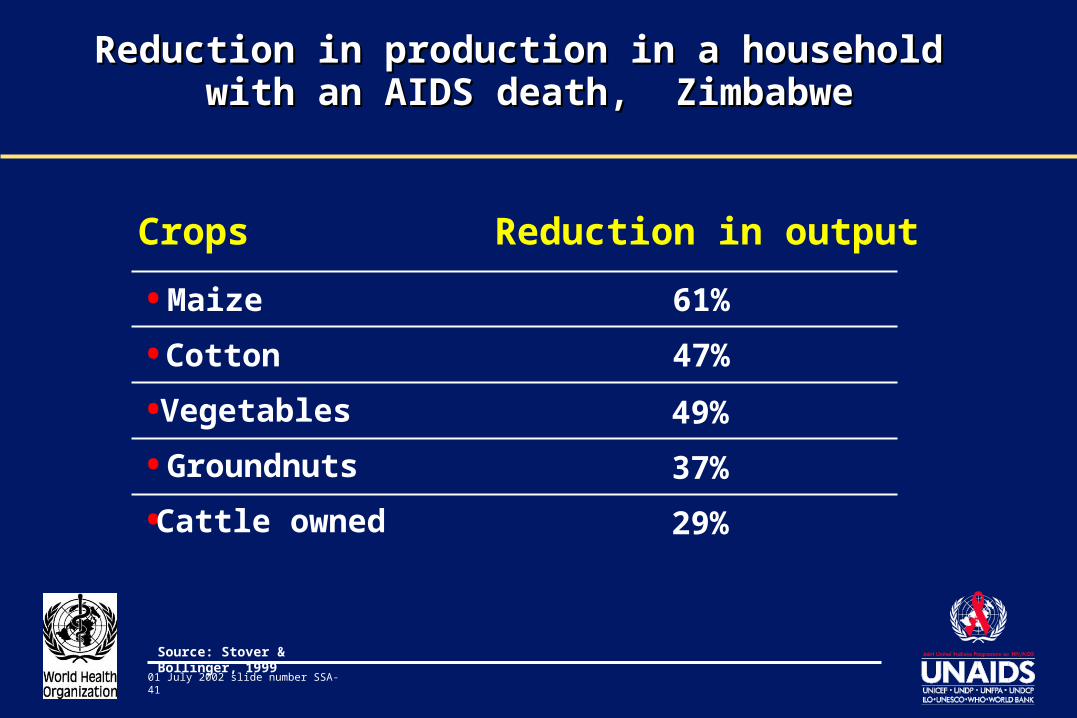
Reduction in production in a household Reduction in production in a household with an AIDS death, Zimbabwewith an AIDS death, Zimbabwe
Source: Stover & Bollinger, 1999
•
•
•
•
•
Crops Reduction in output
Maize
Cotton
Vegetables
Groundnuts
Cattle owned
49%
37%
29%
47%
61%
01 July 2002 slide number SSA-42
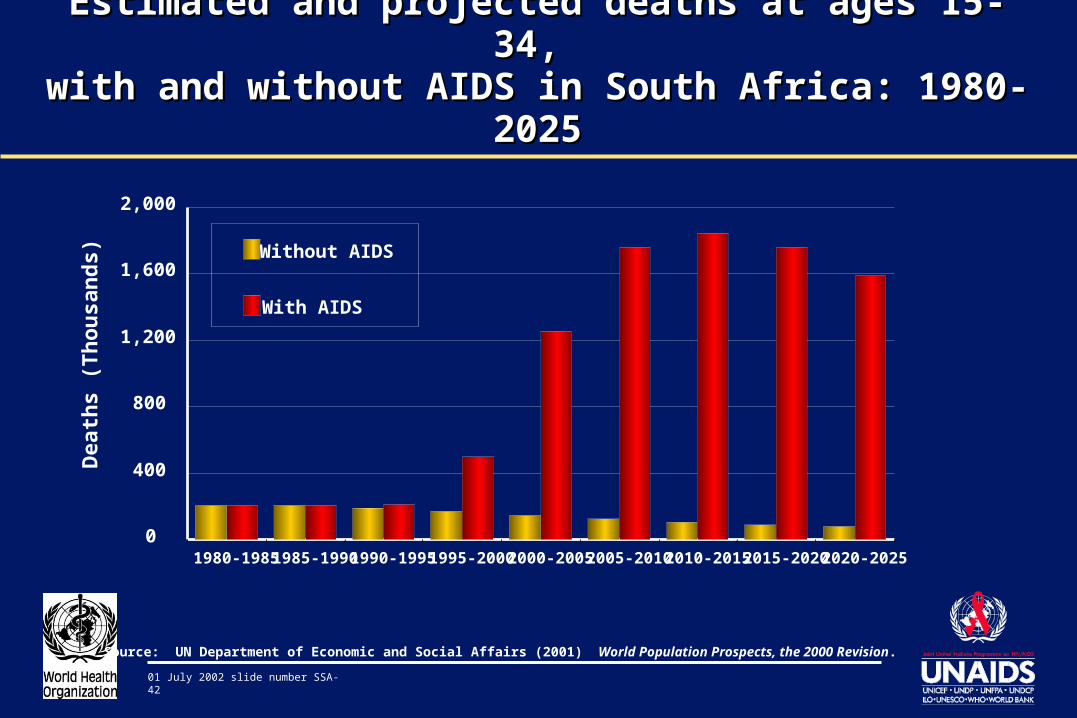
Estimated and projected deaths at ages 15-34, Estimated and projected deaths at ages 15-34, with and without AIDS in South Africa: 1980-2025with and without AIDS in South Africa: 1980-2025
0
400
800
1,200
1,600
2,000
Dea
ths
(Th
ou
san
ds)
1980-1985 1985-1990 1990-1995 1995-2000 2000-2005 2005-2010 2010-2015 2015-2020 2020-2025
Without AIDS
With AIDS
Source: UN Department of Economic and Social Affairs (2001) World Population Prospects, the 2000 Revision.
01 July 2002 slide number SSA-43
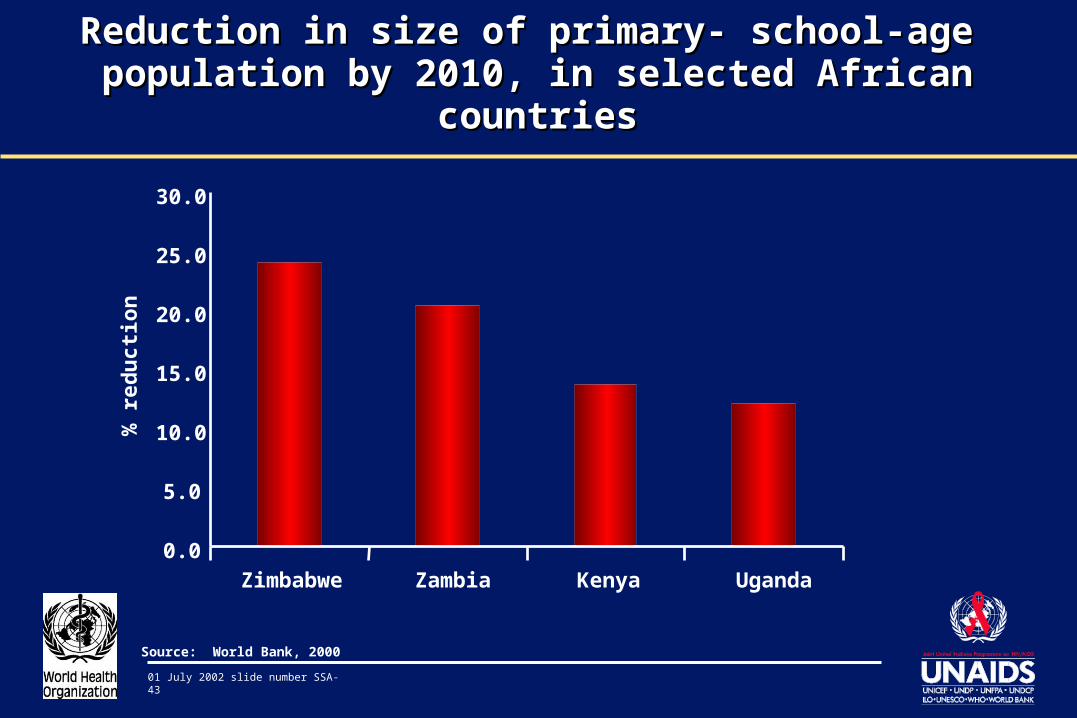
Reduction in size of primary- school-age Reduction in size of primary- school-age population by 2010, in selected African countriespopulation by 2010, in selected African countries
0.0
5.0
10.0
15.0
20.0
25.0
30.0
Zimbabwe Zambia Kenya Uganda
% r
edu
ctio
n
Source: World Bank, 2000
01 July 2002 slide number SSA-44
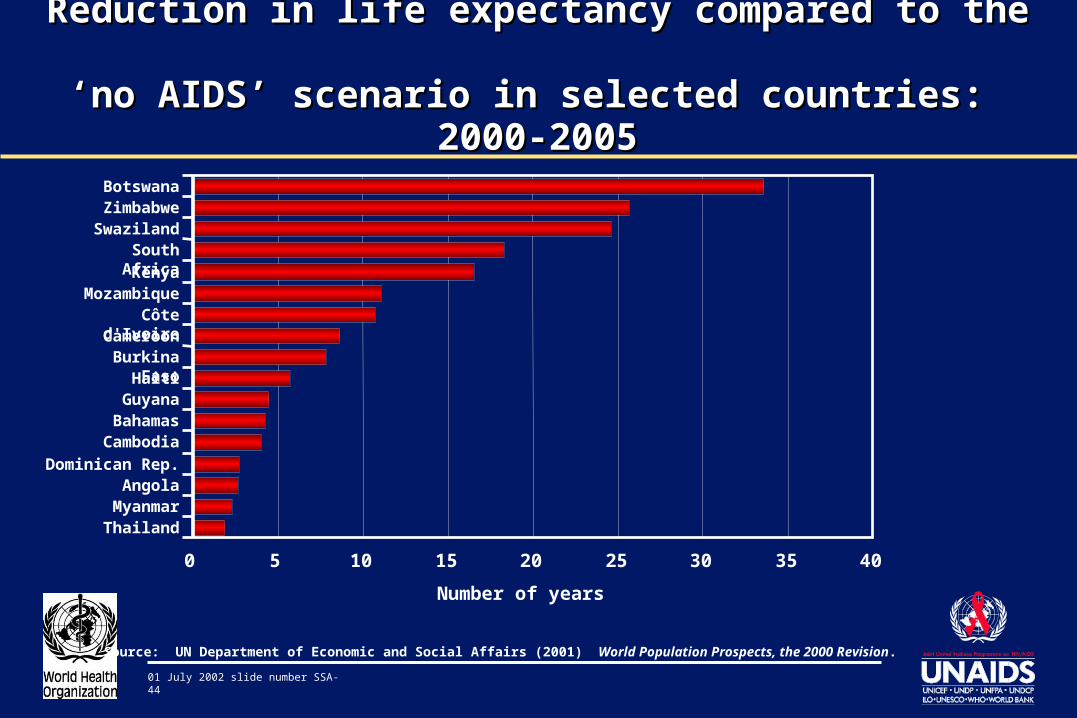
Reduction in life expectancy compared to the Reduction in life expectancy compared to the ‘no AIDS’ scenario in selected countries: 2000-2005‘no AIDS’ scenario in selected countries: 2000-2005
0 5 10 15 20 25 30 35 40
Number of years
ThailandMyanmar
AngolaDominican Rep.
CambodiaBahamas
GuyanaHaiti
Burkina FasoCameroon
Côte d'IvoireMozambique
Kenya
South AfricaSwazilandZimbabweBotswana
Source: UN Department of Economic and Social Affairs (2001) World Population Prospects, the 2000 Revision.
01 July 2002 slide number SSA-45
Knowledge and Behavior
01 July 2002 slide number SSA-46
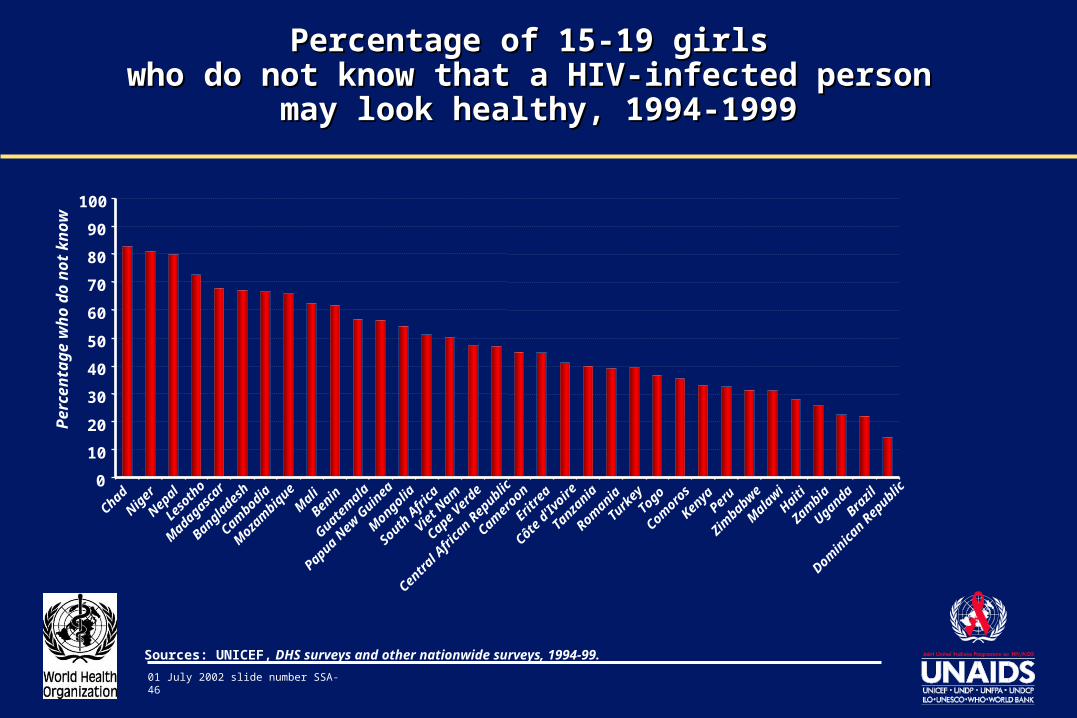
Percentage of 15-19 girls Percentage of 15-19 girls who do not know that a HIV-infected person who do not know that a HIV-infected person
may look healthy, 1994-1999may look healthy, 1994-1999
Sources: UNICEF, DHS surveys and other nationwide surveys, 1994-99.
0
10
20
30
40
50
60
70
80
90
100
Benin
Domin
ican
Rep
ublic
Camer
oon
Chad
Comoro
s
Côte d
'Ivoire
Brazil
Kenya
Mad
agas
car
Mal
awi
Mal
i
Moza
mbiq
ue
Haiti
Niger
Tanza
nia
Uganda
Zambia
Zimbab
we
Nepal
Lesoth
o
Bangla
desh
Cambodia
Guatem
ala
Papua
New G
uinea
Mongolia
South A
frica
Viet N
am
Cape
Verde
Centra
l Afri
can R
epublic
Eritre
a
Roman
ia
Turkey
TogoPer
u
Pe
rce
nta
ge
wh
o d
o n
ot
kn
ow
01 July 2002 slide number SSA-47
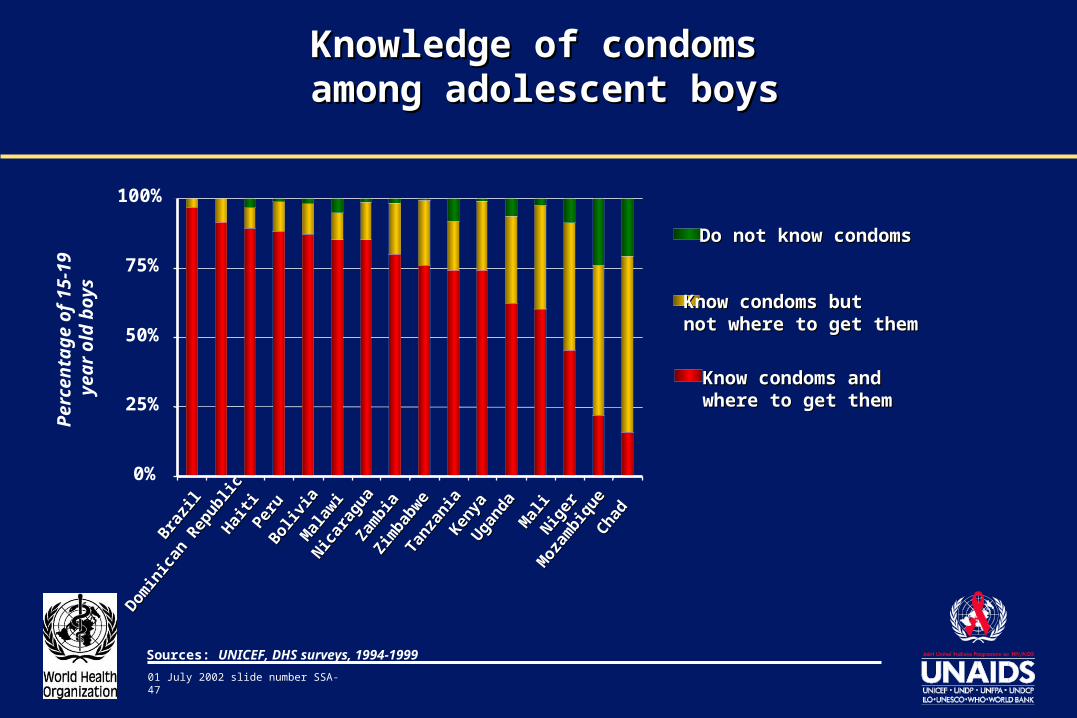
Knowledge of condoms Knowledge of condoms among adolescent boysamong adolescent boys
Sources: UNICEF, DHS surveys, 1994-1999
0%
25%
50%
75%
100%
Brazi
l
Brazi
l
Domin
ican
Rep
ublic
Domin
ican
Rep
ublic
Haiti
Haiti
Peru
Peru
Boliv
ia
Boliv
iaM
alaw
i
Mal
awi
Nicar
agua
Nicar
agua
Zam
bia
Zam
bia
Zim
babw
e
Zim
babw
eTa
nzan
ia
Tanz
ania
Kenya
Kenya
Ugand
a
Ugand
aM
ali
Mal
iNig
er
Niger
Moz
ambi
que
Moz
ambi
que
Chad
Chad
Do not know condomsDo not know condoms
Know condoms but Know condoms but not where to get themnot where to get them
Know condoms and Know condoms and where to get themwhere to get them
Per
cen
tag
e o
f 15
-19
yea
r o
ld b
oys
01 July 2002 slide number SSA-48
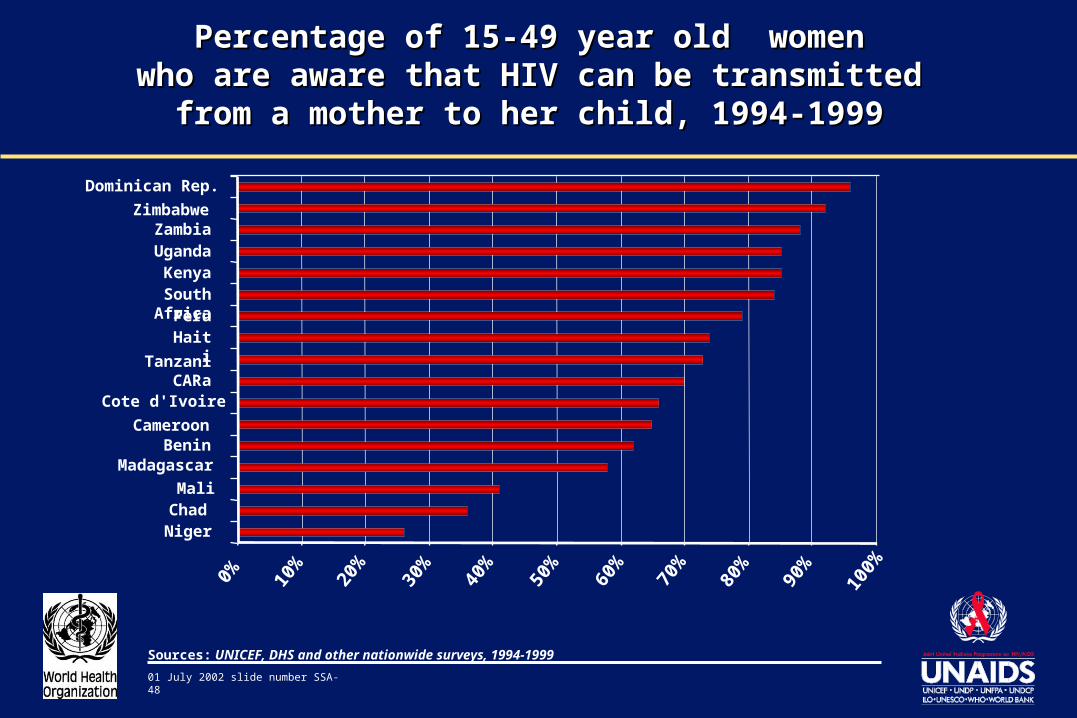
Percentage of 15-49 year old women Percentage of 15-49 year old women who are aware that HIV can be transmitted who are aware that HIV can be transmitted
from a mother to her child, 1994-1999 from a mother to her child, 1994-1999
Sources: UNICEF, DHS and other nationwide surveys, 1994-1999
Madagascar
NigerChad
Mali
BeninCameroon
Cote d'IvoireCAR
Tanzania
HaitiPeru
South AfricaKenya
UgandaZambia
Zimbabwe
Dominican Rep.
0% 10%
20%
30%
40%
50%
60%
70%
80%
90%
100%
01 July 2002 slide number SSA-49
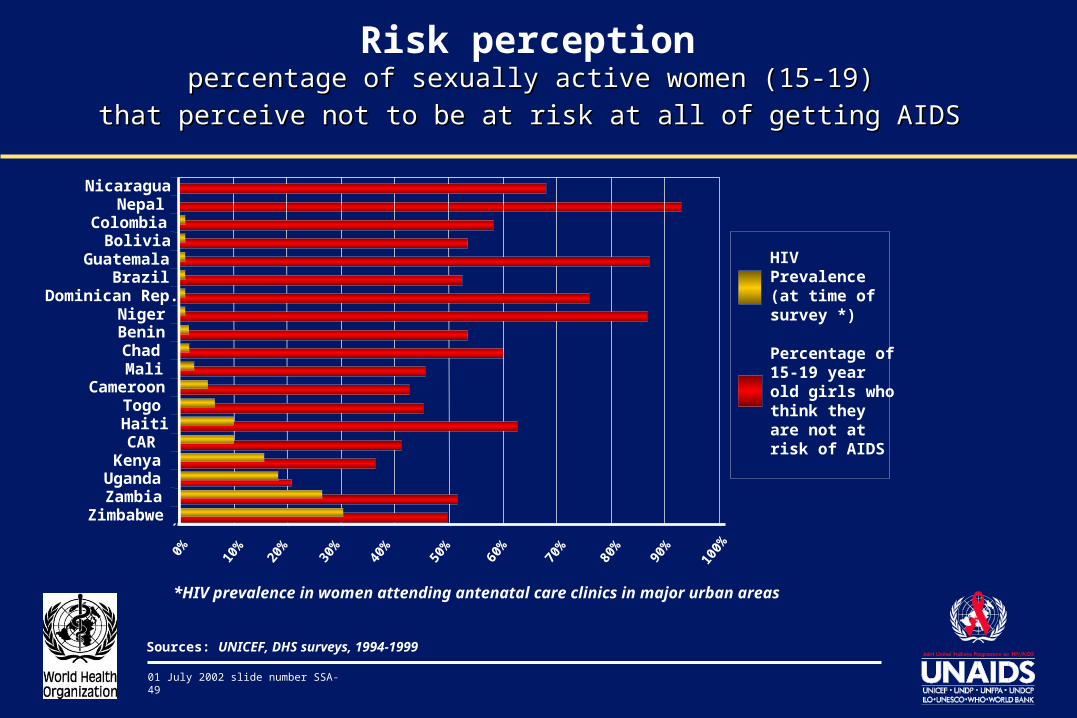
Risk perception percentage of sexually active women (15-19) percentage of sexually active women (15-19)
that perceive not to be at risk at all of getting AIDSthat perceive not to be at risk at all of getting AIDS
Sources: UNICEF, DHS surveys, 1994-1999
*HIV prevalence in women attending antenatal care clinics in major urban areas
ZimbabweZambiaUganda
KenyaCARHaiti
TogoCameroon
MaliChadBeninNiger
Dominican Rep.Brazil
GuatemalaBolivia
ColombiaNepal
Nicaragua0% 10%
20%
30%
40%
50%
60%
70%
80%
90%
100%
HIV Prevalence (at time of survey *)
Percentage of 15-19 year old girls who think they are not at risk of AIDS
01 July 2002 slide number SSA-50
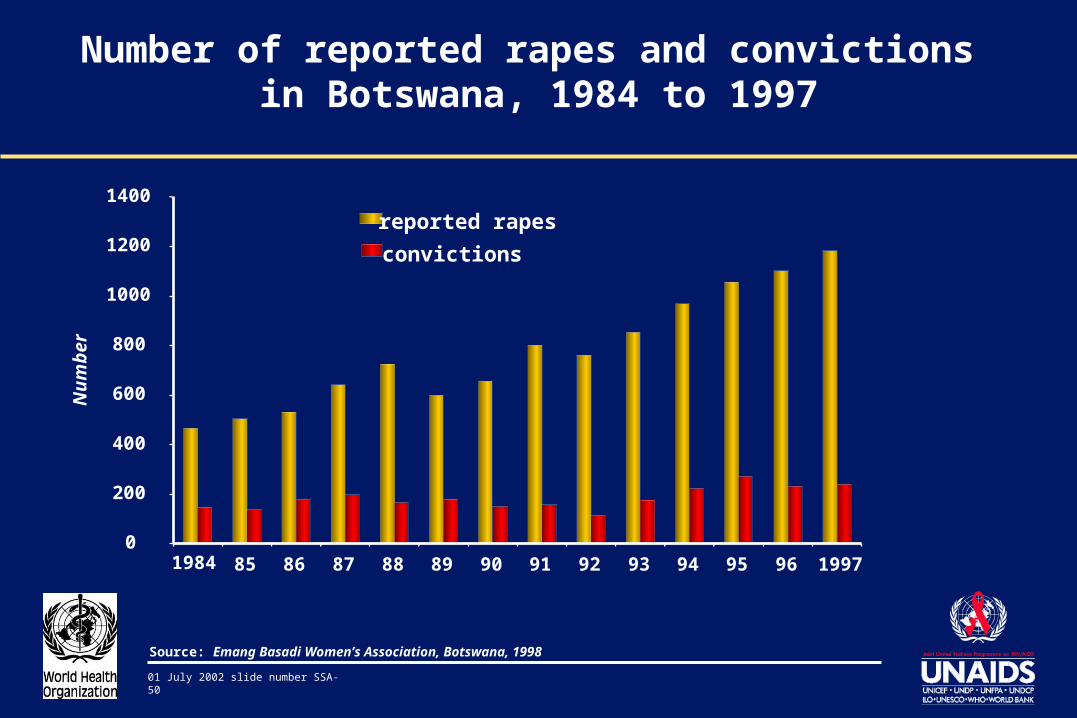
Number of reported rapes and convictions in Botswana, 1984 to 1997
Source: Emang Basadi Women’s Association, Botswana, 1998
0
200
400
600
800
1000
1200
1400
1984 85 86 87 88 89 90 91 92 93 94 95 96 1997
reported rapes
convictions
Nu
mb
er
01 July 2002 slide number SSA-51
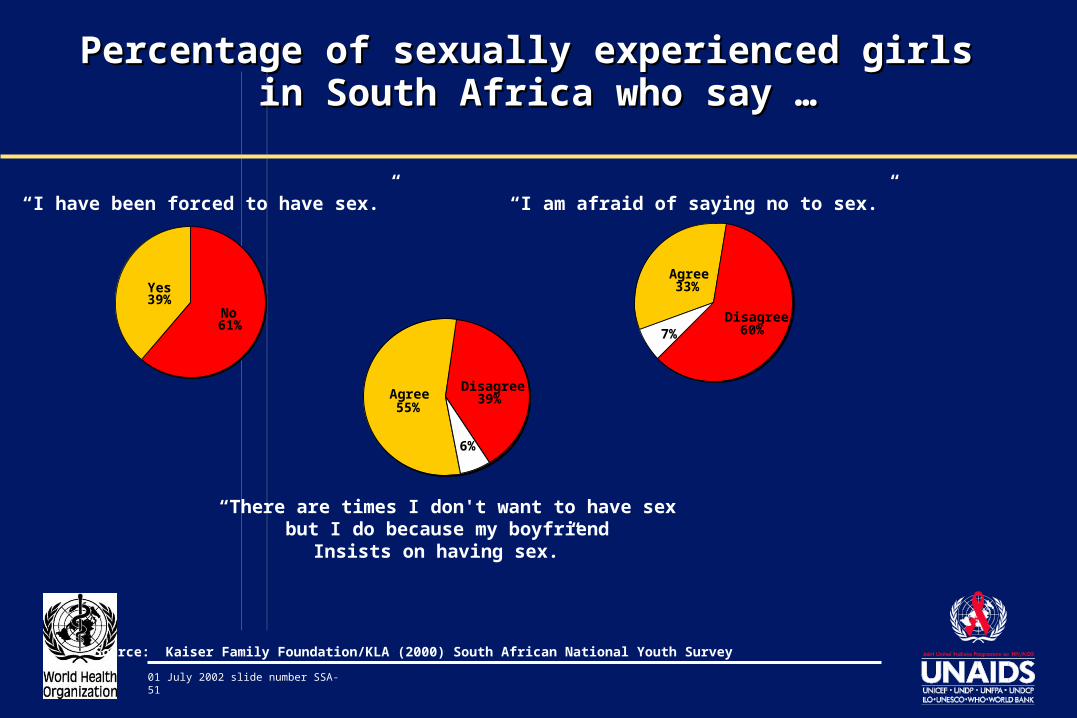
Percentage of sexually experienced girls Percentage of sexually experienced girls in South Africa who say …in South Africa who say …
No61%
Yes39%
“I have been forced to have sex.”
Agree33%
Disagree60%7%
“I am afraid of saying no to sex.”
Agree55%
Disagree39%
6%
“There are times I don't want to have sexbut I do because my boyfriend
Insists on having sex.”
Source: Kaiser Family Foundation/KLA (2000) South African National Youth Survey
01 July 2002 slide number SSA-52
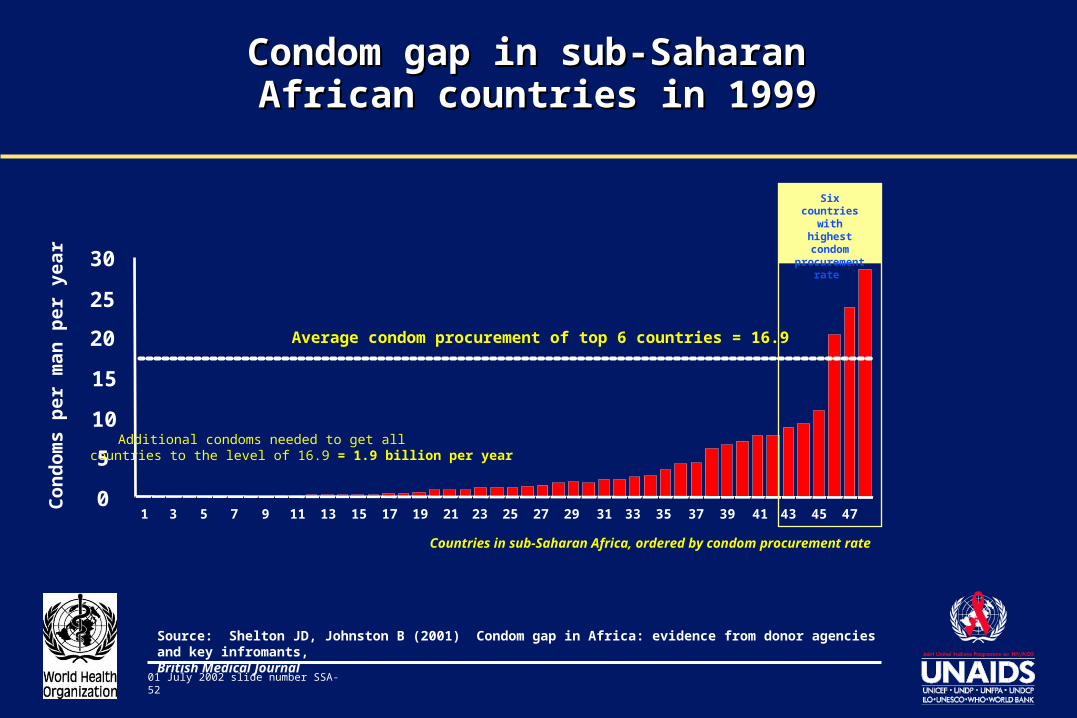
Condom gap in sub-Saharan Condom gap in sub-Saharan African countries in 1999African countries in 1999
Co
nd
om
s p
er m
an
pe
r ye
ar
0
5
10
15
20
25
30
1 3 5 7 9 11 13 15 17 19 21 23 25 27 29 31 33 35 37 39 41 43 45 47
Average condom procurement of top 6 countries = 16.9
Additional condoms needed to get all countries to the level of 16.9 = 1.9 billion per year
Countries in sub-Saharan Africa, ordered by condom procurement rate
Six countries with highest
condom procurement
rate
Source: Shelton JD, Johnston B (2001) Condom gap in Africa: evidence from donor agencies and key infromants, British Medical Journal
01 July 2002 slide number SSA-53
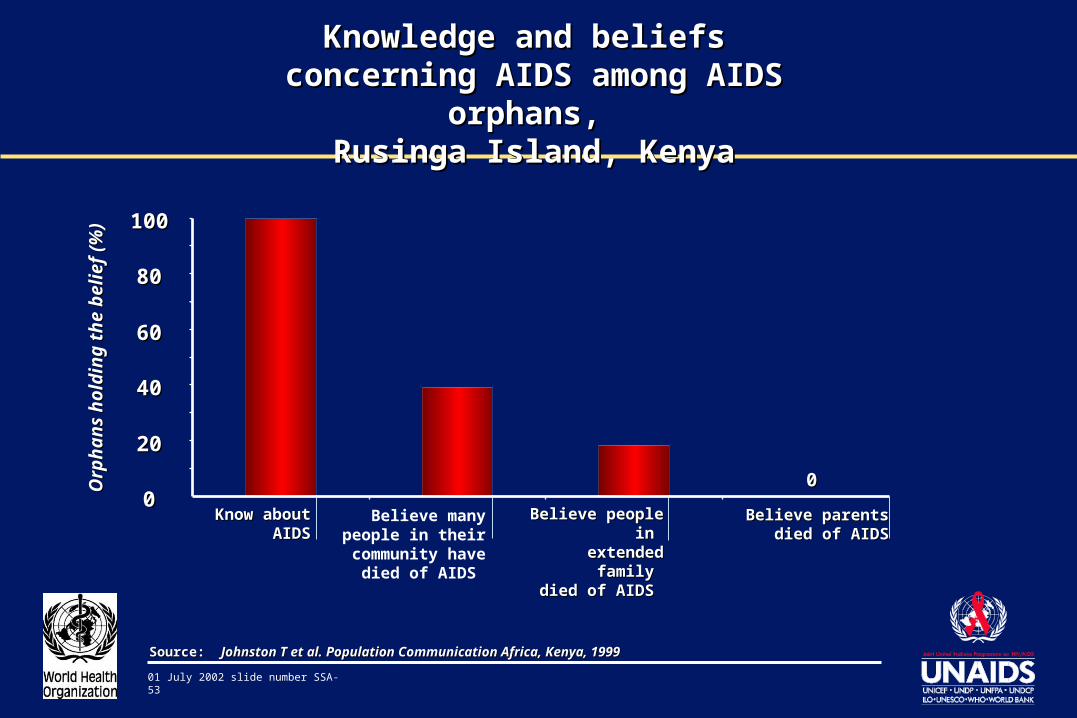
Knowledge and beliefs Knowledge and beliefs concerning AIDS among AIDS orphans, concerning AIDS among AIDS orphans,
Rusinga Island, KenyaRusinga Island, Kenya
Source: Source: Johnston T et al. Population Communication Africa, Kenya, 1999Johnston T et al. Population Communication Africa, Kenya, 1999
Believe parents Believe parents died of AIDS died of AIDS
0000
2020
4040
6060
8080
100100
Know aboutKnow aboutAIDSAIDS
Believe people in Believe people in extended family extended family
died of AIDS died of AIDS
Orp
han
s h
old
ing
th
e b
elie
f (%
)O
rph
ans
ho
ldin
g t
he
bel
ief
(%)
Believe many people in their
community have died of AIDS
01 July 2002 slide number SSA-54
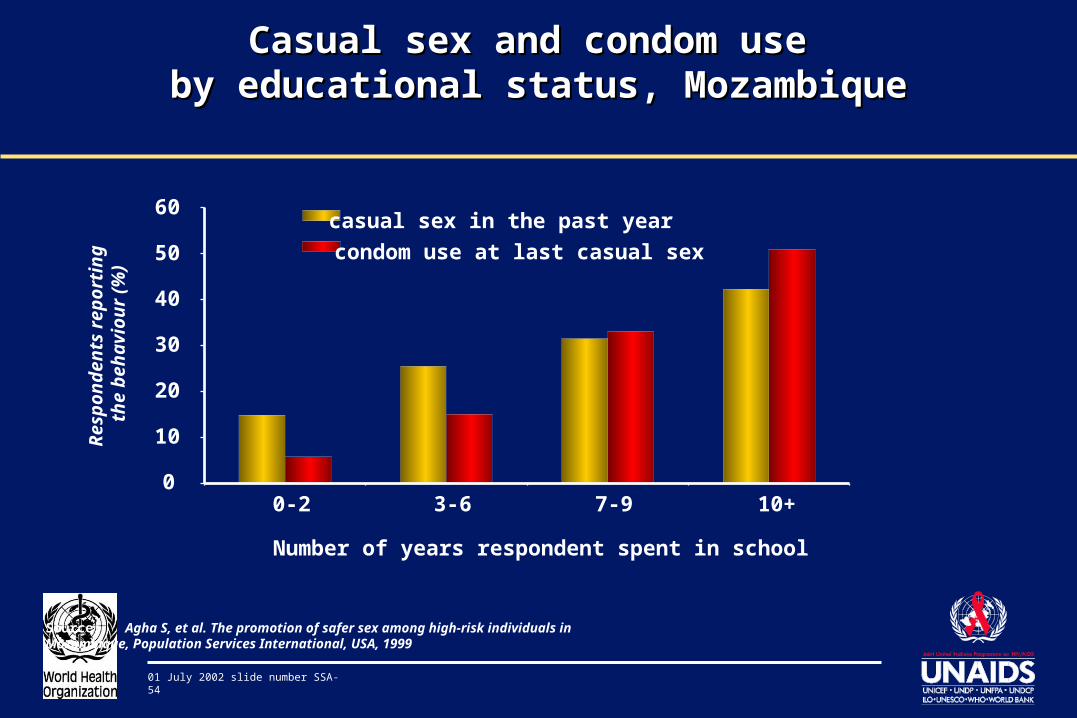
Casual sex and condom use Casual sex and condom use by educational status, Mozambiqueby educational status, Mozambique
Number of years respondent spent in school
Res
po
nd
ents
rep
ort
ing
th
e b
ehav
iou
r (%
)
0
10
20
30
40
50
60
0-2 3-6 7-9 10+
casual sex in the past year
condom use at last casual sex
Source: Agha S, et al. The promotion of safer sex among high-risk individuals in Mozambique, Population Services International, USA, 1999
01 July 2002 slide number SSA-55
Success Stories
01 July 2002 slide number SSA-56
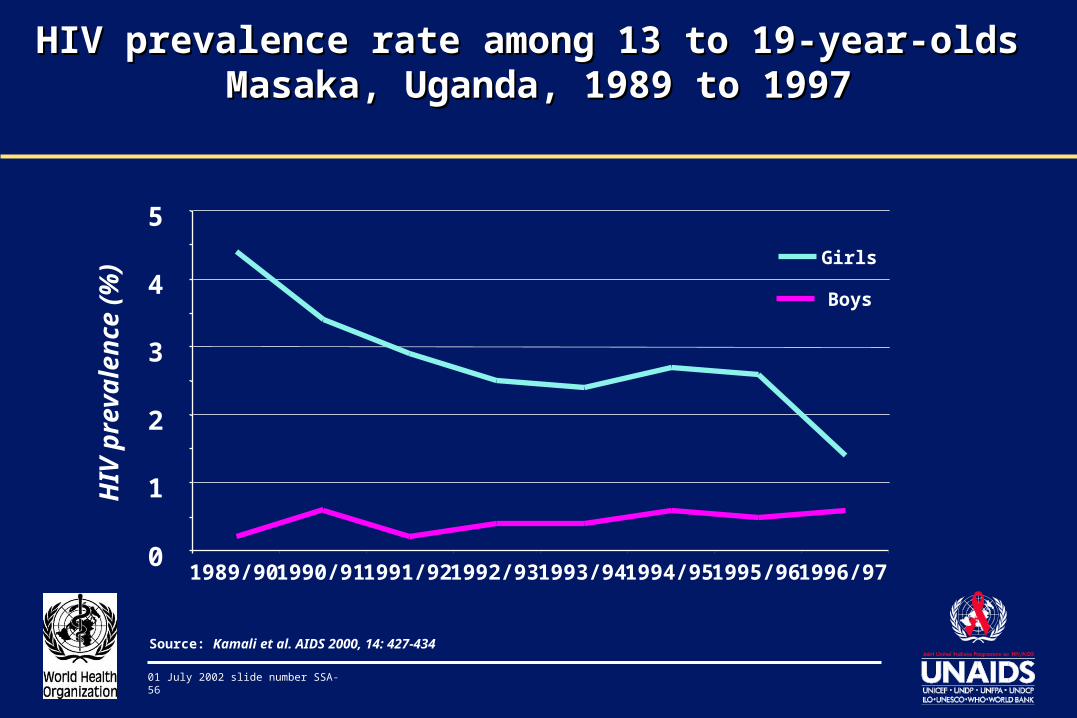
HIV prevalence rate among 13 to 19-year-olds HIV prevalence rate among 13 to 19-year-olds Masaka, Uganda, 1989 to 1997Masaka, Uganda, 1989 to 1997
Source: Kamali et al. AIDS 2000, 14: 427-434
0
1
2
3
4
5
1989/90 1990/91 1991/92 1992/93 1993/94 1994/95 1995/96 1996/97
Girls
Boys
HIV
pre
va
len
ce
(%)
01 July 2002 slide number SSA-57
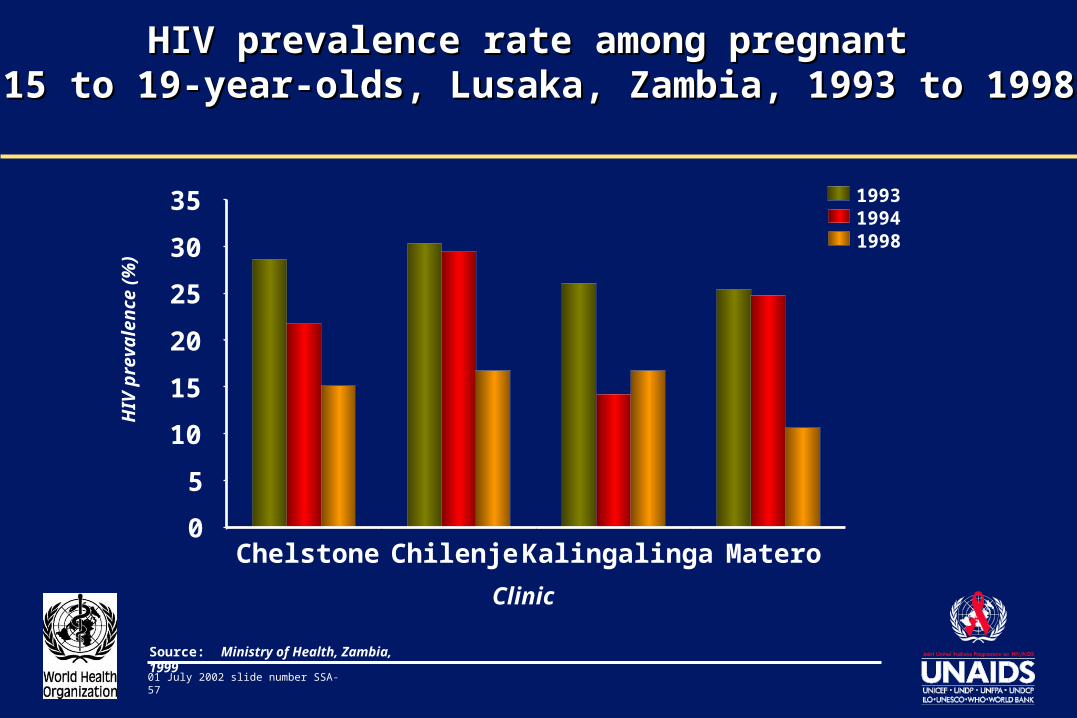
HIV prevalence rate among pregnant HIV prevalence rate among pregnant 15 to 19-year-olds, Lusaka, Zambia, 1993 to 199815 to 19-year-olds, Lusaka, Zambia, 1993 to 1998
Source: Ministry of Health, Zambia, 1999
0
5
10
15
20
25
30
35
Chelstone Chilenje Kalingalinga Matero
Clinic
199319941998
HIV
pre
vale
nc
e (%
)
01 July 2002 slide number SSA-58
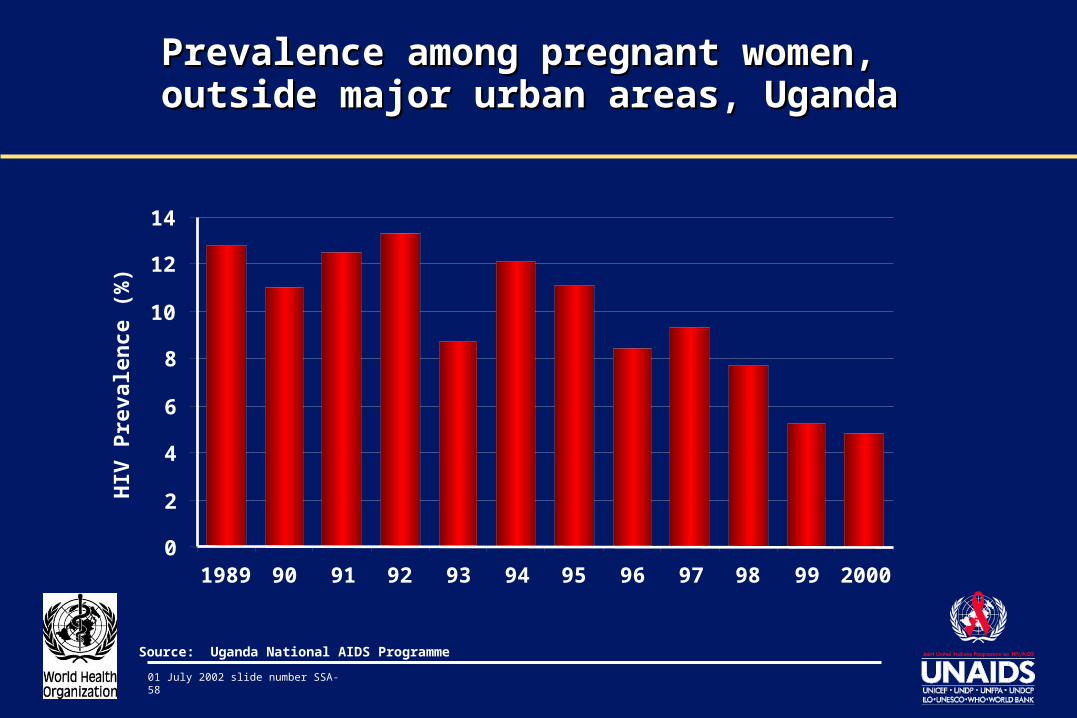
Prevalence among pregnant women, Prevalence among pregnant women, outside major urban areas, Ugandaoutside major urban areas, Uganda
Source: Uganda National AIDS Programme
0
2
4
6
8
10
12
14
1989 90 91 92 93 94 95 96 97 98 99 2000
HIV
Pre
vale
nce
(%
)
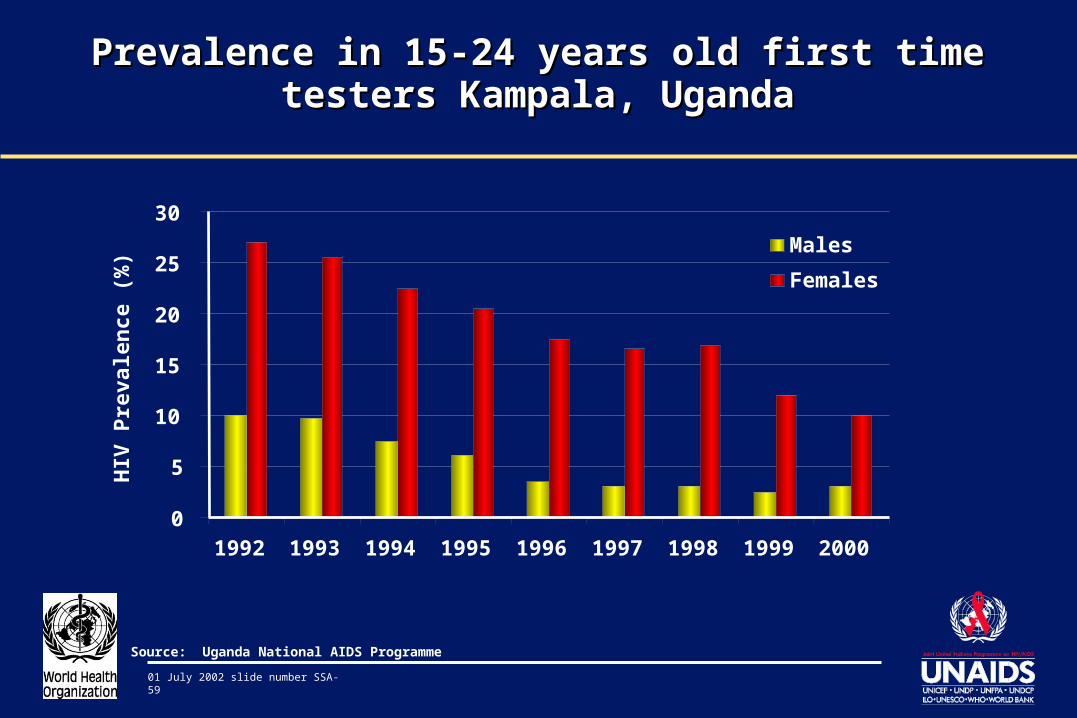
01 July 2002 slide number SSA-59
Prevalence in 15-24 years old first time testers Prevalence in 15-24 years old first time testers Kampala, UgandaKampala, Uganda
Source: Uganda National AIDS Programme
0
5
10
15
20
25
30
1992 1993 1994 1995 1996 1997 1998 1999 2000
Males
Females
HIV
Pre
vale
nce
(%
)
01 July 2002 slide number SSA-60
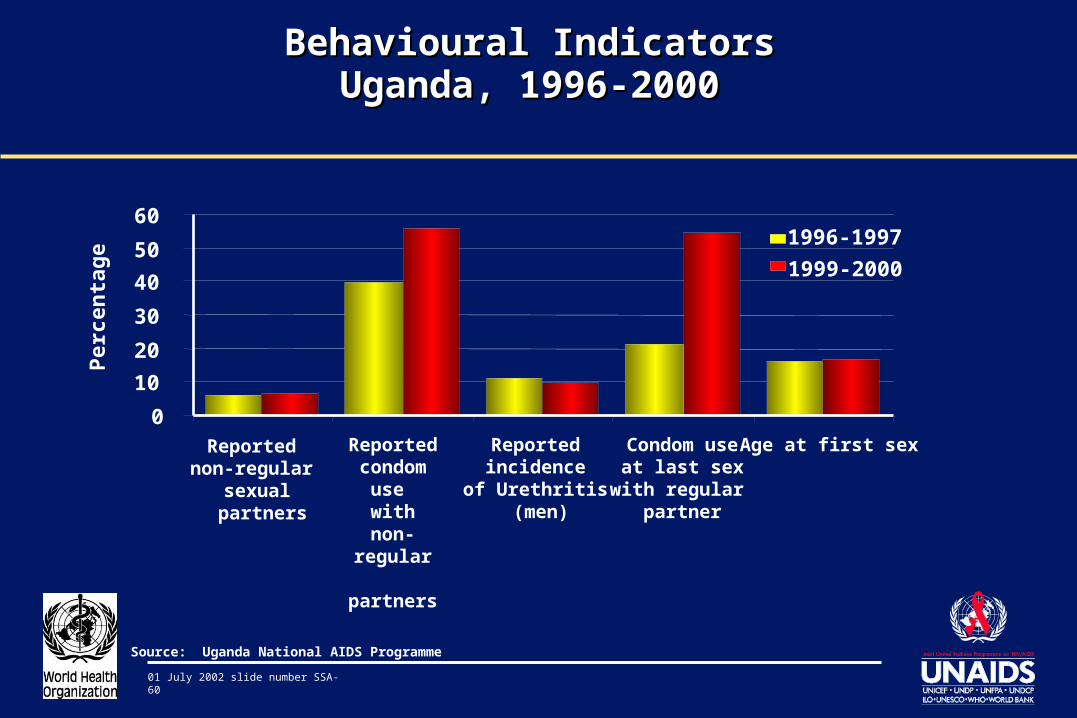
Behavioural IndicatorsBehavioural IndicatorsUganda, 1996-2000Uganda, 1996-2000
Source: Uganda National AIDS Programme
1996-1997
1999-2000
0
10
20
30
40
50
60
Reported non-regular
sexual partners
Per
cen
tag
e
Reported condom
use with non-regular
partners
Reported incidence
of Urethritis (men)
Condom use at last sex with regular
partner
Age at first sex
01 July 2002 slide number SSA-61
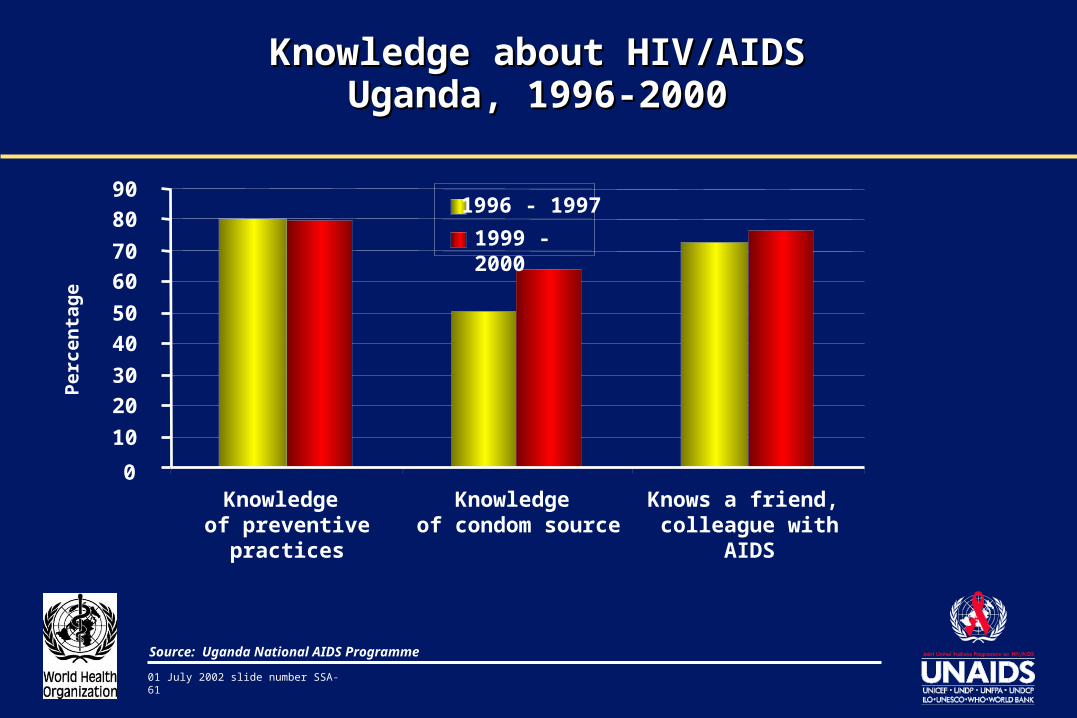
Knowledge about HIV/AIDSKnowledge about HIV/AIDSUganda, 1996-2000Uganda, 1996-2000
Source: Uganda National AIDS Programme
10
20
30
40
50
60
70
80
90
Knowledge of preventive practices
Knowledge of condom source
Knows a friend, colleague with AIDS
Per
cen
tag
e
0
1996 - 1997
1999 - 2000
01 July 2002 slide number SSA-62
% H
IV s
ero
po
siti
ve
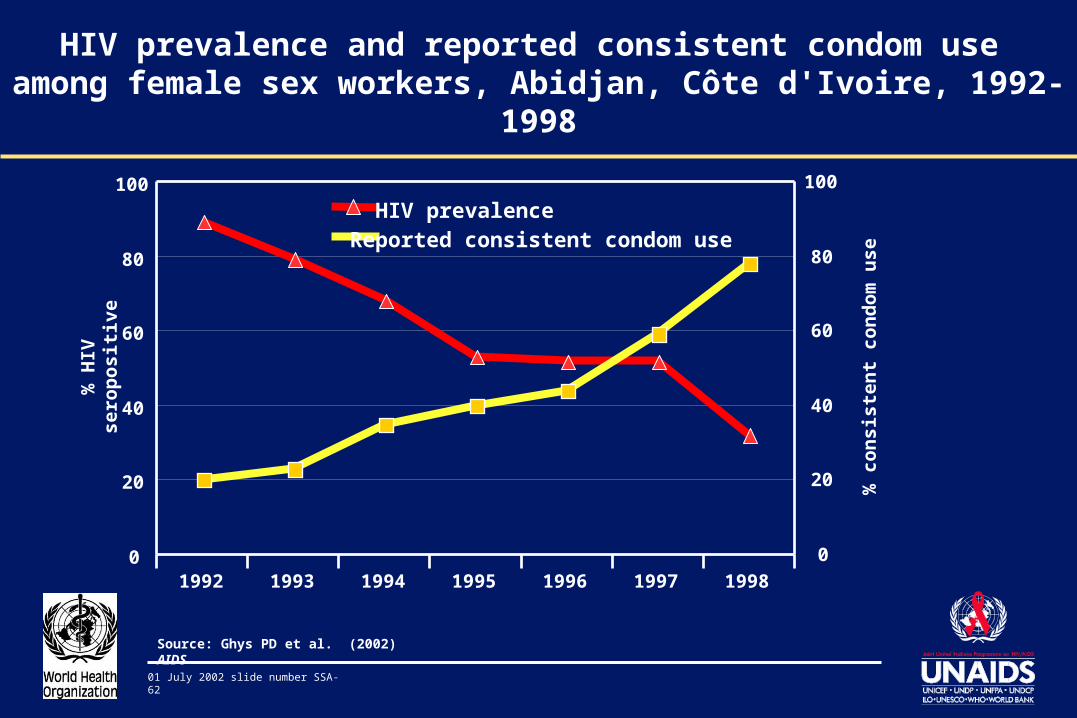
HIV prevalence and reported consistent condom use among female sex workers, Abidjan, Côte d'Ivoire, 1992-1998
% c
on
sist
en
t co
nd
om
use
0
20
40
60
80
100
0
20
40
60
80
100
1992 1993 1994 1995 1996 1997 1998
HIV prevalenceReported consistent condom use
Source: Ghys PD et al. (2002) AIDS
01 July 2002 slide number SSA-63
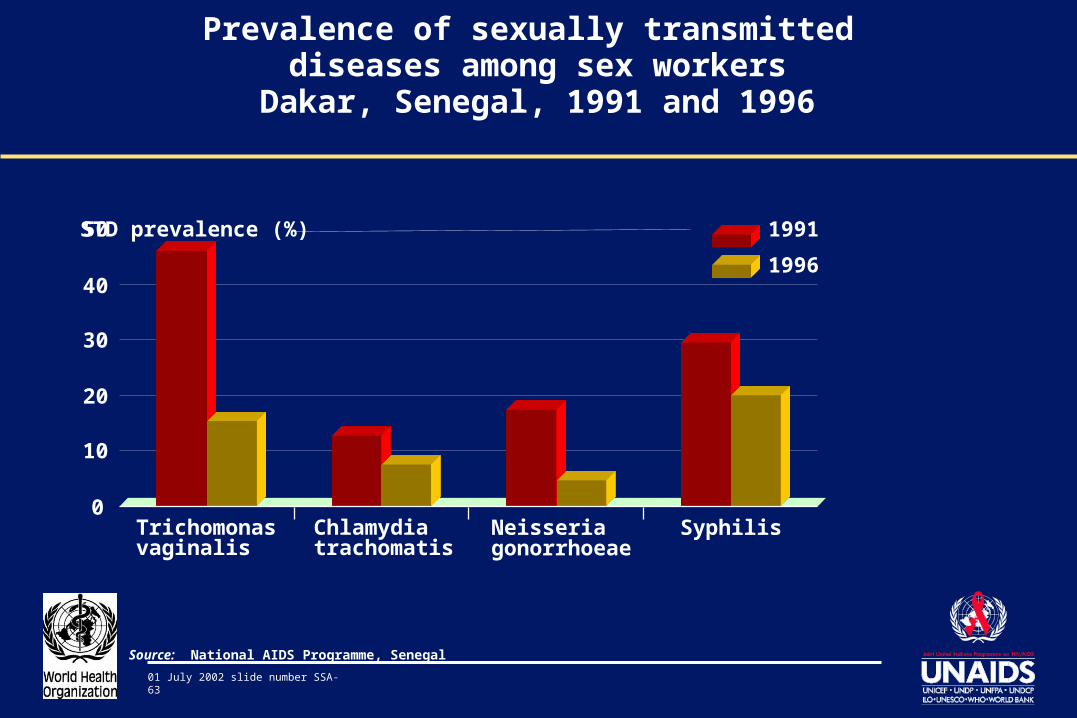
Prevalence of sexually transmitted diseases among sex workers
Dakar, Senegal, 1991 and 1996
Source: National AIDS Programme, Senegal
0
10
20
30
40
50
Trichomonas vaginalis
Chlamydia trachomatis
Neisseria gonorrhoeae
Syphilis
STD prevalence (%) 1991
1996
01 July 2002 slide number SSA-64
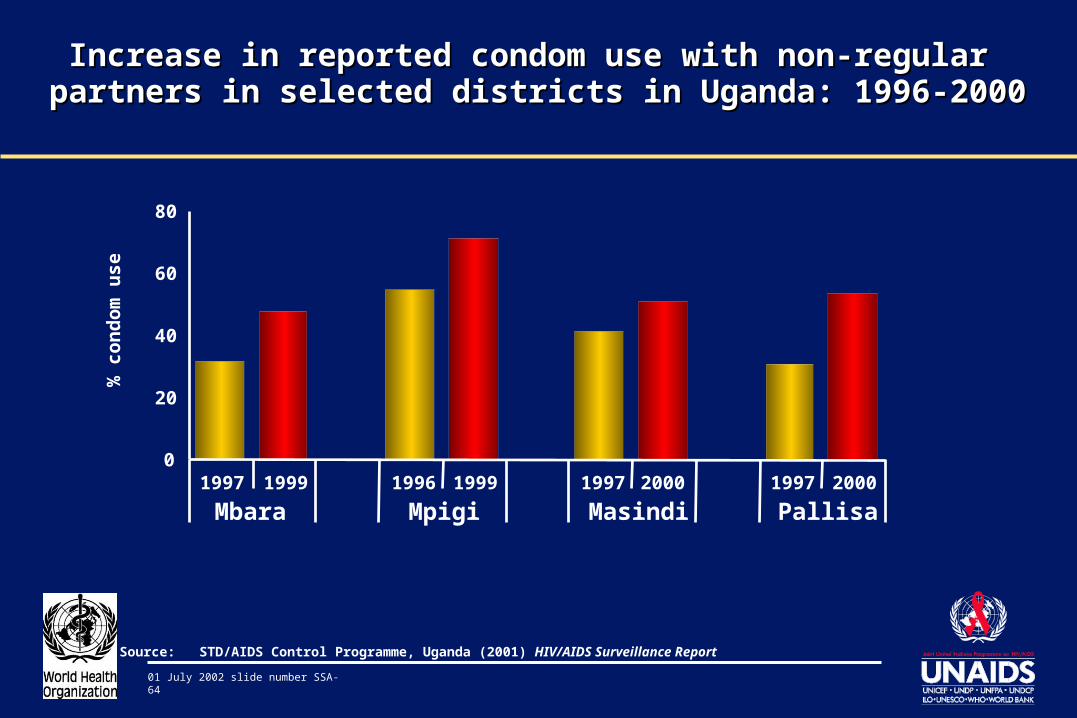
Increase in reported condom use with non-regular Increase in reported condom use with non-regular partners in selected districts in Uganda: 1996-2000partners in selected districts in Uganda: 1996-2000
0
20
40
60
80
% c
on
do
m u
se
Source: STD/AIDS Control Programme, Uganda (2001) HIV/AIDS Surveillance Report
1997 1999 1996 1999 1997 2000 1997 2000
Mbara Mpigi Masindi Pallisa
01 July 2002 slide number SSA-65
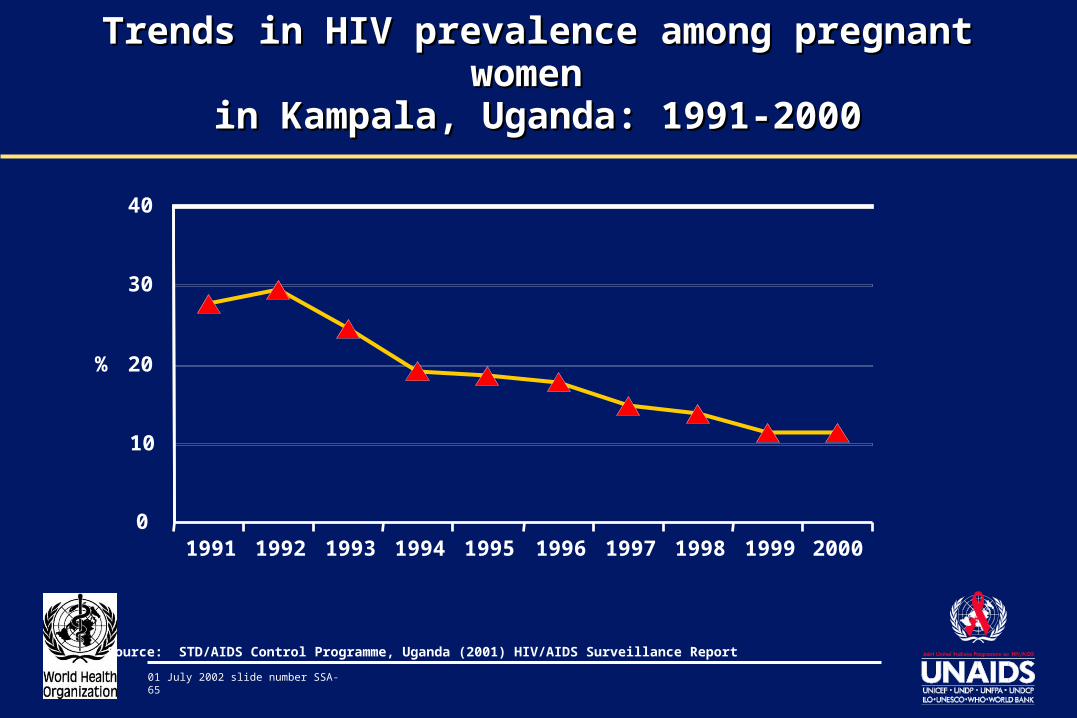
Trends in HIV prevalence among pregnant women Trends in HIV prevalence among pregnant women in Kampala, Uganda: 1991-2000in Kampala, Uganda: 1991-2000
0
10
20
30
40
1991 1992 1993 1994 1995 1996 1997 1998 1999 2000
%
Source: STD/AIDS Control Programme, Uganda (2001) HIV/AIDS Surveillance Report
01 July 2002 slide number SSA-66
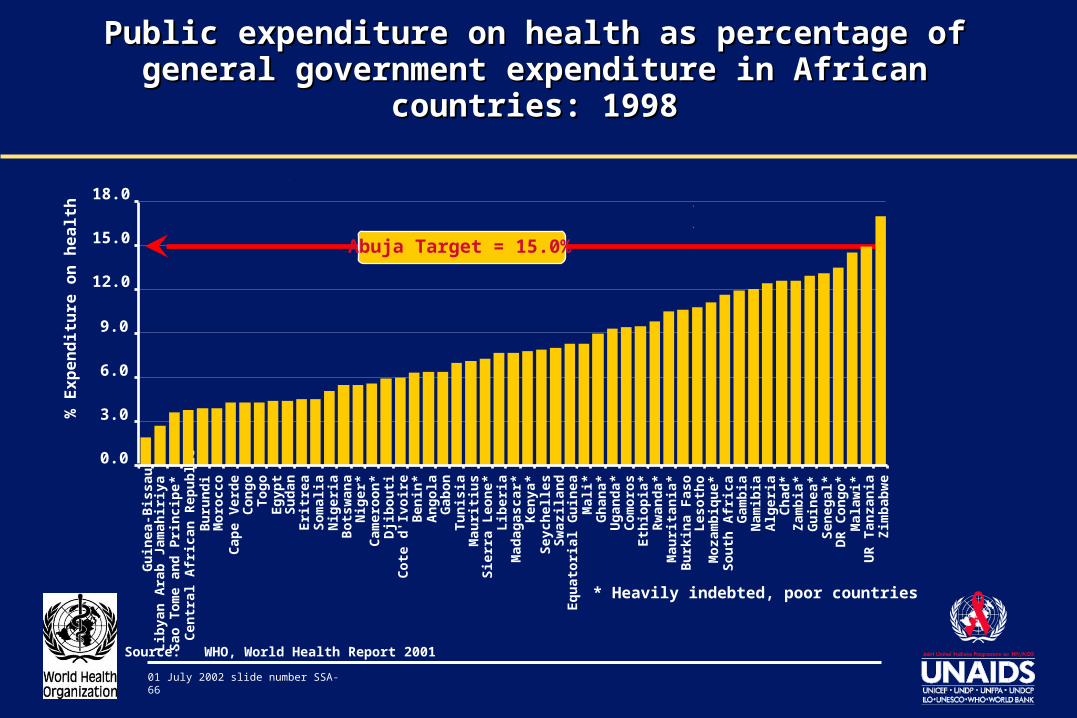
Public expenditure on health as percentage of general Public expenditure on health as percentage of general government expenditure in African countries: 1998government expenditure in African countries: 1998
Source: WHO, World Health Report 2001
Sao
Tom
e an
d Pr
inci
pe*
Bur
undi
Mor
occo
Cap
e Ve
rde
Con
goTo
goEg
ypt
Suda
nEr
itrea
Som
alia
Nig
eria
Bot
swan
aN
iger
*C
amer
oon*
Cot
e d'
Ivoi
reB
enin
*
Gab
onTu
nisi
a
Mad
agas
car*
Ken
ya*
Seyc
helle
sSw
azila
nd
Mal
i*G
hana
*U
gand
a*C
omor
osEt
hiop
ia*
Rw
anda
*M
aurit
ania
*B
urki
na F
aso
Leso
tho
Moz
ambi
que*
Gam
bia
Nam
ibia
Cha
d*Za
mbi
a*G
uine
a*Se
nega
l*D
R C
ongo
*M
alaw
i*U
R T
anza
nia
Zim
babw
e
Liby
an A
rab
Jam
ahiri
ya
Djib
outi
Ang
ola
Mau
ritiu
sSi
erra
Leo
ne*
Libe
ria
Equa
toria
l Gui
nea
Sout
h A
fric
a
Alg
eria
* Heavily indebted, poor countries
% E
xp
en
dit
ure
on
he
alt
h
Gui
nea-
Bis
sau*
Cen
tral
Afr
ican
Rep
ublic
*
0.0
3.0
6.0
9.0
12.0
15.0
18.0
Abuja Target = 15.0%