Embed Size (px)
Citation preview
030516 Quiz 7 Properties
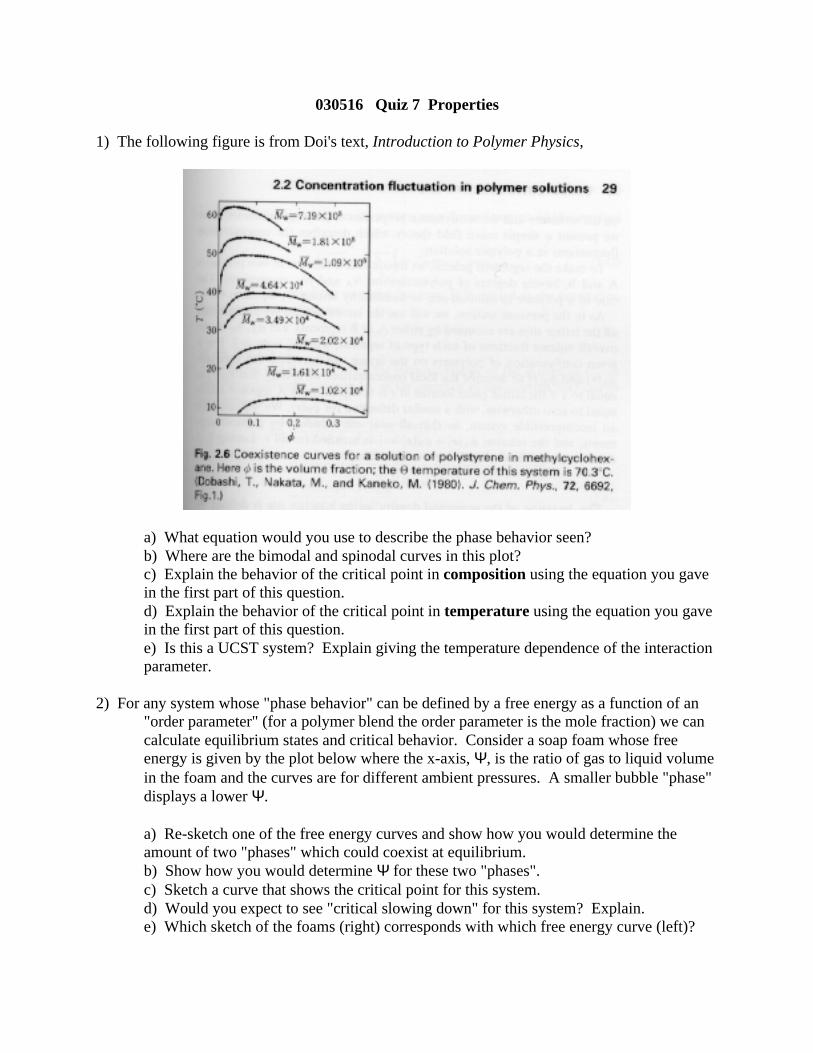
1) The following figure is from Doi's text, Introduction to Polymer Physics,
a) What equation would you use to describe the phase behavior seen?b) Where are the bimodal and spinodal curves in this plot?c) Explain the behavior of the critical point in composition using the equation you gavein the first part of this question.d) Explain the behavior of the critical point in temperature using the equation you gavein the first part of this question.e) Is this a UCST system? Explain giving the temperature dependence of the interactionparameter.
2) For any system whose "phase behavior" can be defined by a free energy as a function of an"order parameter" (for a polymer blend the order parameter is the mole fraction) we cancalculate equilibrium states and critical behavior. Consider a soap foam whose freeenergy is given by the plot below where the x-axis, Ψ, is the ratio of gas to liquid volumein the foam and the curves are for different ambient pressures. A smaller bubble "phase"displays a lower Ψ.
a) Re-sketch one of the free energy curves and show how you would determine theamount of two "phases" which could coexist at equilibrium.b) Show how you would determine Ψ for these two "phases".c) Sketch a curve that shows the critical point for this system.d) Would you expect to see "critical slowing down" for this system? Explain.e) Which sketch of the foams (right) corresponds with which free energy curve (left)?

2
Vainchtein, DL, Haef, H Physics of Fluids 13 2152 (2001).
3
ANSWERS: 030516 Quiz 7 Properties
1) a) kTfm φ( ) = kTφ lnφ( )
N+ 1− φ( )l n 1− φ( ) + φ 1− φ( )χ
setting the first derivative with respect to φ to 0 yields the binodal curve:
χ =N 1+ ln 1−φ( )( ) − 1+ ln φ( )
N 1− 2φ( )=
z∆E
kTBinodal
b) The curves shown are binodal curves. The spinodal curves are within the bimodal curves butare not shown.c and d) The critical point in composition follows the first and third derivatives set equal to 0.This yields:
φ c =1
1+ N ; χc =
K
Tc
=1
21+
1
N
2
so as N decreases, the critical volume fraction increases and the critical temperature decreases.This is seen by the upper point in the U shaped phase diagrams which decays in T with N andincreases in composition with decreasing N.
e) This is a UCST system since the critical point is at the highest temperature of the miscibilitylimit. The temperature dependence of the interaction parameter follows K/T with K being apositive constant.
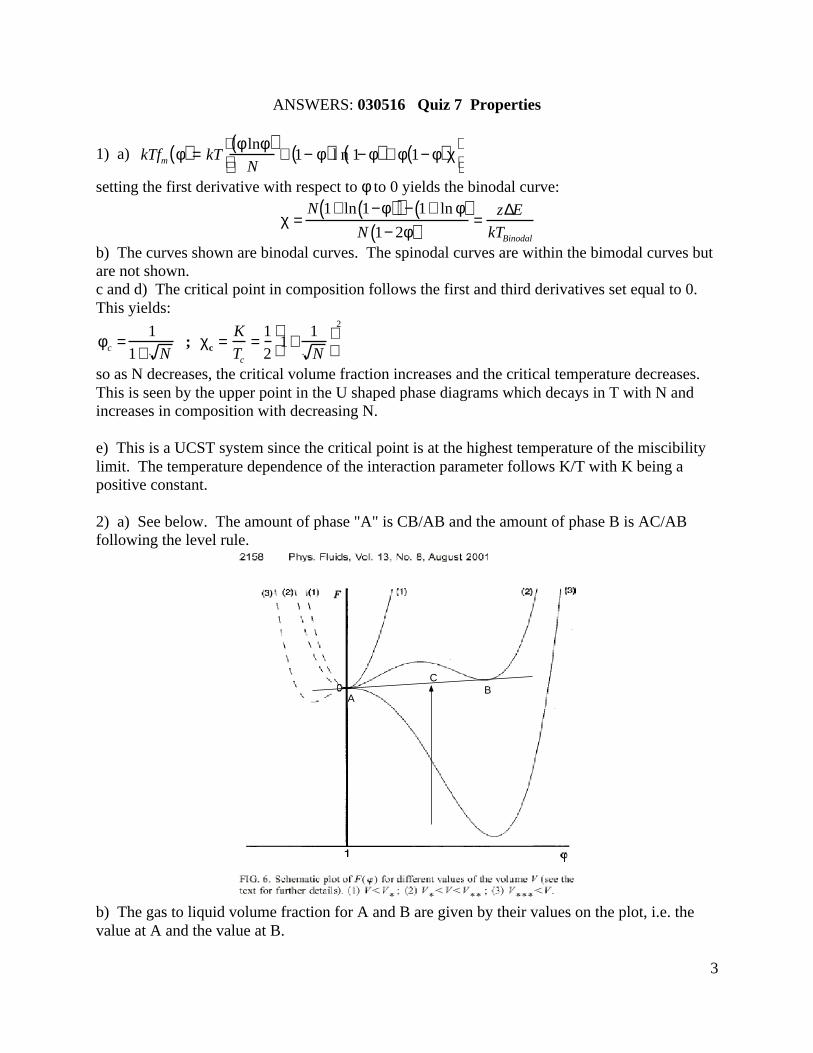
2) a) See below. The amount of phase "A" is CB/AB and the amount of phase B is AC/ABfollowing the level rule.
AB
C
b) The gas to liquid volume fraction for A and B are given by their values on the plot, i.e. thevalue at A and the value at B.

4
c) Curve 1 shows the critical point at Ψ = 1.d) If curve 1 is for the critical point then you wouldn't expect to see critical slowing down sincethe free energy curve is quite steep and doesn't display a plateau.e) (a) is curve 1, (b) and (c) are curve 2 and (d) is curve 3.