Embed Size (px)
Citation preview
Early indicators of workplace injuries and accidents: An analysis of leading
indicators as predictors of workplace OHS outcomes in Australian workplaces
Helen De Cieri
Tracey Shea
Brian Cooper
Cathy Sheehan
Ross Donohue
July 2015
Research report: 045-0415-R09
ISCRR Research Report# 045-0415-R09 Page 2 of 63
This research report was prepared by
Helen De Cieri, Tracey Shea, Brian Cooper, Cathy Sheehan and Ross Donohue: Department of Management, Monash University for WorkSafe Victoria.
Acknowledgements
We gratefully acknowledge the generous support provided by WorkSafe Victoria, the Institute for Safety, Compensation and Recovery Research (ISCRR), Safe Work Australia and the safesearch Executive GM Safety Forum for this project. We also acknowledge research assistance provided by Robin Baker, Naomi Uehara, Trisha Pettit, Sarah Lindsay, Marian Sims, Wendy Webber and Janelle Blythe and Leanda Care, Monash University. We are very grateful for the assistance and cooperation provided by the people in workplaces and organisations participating in this research.
Disclaimer
The information provided in this document can only assist an individual or organisation in a general way. The information is not specific to a particular workplace and is not intended to provide users with information about their compliance and statutory obligations. Monash University is not engaged in rendering specific professional advice and Monash University accepts no liability arising from the use of, or reliance on, the material contained in this document. Before relying on the material, users should carefully make their own assessment as to its accuracy, currency, completeness and relevance for their purposes, and should obtain any appropriate professional advice relevant to their particular circumstances. The material in this report is subject to copyright rights, if any person wishes to use, reproduce or adapt the material in this report, please contact the authors.
Contact details
Professor Helen De Cieri
Monash Business School
P.O. Box 197 Caulfield East
Victoria Australia 3145
Telephone: +613 9903 4155
Email: [email protected]
Website: www.ohsleadindicators.org
ISCRR is a joint initiative of WorkSafe Victoria, the Transport Accident Commission and Monash University. The opinions, findings and conclusions expressed in this publication are those of the authors and not necessarily those of WorkSafe Victoria or ISCRR.
ISCRR Research Report# 045-0415-R09 Page 3 of 63
To cite this report:
De Cieri, H., Shea, T., Cooper, B., Sheehan, C., & Donohue, R. 2015. Early indicators of workplace injuries and accidents: An analysis of leading indicators as predictors of workplace OHS outcomes in Australian workplaces. Report prepared for ISCRR and WSV. Monash University, report no. 045-0415-R09: Caulfield East VIC Australia.
List of accompanying documents:
De Cieri, H., Shea, T., Pettit, T., & Clarke, M. 2012. Measuring the leading indicators of occupational health and safety: A snapshot review. Report prepared for ISCRR and WSV, report no. 0612-045-R1. Monash University: Caulfield East VIC Australia.
De Cieri, H., Shea, T., Cooper, B., Donohue, R., & Sheehan, C. 2015. Early indicators of injuries and accidents at work: An analysis of leading indicators as predictors of WSV data for Victorian workplaces. ISCRR report number: 045-0415-R08. Monash University: Caulfield East VIC Australia.
De Cieri, H., Shea, T., Sheehan, C., Donohue, R., & Cooper, B. 2015. Leading indicators of occupational health and safety: A report on a survey of Australian Nursing and Midwifery Federation (Victorian Branch) members. ISCRR report number: 0714-045-R5. Monash University: Caulfield East VIC Australia.
De Cieri, H., Shea, T., Donohue, R., Sheehan, C. & Cooper, B. 2015. Leading indicators of occupational health and safety: A report on a survey of Australian Education Union (Victorian Branch) members. ISCRR report number: 045-0415-R07. Monash University: Caulfield East VIC Australia.
ISCRR Research Report# 045-0415-R09 Page 4 of 63
With regard to the IWH-OPM and the Organizational Performance Metric-Monash University (OPM-MU):
This work is licensed under the Creative Commons Attribution-NonCommercial-NoDerivatives 4.0 International License. To view a copy of this license, visit http://creativecommons.org/licenses/by-nc-nd/4.0/ or send a letter to Creative Commons, PO Box 1866, Mountain View, CA 94042, USA
Monash University licenses the Organizational Performance Metric-Monash University (OPM-MU) under a Creative Commons Attribution-NonCommercial-NoDerivatives 4.0 International License on the following terms:
Attribution – Licensees will be required to give appropriate credit to Monash University, WorkSafe Victoria, and IWH (as creator of the original IWH-OPM).
Non-commercial – Licensees will only be able to use the OPM-MU for non-commercial purposes.
No-derivatives – If a licensee remixes, transforms or builds upon the OPM-MU, the licensee will not be able to distribute that derivative of the OPM-MU.
ISCRR Research Report# 045-0415-R09 Page 5 of 63
Table of Contents List of Figures ....................................................................................................................... 6
List of Tables ......................................................................................................................... 7
List of Definitions .................................................................................................................. 8
Executive Summary ............................................................................................................ 10
Background and aims ........................................................................................................ 10
Research method .............................................................................................................. 11
Key findings ....................................................................................................................... 11
Introduction ......................................................................................................................... 15
What are OHS leading indicators? .................................................................................... 15
OHS lagging indicators ...................................................................................................... 18
Reliable and valid measurement of OHS leading indicators ............................................. 18
Aims of this report ............................................................................................................. 19
Method ................................................................................................................................. 20
Sample .............................................................................................................................. 20
Measures ........................................................................................................................... 21
Employee questionnaire ................................................................................................ 21
Workplace questionnaire ............................................................................................... 24
Procedure .......................................................................................................................... 24
Results ................................................................................................................................. 25
Description of the sample .................................................................................................. 25
Evaluation of OHS leading indicators ................................................................................ 27
OPM-MU scores across employee groups .................................................................... 28
OPM-MU scores across organisations .......................................................................... 30
Occupational health and safety ......................................................................................... 31
Perceptions of OHS and risk ......................................................................................... 31
OHS outcomes .............................................................................................................. 33
How does the OPM-MU relate to other measures of OHS? .............................................. 34
OPM-MU and other perceptual measures ..................................................................... 34
OPM-MU and employee self-reported OHS outcomes .................................................. 35
OPM-MU and workplace OHS outcomes ...................................................................... 35
Comments by respondents about OHS ............................................................................. 36
Summary and Conclusion .................................................................................................. 56
References ........................................................................................................................... 58
Appendix 1 ........................................................................................................................... 60
OPM-MU, role overload and safety compliance as predictors of OHS incidents .............. 60
ISCRR Research Report# 045-0415-R09 Page 6 of 63
List of Figures Figure 1: Respondent demographics .................................................................................... 26
Figure 2: Average scores for items of the OPM-MU ............................................................. 27
Figure 3: Average OPM-MU scores by industry ................................................................... 28
Figure 4: Average OPM-MU scores for level of employment ................................................ 29
Figure 5: Average OPM-MU scores for employment status ................................................. 29
Figure 6: Average OPM-MU scores by organisation ............................................................ 30
Figure 7: Average OPM-MU scores for workplaces at Organisation B ................................. 30
Figure 8: Comparison of average OHS scale scores ............................................................ 31
Figure 9: Perceived risk ........................................................................................................ 32
Figure 10: Average OHS incidents at the employee level .................................................... 33
Figure 11: Average OHS incidents and frequency rates at the workplace level ................... 34
Figure 12: Comments by industry ......................................................................................... 36
Figure 13: Comments regarding OHS .................................................................................. 37
Figure 14: Risk management comments by industry ............................................................ 37
Figure 15: OHS resources comments by industry ................................................................ 39
Figure 16: OHS systems comments by industry ................................................................... 41
Figure 17: Prioritisation comments by industry ..................................................................... 42
Figure 18: Management commitment comments by industry ............................................... 44
Figure 19: Accountability comments by industry ................................................................... 45
Figure 20: Consultation and communication comments by industry ..................................... 46
Figure 21: OHS empowerment and employee involvement comments by industry .............. 48
Figure 22: Feedback and recognition comments by industry ............................................... 49
Figure 23: Inspections and audits comments by industry ..................................................... 50
Figure 24: Other comments by industry ................................................................................ 51
Figure 25: Comments within the Construction industry ........................................................ 53
Figure 26: Comments within the Mining industry .................................................................. 53
Figure 27: Comments within the Transport, Postal & Warehousing industry ........................ 54
Figure 28: Comments within the Electrical, Gas, Water & Waste industry ........................... 54
Figure 29: Comments within the Arts & Recreation industry ................................................ 55
Figure 30: Comments within the Healthcare industry ........................................................... 55
Figure 31: Classification tree predicting OHS incidents ........................................................ 62
ISCRR Research Report# 045-0415-R09 Page 7 of 63
List of Tables Table 1: List of definitions for terms used in the employee survey ......................................... 8
Table 2: List of definitions for terms used in the OHS manager survey .................................. 9
Table 3: Leading Indicators of Occupational Health and Safety ........................................... 17
Table 4: Multi-item measures used in the study ................................................................... 22
Table 5: Measures of OHS perceptions in the phase one questionnaire .............................. 23
Table 6: Survey distribution and responses for phase one ................................................... 25
ISCRR Research Report# 045-0415-R09 Page 8 of 63
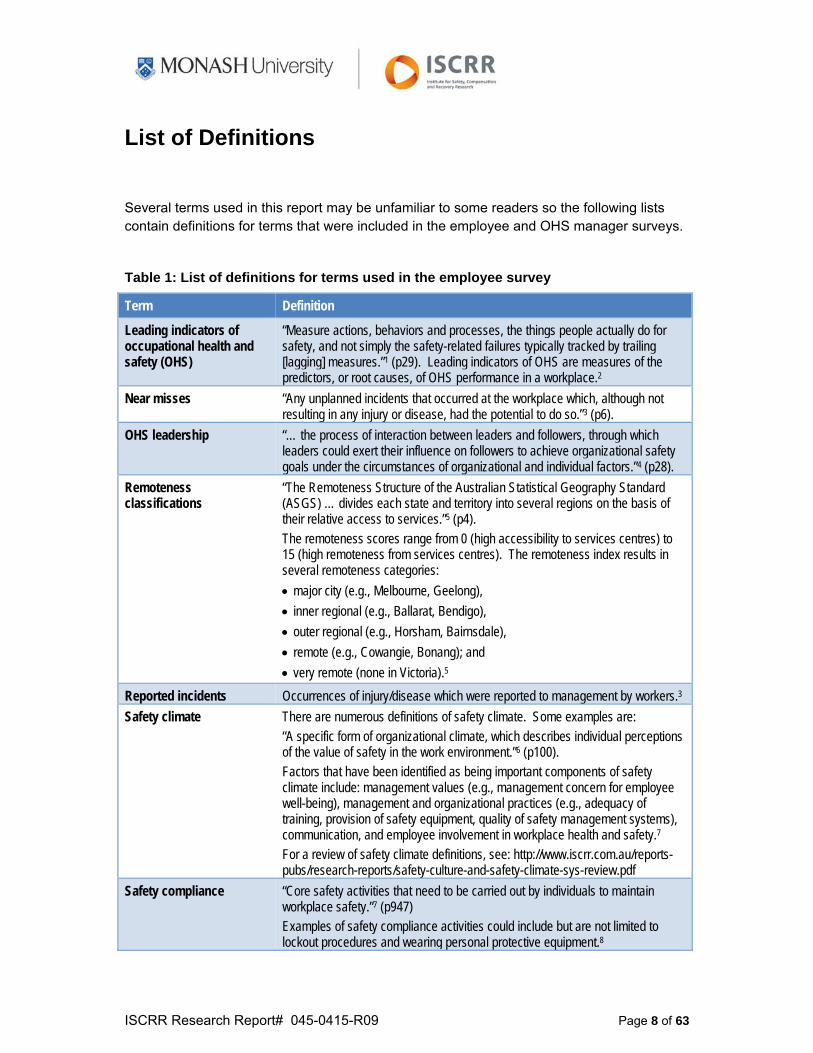
List of Definitions
Several terms used in this report may be unfamiliar to some readers so the following lists contain definitions for terms that were included in the employee and OHS manager surveys.
Table 1: List of definitions for terms used in the employee survey
Term Definition
Leading indicators of occupational health and safety (OHS)
“Measure actions, behaviors and processes, the things people actually do for safety, and not simply the safety-related failures typically tracked by trailing [lagging] measures.”1 (p29). Leading indicators of OHS are measures of the predictors, or root causes, of OHS performance in a workplace.2
Near misses “Any unplanned incidents that occurred at the workplace which, although not resulting in any injury or disease, had the potential to do so.”3 (p6).
OHS leadership “… the process of interaction between leaders and followers, through which leaders could exert their influence on followers to achieve organizational safety goals under the circumstances of organizational and individual factors.”4 (p28).
Remoteness classifications
“The Remoteness Structure of the Australian Statistical Geography Standard (ASGS) … divides each state and territory into several regions on the basis of their relative access to services.”5 (p4). The remoteness scores range from 0 (high accessibility to services centres) to 15 (high remoteness from services centres). The remoteness index results in several remoteness categories:
major city (e.g., Melbourne, Geelong),
inner regional (e.g., Ballarat, Bendigo),
outer regional (e.g., Horsham, Bairnsdale),
remote (e.g., Cowangie, Bonang); and
very remote (none in Victoria).5
Reported incidents Occurrences of injury/disease which were reported to management by workers.3
Safety climate There are numerous definitions of safety climate. Some examples are: “A specific form of organizational climate, which describes individual perceptions of the value of safety in the work environment.”6 (p100). Factors that have been identified as being important components of safety climate include: management values (e.g., management concern for employee well-being), management and organizational practices (e.g., adequacy of training, provision of safety equipment, quality of safety management systems), communication, and employee involvement in workplace health and safety.7 For a review of safety climate definitions, see: http://www.iscrr.com.au/reports-pubs/research-reports/safety-culture-and-safety-climate-sys-review.pdf
Safety compliance “Core safety activities that need to be carried out by individuals to maintain workplace safety.”7 (p947) Examples of safety compliance activities could include but are not limited to lockout procedures and wearing personal protective equipment.8
ISCRR Research Report# 045-0415-R09 Page 9 of 63
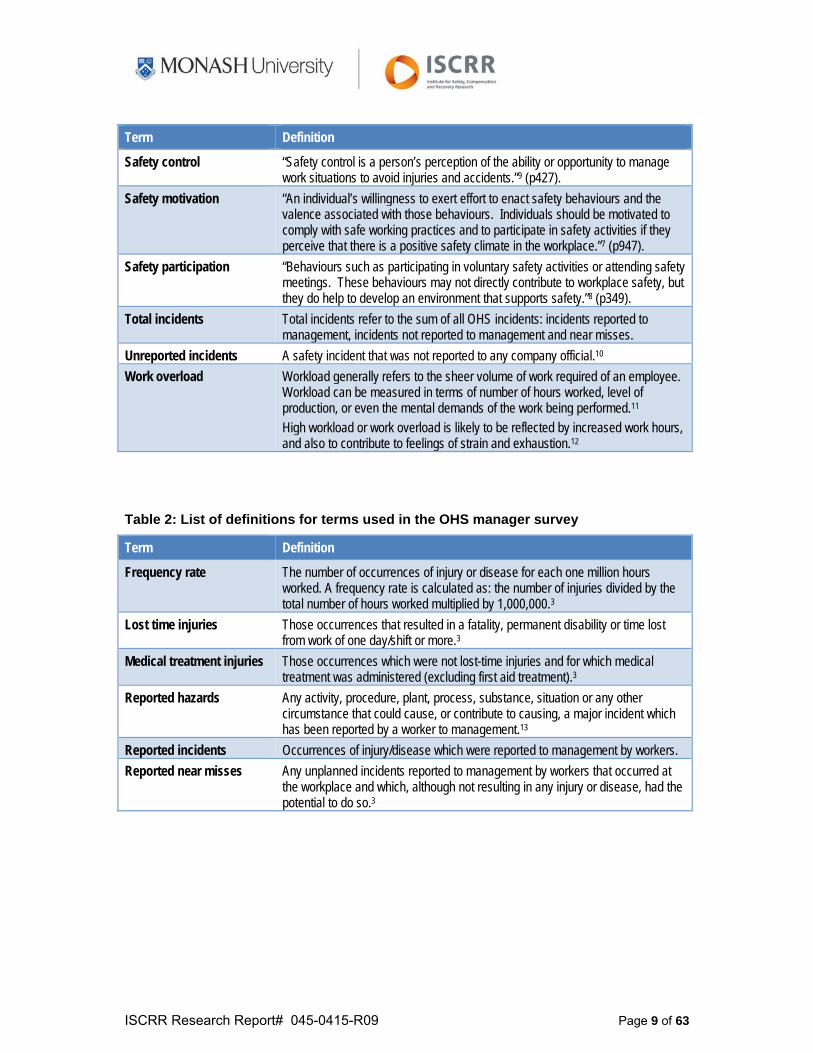
Term Definition
Safety control “Safety control is a person’s perception of the ability or opportunity to manage work situations to avoid injuries and accidents.”9 (p427).
Safety motivation “An individual’s willingness to exert effort to enact safety behaviours and the valence associated with those behaviours. Individuals should be motivated to comply with safe working practices and to participate in safety activities if they perceive that there is a positive safety climate in the workplace.”7 (p947).
Safety participation “Behaviours such as participating in voluntary safety activities or attending safety meetings. These behaviours may not directly contribute to workplace safety, but they do help to develop an environment that supports safety.”8 (p349).
Total incidents Total incidents refer to the sum of all OHS incidents: incidents reported to management, incidents not reported to management and near misses.
Unreported incidents A safety incident that was not reported to any company official.10
Work overload Workload generally refers to the sheer volume of work required of an employee. Workload can be measured in terms of number of hours worked, level of production, or even the mental demands of the work being performed.11 High workload or work overload is likely to be reflected by increased work hours, and also to contribute to feelings of strain and exhaustion.12
Table 2: List of definitions for terms used in the OHS manager survey
Term Definition
Frequency rate The number of occurrences of injury or disease for each one million hours worked. A frequency rate is calculated as: the number of injuries divided by the total number of hours worked multiplied by 1,000,000.3
Lost time injuries Those occurrences that resulted in a fatality, permanent disability or time lost from work of one day/shift or more.3
Medical treatment injuries Those occurrences which were not lost-time injuries and for which medical treatment was administered (excluding first aid treatment).3
Reported hazards Any activity, procedure, plant, process, substance, situation or any other circumstance that could cause, or contribute to causing, a major incident which has been reported by a worker to management.13
Reported incidents Occurrences of injury/disease which were reported to management by workers.
Reported near misses Any unplanned incidents reported to management by workers that occurred at the workplace and which, although not resulting in any injury or disease, had the potential to do so.3
ISCRR Research Report# 045-0415-R09 Page 10 of 63
Executive Summary
Background and aims
This report presents the results of the Workplace Health and Safety (WHS) Survey that was conducted between July 2013 and January 2015. The work is part of a large research project that is being conducted by Monash University in partnership with WorkSafe Victoria, the Institute for Safety, Compensation and Recovery Research (ISCRR), the safesearch Executive GM Safety forum (GM Forum), and SafeWork Australia.
Nationally and internationally, industry stakeholders have a keen interest to identify and develop leading indicators of occupational health and safety (OHS). Concurrently in Australia, regulators are gearing up to include leading indicators in the suite of modern regulatory tools. The WHS Survey project has emerged in this environment, and offers an invaluable opportunity for industry stakeholders to take a guiding and proactive role in the development of future tools and approaches. In 2012, the Monash research team conducted preliminary research that identified and piloted a tool that was developed in Canada to measure OHS leading indicators (the IWH Organizational Performance Metric or IWH-OPM).14 Since then, the research team has conducted several survey studies with a view to validating an adapted version of the IWH-OPM in the Australian context. The adapted version is known as the Organizational Performance Metric-Monash University (OPM-MU). The WHS Survey was conducted by the Monash research team in two parts with six participating Australian organisations. In the first phase, the workforce in each participating workplace was invited to respond to a questionnaire; this phase was conducted between July 2013 and May 2014. The second phase comprised collection of workplace-level data about OHS outcomes (lag indicators), and was conducted between August 2014 and January 2015. The WHS Survey is important research that has tested the OPM-MU as a practical tool which can be used for predictive purposes or as a benchmarking tool. Several Australian employers have participated in this survey.
The aim of this report is to present WorkSafe Victoria with an overview of OHS across the selected workplaces. This report presents analysis of the OPM-MU and workplace OHS that examines the
1. psychometric properties of the OPM-MU using individual employee data;
2. variations in respondent views of OHS in their workplaces as measured by the OPM-MU and other perceptual measures;
3. relationship between respondent views of OHS and self-reported OHS incidents as measured from the employee survey; and
4. relationship between OPM-MU scores and OHS incidents as recorded in workplace data.
ISCRR Research Report# 045-0415-R09 Page 11 of 63
Research method
The survey was conducted in six organisations operating in six industries: Arts and Recreation Services, Construction, Electricity, Gas, Water and Waste Services, Health and Community Services, Mining as well as Transport, Postal and Warehousing.
In the first phase of the WHS Survey, we gathered data from managers and employees at their respective workplaces or worksites in each of the six organisations. In all, data were gathered from 66 workplaces that were based in Victoria (56 percent), Western Australia (19 percent), New South Wales (13 percent), Queensland (10 percent), Northern Territory (1 percent) and South Australia (1 percent). The survey was administered using two formats (paper and online) and at two levels (manager and employee). Overall, 10,362 managers and employees had the opportunity to complete the survey and we received 3,605 responses, resulting in a 35% response rate. Respondents were managers (5%), employees in supervisory roles (19%) and non-supervisory employees (76%).
Respondents were asked to report on basic demographic details, the number of OHS incidents they had been involved in, within the past 12 months, and their perceptions, attitudes and behaviours related to OHS in the workplace.
In the second phase of the WHS Survey, we asked the OHS managers in each of the six participating organisations to report on workplace-level data about OHS outcomes (lag indicators).
Key findings
Analyses of the survey results from the surveys conducted in 66 Australian workplaces revealed the following:
1) The OPM-MU is a valid and reliable measure of OHS leading indicators. In the first phase of the WHS survey, individuals were asked to complete a questionnaire that included the OPM-MU, an eight-item measure. Scores on the OPM-MU can range from a low score of 8 to the highest possible score of 40. A higher score on the OPM-MU indicates that OHS leading indicators are present to a greater extent in the workplace. As the OPM-MU is a leading indicator, it does not assess the number of OHS incidents that have occurred in a workplace. Instead, the OPM-MU provides a measure of employees’ perceptions regarding the value of and emphasis given to OHS in their workplace. An example item from the OPM-MU is “everyone at this workplace values OHS improvement in this workplace.” Workplaces with higher scores on the OPM-MU, therefore, are perceived to be more actively engaged in practices that could reduce the likelihood of OHS incidents. Conversely, workplaces that obtain lower scores on the OPM-MU are perceived to be minimally engaged in initiatives that may reduce the potential of OHS incidents.
The OPM-MU measures individuals’ views of the ‘safety potential’ of a workplace.
Higher OPM-MU scores indicate that individuals are more likely to agree that their workplace has features that should lead to prevention of work-related illnesses and injuries.
ISCRR Research Report# 045-0415-R09 Page 12 of 63
The OPM-MU could be used as an initial ‘flag’ of leading indicators of OHS in a workplace.
The data analysis confirmed that the OPM-MU met established criteria as a valid and reliable measure of OHS leading indicators. The average score on the OPM-MU across the sample was 29.0 (SD = 5.8).
The results of the exploratory factor analysis revealed good model fit;
The items of the OPM-MU formed a clean single factor structure;
The OPM-MU has good internal consistency (α = 0.89);
Good inter-rater reliability (ICC2 = .90); and
Correlational analysis revealed that the OPM-MU is a valid measure of OHS leading indicators and can be distinguished from other measures of employee OHS attitudes and behaviours.
2) The OPM-MU scores varied across employee subgroups. Average ratings of leading indicators (as measured by the OPM-MU) varied across employee subgroups, specifically:
industry;
level in organisation; and
employment status.
Employees working in the Electricity, Gas, Water and Waste services and the Construction industries tended to report higher OPM-MU scores compared to employees in the other industries. Employees from the Arts and Recreation Services and Healthcare and Community Services industries tended to report lower OPM-MU scores compared to employees working in the other industries.
Managers, supervisors and non-supervisory employees differed in their ratings of their workplaces on the OPM-MU. Managers gave their workplaces higher ratings on the OPM-MU compared to supervisors and non-supervisory employees. Supervisors, in turn, rated their workplaces higher on the OPM-MU compared to non-supervisory employees.
There were also differences in workplace ratings according to an employee’s employment status; employees in permanent positions rated their workplaces higher on the OPM-MU compared to employees who worked in casual positions.
3) The OPM-MU is a useful tool between and within organisations. A comparison of scores on the OPM-MU revealed the utility of the OPM-MU for comparing the level of leading indicators of OHS both between and within organisations.
Average ratings of leading indicators (as measured by the OPM-MU) varied between participating organisations; however, scores on the OPM-MU were shown to vary substantially within organisations indicating that scores are likely to be affected by workplace contexts.
ISCRR Research Report# 045-0415-R09 Page 13 of 63
4) OPM-MU is associated with employee behaviours. Employees who rate their workplaces higher on leading indicators of safety (as measured by the OPM-MU) tended to report that they
behave more safely in the workplace;
have greater levels of safety motivation; and
have a greater sense of control over their own safety.
5) Relationships between the OPM-MU and self-reported OHS outcomes. Leading indicators (as measured by the OPM-MU) were associated with fewer
unreported OHS incidents; and
near misses.
There was no evidence of an association between presence of leading indicators and reported OHS incidents (i.e., OHS incidents that were reported by individuals to management).
6) The OPM-MU score is associated with workplace OHS outcomes. We examined the relationship between employee responses in the workforce survey (Phase One) and the OHS outcomes reported at workplace level (Phase Two). We found that leading indicators (as measured by the OPM-MU) were associated with workplace injury frequency rates that occurred in the three month time period following the administration of the phase one survey. Higher scores on the OPM-MU were associated with a lower
lost-time injury frequency rate (LTIFR); and
medical treatment injury frequency rate (MTIFR).
This report has presented an analysis of the WHS Survey conducted in workplaces across Australia. The findings of this research suggest that the OPM-MU is a reliable and valid measure of OHS leading indicators at the workplace level that could be used as an initial ‘flag’ of the leading indicators of health and safety in a workplace.14,15 The OPM-MU is a brief and easily administered tool that has the potential to be a benchmarking tool both within and across organisations. The OPM-MU has been shown to work well across several industries that vary in terms of work performed and risk potential within the workplace. However, given the limited number of industries captured in this study, further benchmarking of the OPM-MU in a broader range of industries is required. From the results of this study it can be concluded that the OPM-MU
1. could be used as an initial ‘flag’ of leading indicators of OHS in a workplace; 2. is associated with employee self-reports of OHS incidents; and 3. is predictive of workplace-level OHS outcomes (lagging indicators).
Furthermore, in future research using the OPM-MU, consideration could be given to developing norms in a larger national study to assist in benchmarking scores on the OPM-MU across a wider range of organisations that represent
4. high and low risk industries; 5. a wider range of industries; and
ISCRR Research Report# 045-0415-R09 Page 14 of 63
6. other countries to determine how it works in different cultures.
This survey and analysis are part of a larger research project investigating OHS leading indicators. Several other reports will be available to extend our understanding of the OPM-MU in the Australian context. We recommend that this report be viewed as a companion piece to the other reports, which will be available at http://ohsleadindicators.org and on the ISCRR website: www.iscrr.com.au.
ISCRR Research Report# 045-0415-R09 Page 15 of 63
Introduction
This report is part of a large research project that is being conducted by Monash University in partnership with WorkSafe Victoria, the Institute for Safety, Compensation and Recovery Research (ISCRR), the safesearch Executive GM Safety forum (GM Forum), and Safe Work Australia. In 2012, the Monash research team conducted preliminary research that identified and piloted a tool that was developed in Canada to measure OHS leading indicators (the IWH Organizational Performance Metric or IWH-OPM). The WHS Survey was conducted by the Monash research team in two parts with six participating Australian organisations. In the first phase, the employees in each participating workplace were invited to respond to a questionnaire; this phase was conducted between July 2013 and May 2014. The second phase comprised collection of workplace-level data about OHS outcomes (lag indicators), and was conducted between August 2014 and January 2015. The Workplace Health and Safety (WHS) Survey is important research that will lead to a practical tool that can be used for predictive purposes or as a benchmarking tool.
This report presents the results from the WHS Survey which was run between July 2013 and May 2014. An important aim of this report was to test the IWH Organizational Performance Metric (IWH-OPM) at the employee level to confirm its utility as a measure of OHS leading indicators. The IWH-OPM is an 8-item measure of OHS leading indicators14,15 that was developed in Canada and is central to this study. Earlier research has suggested that the IWH-OPM is a reliable and valid measure of OHS leading indicators at the organisational level that could be used as an initial ‘flag’ of the leading indicators of health and safety in a workplace. Since then, the research team has conducted several survey studies with a view to validating an adapted version of the IWH-OPM in the Australian context. The adapted version is known as the Organizational Performance Metric-Monash University (OPM-MU). This study tested the OPM-MU at the employee level to determine whether it is appropriate to measure this workplace level construct on the basis of employee perceptions.
Nationally and internationally, industry stakeholders have a keen interest to identify and develop leading indicators of occupational health and safety (OHS). Concurrently in Australia, regulators are gearing up to include leading indicators in the suite of modern tools. The research project has emerged in this environment, and offers an invaluable opportunity for stakeholders to take a guiding and proactive role in the development of future tools and approaches.
What are OHS leading indicators?
Leading indicators of OHS performance can be defined as measures of the positive steps that organisations take that may prevent an OHS incident from occurring. Baker and colleagues define leading indicators as “A metric that attempts to measure some variable that is believed to be an indicator or precursor of future safety performance.”16 In other words, leading indicators can be said to measure the ‘safety potential’ of a workplace. Leading indicators are the key to a proactive approach to OHS and the measurement and
ISCRR Research Report# 045-0415-R09 Page 16 of 63
monitoring of OHS performance. Leading indicators are by definition measures of the predictors, or root causes, of OHS performance.17,18 Leading indicators can provide effective early warnings, by enabling risks or risk increases to be detected and mitigated, before an OHS incident occurs or a hazardous state is reached.
OHS leading indicators may be at a broad, macro-level (e.g., presence of OHS policy), and/or they may be more specific (e.g., number of hazards identified each month). Macro-level indicators may be able to be applied across workplace and industry contexts in order to benchmark and obtain a broad and comparable overview of OHS.
These may be complemented by more specific and sensitive micro-level indicators that allow for a more fine-grained understanding of OHS performance in a particular work context or organisation. There is recognised value in both macro and micro-level indicators of OHS performance.
Research on leading indicators has grown in recent years with contributions from a range of sectors including academia, industry, and government.18-20 Sinelnikov et al. (2015: 240) recently noted that “a general consensus exists for the use of leading indicators as a measure of OHS performance.”
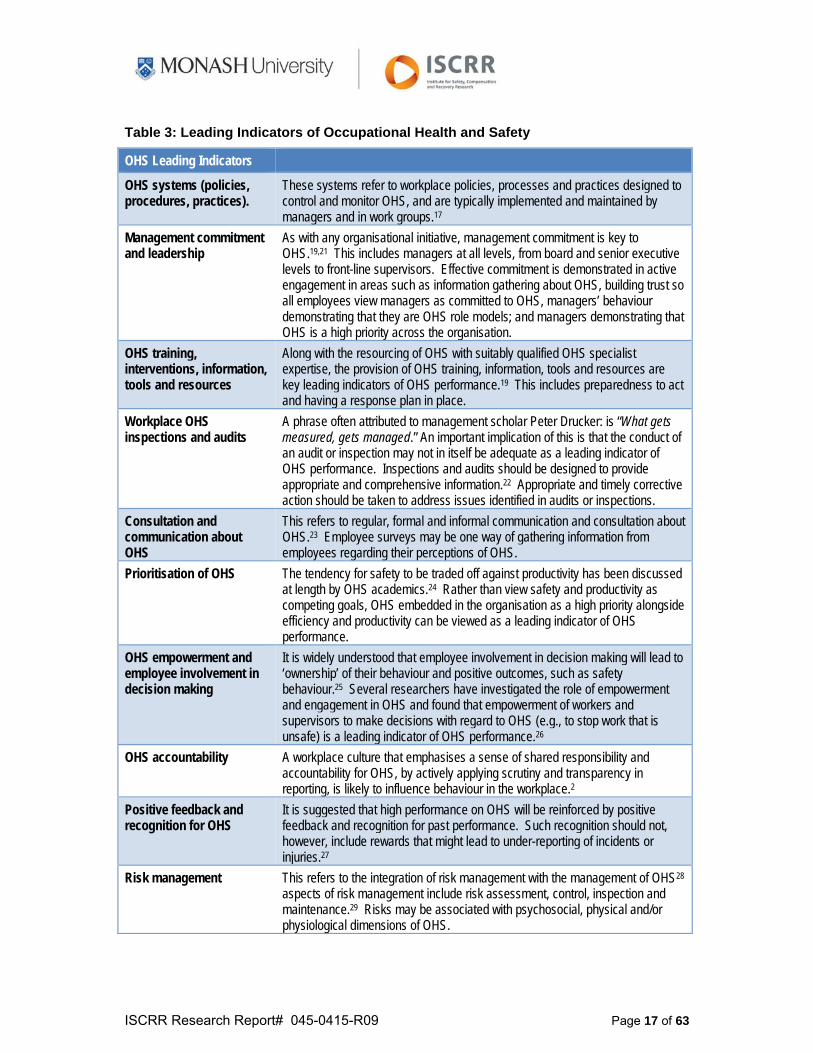
To summarise the available literature, the major OHS leading indicators encompass the domains that are shown in Table 3. This list of the dimensions or domains of leading indicators may not be comprehensive. Further, it is important to recognise that each domain is complex and detailed. Sinelnikov et al. (2015: 248) call for the development and validation of a “standard index of leading indicators that could be used for benchmarking across organizations.” Our study seeks to address this call. The IWH-OPM has been used in North America as a simple and practical measure of OHS leading indicators; the eight items of the IWH-OPM appear to provide adequate coverage of the domains of OHS leading indicators that have been identified in relevant academic literature. Research conducted to date indicates that the OPM-MU shows promise as a simple and practical measure of leading indicators in the Australian context. The WHS Survey is an important step in the validation of the OPM-MU.
ISCRR Research Report# 045-0415-R09 Page 17 of 63
Table 3: Leading Indicators of Occupational Health and Safety
OHS Leading Indicators
OHS systems (policies, procedures, practices).
These systems refer to workplace policies, processes and practices designed to control and monitor OHS, and are typically implemented and maintained by managers and in work groups.17
Management commitment and leadership
As with any organisational initiative, management commitment is key to OHS.19,21 This includes managers at all levels, from board and senior executive levels to front-line supervisors. Effective commitment is demonstrated in active engagement in areas such as information gathering about OHS, building trust so all employees view managers as committed to OHS, managers’ behaviour demonstrating that they are OHS role models; and managers demonstrating that OHS is a high priority across the organisation.
OHS training, interventions, information, tools and resources
Along with the resourcing of OHS with suitably qualified OHS specialist expertise, the provision of OHS training, information, tools and resources are key leading indicators of OHS performance.19 This includes preparedness to act and having a response plan in place.
Workplace OHS inspections and audits
A phrase often attributed to management scholar Peter Drucker: is “What gets measured, gets managed.” An important implication of this is that the conduct of an audit or inspection may not in itself be adequate as a leading indicator of OHS performance. Inspections and audits should be designed to provide appropriate and comprehensive information.22 Appropriate and timely corrective action should be taken to address issues identified in audits or inspections.
Consultation and communication about OHS
This refers to regular, formal and informal communication and consultation about OHS.23 Employee surveys may be one way of gathering information from employees regarding their perceptions of OHS.
Prioritisation of OHS The tendency for safety to be traded off against productivity has been discussed at length by OHS academics.24 Rather than view safety and productivity as competing goals, OHS embedded in the organisation as a high priority alongside efficiency and productivity can be viewed as a leading indicator of OHS performance.
OHS empowerment and employee involvement in decision making
It is widely understood that employee involvement in decision making will lead to ‘ownership’ of their behaviour and positive outcomes, such as safety behaviour.25 Several researchers have investigated the role of empowerment and engagement in OHS and found that empowerment of workers and supervisors to make decisions with regard to OHS (e.g., to stop work that is unsafe) is a leading indicator of OHS performance.26
OHS accountability A workplace culture that emphasises a sense of shared responsibility and accountability for OHS, by actively applying scrutiny and transparency in reporting, is likely to influence behaviour in the workplace.2
Positive feedback and recognition for OHS
It is suggested that high performance on OHS will be reinforced by positive feedback and recognition for past performance. Such recognition should not, however, include rewards that might lead to under-reporting of incidents or injuries.27
Risk management This refers to the integration of risk management with the management of OHS28 aspects of risk management include risk assessment, control, inspection and maintenance.29 Risks may be associated with psychosocial, physical and/or physiological dimensions of OHS.
ISCRR Research Report# 045-0415-R09 Page 18 of 63
OHS lagging indicators
As discussed above, OHS leading indicators can be thought of as precursors to harm, or inputs that provide an idea of how to improve future OHS performance. In contrast, OHS lagging indicators are measures of harm that measure events or outcomes that have already happened;29 lagging indicators are measures of OHS outcomes or outputs and provide a measure of past performance.30 OHS outcomes are tangible events or results, such as accidents, injuries, or fatalities.31
Examples of lagging indicators include
near-misses;
LTIFR;
MTIFR; and
WorkCover claims
Given the high costs in human, social, economic and financial terms related to OHS outcomes it is important to understand how OHS leading indicators and various workplace contextual and working conditions may influence workplace health and safety.11 It would generally be expected that more positive OHS leading indicators and a greater presence of health and safety features in the workplace would be negatively associated with OHS outcomes such as work-related injuries or WorkCover claims. Previous research has advised investigation of a range of lagging indicators, including micro-accidents (incidents requiring minimal attention).32
While lagging indicators are valid measures of past OHS performance, their reliability as predictors of future OHS performance is open to debate.33 Despite their benefits, lagging indicators have limitations or problems, as evidenced in several studies:19,34
by definition, these indicators lag after the OHS event, and therefore do not allow for prevention (at least of the initial event);
lagging indicators are of limited use in the diagnosis of OHS problems because they typically do not assist with identification of the cause of an OHS event;
outcomes focused on reportable injuries and illnesses may have very low levels of reporting and therefore low variation. These measures may not be sensitive enough to identify differences in OHS performance between two units; and
a focus on lagging indicators may be counter-productive, as it may not guarantee that workplace hazards and risks are being monitored or controlled.
Reliable and valid measurement of OHS leading indicators
A major aim of this research is to test whether the OPM-MU is a reliable and valid measure of leading indicators of OHS in Australian workplaces. To develop a tool that represents ‘OHS leading indicators’, a necessary criterion is for that measure to have demonstrable validity. This means that the tool as a whole and each item in it must have some correspondence to the underlying concept it is supposed to represent, in this case, leading indicators of OHS. When the items meaningfully represent the concept they are said to be
ISCRR Research Report# 045-0415-R09 Page 19 of 63
measuring then there is evidence of validity.35 A systematic research process needs to be conducted to demonstrate this validity.
Paying careful attention to the validity of a measure is important because decisions will be made on the basis of the measurement. Developing and validating a measure requires rigorous attention to well-established research procedures. Hence, this research is an invaluable contribution to the development of an important tool for Australian industry.
Aims of this report
This report provides an overview of OHS at workplaces across Australia by presenting an analysis of the WHS Survey that was conducted in 66 workplaces across six organisations between July 2013 and January 2015.
The WHS Survey was conducted in two parts with six participating Australian organisations. In the first phase, the employees in each participating workplace were invited to respond to a questionnaire; this phase was conducted between July 2013 and May 2014. The second phase comprised collection of workplace-level data about OHS outcomes (lag indicators), and was conducted between August 2014 and January 2015.
The aim of this report is to present WorkSafe Victoria with an overview of OHS across the selected workplaces. This report presents analysis of the OPM-MU and workplace OHS that examines the
psychometric properties of a measure of leading indicators of OHS (the OPM-MU) using individual employee data;
variations in respondent views of OHS in their workplaces as measured by the OPM-MU and other perceptual measures;
relationship between respondent views of OHS and self-reported OHS incidents; and
relationship between OPM-MU scores (collected in Phase One) and OHS incidents reported at workplace level (collected in Phase Two); and
individual comments about OHS at the participating workplaces.
ISCRR Research Report# 045-0415-R09 Page 20 of 63
Method
Sample
The sample for this study was recruited via a national multi-industry survey conducted in Australia from September 2013 to November 2014. A convenience sample of six organisations was recruited into the study with OHS managers being approached through professional networks. Sixty-six workplaces agreed to participate in the survey and were from six industries: Arts and Recreation Services, Construction, Electricity, Gas, Water and Waste Services, Health and Community Services, Mining, and Transport Postal and Warehousing.
In the first phase of the survey, all managers and employees at each participating workplace had the opportunity to complete the questionnaire. The invitation to participate in and distribution of the survey depended on both workplace context and whether the questionnaire was administered using pencil and paper or online. All respondents were assured of confidentiality and anonymity.
The first phase of the WHS Survey was administered to 10,362 employees and 3,605 employees responded, resulting in a response rate of 35%. The respondents were based in workplaces across six states: Victoria (56 percent), Western Australia (19 percent), New South Wales (13 percent), Queensland (10 percent), Northern Territory (1 percent) and South Australia (1 percent).
In the second phase of the survey, the OHS manager from each organisation was invited to complete a questionnaire reporting on workforce details and the OHS outcomes in each of their participating workplaces.
ISCRR Research Report# 045-0415-R09 Page 21 of 63
Measures
The phase one questionnaire was designed to collect several types of information from individual employees
respondent demographics (e.g., gender);
workplace context (e.g., perceptions of risk in the workplace);
OHS practices (e.g., OPM-MU, safety climate, safety motivation); and
self-reported OHS outcomes (e.g., OHS incidents, near misses).
The phase two questionnaire was designed to collect information on workforce details and OHS outcomes for the three months following administration of the employee questionnaire
workforce details (e.g., gender); and
workplace health and safety outcomes OHS practices (e.g., lost time injuries).
Definitions of the variables used in the phase one and phase two questionnaires can be found earlier in Tables 1 and 2.
Employee questionnaire
Respondents provided details regarding their organisational tenure, employment level (manager, supervisor, non-supervisor), employee status (e.g., full-time, part-time) and gender.
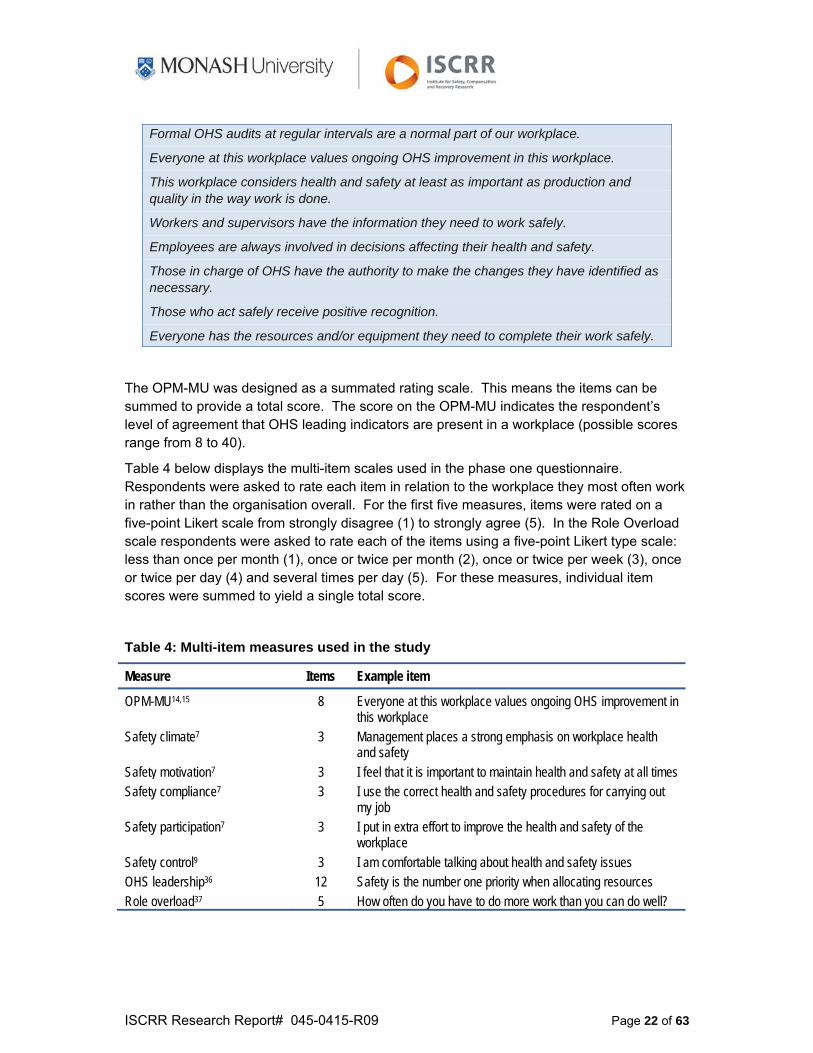
The employee questionnaire collected data on several measures of safety but the Organizational Performance Metric-Monash University (OPM-MU) was the focus on the study. The IWH-OPM has been reported to be a reliable eight-item measure of leading indicators of OHS.14,15 However, inspection of the IWH-OPM led us to make adaptations to the scale. First, in order to adequately and consistently address OHS, we adapted some of the IWH-OPM items by replacing ‘safety’ with ‘health and safety.’ Second, in this study we asked respondents to complete the OPM-MU for the workplace they most often work in rather than for the organisation overall. Third, we replaced the original response scale based on percentages [0%-20%, 20%-40%, 40%-60%, 60%-80%] (IWH, 2011, 2013) with a Likert-type scale. Respondents were asked to indicate on a five-point Likert scale (1= strongly disagree to 5 = strongly agree), the extent to which they agreed or disagreed with the statements shown in the box below. Fourth, the item “this workplace considers health and safety at least as important as production and quality in the way work is done” could be adapted to match industry priorities. For example, in the healthcare industry, the wording of this item was adapted to “this workplace considers health and safety at least as important as efficiency and quality in the way work is done.”
ISCRR Research Report# 045-0415-R09 Page 22 of 63
Formal OHS audits at regular intervals are a normal part of our workplace.
Everyone at this workplace values ongoing OHS improvement in this workplace.
This workplace considers health and safety at least as important as production and quality in the way work is done.
Workers and supervisors have the information they need to work safely.
Employees are always involved in decisions affecting their health and safety.
Those in charge of OHS have the authority to make the changes they have identified as necessary.
Those who act safely receive positive recognition.
Everyone has the resources and/or equipment they need to complete their work safely.
The OPM-MU was designed as a summated rating scale. This means the items can be summed to provide a total score. The score on the OPM-MU indicates the respondent’s level of agreement that OHS leading indicators are present in a workplace (possible scores range from 8 to 40).
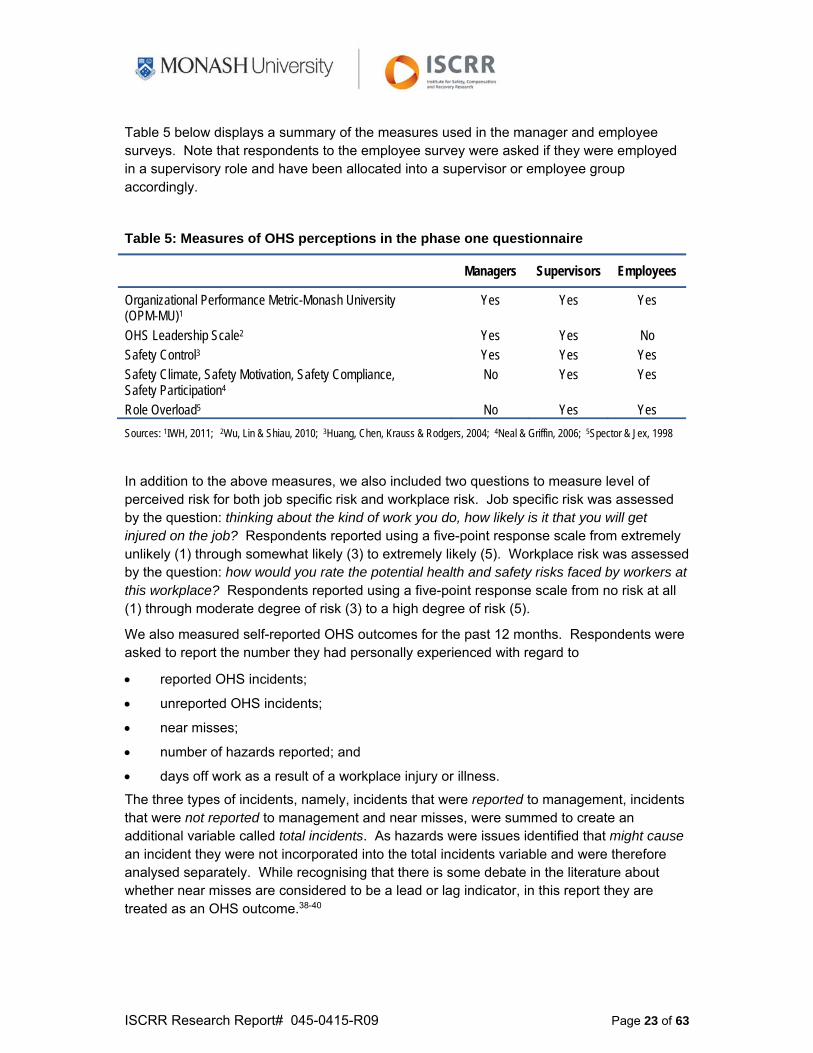
Table 4 below displays the multi-item scales used in the phase one questionnaire. Respondents were asked to rate each item in relation to the workplace they most often work in rather than the organisation overall. For the first five measures, items were rated on a five-point Likert scale from strongly disagree (1) to strongly agree (5). In the Role Overload scale respondents were asked to rate each of the items using a five-point Likert type scale: less than once per month (1), once or twice per month (2), once or twice per week (3), once or twice per day (4) and several times per day (5). For these measures, individual item scores were summed to yield a single total score.
Table 4: Multi-item measures used in the study
Measure Items Example item
OPM-MU14,15 8 Everyone at this workplace values ongoing OHS improvement in this workplace
Safety climate7 3 Management places a strong emphasis on workplace health and safety
Safety motivation7 3 I feel that it is important to maintain health and safety at all times Safety compliance7 3 I use the correct health and safety procedures for carrying out
my job Safety participation7 3 I put in extra effort to improve the health and safety of the
workplace Safety control9 3 I am comfortable talking about health and safety issues OHS leadership36 12 Safety is the number one priority when allocating resources Role overload37 5 How often do you have to do more work than you can do well?
ISCRR Research Report# 045-0415-R09 Page 23 of 63
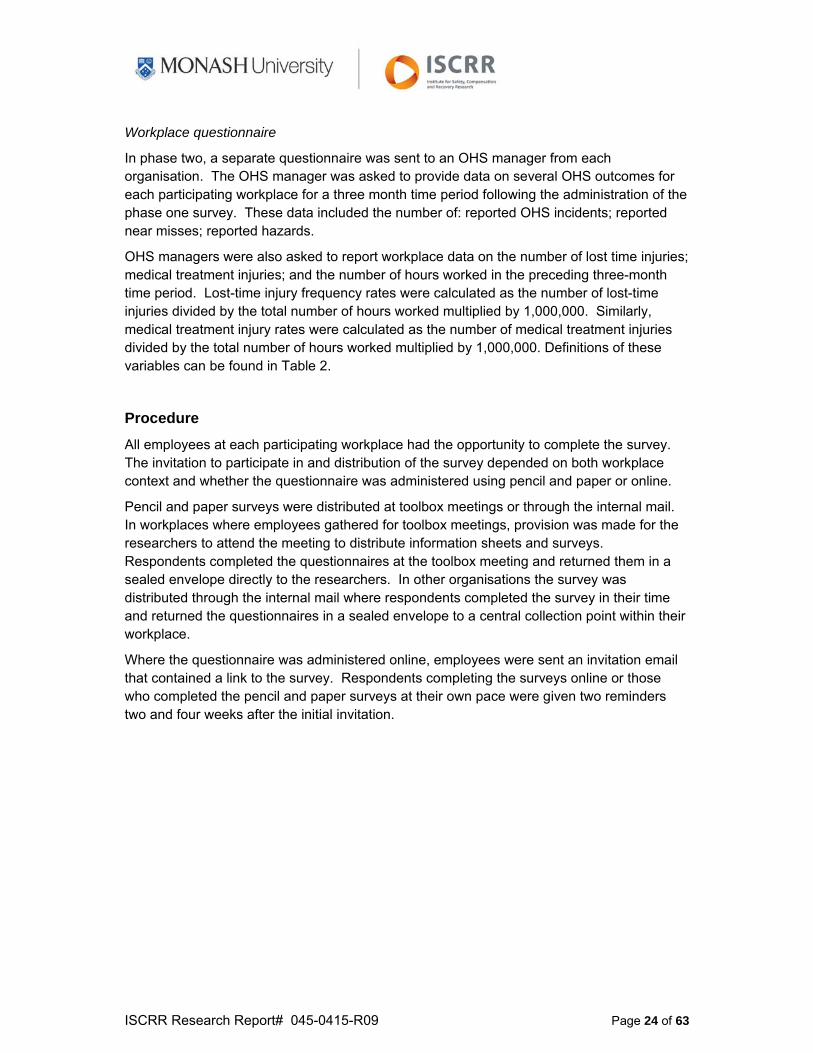
Table 5 below displays a summary of the measures used in the manager and employee surveys. Note that respondents to the employee survey were asked if they were employed in a supervisory role and have been allocated into a supervisor or employee group accordingly.
Table 5: Measures of OHS perceptions in the phase one questionnaire
Managers Supervisors Employees
Organizational Performance Metric-Monash University (OPM-MU)1
Yes Yes Yes
OHS Leadership Scale2 Yes Yes No Safety Control3 Yes Yes Yes Safety Climate, Safety Motivation, Safety Compliance, Safety Participation4
No Yes Yes
Role Overload5 No Yes Yes
Sources: 1IWH, 2011; 2Wu, Lin & Shiau, 2010; 3Huang, Chen, Krauss & Rodgers, 2004; 4Neal & Griffin, 2006; 5Spector & Jex, 1998
In addition to the above measures, we also included two questions to measure level of perceived risk for both job specific risk and workplace risk. Job specific risk was assessed by the question: thinking about the kind of work you do, how likely is it that you will get injured on the job? Respondents reported using a five-point response scale from extremely unlikely (1) through somewhat likely (3) to extremely likely (5). Workplace risk was assessed by the question: how would you rate the potential health and safety risks faced by workers at this workplace? Respondents reported using a five-point response scale from no risk at all (1) through moderate degree of risk (3) to a high degree of risk (5).
We also measured self-reported OHS outcomes for the past 12 months. Respondents were asked to report the number they had personally experienced with regard to
reported OHS incidents;
unreported OHS incidents;
near misses;
number of hazards reported; and
days off work as a result of a workplace injury or illness.
The three types of incidents, namely, incidents that were reported to management, incidents that were not reported to management and near misses, were summed to create an additional variable called total incidents. As hazards were issues identified that might cause an incident they were not incorporated into the total incidents variable and were therefore analysed separately. While recognising that there is some debate in the literature about whether near misses are considered to be a lead or lag indicator, in this report they are treated as an OHS outcome.38-40
ISCRR Research Report# 045-0415-R09 Page 24 of 63
Workplace questionnaire
In phase two, a separate questionnaire was sent to an OHS manager from each organisation. The OHS manager was asked to provide data on several OHS outcomes for each participating workplace for a three month time period following the administration of the phase one survey. These data included the number of: reported OHS incidents; reported near misses; reported hazards.
OHS managers were also asked to report workplace data on the number of lost time injuries; medical treatment injuries; and the number of hours worked in the preceding three-month time period. Lost-time injury frequency rates were calculated as the number of lost-time injuries divided by the total number of hours worked multiplied by 1,000,000. Similarly, medical treatment injury rates were calculated as the number of medical treatment injuries divided by the total number of hours worked multiplied by 1,000,000. Definitions of these variables can be found in Table 2.
Procedure
All employees at each participating workplace had the opportunity to complete the survey. The invitation to participate in and distribution of the survey depended on both workplace context and whether the questionnaire was administered using pencil and paper or online.
Pencil and paper surveys were distributed at toolbox meetings or through the internal mail. In workplaces where employees gathered for toolbox meetings, provision was made for the researchers to attend the meeting to distribute information sheets and surveys. Respondents completed the questionnaires at the toolbox meeting and returned them in a sealed envelope directly to the researchers. In other organisations the survey was distributed through the internal mail where respondents completed the survey in their time and returned the questionnaires in a sealed envelope to a central collection point within their workplace.
Where the questionnaire was administered online, employees were sent an invitation email that contained a link to the survey. Respondents completing the surveys online or those who completed the pencil and paper surveys at their own pace were given two reminders two and four weeks after the initial invitation.
ISCRR Research Report# 045-0415-R09 Page 25 of 63
Results
The results from phases one and two are reported as follows:
description of the sample;
an evaluation of OHS leading indicators, as measured by the OPM-MU;
OPM-MU scores across employee groups within the sample;
OPM-MU scores across participating organisations;
employee perceptions of OHS and risk within the workplace;
OHS outcomes at both the employee and workplace levels; and
an examination of the relationships between scores on the OPM-MU and other leading and lagging measures of OHS.
Description of the sample
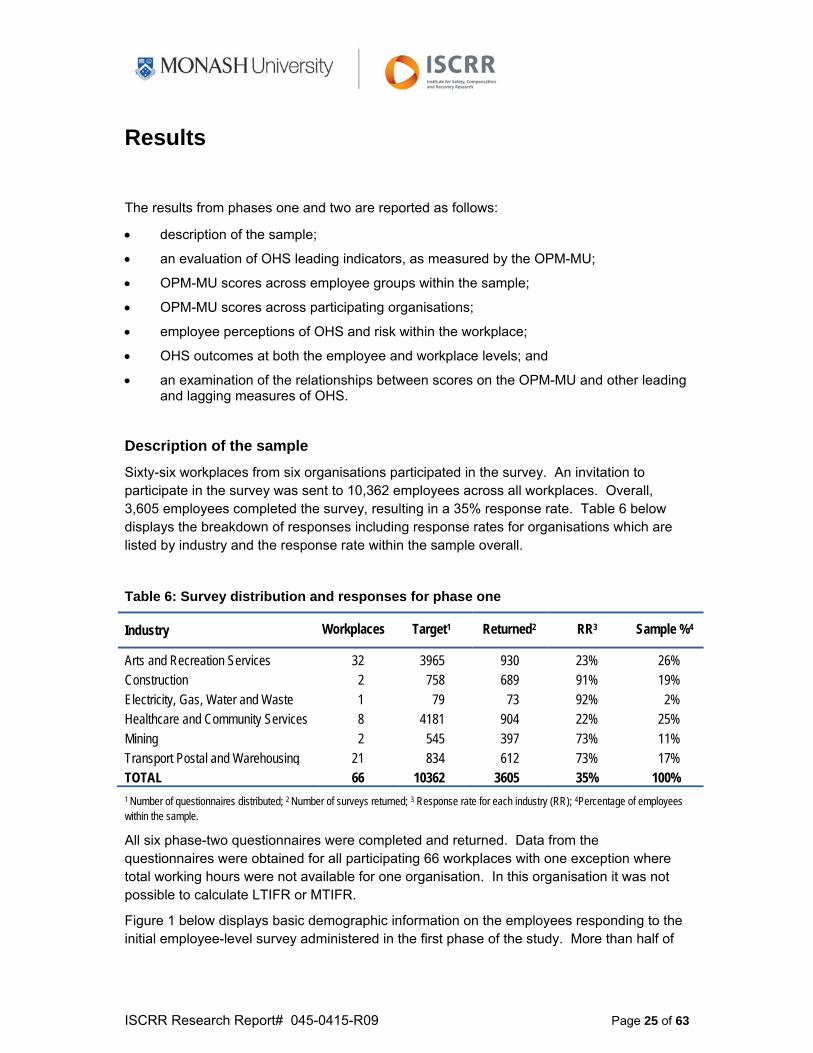
Sixty-six workplaces from six organisations participated in the survey. An invitation to participate in the survey was sent to 10,362 employees across all workplaces. Overall, 3,605 employees completed the survey, resulting in a 35% response rate. Table 6 below displays the breakdown of responses including response rates for organisations which are listed by industry and the response rate within the sample overall.
Table 6: Survey distribution and responses for phase one
Industry Workplaces Target1 Returned2 RR3 Sample %4
Arts and Recreation Services 32 3965 930 23% 26% Construction 2 758 689 91% 19% Electricity, Gas, Water and Waste 1 79 73 92% 2% Healthcare and Community Services 8 4181 904 22% 25% Mining 2 545 397 73% 11% Transport Postal and Warehousing 21 834 612 73% 17% TOTAL 66 10362 3605 35% 100% 1 Number of questionnaires distributed; 2 Number of surveys returned; 3 Response rate for each industry (RR); 4Percentage of employees within the sample.
All six phase-two questionnaires were completed and returned. Data from the questionnaires were obtained for all participating 66 workplaces with one exception where total working hours were not available for one organisation. In this organisation it was not possible to calculate LTIFR or MTIFR.
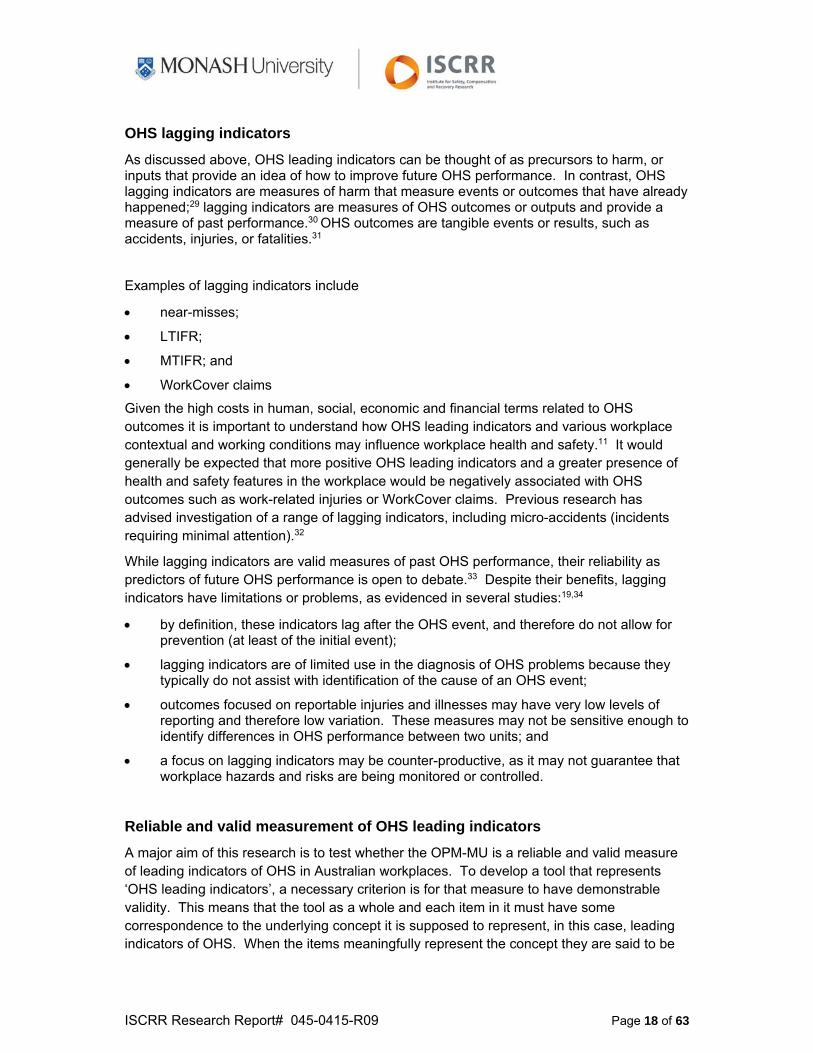
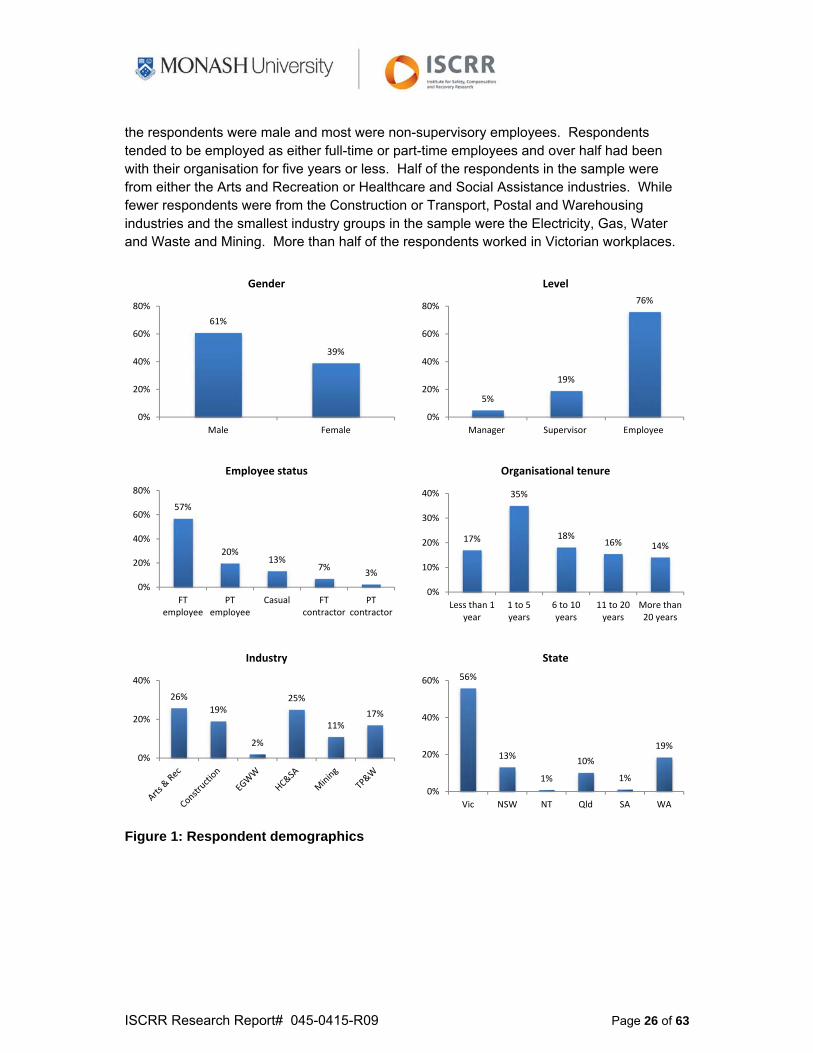
Figure 1 below displays basic demographic information on the employees responding to the initial employee-level survey administered in the first phase of the study. More than half of
ISCRR Research Report# 045-0415-R09 Page 26 of 63
the respondents were male and most were non-supervisory employees. Respondents tended to be employed as either full-time or part-time employees and over half had been with their organisation for five years or less. Half of the respondents in the sample were from either the Arts and Recreation or Healthcare and Social Assistance industries. While fewer respondents were from the Construction or Transport, Postal and Warehousing industries and the smallest industry groups in the sample were the Electricity, Gas, Water and Waste and Mining. More than half of the respondents worked in Victorian workplaces.
Figure 1: Respondent demographics
61%
39%
0%
20%
40%
60%
80%
Male Female
Gender
5%
19%
76%
0%
20%
40%
60%
80%
Manager Supervisor Employee
Level
57%
20%13%
7%3%
0%
20%
40%
60%
80%
FTemployee
PTemployee
Casual FTcontractor
PTcontractor
Employee status
17%
35%
18%16% 14%
0%
10%
20%
30%
40%
Less than 1year
1 to 5years
6 to 10years
11 to 20years
More than20 years
Organisational tenure
26%
19%
2%
25%
11%17%
0%
20%
40%
Industry
56%
13%
1%
10%
1%
19%
0%
20%
40%
60%
Vic NSW NT Qld SA WA
State
ISCRR Research Report# 045-0415-R09 Page 27 of 63
Evaluation of OHS leading indicators
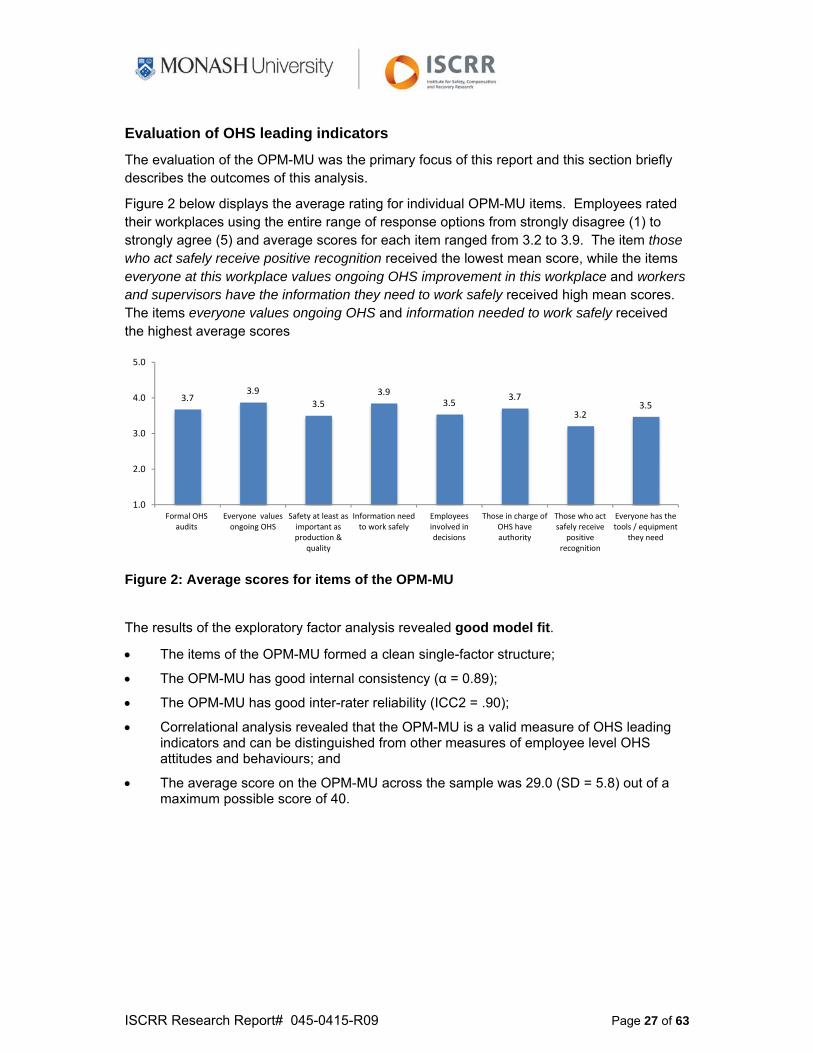
The evaluation of the OPM-MU was the primary focus of this report and this section briefly describes the outcomes of this analysis.
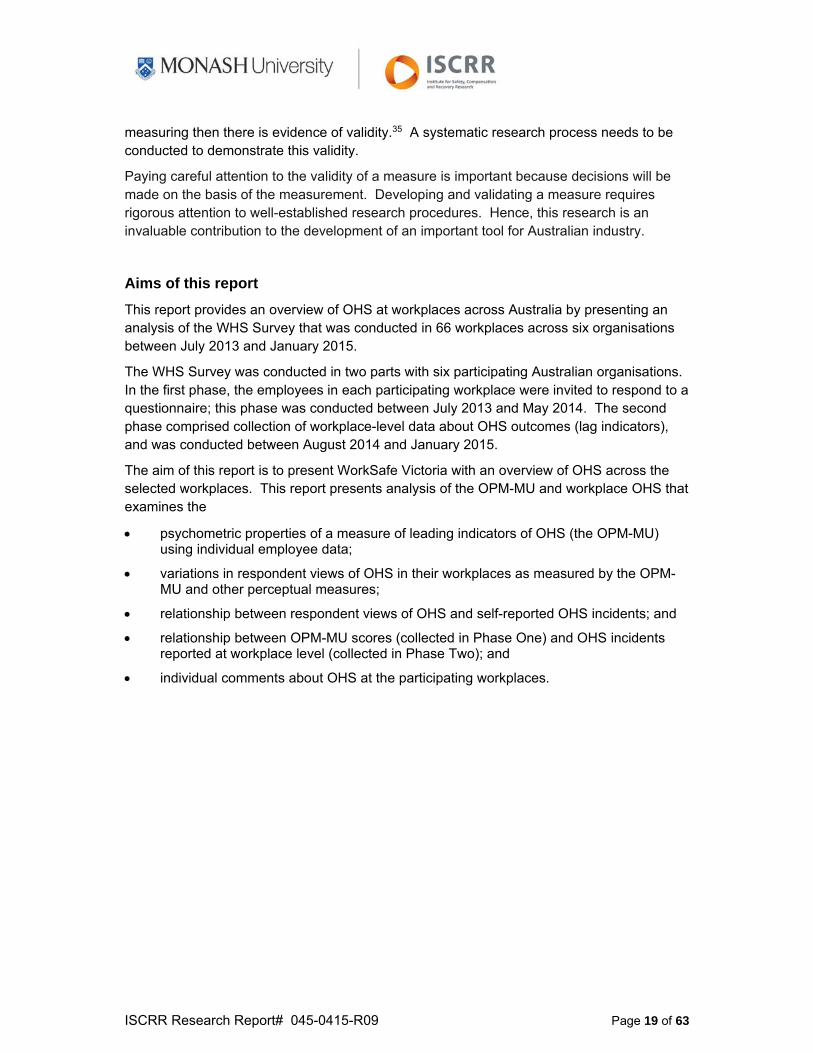
Figure 2 below displays the average rating for individual OPM-MU items. Employees rated their workplaces using the entire range of response options from strongly disagree (1) to strongly agree (5) and average scores for each item ranged from 3.2 to 3.9. The item those who act safely receive positive recognition received the lowest mean score, while the items everyone at this workplace values ongoing OHS improvement in this workplace and workers and supervisors have the information they need to work safely received high mean scores. The items everyone values ongoing OHS and information needed to work safely received the highest average scores
Figure 2: Average scores for items of the OPM-MU
The results of the exploratory factor analysis revealed good model fit.
The items of the OPM-MU formed a clean single-factor structure;
The OPM-MU has good internal consistency (α = 0.89);
The OPM-MU has good inter-rater reliability (ICC2 = .90);
Correlational analysis revealed that the OPM-MU is a valid measure of OHS leading indicators and can be distinguished from other measures of employee level OHS attitudes and behaviours; and
The average score on the OPM-MU across the sample was 29.0 (SD = 5.8) out of a maximum possible score of 40.
3.73.9
3.53.9
3.53.7
3.23.5
1.0
2.0
3.0
4.0
5.0
Formal OHSaudits
Everyone valuesongoing OHS
Safety at least asimportant asproduction &
quality
Information needto work safely
Employeesinvolved indecisions
Those in charge ofOHS haveauthority
Those who actsafely receive
positiverecognition
Everyone has thetools / equipment
they need
ISCRR Research Report# 045-0415-R09 Page 28 of 63
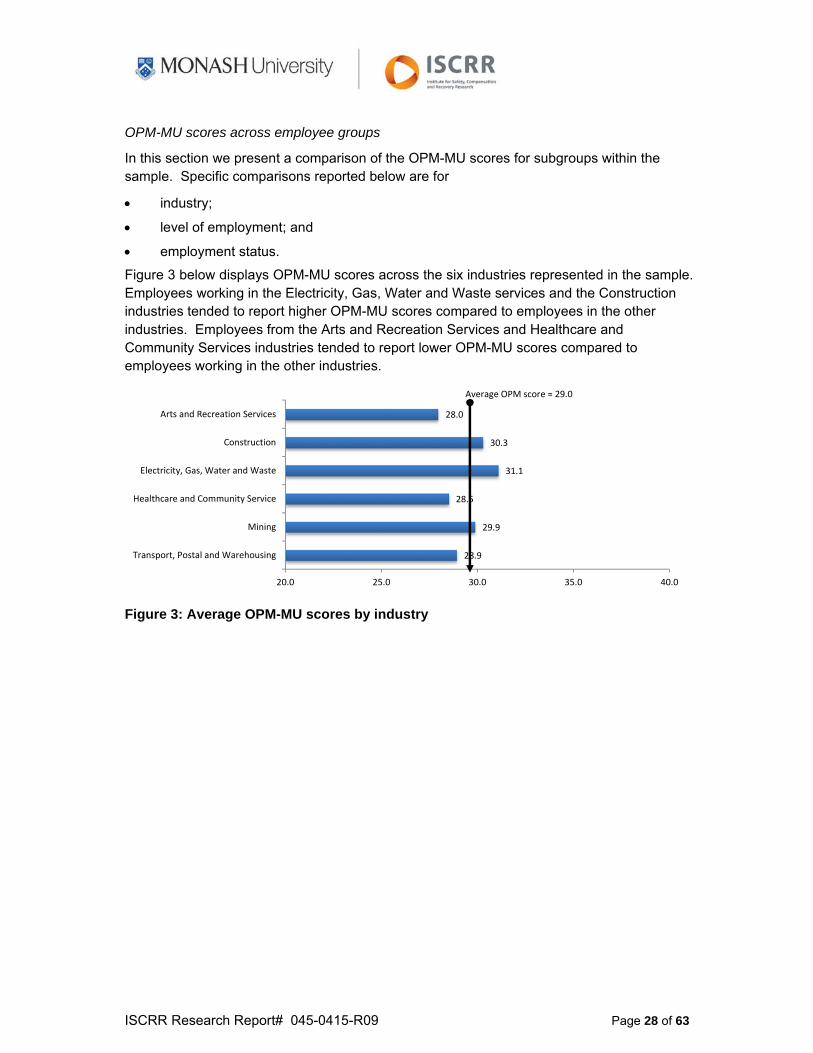
OPM-MU scores across employee groups
In this section we present a comparison of the OPM-MU scores for subgroups within the sample. Specific comparisons reported below are for
industry;
level of employment; and
employment status.
Figure 3 below displays OPM-MU scores across the six industries represented in the sample. Employees working in the Electricity, Gas, Water and Waste services and the Construction industries tended to report higher OPM-MU scores compared to employees in the other industries. Employees from the Arts and Recreation Services and Healthcare and Community Services industries tended to report lower OPM-MU scores compared to employees working in the other industries.
Figure 3: Average OPM-MU scores by industry
28.9
29.9
28.5
31.1
30.3
28.0
20.0 25.0 30.0 35.0 40.0
Transport, Postal and Warehousing
Mining
Healthcare and Community Service
Electricity, Gas, Water and Waste
Construction
Arts and Recreation Services
Average OPM score = 29.0
ISCRR Research Report# 045-0415-R09 Page 29 of 63
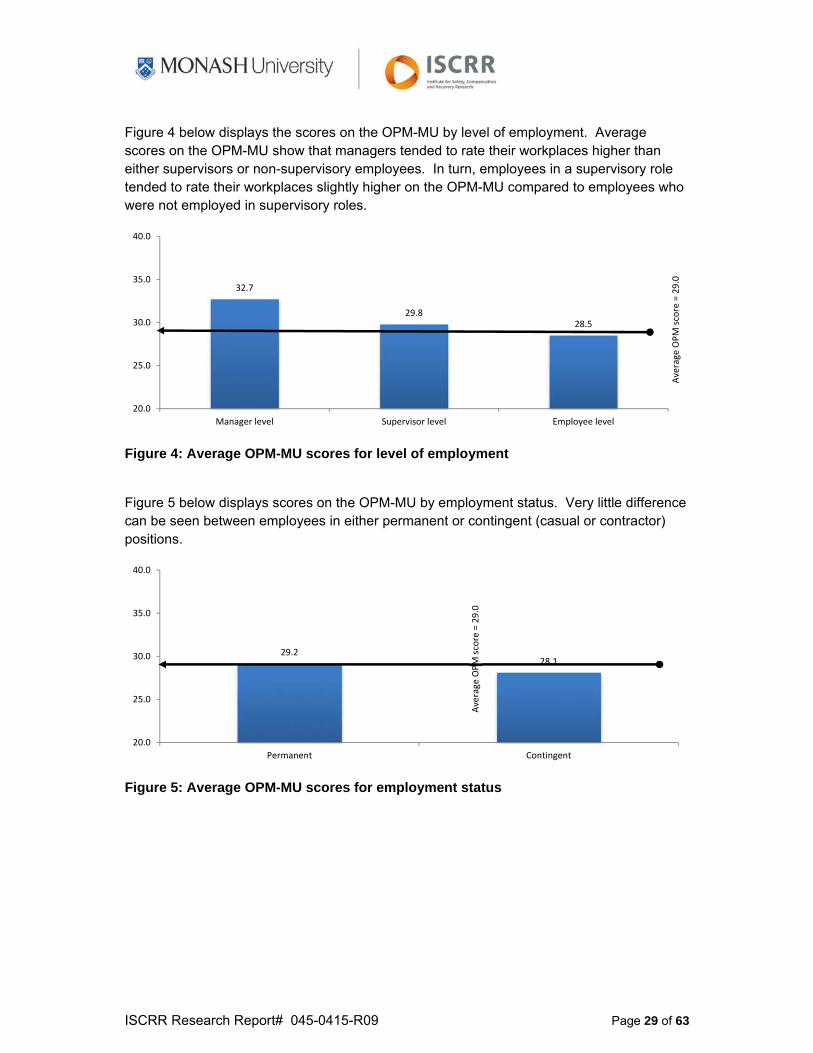
Figure 4 below displays the scores on the OPM-MU by level of employment. Average scores on the OPM-MU show that managers tended to rate their workplaces higher than either supervisors or non-supervisory employees. In turn, employees in a supervisory role tended to rate their workplaces slightly higher on the OPM-MU compared to employees who were not employed in supervisory roles.
Figure 4: Average OPM-MU scores for level of employment
Figure 5 below displays scores on the OPM-MU by employment status. Very little difference can be seen between employees in either permanent or contingent (casual or contractor) positions.
Figure 5: Average OPM-MU scores for employment status
29.228.1
20.0
25.0
30.0
35.0
40.0
Permanent Contingent
32.7
29.828.5
20.0
25.0
30.0
35.0
40.0
Manager level Supervisor level Employee level
Average OPM score = 29.0
Average OPM score = 29.0
ISCRR Research Report# 045-0415-R09 Page 30 of 63
OPM-MU scores across organisations
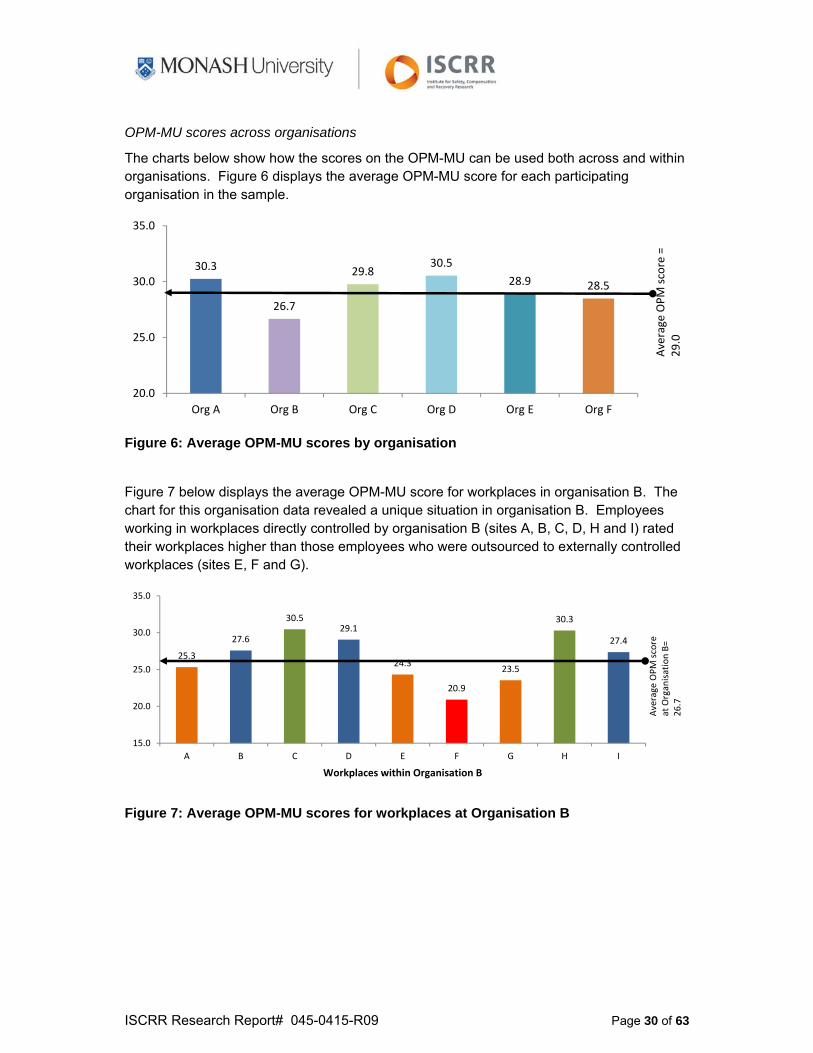
The charts below show how the scores on the OPM-MU can be used both across and within organisations. Figure 6 displays the average OPM-MU score for each participating organisation in the sample.
Figure 6: Average OPM-MU scores by organisation
Figure 7 below displays the average OPM-MU score for workplaces in organisation B. The chart for this organisation data revealed a unique situation in organisation B. Employees working in workplaces directly controlled by organisation B (sites A, B, C, D, H and I) rated their workplaces higher than those employees who were outsourced to externally controlled workplaces (sites E, F and G).
Figure 7: Average OPM-MU scores for workplaces at Organisation B
30.3
26.7
29.830.5
28.9 28.5
20.0
25.0
30.0
35.0
Org A Org B Org C Org D Org E Org F
Average OPM score =
29.0
25.3
27.6
30.529.1
24.3
20.9
23.5
30.3
27.4
15.0
20.0
25.0
30.0
35.0
A B C D E F G H I
Workplaces within Organisation B
Average OPM score
at Organisation B=
26.7
ISCRR Research Report# 045-0415-R09 Page 31 of 63
Occupational health and safety
Perceptions of OHS and risk
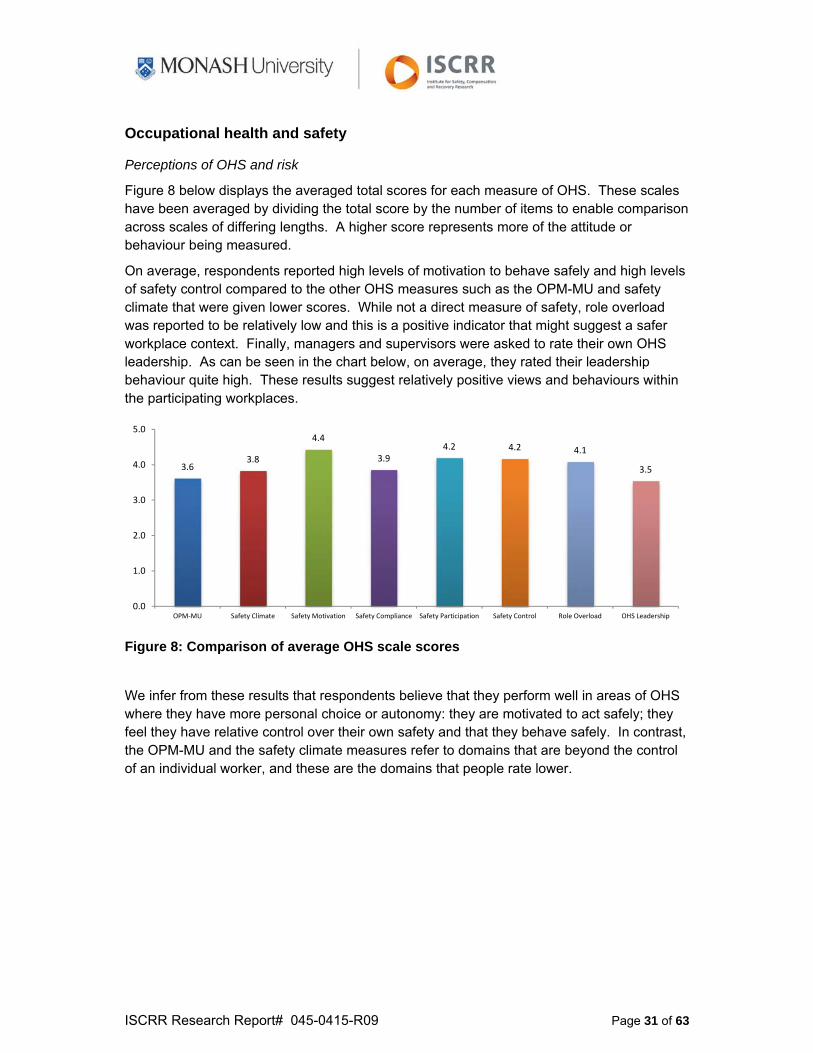
Figure 8 below displays the averaged total scores for each measure of OHS. These scales have been averaged by dividing the total score by the number of items to enable comparison across scales of differing lengths. A higher score represents more of the attitude or behaviour being measured.
On average, respondents reported high levels of motivation to behave safely and high levels of safety control compared to the other OHS measures such as the OPM-MU and safety climate that were given lower scores. While not a direct measure of safety, role overload was reported to be relatively low and this is a positive indicator that might suggest a safer workplace context. Finally, managers and supervisors were asked to rate their own OHS leadership. As can be seen in the chart below, on average, they rated their leadership behaviour quite high. These results suggest relatively positive views and behaviours within the participating workplaces.
Figure 8: Comparison of average OHS scale scores
We infer from these results that respondents believe that they perform well in areas of OHS where they have more personal choice or autonomy: they are motivated to act safely; they feel they have relative control over their own safety and that they behave safely. In contrast, the OPM-MU and the safety climate measures refer to domains that are beyond the control of an individual worker, and these are the domains that people rate lower.
3.63.8
4.4
3.94.2 4.2 4.1
3.5
0.0
1.0
2.0
3.0
4.0
5.0
OPM‐MU Safety Climate Safety Motivation Safety Compliance Safety Participation Safety Control Role Overload OHS Leadership
ISCRR Research Report# 045-0415-R09 Page 32 of 63
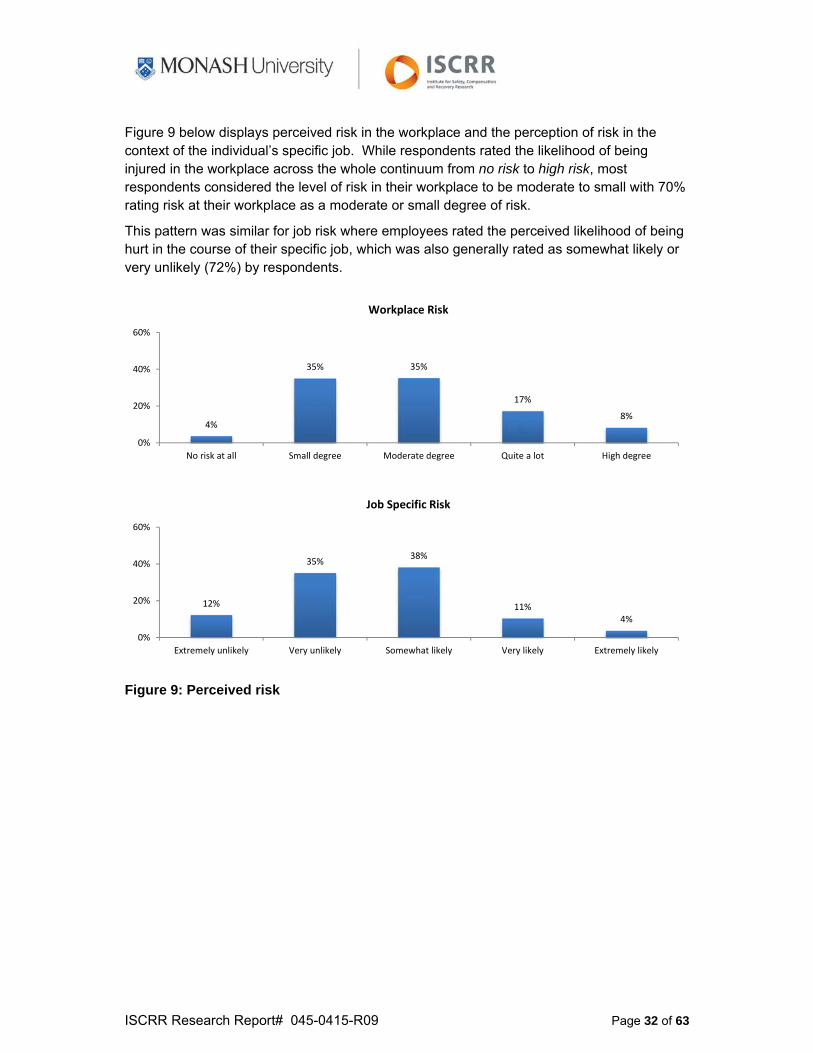
Figure 9 below displays perceived risk in the workplace and the perception of risk in the context of the individual’s specific job. While respondents rated the likelihood of being injured in the workplace across the whole continuum from no risk to high risk, most respondents considered the level of risk in their workplace to be moderate to small with 70% rating risk at their workplace as a moderate or small degree of risk.
This pattern was similar for job risk where employees rated the perceived likelihood of being hurt in the course of their specific job, which was also generally rated as somewhat likely or very unlikely (72%) by respondents.
Figure 9: Perceived risk
4%
35% 35%
17%
8%
0%
20%
40%
60%
No risk at all Small degree Moderate degree Quite a lot High degree
Workplace Risk
12%
35%38%
11%4%
0%
20%
40%
60%
Extremely unlikely Very unlikely Somewhat likely Very likely Extremely likely
Job Specific Risk
ISCRR Research Report# 045-0415-R09 Page 33 of 63
OHS outcomes
Employee outcomes
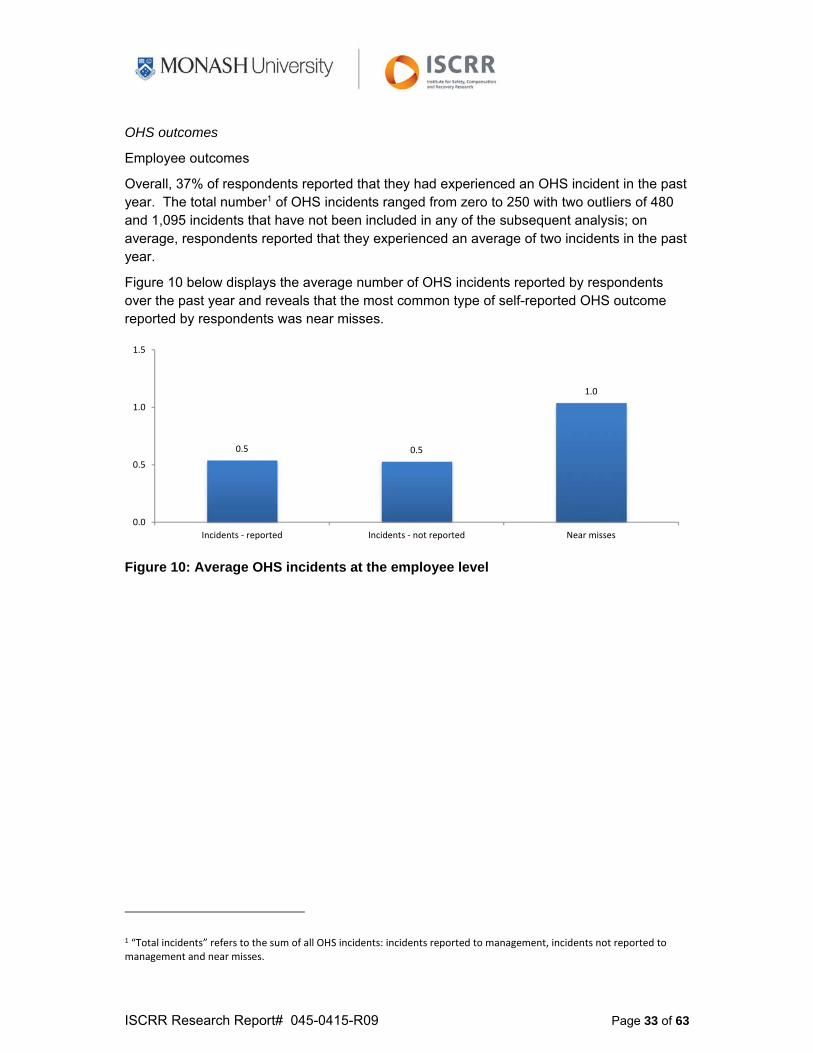
Overall, 37% of respondents reported that they had experienced an OHS incident in the past year. The total number1 of OHS incidents ranged from zero to 250 with two outliers of 480 and 1,095 incidents that have not been included in any of the subsequent analysis; on average, respondents reported that they experienced an average of two incidents in the past year.
Figure 10 below displays the average number of OHS incidents reported by respondents over the past year and reveals that the most common type of self-reported OHS outcome reported by respondents was near misses.
Figure 10: Average OHS incidents at the employee level
1 “Total incidents” refers to the sum of all OHS incidents: incidents reported to management, incidents not reported to management and near misses.
0.5 0.5
1.0
0.0
0.5
1.0
1.5
Incidents ‐ reported Incidents ‐ not reported Near misses
ISCRR Research Report# 045-0415-R09 Page 34 of 63
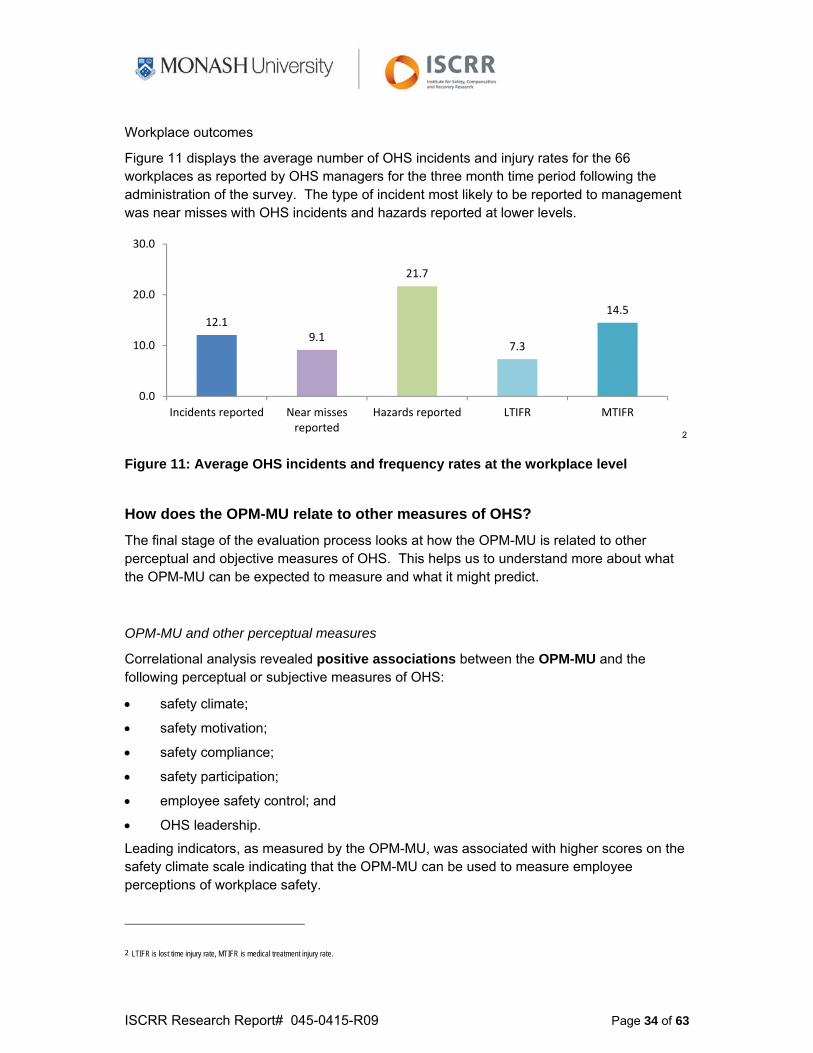
Workplace outcomes
Figure 11 displays the average number of OHS incidents and injury rates for the 66 workplaces as reported by OHS managers for the three month time period following the administration of the survey. The type of incident most likely to be reported to management was near misses with OHS incidents and hazards reported at lower levels.
2
Figure 11: Average OHS incidents and frequency rates at the workplace level
How does the OPM-MU relate to other measures of OHS?
The final stage of the evaluation process looks at how the OPM-MU is related to other perceptual and objective measures of OHS. This helps us to understand more about what the OPM-MU can be expected to measure and what it might predict.
OPM-MU and other perceptual measures
Correlational analysis revealed positive associations between the OPM-MU and the following perceptual or subjective measures of OHS:
safety climate;
safety motivation;
safety compliance;
safety participation;
employee safety control; and
OHS leadership.
Leading indicators, as measured by the OPM-MU, was associated with higher scores on the safety climate scale indicating that the OPM-MU can be used to measure employee perceptions of workplace safety.
2 LTIFR is lost time injury rate, MTIFR is medical treatment injury rate.
12.19.1
21.7
7.3
14.5
0.0
10.0
20.0
30.0
Incidents reported Near missesreported
Hazards reported LTIFR MTIFR
ISCRR Research Report# 045-0415-R09 Page 35 of 63
Importantly, the OPM-MU is also associated with other employee perceptions and behaviours: safety motivation, safety compliance, safety participation and safety control. Employees who rated their workplace at higher levels on leading indicators of OHS tended to report that they had higher levels of motivation to behave safely, behaved more safely and felt a greater sense of safety control compared to those who rated their workplaces lower on leading indicators of OHS. Managers and supervisors who rated their workplace at higher levels on leading indicators of OHS also tended to rate their own OHS leadership higher.
There was negative association between the OPM-MU and role overload. A higher score on leading indicators, as measured by the OPM-MU, was associated with lower levels of role overload.
OPM-MU and employee self-reported OHS outcomes
Analysis between employee scores on the OPM-MU and their self-reported OHS incidents revealed differing results depending on the type of OHS incident.
There were negative associations between scores on the OPM-MU and
unreported incidents; and
near misses.
Respondents who rated their workplaces higher on leading indicators of OHS, as measured by the OPM-MU, reported experiencing fewer OHS incidents that went unreported to management. Similarly, respondents who rated their workplaces higher on leading indicators, as measured by the OPM-MU, also reported experiencing fewer near misses.
There was no association between the OPM-MU and reported incidents; however, reporting incidents to management may not just show that an OHS incident occurred. The level of reported incidents might, to some degree, indicate the presence of a transparent and/or readily useable reporting system that enables employees to effectively and efficiently convey information regarding OHS incidents to management.
OPM-MU and workplace OHS outcomes
Employee OPM-MU scores were averaged within each workplace to create an average OPM-MU score for each of the 66 workplaces. We used these ‘aggregated’ scores to examine the relationship between the presence of leading indicators of OHS in the workplace (as measured by the OPM-MU) and OHS outcomes reported by the OHS manager.
There were negative associations between the OPM-MU and
LTIFR; and
MTIFR.
Workplaces that were rated higher on leading indicators of OHS, as measured by the OPM-MU, had lower lost-time injury frequency rates than workplaces with lower ratings on the OPM-MU.
ISCRR Research Report# 045-0415-R09 Page 36 of 63
Similarly, workplaces that were rated higher on leading indicators of OHS, as measured by the OPM-MU, had lower medical treatment injury frequency rates than workplaces with lower ratings on the OPM-MU
There was no association between the OPM-MU and reported incidents, reported hazards or reported near misses.
Comments by respondents about OHS
Respondents were given the opportunity to add comments about OHS at their workplace with an open-ended question. Respondents were asked to “please enter any comments about health and safety in your workplace you consider important and that the questionnaire did not cover.”
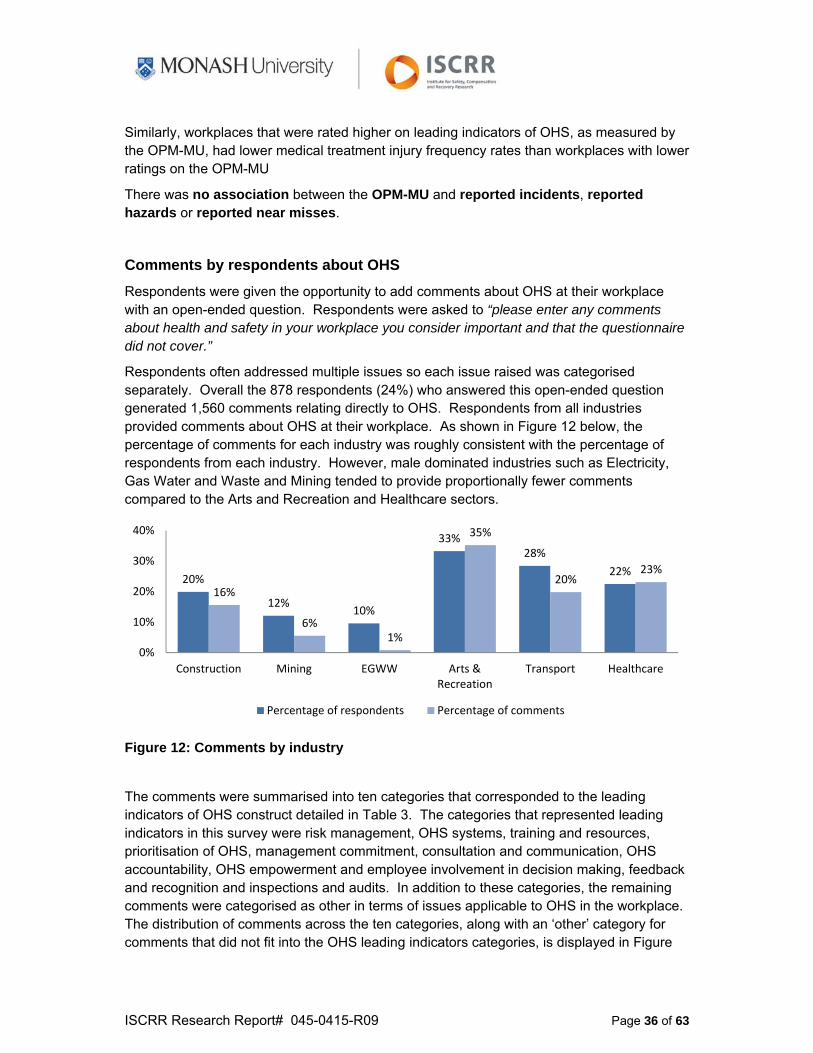
Respondents often addressed multiple issues so each issue raised was categorised separately. Overall the 878 respondents (24%) who answered this open-ended question generated 1,560 comments relating directly to OHS. Respondents from all industries provided comments about OHS at their workplace. As shown in Figure 12 below, the percentage of comments for each industry was roughly consistent with the percentage of respondents from each industry. However, male dominated industries such as Electricity, Gas Water and Waste and Mining tended to provide proportionally fewer comments compared to the Arts and Recreation and Healthcare sectors.
Figure 12: Comments by industry
The comments were summarised into ten categories that corresponded to the leading indicators of OHS construct detailed in Table 3. The categories that represented leading indicators in this survey were risk management, OHS systems, training and resources, prioritisation of OHS, management commitment, consultation and communication, OHS accountability, OHS empowerment and employee involvement in decision making, feedback and recognition and inspections and audits. In addition to these categories, the remaining comments were categorised as other in terms of issues applicable to OHS in the workplace. The distribution of comments across the ten categories, along with an ‘other’ category for comments that did not fit into the OHS leading indicators categories, is displayed in Figure
20%
12%10%
33%28%
22%
16%
6%1%
35%
20%23%
0%
10%
20%
30%
40%
Construction Mining EGWW Arts &Recreation
Transport Healthcare
Percentage of respondents Percentage of comments
ISCRR Research Report# 045-0415-R09 Page 37 of 63
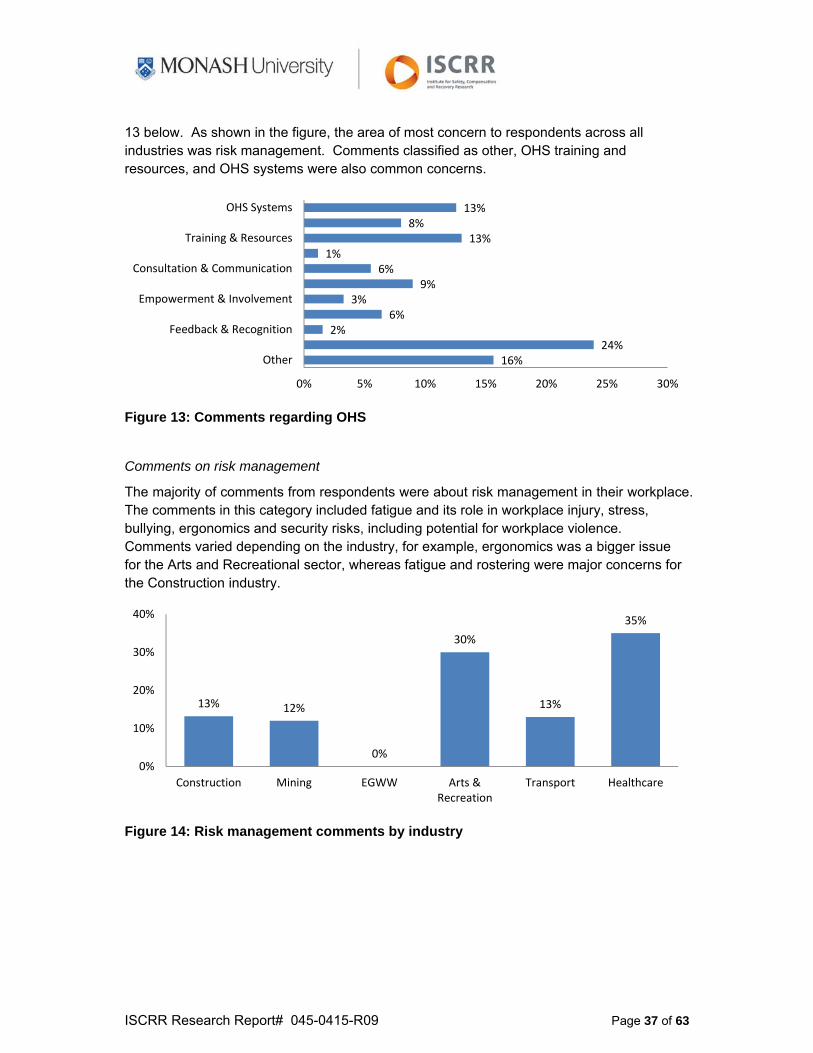
13 below. As shown in the figure, the area of most concern to respondents across all industries was risk management. Comments classified as other, OHS training and resources, and OHS systems were also common concerns.
Figure 13: Comments regarding OHS
Comments on risk management
The majority of comments from respondents were about risk management in their workplace. The comments in this category included fatigue and its role in workplace injury, stress, bullying, ergonomics and security risks, including potential for workplace violence. Comments varied depending on the industry, for example, ergonomics was a bigger issue for the Arts and Recreational sector, whereas fatigue and rostering were major concerns for the Construction industry.
Figure 14: Risk management comments by industry
16%24%
2%6%
3%9%
6%1%
13%8%
13%
0% 5% 10% 15% 20% 25% 30%
Other
Feedback & Recognition
Empowerment & Involvement
Consultation & Communication
Training & Resources
OHS Systems
13% 12%
0%
30%
13%
35%
0%
10%
20%
30%
40%
Construction Mining EGWW Arts &Recreation
Transport Healthcare
ISCRR Research Report# 045-0415-R09 Page 38 of 63
Examples of comments in the risk management category:
Fatigue is an issue, especially when we get an 8 hour break between shifts. [Transport]
I believe health and safety is important in the workplace however, at times feel its focuses more on physical injury rather than psychological. A workplace with a bullying culture the psychological impact is far greater than a physical impact. A majority of the time this is ignored and not properly dealt with. [Healthcare]
I believe the structure for OH&S in [workplace name removed] is excellent. However it depends on the incident, I believe bullying is still a large issue that is not dealt with. There are a lot of issues in regards to stress due to low numbers of staff and incorrect tools to complete tasks. These issues are put to the management level but seem to fall on deaf ears. [Arts and Recreation]
I think health and safety sometimes tends to only focus on the physical impact of work and tends to not want to acknowledge the emotional or psychological impact of stress on people or bullying behaviour for that matter. [Healthcare]
FIFO work should be restricted to 3 weeks on and 1 week off and not anymore time away. Too much stress physically and mentally on people and family being away for 4 weeks at a time. [Construction]
The length of swings in the construction industry, for mental well-being, right attitudes have the strongest impacts on a safe work place. [Construction]
No full time work so people take more risks to keep their jobs. [Construction]
Frequent shift changes and night shift conditions with nil sleep breaks produce exhaustion, fatigue and decreased work satisfaction and can lead to OH&S issues with poorer workplace performance and decreased cognitive skills, slower motor responses, etc. [Healthcare]
I work for a company that utilizes another company’s facilities and equipment. Occupational health and safety is a difficult concept when I have no control over the physical parts of my job. [Arts and Recreation]
My group does mostly desk-bound work. The main risk/hazard is related to bad posture and repetitive micro-movements. I don’t think our workstations and chairs are ergonomically appropriate. I've never seen a workplace safety check in our office and I was never requested to carry out one. [Arts and Recreation]
Unfortunately due to the age & disrepair of the [workplace name removed], they are unsafe places to work. Wires hanging from roofs, under tables, [workspaces] and terminals never cleaned and general unsanitary and unsafe work conditions. I do enjoy my job but would like to see these staff areas maintained and repaired. [Arts and Recreation]
For our outreach staff to have increased safety, we need to have confidence that all risks associated with a client and their home environment have a logged on platform that is accessible to all staff. [Healthcare]
The greatest source of threat to my health and safety resides with the unknown and variable - the patient. Otherwise the controllable factors of the work environment are well controlled and monitored. It is a safe place to work. [Healthcare]
Vehicle maintenance is low, e.g., bald tyres on... trucks and other machinery. [Mining]
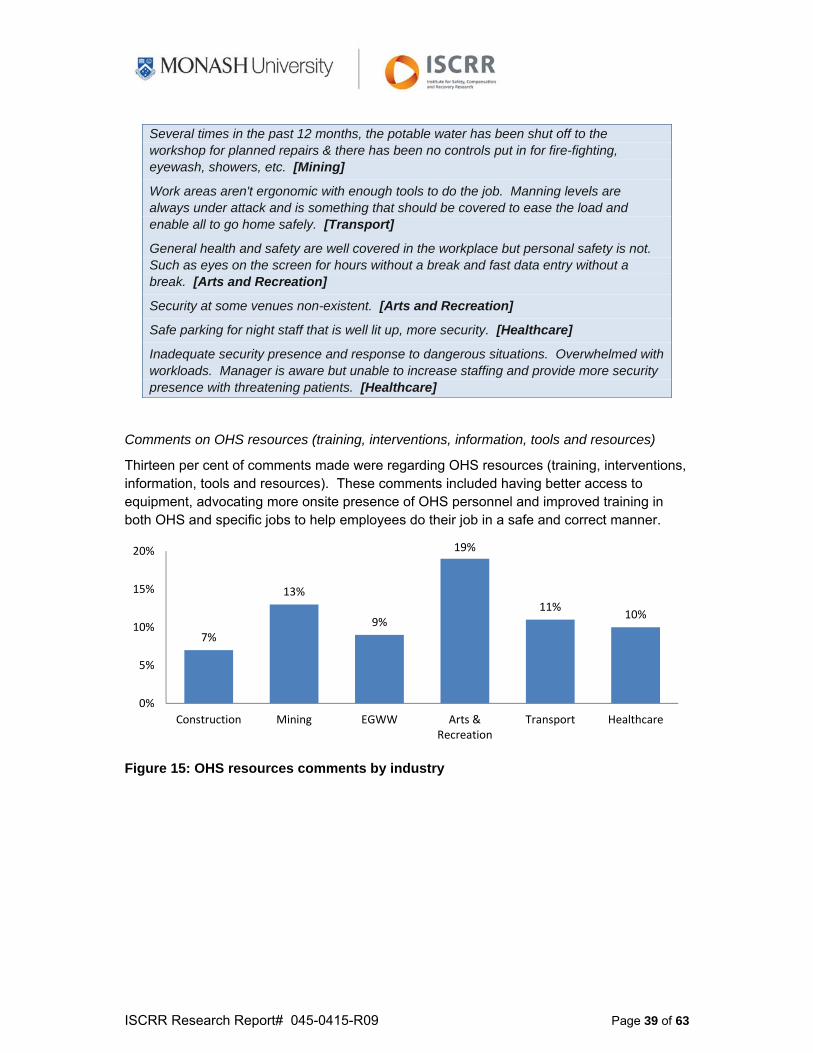
ISCRR Research Report# 045-0415-R09 Page 39 of 63
Several times in the past 12 months, the potable water has been shut off to the workshop for planned repairs & there has been no controls put in for fire-fighting, eyewash, showers, etc. [Mining]
Work areas aren't ergonomic with enough tools to do the job. Manning levels are always under attack and is something that should be covered to ease the load and enable all to go home safely. [Transport]
General health and safety are well covered in the workplace but personal safety is not. Such as eyes on the screen for hours without a break and fast data entry without a break. [Arts and Recreation]
Security at some venues non-existent. [Arts and Recreation]
Safe parking for night staff that is well lit up, more security. [Healthcare]
Inadequate security presence and response to dangerous situations. Overwhelmed with workloads. Manager is aware but unable to increase staffing and provide more security presence with threatening patients. [Healthcare]
Comments on OHS resources (training, interventions, information, tools and resources)
Thirteen per cent of comments made were regarding OHS resources (training, interventions, information, tools and resources). These comments included having better access to equipment, advocating more onsite presence of OHS personnel and improved training in both OHS and specific jobs to help employees do their job in a safe and correct manner.
Figure 15: OHS resources comments by industry
7%
13%
9%
19%
11%10%
0%
5%
10%
15%
20%
Construction Mining EGWW Arts &Recreation
Transport Healthcare
ISCRR Research Report# 045-0415-R09 Page 40 of 63
Examples of comments in the OHS resources category:
More training. [Mining]
There is little in vivo training for responding to a code black/grey in the community compared to fire training or CPR. [Healthcare]
There is no SWMS or MSDS for any facet of my hands-on physical work. There is no training or green card courses offered on request from the company. No site inductions for staff and contractors specific to our site. [Arts and Recreation]
The shortage of experienced operators available forces companies to hire inexperienced staff which in turn puts extra pressure on us as individuals to mentor and look out for them as well as completing our own tasks. [Construction]
Lots of time and effort spent on training for field staff for technical training but also requires other attitudinal/personal training and reinforcement by team leaders/supervisors and quite often they don't fully understand their role and key functions they are responsible for apart from the "physical" work to get done. [Electricity, gas, water & waste]
No formal education to inform staff how to do their work, 'just get it done' attitude. Not enough equipment/stores for job to be carried out. [Healthcare]
Availability and consistency of safety knowledge. [Transport]
Education on Safety for employees that should be a basic component for everyone and not just occur when potential issues or failures are identified or have occurred. [Transport]
I have been here for 6 months and there has not been a fire drill. [Arts and Recreation]
The lack of OHS reps - ones that only work part-time is not really sufficient. [Arts and Recreation]
To have competent OHS staff that can give answers to safety inquiries on the spot. [Arts and Recreation]
Capacity issues make it extremely difficult to devote sufficient time to proactive management of OHS. [Arts and Recreation]
A lot of equipment is old and out of date. [Healthcare]
At times it is difficult to obtain the correct equipment for the task, e.g., wet-weather gear, hoses, etc. [Mining]
Right equipment for the job. [Mining]
8 hours between shift turnaround. Lack of fatigue management. [Transport]
Sometimes hard to work safe with old machinery we have. [Transport]
Consider new chairs that might prevent lower back issues. Consider items to raise monitors to a suitable eye level to prevent stress on the shoulders and neck. [Arts and Recreation]
I believe we need our own desks and headsets as the sharing of headsets leads to [employees] becoming sick and leading to migraines/headaches. This would help the sick leave levels dramatically. [Arts and Recreation]
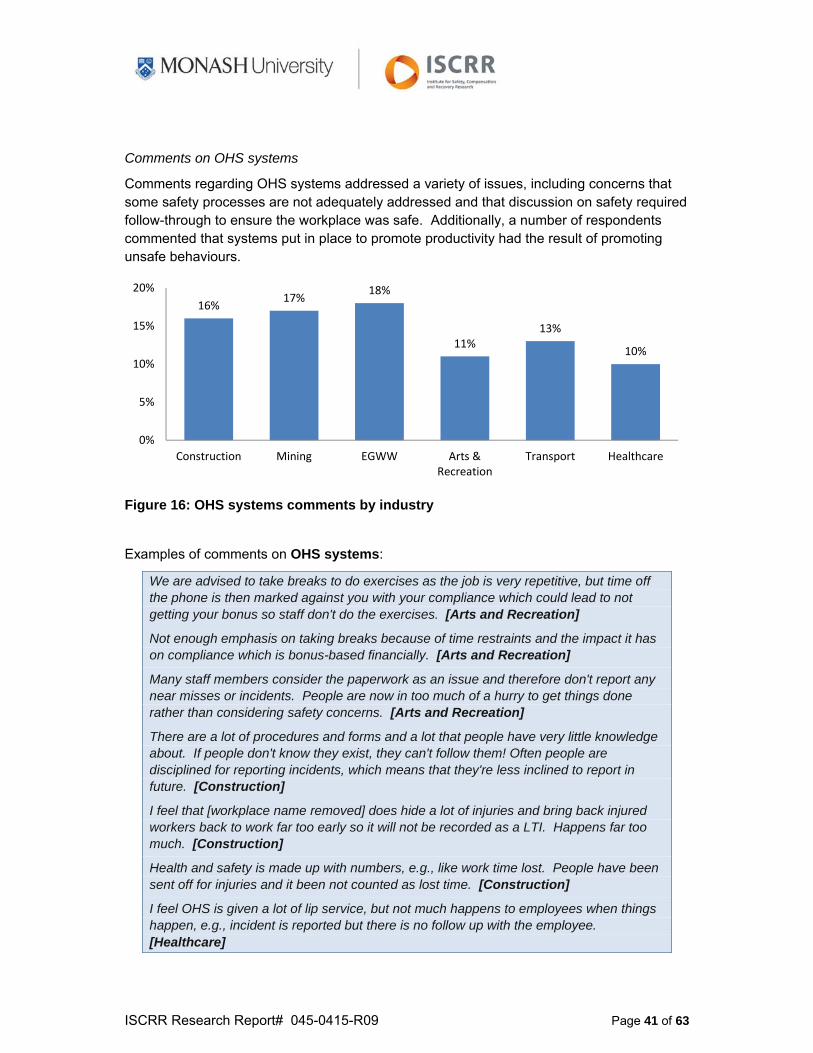
ISCRR Research Report# 045-0415-R09 Page 41 of 63
Comments on OHS systems
Comments regarding OHS systems addressed a variety of issues, including concerns that some safety processes are not adequately addressed and that discussion on safety required follow-through to ensure the workplace was safe. Additionally, a number of respondents commented that systems put in place to promote productivity had the result of promoting unsafe behaviours.
Figure 16: OHS systems comments by industry
Examples of comments on OHS systems:
We are advised to take breaks to do exercises as the job is very repetitive, but time off the phone is then marked against you with your compliance which could lead to not getting your bonus so staff don't do the exercises. [Arts and Recreation]
Not enough emphasis on taking breaks because of time restraints and the impact it has on compliance which is bonus-based financially. [Arts and Recreation]
Many staff members consider the paperwork as an issue and therefore don't report any near misses or incidents. People are now in too much of a hurry to get things done rather than considering safety concerns. [Arts and Recreation]
There are a lot of procedures and forms and a lot that people have very little knowledge about. If people don't know they exist, they can't follow them! Often people are disciplined for reporting incidents, which means that they're less inclined to report in future. [Construction]
I feel that [workplace name removed] does hide a lot of injuries and bring back injured workers back to work far too early so it will not be recorded as a LTI. Happens far too much. [Construction]
Health and safety is made up with numbers, e.g., like work time lost. People have been sent off for injuries and it been not counted as lost time. [Construction]
I feel OHS is given a lot of lip service, but not much happens to employees when things happen, e.g., incident is reported but there is no follow up with the employee. [Healthcare]
16%17%
18%
11%13%
10%
0%
5%
10%
15%
20%
Construction Mining EGWW Arts &Recreation
Transport Healthcare
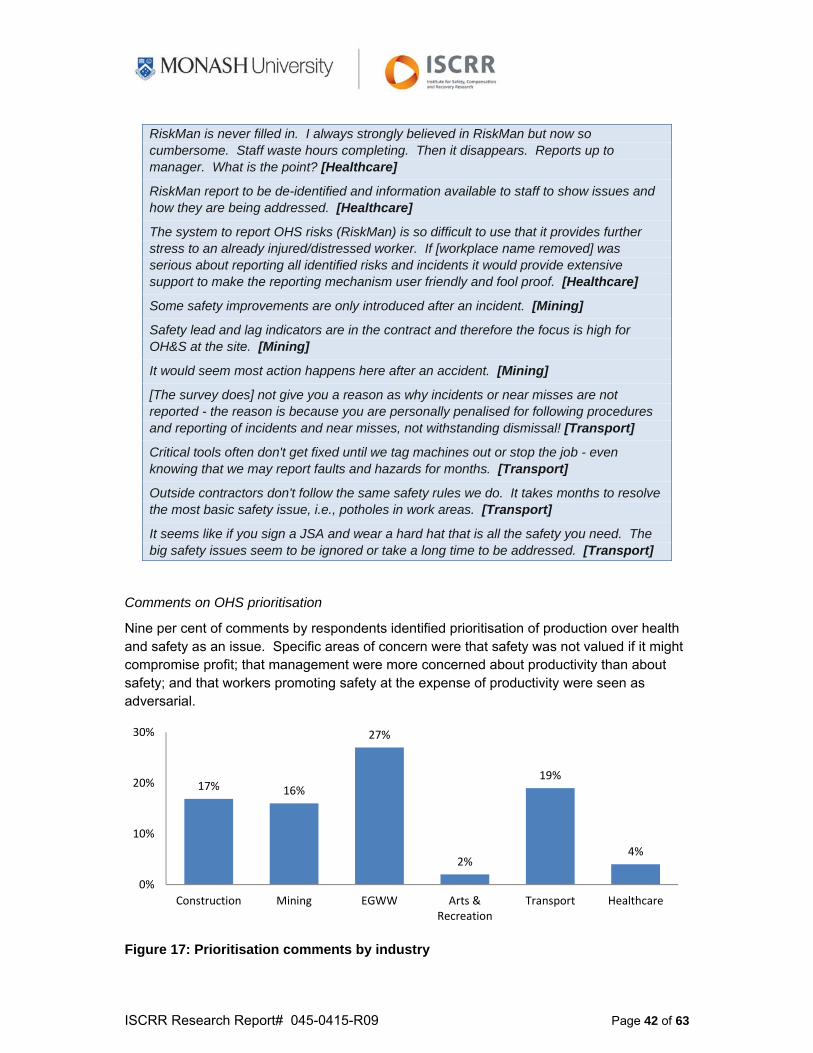
ISCRR Research Report# 045-0415-R09 Page 42 of 63
RiskMan is never filled in. I always strongly believed in RiskMan but now so cumbersome. Staff waste hours completing. Then it disappears. Reports up to manager. What is the point? [Healthcare]
RiskMan report to be de-identified and information available to staff to show issues and how they are being addressed. [Healthcare]
The system to report OHS risks (RiskMan) is so difficult to use that it provides further stress to an already injured/distressed worker. If [workplace name removed] was serious about reporting all identified risks and incidents it would provide extensive support to make the reporting mechanism user friendly and fool proof. [Healthcare]
Some safety improvements are only introduced after an incident. [Mining]
Safety lead and lag indicators are in the contract and therefore the focus is high for OH&S at the site. [Mining]
It would seem most action happens here after an accident. [Mining]
[The survey does] not give you a reason as why incidents or near misses are not reported - the reason is because you are personally penalised for following procedures and reporting of incidents and near misses, not withstanding dismissal! [Transport]
Critical tools often don't get fixed until we tag machines out or stop the job - even knowing that we may report faults and hazards for months. [Transport]
Outside contractors don't follow the same safety rules we do. It takes months to resolve the most basic safety issue, i.e., potholes in work areas. [Transport]
It seems like if you sign a JSA and wear a hard hat that is all the safety you need. The big safety issues seem to be ignored or take a long time to be addressed. [Transport]
Comments on OHS prioritisation
Nine per cent of comments by respondents identified prioritisation of production over health and safety as an issue. Specific areas of concern were that safety was not valued if it might compromise profit; that management were more concerned about productivity than about safety; and that workers promoting safety at the expense of productivity were seen as adversarial.
Figure 17: Prioritisation comments by industry
17% 16%
27%
2%
19%
4%
0%
10%
20%
30%
Construction Mining EGWW Arts &Recreation
Transport Healthcare
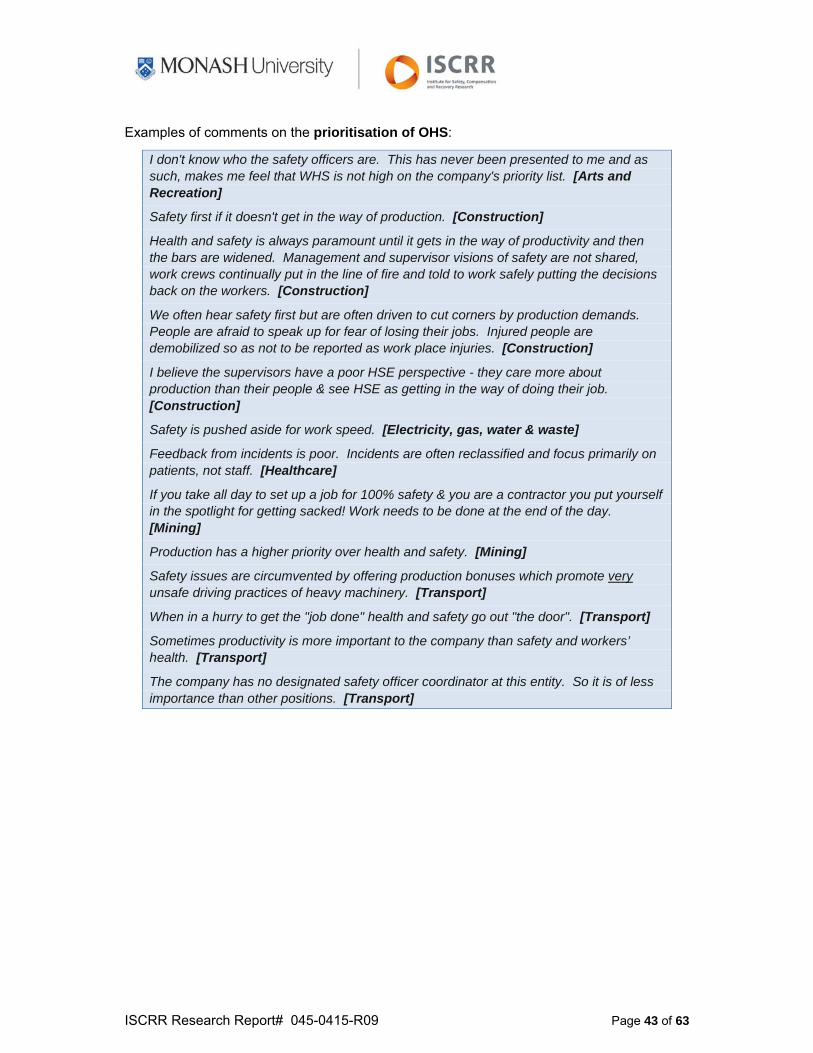
ISCRR Research Report# 045-0415-R09 Page 43 of 63
Examples of comments on the prioritisation of OHS:
I don't know who the safety officers are. This has never been presented to me and as such, makes me feel that WHS is not high on the company's priority list. [Arts and Recreation]
Safety first if it doesn't get in the way of production. [Construction]
Health and safety is always paramount until it gets in the way of productivity and then the bars are widened. Management and supervisor visions of safety are not shared, work crews continually put in the line of fire and told to work safely putting the decisions back on the workers. [Construction]
We often hear safety first but are often driven to cut corners by production demands. People are afraid to speak up for fear of losing their jobs. Injured people are demobilized so as not to be reported as work place injuries. [Construction]
I believe the supervisors have a poor HSE perspective - they care more about production than their people & see HSE as getting in the way of doing their job. [Construction]
Safety is pushed aside for work speed. [Electricity, gas, water & waste]
Feedback from incidents is poor. Incidents are often reclassified and focus primarily on patients, not staff. [Healthcare]
If you take all day to set up a job for 100% safety & you are a contractor you put yourself in the spotlight for getting sacked! Work needs to be done at the end of the day. [Mining]
Production has a higher priority over health and safety. [Mining]
Safety issues are circumvented by offering production bonuses which promote very unsafe driving practices of heavy machinery. [Transport]
When in a hurry to get the "job done" health and safety go out "the door". [Transport]
Sometimes productivity is more important to the company than safety and workers’ health. [Transport]
The company has no designated safety officer coordinator at this entity. So it is of less importance than other positions. [Transport]
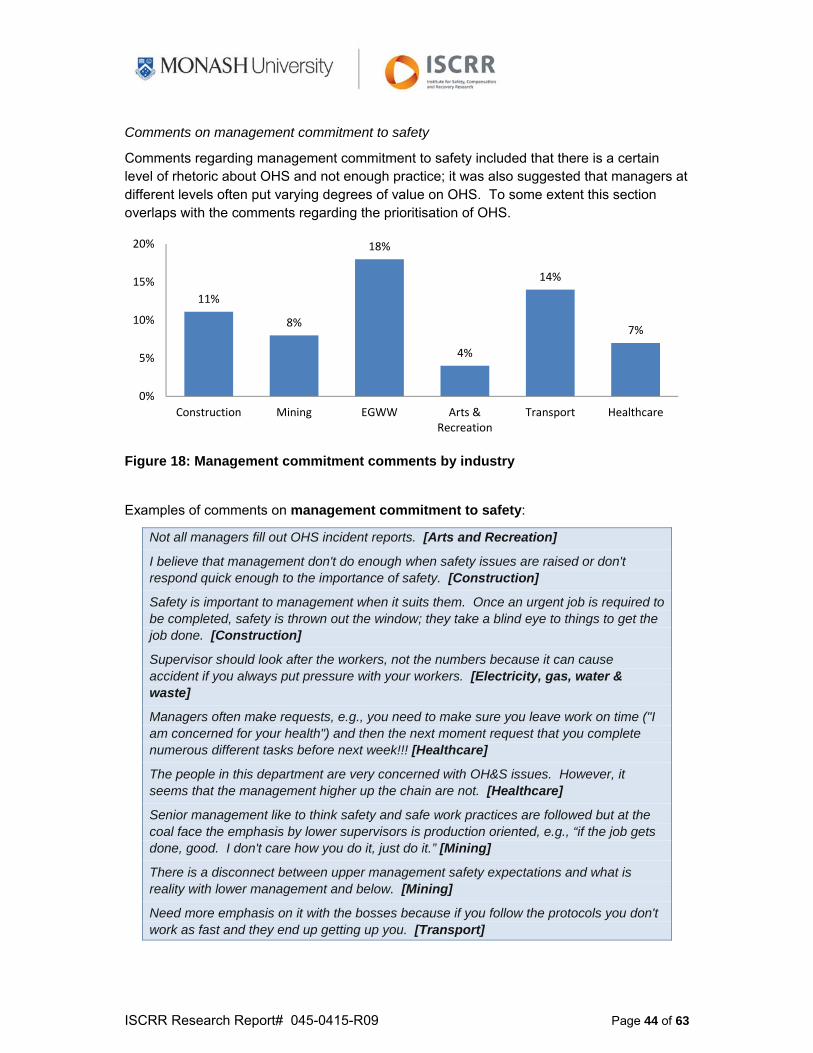
ISCRR Research Report# 045-0415-R09 Page 44 of 63
Comments on management commitment to safety
Comments regarding management commitment to safety included that there is a certain level of rhetoric about OHS and not enough practice; it was also suggested that managers at different levels often put varying degrees of value on OHS. To some extent this section overlaps with the comments regarding the prioritisation of OHS.
Figure 18: Management commitment comments by industry
Examples of comments on management commitment to safety:
Not all managers fill out OHS incident reports. [Arts and Recreation]
I believe that management don't do enough when safety issues are raised or don't respond quick enough to the importance of safety. [Construction]
Safety is important to management when it suits them. Once an urgent job is required to be completed, safety is thrown out the window; they take a blind eye to things to get the job done. [Construction]
Supervisor should look after the workers, not the numbers because it can cause accident if you always put pressure with your workers. [Electricity, gas, water & waste]
Managers often make requests, e.g., you need to make sure you leave work on time ("I am concerned for your health") and then the next moment request that you complete numerous different tasks before next week!!! [Healthcare]
The people in this department are very concerned with OH&S issues. However, it seems that the management higher up the chain are not. [Healthcare]
Senior management like to think safety and safe work practices are followed but at the coal face the emphasis by lower supervisors is production oriented, e.g., “if the job gets done, good. I don't care how you do it, just do it.” [Mining]
There is a disconnect between upper management safety expectations and what is reality with lower management and below. [Mining]
Need more emphasis on it with the bosses because if you follow the protocols you don't work as fast and they end up getting up you. [Transport]
11%
8%
18%
4%
14%
7%
0%
5%
10%
15%
20%
Construction Mining EGWW Arts &Recreation
Transport Healthcare
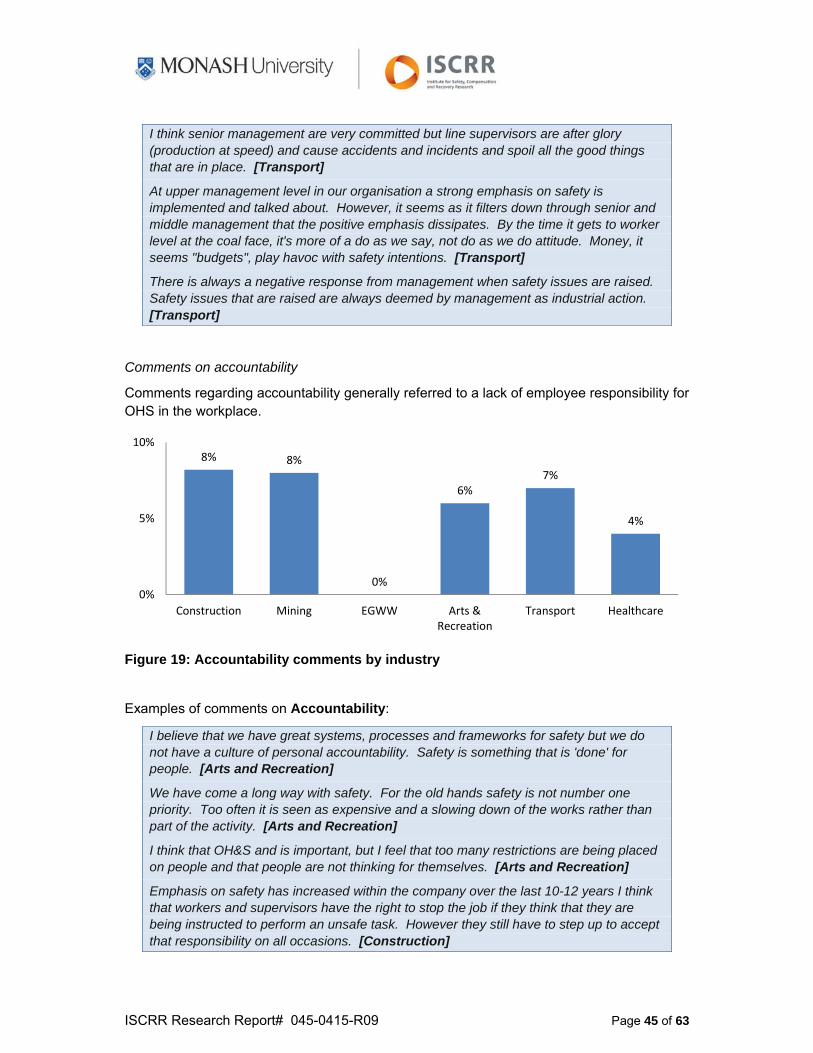
ISCRR Research Report# 045-0415-R09 Page 45 of 63
I think senior management are very committed but line supervisors are after glory (production at speed) and cause accidents and incidents and spoil all the good things that are in place. [Transport]
At upper management level in our organisation a strong emphasis on safety is implemented and talked about. However, it seems as it filters down through senior and middle management that the positive emphasis dissipates. By the time it gets to worker level at the coal face, it's more of a do as we say, not do as we do attitude. Money, it seems "budgets", play havoc with safety intentions. [Transport]
There is always a negative response from management when safety issues are raised. Safety issues that are raised are always deemed by management as industrial action. [Transport]
Comments on accountability
Comments regarding accountability generally referred to a lack of employee responsibility for OHS in the workplace.
Figure 19: Accountability comments by industry
Examples of comments on Accountability:
I believe that we have great systems, processes and frameworks for safety but we do not have a culture of personal accountability. Safety is something that is 'done' for people. [Arts and Recreation]
We have come a long way with safety. For the old hands safety is not number one priority. Too often it is seen as expensive and a slowing down of the works rather than part of the activity. [Arts and Recreation]
I think that OH&S and is important, but I feel that too many restrictions are being placed on people and that people are not thinking for themselves. [Arts and Recreation]
Emphasis on safety has increased within the company over the last 10-12 years I think that workers and supervisors have the right to stop the job if they think that they are being instructed to perform an unsafe task. However they still have to step up to accept that responsibility on all occasions. [Construction]
8% 8%
0%
6%7%
4%
0%
5%
10%
Construction Mining EGWW Arts &Recreation
Transport Healthcare
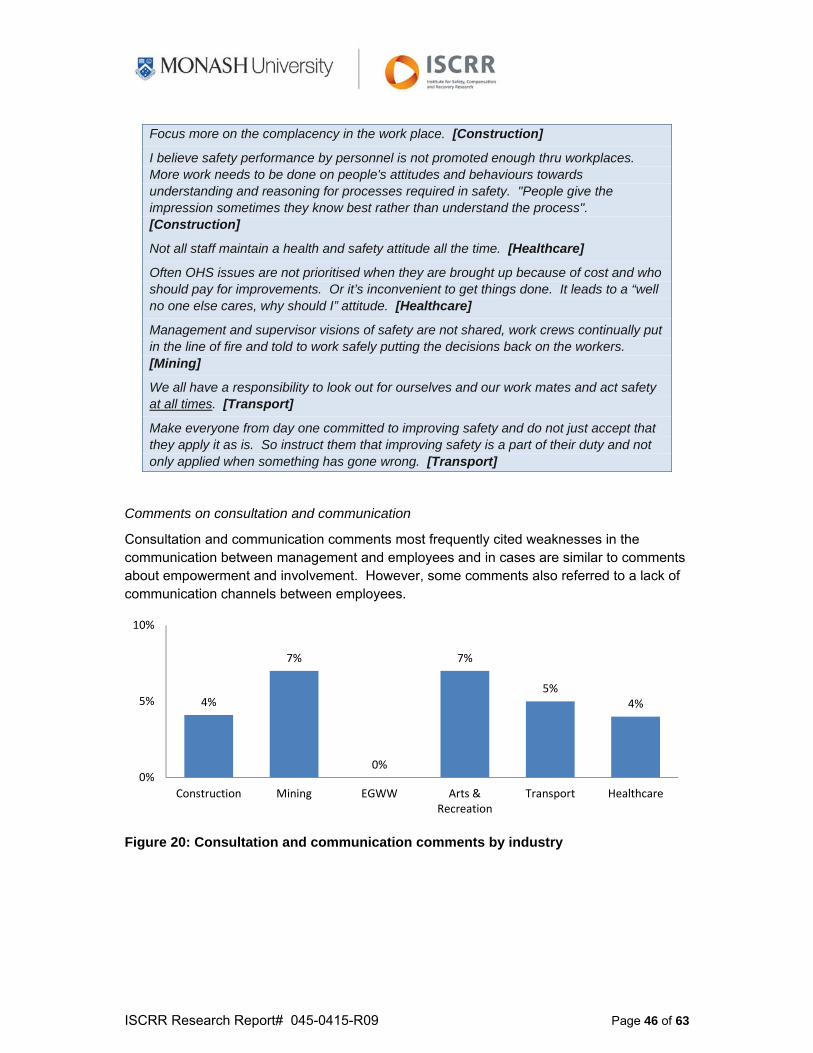
ISCRR Research Report# 045-0415-R09 Page 46 of 63
Focus more on the complacency in the work place. [Construction]
I believe safety performance by personnel is not promoted enough thru workplaces. More work needs to be done on people's attitudes and behaviours towards understanding and reasoning for processes required in safety. "People give the impression sometimes they know best rather than understand the process". [Construction]
Not all staff maintain a health and safety attitude all the time. [Healthcare]
Often OHS issues are not prioritised when they are brought up because of cost and who should pay for improvements. Or it’s inconvenient to get things done. It leads to a “well no one else cares, why should I” attitude. [Healthcare]
Management and supervisor visions of safety are not shared, work crews continually put in the line of fire and told to work safely putting the decisions back on the workers. [Mining]
We all have a responsibility to look out for ourselves and our work mates and act safety at all times. [Transport]
Make everyone from day one committed to improving safety and do not just accept that they apply it as is. So instruct them that improving safety is a part of their duty and not only applied when something has gone wrong. [Transport]
Comments on consultation and communication
Consultation and communication comments most frequently cited weaknesses in the communication between management and employees and in cases are similar to comments about empowerment and involvement. However, some comments also referred to a lack of communication channels between employees.
Figure 20: Consultation and communication comments by industry
4%
7%
0%
7%
5%4%
0%
5%
10%
Construction Mining EGWW Arts &Recreation
Transport Healthcare
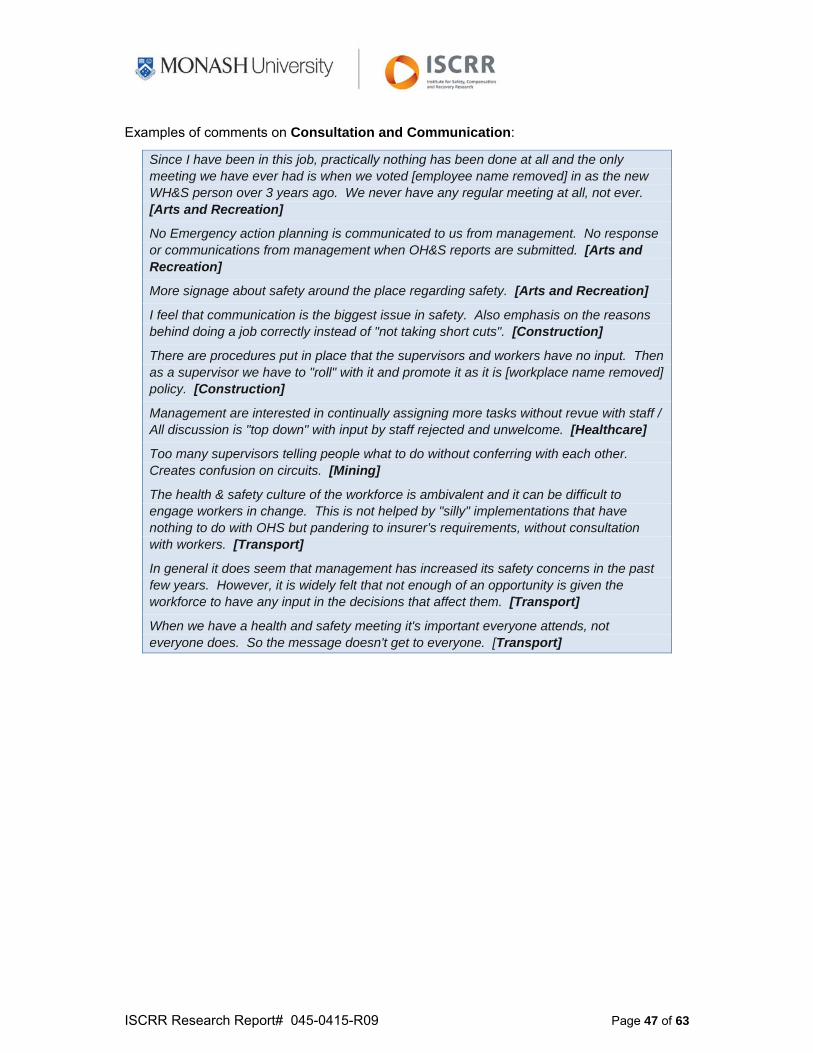
ISCRR Research Report# 045-0415-R09 Page 47 of 63
Examples of comments on Consultation and Communication:
Since I have been in this job, practically nothing has been done at all and the only meeting we have ever had is when we voted [employee name removed] in as the new WH&S person over 3 years ago. We never have any regular meeting at all, not ever. [Arts and Recreation]
No Emergency action planning is communicated to us from management. No response or communications from management when OH&S reports are submitted. [Arts and Recreation]
More signage about safety around the place regarding safety. [Arts and Recreation]
I feel that communication is the biggest issue in safety. Also emphasis on the reasons behind doing a job correctly instead of "not taking short cuts". [Construction]
There are procedures put in place that the supervisors and workers have no input. Then as a supervisor we have to "roll" with it and promote it as it is [workplace name removed] policy. [Construction]
Management are interested in continually assigning more tasks without revue with staff / All discussion is "top down" with input by staff rejected and unwelcome. [Healthcare]
Too many supervisors telling people what to do without conferring with each other. Creates confusion on circuits. [Mining]
The health & safety culture of the workforce is ambivalent and it can be difficult to engage workers in change. This is not helped by "silly" implementations that have nothing to do with OHS but pandering to insurer’s requirements, without consultation with workers. [Transport]
In general it does seem that management has increased its safety concerns in the past few years. However, it is widely felt that not enough of an opportunity is given the workforce to have any input in the decisions that affect them. [Transport]
When we have a health and safety meeting it's important everyone attends, not everyone does. So the message doesn't get to everyone. [Transport]
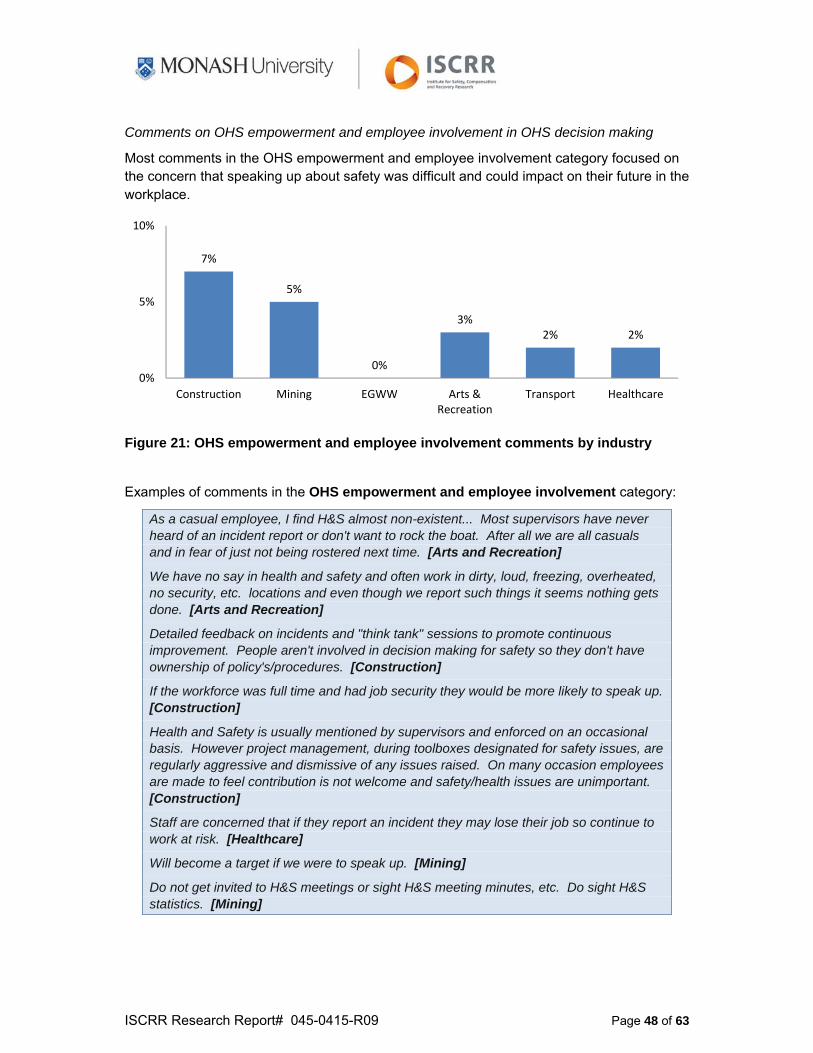
ISCRR Research Report# 045-0415-R09 Page 48 of 63
Comments on OHS empowerment and employee involvement in OHS decision making
Most comments in the OHS empowerment and employee involvement category focused on the concern that speaking up about safety was difficult and could impact on their future in the workplace.
Figure 21: OHS empowerment and employee involvement comments by industry
Examples of comments in the OHS empowerment and employee involvement category:
As a casual employee, I find H&S almost non-existent... Most supervisors have never heard of an incident report or don't want to rock the boat. After all we are all casuals and in fear of just not being rostered next time. [Arts and Recreation]
We have no say in health and safety and often work in dirty, loud, freezing, overheated, no security, etc. locations and even though we report such things it seems nothing gets done. [Arts and Recreation]
Detailed feedback on incidents and "think tank" sessions to promote continuous improvement. People aren't involved in decision making for safety so they don't have ownership of policy's/procedures. [Construction]
If the workforce was full time and had job security they would be more likely to speak up. [Construction]
Health and Safety is usually mentioned by supervisors and enforced on an occasional basis. However project management, during toolboxes designated for safety issues, are regularly aggressive and dismissive of any issues raised. On many occasion employees are made to feel contribution is not welcome and safety/health issues are unimportant. [Construction]
Staff are concerned that if they report an incident they may lose their job so continue to work at risk. [Healthcare]
Will become a target if we were to speak up. [Mining]
Do not get invited to H&S meetings or sight H&S meeting minutes, etc. Do sight H&S statistics. [Mining]
7%
5%
0%
3%2% 2%
0%
5%
10%
Construction Mining EGWW Arts &Recreation
Transport Healthcare
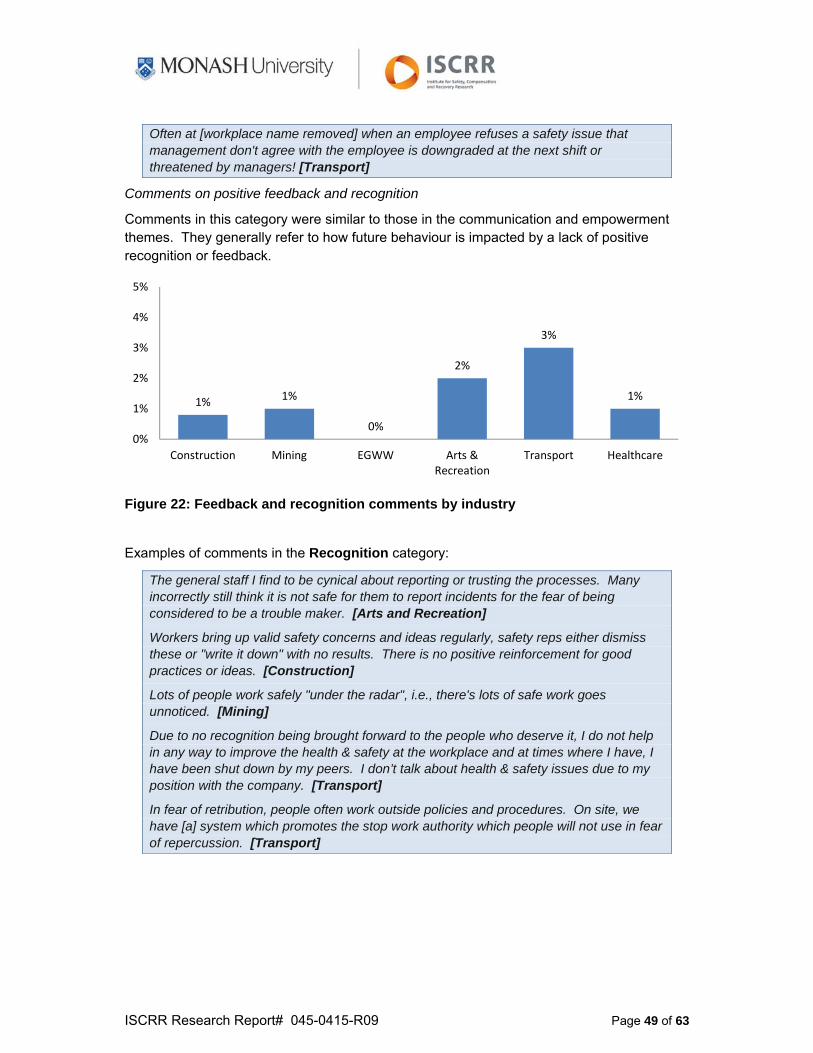
ISCRR Research Report# 045-0415-R09 Page 49 of 63
Often at [workplace name removed] when an employee refuses a safety issue that management don't agree with the employee is downgraded at the next shift or threatened by managers! [Transport]
Comments on positive feedback and recognition
Comments in this category were similar to those in the communication and empowerment themes. They generally refer to how future behaviour is impacted by a lack of positive recognition or feedback.
Figure 22: Feedback and recognition comments by industry
Examples of comments in the Recognition category:
The general staff I find to be cynical about reporting or trusting the processes. Many incorrectly still think it is not safe for them to report incidents for the fear of being considered to be a trouble maker. [Arts and Recreation]
Workers bring up valid safety concerns and ideas regularly, safety reps either dismiss these or "write it down" with no results. There is no positive reinforcement for good practices or ideas. [Construction]
Lots of people work safely "under the radar", i.e., there's lots of safe work goes unnoticed. [Mining]
Due to no recognition being brought forward to the people who deserve it, I do not help in any way to improve the health & safety at the workplace and at times where I have, I have been shut down by my peers. I don’t talk about health & safety issues due to my position with the company. [Transport]
In fear of retribution, people often work outside policies and procedures. On site, we have [a] system which promotes the stop work authority which people will not use in fear of repercussion. [Transport]
1% 1%
0%
2%
3%
1%
0%
1%
2%
3%
4%
5%
Construction Mining EGWW Arts &Recreation
Transport Healthcare
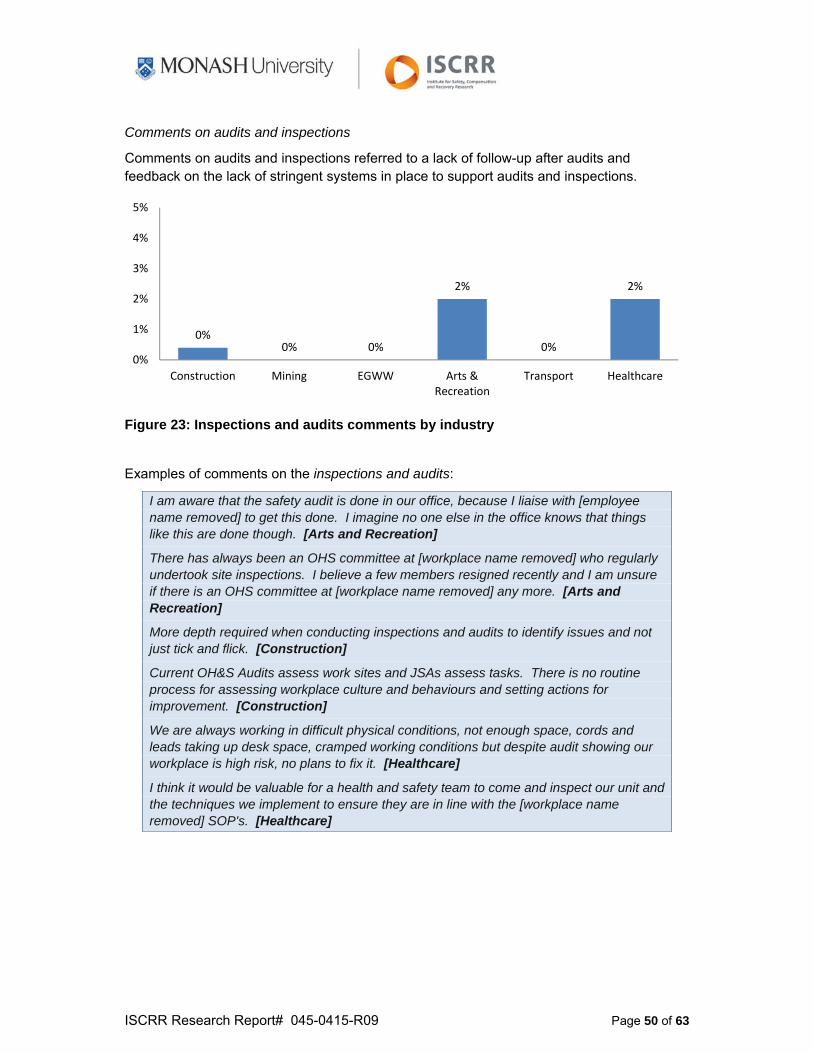
ISCRR Research Report# 045-0415-R09 Page 50 of 63
Comments on audits and inspections
Comments on audits and inspections referred to a lack of follow-up after audits and feedback on the lack of stringent systems in place to support audits and inspections.
Figure 23: Inspections and audits comments by industry
Examples of comments on the inspections and audits:
I am aware that the safety audit is done in our office, because I liaise with [employee name removed] to get this done. I imagine no one else in the office knows that things like this are done though. [Arts and Recreation]
There has always been an OHS committee at [workplace name removed] who regularly undertook site inspections. I believe a few members resigned recently and I am unsure if there is an OHS committee at [workplace name removed] any more. [Arts and Recreation]
More depth required when conducting inspections and audits to identify issues and not just tick and flick. [Construction]
Current OH&S Audits assess work sites and JSAs assess tasks. There is no routine process for assessing workplace culture and behaviours and setting actions for improvement. [Construction]
We are always working in difficult physical conditions, not enough space, cords and leads taking up desk space, cramped working conditions but despite audit showing our workplace is high risk, no plans to fix it. [Healthcare]
I think it would be valuable for a health and safety team to come and inspect our unit and the techniques we implement to ensure they are in line with the [workplace name removed] SOP's. [Healthcare]
0%0% 0%
2%
0%
2%
0%
1%
2%
3%
4%
5%
Construction Mining EGWW Arts &Recreation
Transport Healthcare
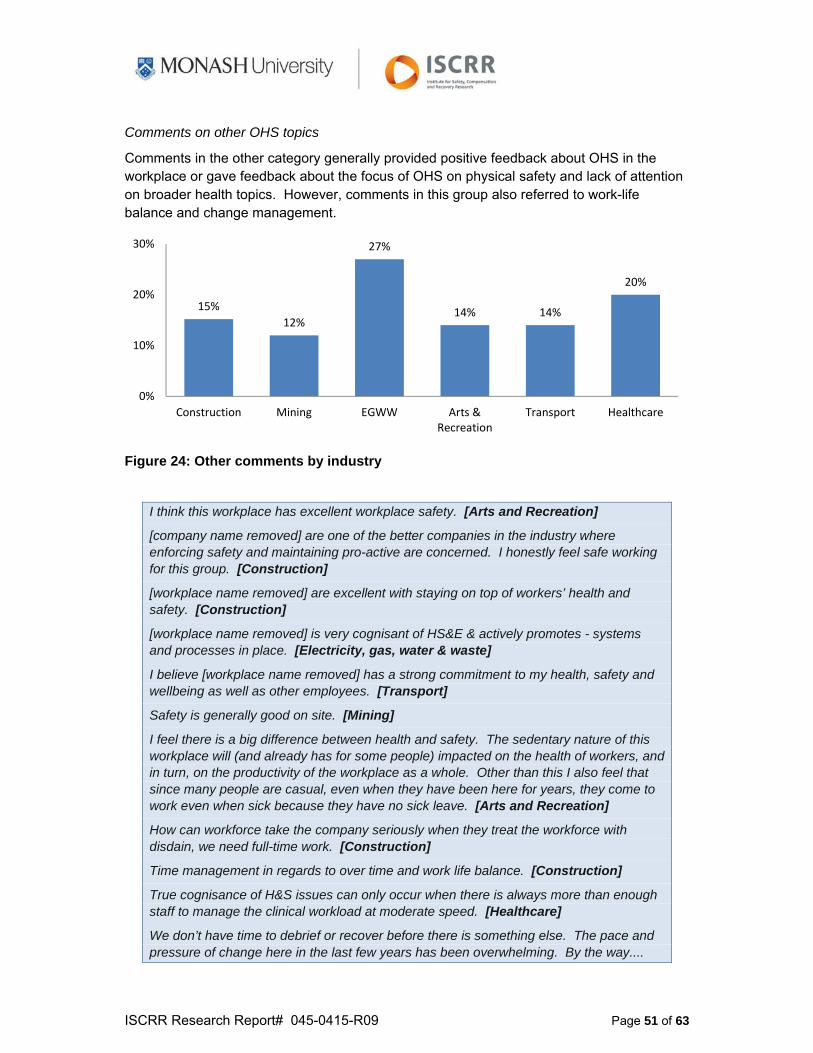
ISCRR Research Report# 045-0415-R09 Page 51 of 63
Comments on other OHS topics
Comments in the other category generally provided positive feedback about OHS in the workplace or gave feedback about the focus of OHS on physical safety and lack of attention on broader health topics. However, comments in this group also referred to work-life balance and change management.
Figure 24: Other comments by industry
I think this workplace has excellent workplace safety. [Arts and Recreation]
[company name removed] are one of the better companies in the industry where enforcing safety and maintaining pro-active are concerned. I honestly feel safe working for this group. [Construction]
[workplace name removed] are excellent with staying on top of workers’ health and safety. [Construction]
[workplace name removed] is very cognisant of HS&E & actively promotes - systems and processes in place. [Electricity, gas, water & waste]
I believe [workplace name removed] has a strong commitment to my health, safety and wellbeing as well as other employees. [Transport]
Safety is generally good on site. [Mining]
I feel there is a big difference between health and safety. The sedentary nature of this workplace will (and already has for some people) impacted on the health of workers, and in turn, on the productivity of the workplace as a whole. Other than this I also feel that since many people are casual, even when they have been here for years, they come to work even when sick because they have no sick leave. [Arts and Recreation]
How can workforce take the company seriously when they treat the workforce with disdain, we need full-time work. [Construction]
Time management in regards to over time and work life balance. [Construction]
True cognisance of H&S issues can only occur when there is always more than enough staff to manage the clinical workload at moderate speed. [Healthcare]
We don’t have time to debrief or recover before there is something else. The pace and pressure of change here in the last few years has been overwhelming. By the way....
15%
12%
27%
14% 14%
20%
0%
10%
20%
30%
Construction Mining EGWW Arts &Recreation
Transport Healthcare
ISCRR Research Report# 045-0415-R09 Page 52 of 63
We are not 'resistant to change' but are overwhelmingly fatigued by the constant, ongoing, repercussions of it. [Healthcare]
I think what health & safety means is not well articulated within mental health. Whilst like all areas it involves reduced risk of injury, management of burnout is less clear. [Healthcare]
Nursing staff are anxious and frustrated at the proposed cut in staff. [Healthcare]
The charts below display the distribution of comments within each industry and show a variation in OHS concerns varied across industry. For example, risk management was identified as an issue more frequently by respondents in the Healthcare and Art and Recreation industries compared to those from other sectors. For Mining, Construction, EGWW and Transport workers, prioritisation of OHS and OHS systems were the most frequently cited OHS issues.
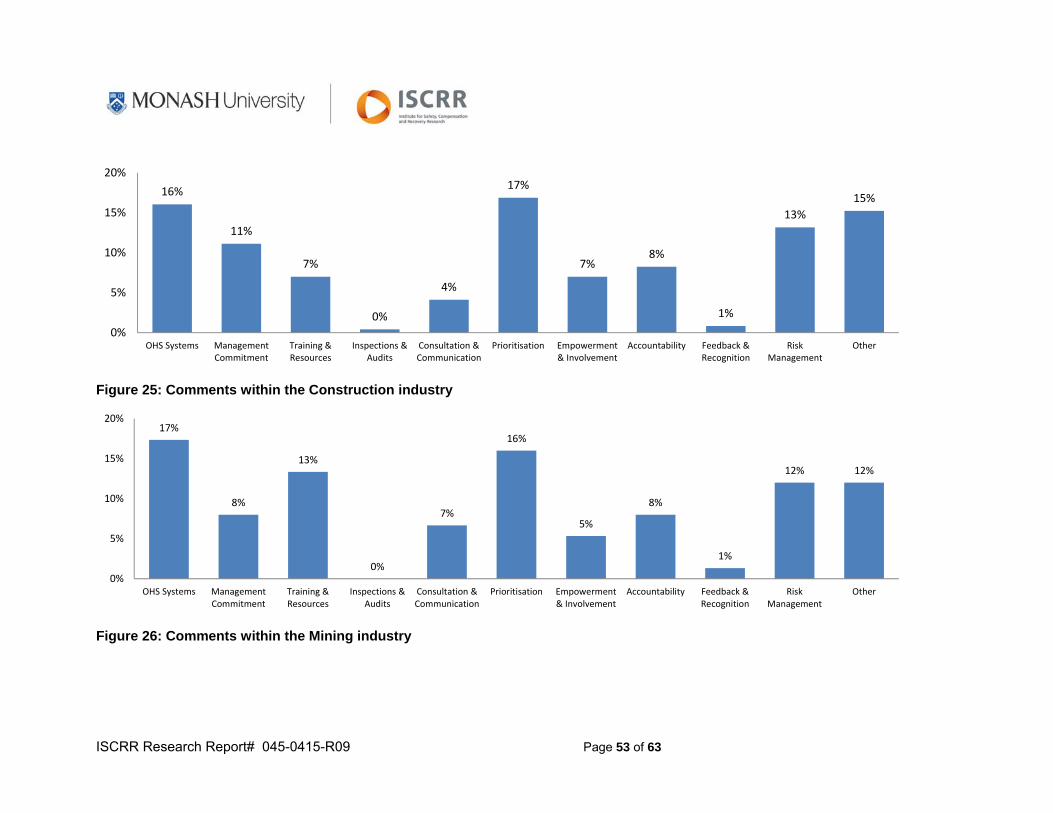
ISCRR Research Report# 045-0415-R09 Page 53 of 63
Figure 25: Comments within the Construction industry
Figure 26: Comments within the Mining industry
16%
11%
7%
0%
4%
17%
7%8%
1%
13%
15%
0%
5%
10%
15%
20%
OHS Systems ManagementCommitment
Training &Resources
Inspections &Audits
Consultation &Communication
Prioritisation Empowerment& Involvement
Accountability Feedback &Recognition
RiskManagement
Other
17%
8%
13%
0%
7%
16%
5%
8%
1%
12% 12%
0%
5%
10%
15%
20%
OHS Systems ManagementCommitment
Training &Resources
Inspections &Audits
Consultation &Communication
Prioritisation Empowerment& Involvement
Accountability Feedback &Recognition
RiskManagement
Other
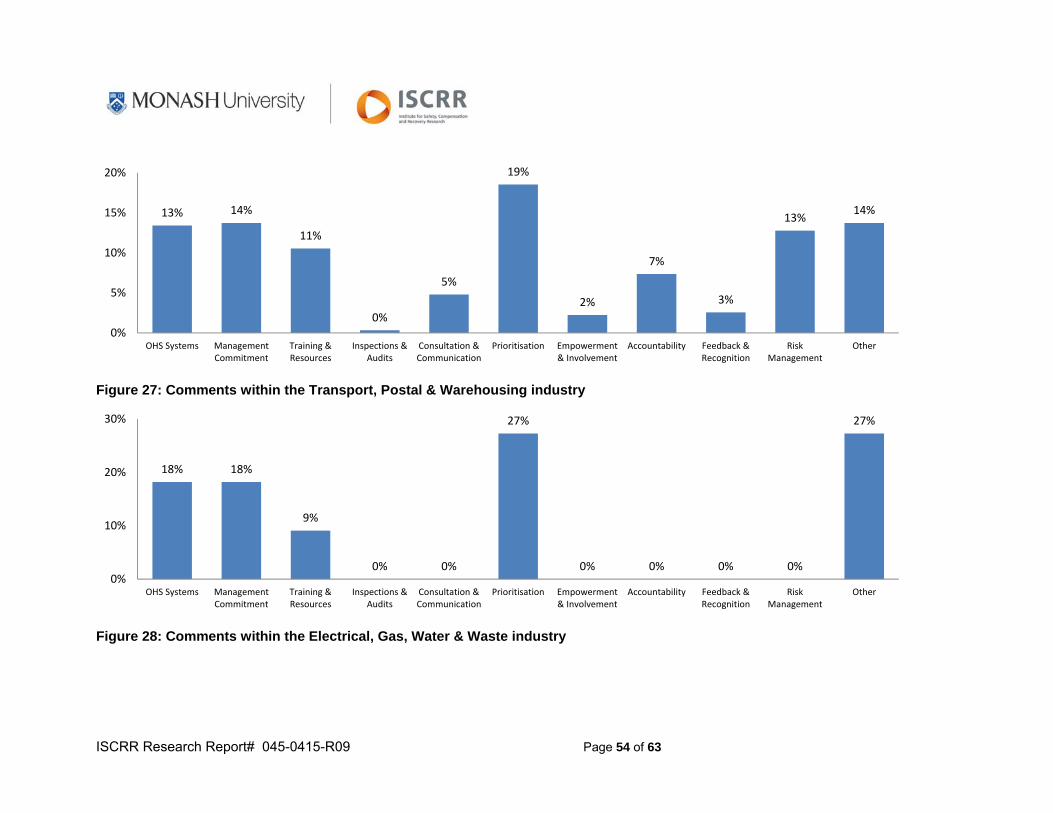
ISCRR Research Report# 045-0415-R09 Page 54 of 63
Figure 27: Comments within the Transport, Postal & Warehousing industry
Figure 28: Comments within the Electrical, Gas, Water & Waste industry
13% 14%
11%
0%
5%
19%
2%
7%
3%
13%14%
0%
5%
10%
15%
20%
OHS Systems ManagementCommitment
Training &Resources
Inspections &Audits
Consultation &Communication
Prioritisation Empowerment& Involvement
Accountability Feedback &Recognition
RiskManagement
Other
18% 18%
9%
0% 0%
27%
0% 0% 0% 0%
27%
0%
10%
20%
30%
OHS Systems ManagementCommitment
Training &Resources
Inspections &Audits
Consultation &Communication
Prioritisation Empowerment& Involvement
Accountability Feedback &Recognition
RiskManagement
Other
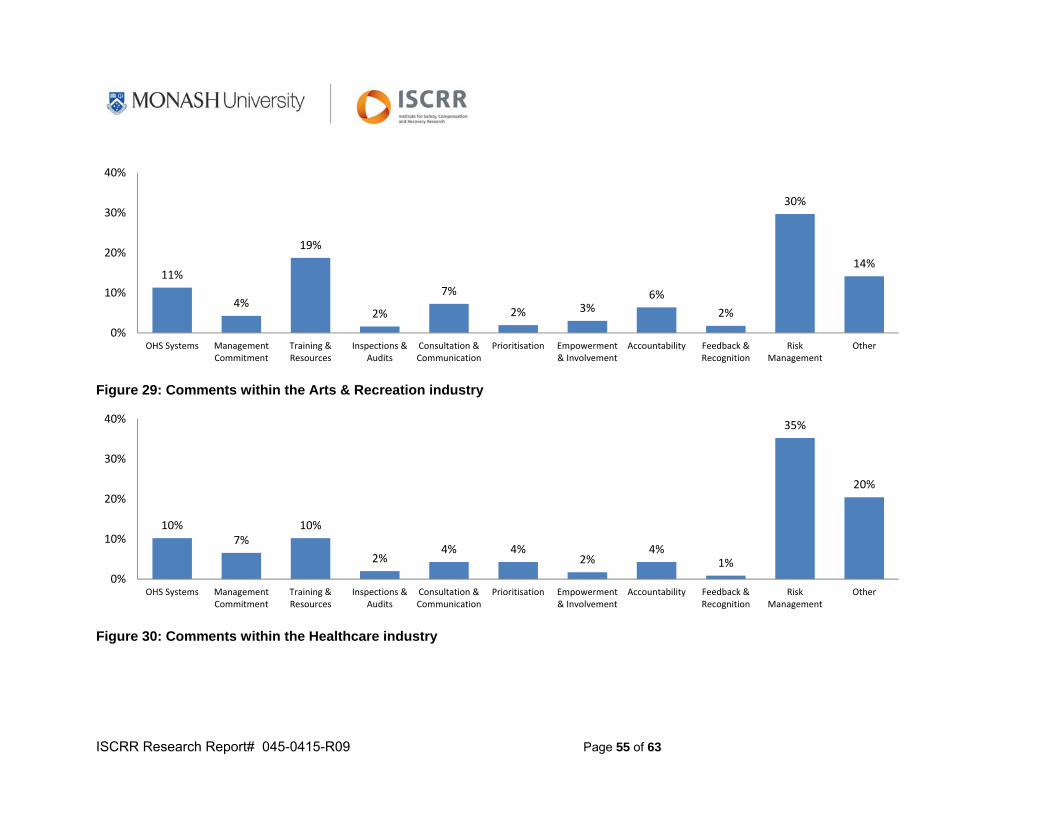
ISCRR Research Report# 045-0415-R09 Page 55 of 63
Figure 29: Comments within the Arts & Recreation industry
Figure 30: Comments within the Healthcare industry
11%
4%
19%
2%
7%
2% 3%6%
2%
30%
14%
0%
10%
20%
30%
40%
OHS Systems ManagementCommitment
Training &Resources
Inspections &Audits
Consultation &Communication
Prioritisation Empowerment& Involvement
Accountability Feedback &Recognition
RiskManagement
Other
10%7%
10%
2%4% 4%
2%4%
1%
35%
20%
0%
10%
20%
30%
40%
OHS Systems ManagementCommitment
Training &Resources
Inspections &Audits
Consultation &Communication
Prioritisation Empowerment& Involvement
Accountability Feedback &Recognition
RiskManagement
Other
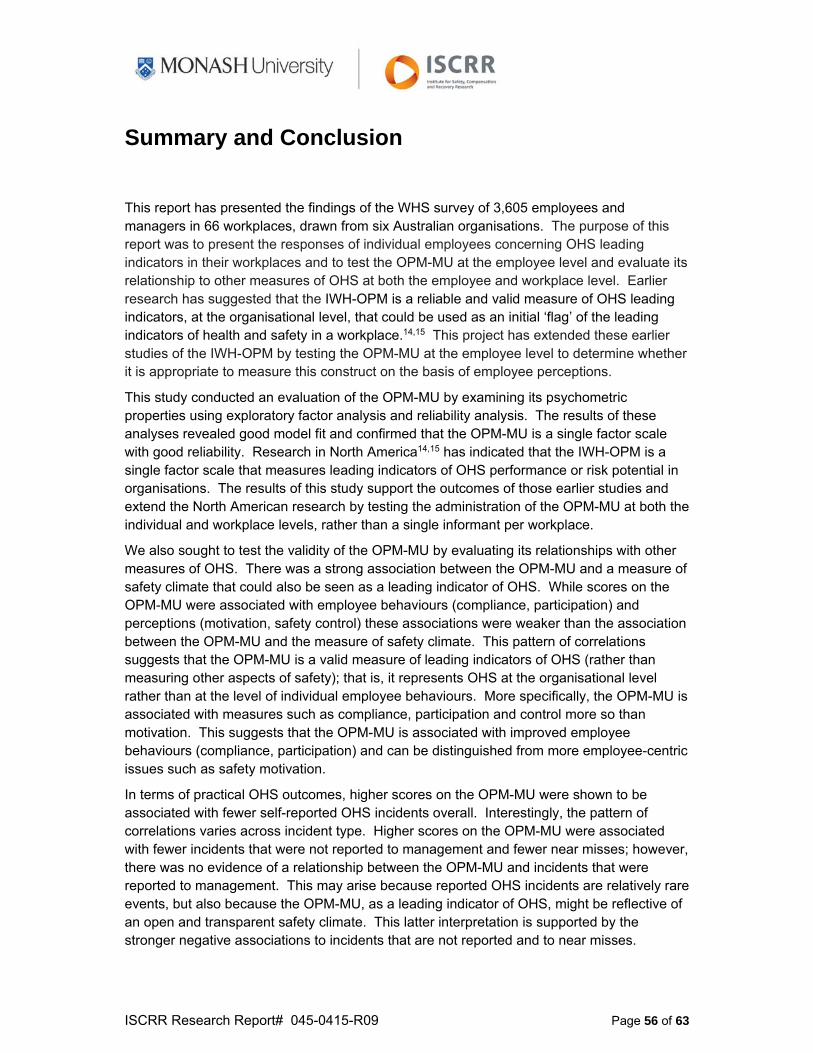
ISCRR Research Report# 045-0415-R09 Page 56 of 63
Summary and Conclusion
This report has presented the findings of the WHS survey of 3,605 employees and managers in 66 workplaces, drawn from six Australian organisations. The purpose of this report was to present the responses of individual employees concerning OHS leading indicators in their workplaces and to test the OPM-MU at the employee level and evaluate its relationship to other measures of OHS at both the employee and workplace level. Earlier research has suggested that the IWH-OPM is a reliable and valid measure of OHS leading indicators, at the organisational level, that could be used as an initial ‘flag’ of the leading indicators of health and safety in a workplace.14,15 This project has extended these earlier studies of the IWH-OPM by testing the OPM-MU at the employee level to determine whether it is appropriate to measure this construct on the basis of employee perceptions.
This study conducted an evaluation of the OPM-MU by examining its psychometric properties using exploratory factor analysis and reliability analysis. The results of these analyses revealed good model fit and confirmed that the OPM-MU is a single factor scale with good reliability. Research in North America14,15 has indicated that the IWH-OPM is a single factor scale that measures leading indicators of OHS performance or risk potential in organisations. The results of this study support the outcomes of those earlier studies and extend the North American research by testing the administration of the OPM-MU at both the individual and workplace levels, rather than a single informant per workplace.
We also sought to test the validity of the OPM-MU by evaluating its relationships with other measures of OHS. There was a strong association between the OPM-MU and a measure of safety climate that could also be seen as a leading indicator of OHS. While scores on the OPM-MU were associated with employee behaviours (compliance, participation) and perceptions (motivation, safety control) these associations were weaker than the association between the OPM-MU and the measure of safety climate. This pattern of correlations suggests that the OPM-MU is a valid measure of leading indicators of OHS (rather than measuring other aspects of safety); that is, it represents OHS at the organisational level rather than at the level of individual employee behaviours. More specifically, the OPM-MU is associated with measures such as compliance, participation and control more so than motivation. This suggests that the OPM-MU is associated with improved employee behaviours (compliance, participation) and can be distinguished from more employee-centric issues such as safety motivation.
In terms of practical OHS outcomes, higher scores on the OPM-MU were shown to be associated with fewer self-reported OHS incidents overall. Interestingly, the pattern of correlations varies across incident type. Higher scores on the OPM-MU were associated with fewer incidents that were not reported to management and fewer near misses; however, there was no evidence of a relationship between the OPM-MU and incidents that were reported to management. This may arise because reported OHS incidents are relatively rare events, but also because the OPM-MU, as a leading indicator of OHS, might be reflective of an open and transparent safety climate. This latter interpretation is supported by the stronger negative associations to incidents that are not reported and to near misses.
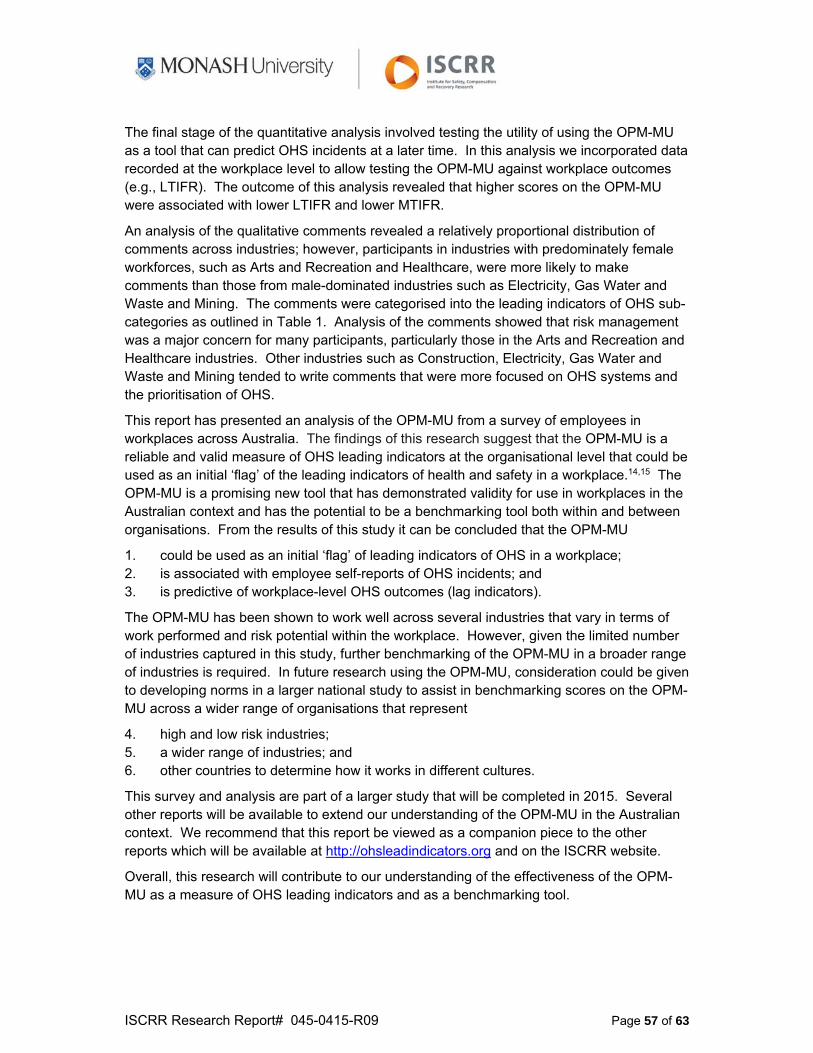
ISCRR Research Report# 045-0415-R09 Page 57 of 63
The final stage of the quantitative analysis involved testing the utility of using the OPM-MU as a tool that can predict OHS incidents at a later time. In this analysis we incorporated data recorded at the workplace level to allow testing the OPM-MU against workplace outcomes (e.g., LTIFR). The outcome of this analysis revealed that higher scores on the OPM-MU were associated with lower LTIFR and lower MTIFR.
An analysis of the qualitative comments revealed a relatively proportional distribution of comments across industries; however, participants in industries with predominately female workforces, such as Arts and Recreation and Healthcare, were more likely to make comments than those from male-dominated industries such as Electricity, Gas Water and Waste and Mining. The comments were categorised into the leading indicators of OHS sub-categories as outlined in Table 1. Analysis of the comments showed that risk management was a major concern for many participants, particularly those in the Arts and Recreation and Healthcare industries. Other industries such as Construction, Electricity, Gas Water and Waste and Mining tended to write comments that were more focused on OHS systems and the prioritisation of OHS.
This report has presented an analysis of the OPM-MU from a survey of employees in workplaces across Australia. The findings of this research suggest that the OPM-MU is a reliable and valid measure of OHS leading indicators at the organisational level that could be used as an initial ‘flag’ of the leading indicators of health and safety in a workplace.14,15 The OPM-MU is a promising new tool that has demonstrated validity for use in workplaces in the Australian context and has the potential to be a benchmarking tool both within and between organisations. From the results of this study it can be concluded that the OPM-MU
1. could be used as an initial ‘flag’ of leading indicators of OHS in a workplace; 2. is associated with employee self-reports of OHS incidents; and 3. is predictive of workplace-level OHS outcomes (lag indicators).
The OPM-MU has been shown to work well across several industries that vary in terms of work performed and risk potential within the workplace. However, given the limited number of industries captured in this study, further benchmarking of the OPM-MU in a broader range of industries is required. In future research using the OPM-MU, consideration could be given to developing norms in a larger national study to assist in benchmarking scores on the OPM-MU across a wider range of organisations that represent
4. high and low risk industries; 5. a wider range of industries; and 6. other countries to determine how it works in different cultures.
This survey and analysis are part of a larger study that will be completed in 2015. Several other reports will be available to extend our understanding of the OPM-MU in the Australian context. We recommend that this report be viewed as a companion piece to the other reports which will be available at http://ohsleadindicators.org and on the ISCRR website.
Overall, this research will contribute to our understanding of the effectiveness of the OPM-MU as a measure of OHS leading indicators and as a benchmarking tool.
ISCRR Research Report# 045-0415-R09 Page 58 of 63
References
1 Blair, E. & O’Toole, M. 2010. Leading Measures: Enhancing safety climate & driving safety performance. Professional Safety Journal, 8: 29-34.
2 Dyreborg, J. 2009. The causal relation between lead and lag indicators. Safety Science, 47: 474-475.
3 Worksafe Australia. 1990. Workplace Injury and Disease Recording Standard. Sydney: Standards Australia.
4 Wu, T. C. 2005. The Validity and Reliability of Safety Leadership Scales in Universities of Taiwan. International Journal of Technology and Engineering Education, 2: 27-42.
5 ABS. 2011. Australian Statistical Geography Standard (ASGS): Volume 5 - Remoteness Structure. ACT: Australian Bureau of Statistics.
6 Neal, A., Griffin, M. A. & Hart, P. M. 2000. The impact of organizational climate on safety climate and individual behavior. Safety Science, 34: 99-109.
7 Neal, A. & Griffin, M. A. 2006. A study of the lagged relationships among safety climate, safety motivation, safety behavior, and accidents at the individual and group levels. Journal of Applied Psychology, 91: 946-953.
8 Griffin, M. A. & Neal, A. 2000. Perceptions of safety at work: a framework for linking safety climate to safety performance, knowledge, and motivation. J Occup Health Psychol, 5: 347-358.
9 Huang, Y.-H., Ho, M., Smith, G. S. & Chen, P. Y. 2006. Safety climate and self-reported injury: Assessing the mediating role of employee safety control. Accident Analysis & Prevention, 38: 425-433.
10 Probst, T. M. & Estrada, A. X. 2010. Accident under-reporting among employees: testing the moderating influence of psychological safety climate and supervisor enforcement of safety practices. Accident Analysis & Prevention, 42: 1438-1444.
11 Spector, P. E., van Katwyk, P. T., Brannick, M. T. & Chen, P. Y. 1997. When two factors don't reflect two constructs: how item characteristics can produce artifactual factors. Journal of Management, 23: 659-677.
12 Skinner, N. & Pocock, B. 2008. Work—life conflict: Is work time or work overload more important? Asia Pacific Journal of Human Resources, 46: 303-315.
13 WorkSafe Victoria. 2011. Performance Standards and Indicators. Melbourne, Australia.
14 IWH. 2011. Benchmarking organizational leading indicators for the prevention and management of injuries and illnesses: Final report. Toronto, Ontario: Institute for Work & Health.
15 IWH. 2013. Developing leading indicators of work injury and illness. Toronto, Ontario: Institute for Work & Health.
16 Baker, J., Bowman, F., Erwin, G. et al. 2007. The Report of the BP US Refineries Independent Safety Review Panel. Retrieved from: www.bp.com/bakerpanelreport.
17 Payne, S. C., Bergman, M. E., Beus, J. M., Rodríguez, J. M. & Henning, J. B. 2009. Safety climate: Leading or lagging indicator of safety outcomes? Journal of Loss Prevention in the Process Industries, 22: 735-739.
18 Sinelnikov, S., Inouye, J. & Kerper, S. 2015. Using leading indicators to measure occupational health and safety performance. Safety Science, 72: 240-248.
19 Lingard, H., Wakefield, R. & Cashin, P. 2011. The development and testing of a hierarchical measure of project OHS performance. Engineering Construction & Architectural Management, 18: 30-49.
20 Reiman, T. & Pietikäinen, E. 2012. Leading indicators of system safety – Monitoring and driving the organizational safety potential. Safety Science, 50: 1993-2000.
21 Zohar, D. 2010. Thirty years of safety climate research: Reflections and future directions. Accident Analysis & Prevention, 42: 1517-1522.
22 Carson, P. A. & Snowden, D. 2010. Health, safety and environment metrics in loss prevention -- part 1. Loss Prevention Bulletin: 11-15.
ISCRR Research Report# 045-0415-R09 Page 59 of 63
23 Grabowski, M., Ayyalasomayajula, P., Merrick, J., Harrald, J. R. & Roberts, K. 2007. Leading indicators of safety in virtual organizations. Safety Science, 45: 1013-1043.
24 Zanko, M. & Dawson, P. 2012. Occupational health and safety management in organizations: A review. International Journal of Management Reviews, 14: 328-344.
25 Zacharatos, A., Barling, J. & Iverson, R. D. 2005. High-performance work systems and occupational safety. Journal of Applied Psychology, 90: 77-93.
26 Nahrgang, J. D., Morgeson, F. P. & Hofmann, D. A. 2011. Safety at Work: A meta-analytic investigation of the link between job demands, job resources, burnout, engagement, and safety outcomes. Journal of Applied Psychology, 96: 71-94.
27 Daniels, C. & Marlow, P. 2005. Literature review on the reporting of workplace injury trends. Retrieved from: www.hse.gov.uk/research/hsl_pdf/2005/hsl0536.pdf.
28 Kjellén, U. 2009. The safety measurement problem revisited. Safety Science, 47: 486-489.
29 Hopkins, A. 2009. Thinking about process safety indicators. Safety Science, 47: 460-465.
30 Erikson, S. G. 2009. Performance indicators. Safety Science, 47: 468.
31 Christian, M. S., Bradley, J. C., Wallace, J. C. & Burke, M. J. 2009. Workplace safety: a meta-analysis of the roles of person and situation factors. J Appl Psychol, 94: 1103-1127.
32 O’Neill, S., Martinov-Bennie, N. & Cheung, A. 2013. Issues in the measurement and reporting of work health and safety performance: A review. NSW: Macquarie University
33 Health & Safety Executive. 2001. A guide to measuring health and safety performance. London: Health & Safety Executive,.
34 Mitchell, R. 2000. Development of PPIs to monitor OHS performance in the Australian construction industry. Journal of Occupational Health & Safety, 15: 325-331.
35 Adcock, R. & Collier, D. 2001. Measurement validity: A shared standard for qualitative and quantitative research. American Political Science Review, 95: 529.
36 Wu, T.-C., Lin, C.-H. & Shiau, S.-Y. 2010. Predicting safety culture: The roles of employer, operations manager and safety professional. Journal of Safety Research, 41: 423-431.
37 Spector, P. & Jex, S. 1998. Development of four self-report measures of job stressors and strain: Interpersonal conflict at work scale, organizational constraints scale, quantitative workload inventory, and physical symptoms inventory. Journal of Occupational Health Psychology, 3: 356-367.
38 Hinze, J., Thurman, S. & Wehle, A. 2013. Leading indicators of construction safety performance. Safety Science, 51: 23-28.
39 Manuele, F. 2009. Leading and lagging indicators. Professional Safety, 54: 28-33.
40 Toellner, J. 2001. Improving safety and health performance. Identifying and measuring leading indicators. Professional Safety, 46: 42-47.
41 Magidson, J. & Vermunt, J. K. 2005. An extension of the CHAID tree-based segmentation algorithm to multiple dependent variables. In C. Weihs & W. Gaul (Eds.), Classification — the Ubiquitous Challenge (pp. 176-183). Springer, Berlin Heidelberg.
42 Magidson, J. 1988. Improved statistical techniques for response modeling: Progression beyond regression. Journal of Direct Marketing, 2: 6-18.
43 Zohar, D. 2000. A group-level model of safety climate: Testing the effect of group climate on microaccidents in manufacturing jobs. Journal of Applied Psychology, 85: 587-596.
44 Liu, X., Huang, G., Huang, H. et al. 2015. Safety climate, safety behavior, and worker injuries in the Chinese manufacturing industry. Safety Science, 78: 173-178.
ISCRR Research Report# 045-0415-R09 Page 60 of 63
Appendix 1
OPM-MU, role overload and safety compliance as predictors of OHS incidents
This appendix provides supplementary analysis that investigates the variables that might assist in identifying workplace scenarios, which lead to a higher level of OHS incidents. We generated a classification tree to summarise the relationships between the presence of an OHS incident, leading indicators of OHS (as measured by the OPM-MU), role overload and safety compliance (the classification tree is presented below in Figure 31. OHS incidents were classified as present (one or more incidents in the past year) or not present (no incidents in the past year), where incidents included near misses, incidents not reported to a manager and incidents reported to a manager. The tree was generated using the SPSS CHAID (chi square automatic interaction detection) procedure, a type of analysis that allows for the prediction of OHS incidents based on the values of other variables.
The classification tree generated by the CHAID procedure determines the best combination of variables to predict an outcome. This process initially partitions the sample into subgroups based on the most significant predictor of an outcome of interest, in this case, OHS incidents. The sample is then further partitioned on the basis of the additional variables that are included in the analysis.41 The depth of this process depends upon the focus of the analysis, but the procedure is generally continued until there are no more significant divisions of scores on specific variables or when the sample becomes too small to partition.42
Our aim was to identify a set of variables that reduced incidents overall, particularly incidents that go unreported and near misses that might, due to their hidden nature, compromise the safety climate of a workplace over time. The refined set of predictors that were included in the subsequent analysis reported here were: the OPM-MU, safety compliance and role overload. Role overload has been shown in earlier literature to increase the likelihood of OHS incidents43 and complying with safety rules was expected to reduce the likelihood of injuries.44 The CHAID analysis reveals that the combination of leading indicators of OHS, role overload and safety compliance were statistically significant predictors of OHS incidents.
The first tier of the classification tree (blue) shows the percentage of the sample who reported experiencing an OHS incident in the past year (37%). CHAID identified the OPM-MU as the strongest predictor of an OHS incident, which is revealed in the second tier (green) where the classification tree partitions the sample into five subgroups based on their scores on the OPM-MU. Finally, in the third tier (purple), it can be seen that role overload and safety compliance were additional significant predictors of incidents and the sample was further partitioned based on their scores on role overload and safety compliance.
The classification tree generated seven possible outcomes based on the variables entered into the analysis. Initial inspection of the tree clearly showed a pattern where scores on the OPM-MU decreased, OHS incidents increased. Scores on the safety compliance and role overload scales either attenuated or increased this effect. There were only two scenarios where OHS incidents were substantially decreased (18%) from the overall percentage within
ISCRR Research Report# 045-0415-R09 Page 61 of 63
the sample as a whole (37%, see blue tier). This first occurred when there was high OPM-MU (score > 36) and high compliance (score > 14). The second occurrence was when there was moderate OPM-MU (score range 25-31) coupled with low role overload (score ≤ 9).
Nearly half of the respondents in the sample (47%) rated their workplaces in the middle range of OPM-MU scores (25-31) and outcomes in this range show that even with moderate OPM-MU scores the percentage of respondents reporting OHS incidents was reduced from 37% to 18% with a reduction in role overload while an increase in role overload led to an increase in OHS incidents (43%). The poorest outcomes were associated with low OPM-MU scores (score ranges ≤ 21; 22-24). Poor outcomes were exacerbated with greater levels of role overload.
While it seems clear that better OHS practices as measured by the OPM-MU are associated with fewer OHS incidents the relationship between organisational OHS practices and employee safety attitudes and behaviours is not straightforward. Presently, the leading indicators continuum shown in the classification tree provides interesting “cut points” that could be examined in future research to determine what may or may not be a ‘good’ OPM-MU score. What is clear in these results is that the OPM-MU appears to represent the OHS potential of a workplace that can be enhanced or diminished by other contextual variables such as levels of safety compliance and role overload.
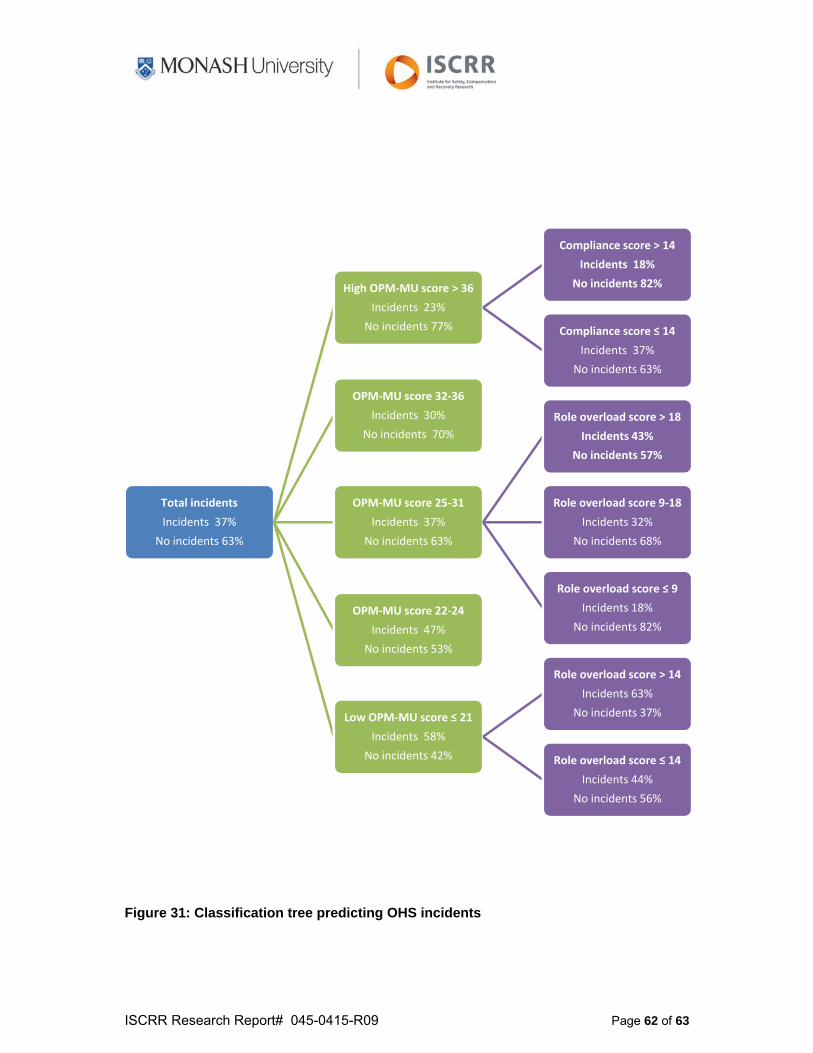
ISCRR Research Report# 045-0415-R09 Page 62 of 63
Figure 31: Classification tree predicting OHS incidents
Total incidents
Incidents 37%
No incidents 63%
High OPM‐MU score > 36
Incidents 23%
No incidents 77%
Compliance score > 14
Incidents 18%
No incidents 82%
Compliance score ≤ 14
Incidents 37%
No incidents 63%
OPM‐MU score 32‐36
Incidents 30%
No incidents 70%
OPM‐MU score 25‐31
Incidents 37%
No incidents 63%
Role overload score > 18
Incidents 43%
No incidents 57%
Role overload score 9‐18
Incidents 32%
No incidents 68%
Role overload score ≤ 9
Incidents 18%
No incidents 82%
OPM‐MU score 22‐24
Incidents 47%
No incidents 53%
Low OPM‐MU score ≤ 21
Incidents 58%
No incidents 42%
Role overload score > 14
Incidents 63%
No incidents 37%
Role overload score ≤ 14
Incidents 44%
No incidents 56%

0www.iscrr.com.au