Embed Size (px)
Citation preview
Chapter 4Wage and salary taxation

Contents
Summary 57
4.1 Introduction 58
4.2 Broad international comparisons 594.2.1 Direct taxation mix in respect of individuals and payroll 594.2.2 Direct taxation in respect of individuals and payroll 604.2.3 History of average and marginal tax rates 624.2.4 Tax wedge 63
4.3 Description of tax rates 674.3.1 Personal income tax rates 674.3.2 Social security contributions rates 684.3.3 Payroll tax rates 68
4.4 Top marginal tax rate 69
4.5 Progressivity 75
4.6 Effective marginal tax rates 78
4.7 Description of the tax base 80
AppendicesAppendix 4.1: Tax wedge analysis 84Appendix 4.2: Net personal average tax rate analysis 93Appendix 4.3: Tax wedge family comparisons 101Appendix 4.4: Net personal average rate family comparisons 108Appendix 4.5: OECD-10-descriptive wage and salary taxation tables 114Appendix 4.6: Wage and salary taxation data 130

Page 57
4. WAGE AND SALARY TAXATION
SUMMARY
Australia’s total wage and salary tax take as a proportion of GDP is low compared with the OECD-30 and the OECD-10. While Australia’s individual income tax burden is relatively high compared to the OECD-30 and OECD-10, once social security contributions and payroll taxes are accounted for, Australia has the second lowest level of direct taxation on individuals and payroll in the OECD-10.
The components of wage and salary taxation considered in this chapter include personal income tax, social security contributions and payroll taxes.
Different countries use various methods of taxing wages and salaries and different methods of providing assistance to groups such as low income earners, families and the unemployed. In order to make meaningful comparisons, a comprehensive measure is required that considers all components of the tax burden. The most comprehensive measure available is the ‘tax wedge’. This measure encompasses the entirety of wage-based taxes imposed by governments, taking into account the interchangeablity of cash benefits and tax relief.
The average tax rate (total tax as a proportion of income) for a worker earning the male average wage in Australia has been steady at around 22 per cent over the past 40 years. The marginal tax rate (the rate of tax paid on an additional dollar of income) for the same worker has averaged around 35 per cent.
Australia’s personal income tax structure (including rates and base) has similar characteristics to the OECD-10 and OECD-30. Australia’s top marginal tax rate of 48.5 per cent is slightly higher than the average top marginal tax rate for both the OECD-10 (second highest) and the OECD-30 (eleventh highest). Australia’s threshold, to which the top marginal tax rate applies, is sixth highest in the OECD-10 and twelfth highest in the OECD-30. Based on available information, at least three of the OECD-10 (Canada, the Netherlands and the United States) automatically index their national personal income tax thresholds to inflation. Many of the other OECD-10 use some form of partial indexation.
The combined progressivity of Australia’s personal income tax system and welfare system is higher than for most of the OECD-10. This particularly reflects the targeted nature of the welfare system. However, it should be noted that progressivity does not in itself equate to equity.
Australia’s tax wedge is ranked amongst the lowest four in the OECD-10 for seven of the eight different family scenarios considered by the OECD. However, Australia’s tax wedge

International comparison of Australia’s taxes
Page 58
for a single person earning 167 per cent of the average wages1 is ranked fifth highest in the OECD-10. Australia’s tax wedge is ranked amongst the lowest eight in the OECD-30 for the eight different family scenarios.
As a result of Australia’s tightly targeted welfare system, effective marginal tax rates are generally ranked higher against the OECD-10 than is the case for average tax rates. Australia’s marginal tax wedge is ranked second highest in the OECD-10 for two of the eight family scenarios. Comparisons with the OECD-30 vary considerably depending on the income of the household.
Another measure of tax burden considered in this chapter is the net personal average tax rate. The net personal average tax rate includes personal income tax plus employee social security contributions minus cash benefits. Australia’s net personal average tax rate is generally higher than the OECD-10 average, but lower than the OECD-30 average. The marginal equivalent for this measure for the eight family types show that Australia generally has a higher net personal marginal tax rate than the OECD-10, while the results for the OECD-30 vary depending on the family type considered.
Comparisons between the different family situations are considered in Appendices 4.3 and 4.4. The comparisons show the effect of the tax treatment for singles and families, the inclusion of dependants for single- and dual-income families, and the tax burden for secondary earners entering the workforce.
• Generally, across all OECD-30 countries the tax wedge for single- and dual-income families decreases with the inclusion of children. Australia is no exception; in fact, the decrease in the tax wedge in Australia exceeds both the OECD-30 and OECD-10 average decrease for both the single- and dual-income families considered.
• Australia’s marginal tax wedge increases for families with dependent children owing to the phasing-out of cash benefits.
4.1 INTRODUCTION
Wage and salary income is often described as earned income and is distinguished from more passive forms of income such as investment income or capital income. More detail on capital income is considered in Chapter 7.
Wage and salary income is subject to three forms of direct taxation — personal income tax, social security contributions and payroll tax. All three of these aspects are considered in this chapter. For a discussion on social security contributions and Australia’s Superannuation Guarantee see Box 2.1.
This chapter presents a methodology for considering the overall tax and benefits position for households. This comprehensive measure is the tax wedge and it takes into consideration the key factors that determine an individual’s disposable income. Much of the analysis contained
1 Average wage is as defined by the OECD. This is explained in Box 4.2. In Australian dollar terms, 167 per cent of average wages in Australia in 2004-05 was A$85,452; 100 per cent of average wages in Australia in 2004-05 was A$51,169; 67 per cent of average wages in Australia in 2004-05 was A$34,283.

Chapter 4: Wage and salary taxation
Page 59
in Appendices 4.1 and 4.3 compares the tax wedge for a number of different family situations.
No single measure can capture all the salient aspects of any given taxation system. The optimal insight into a country’s taxation system is obtained through the collective consideration of all available measures, rather than through any particular measure in isolation.
This chapter also considers other important aspects of the personal income tax system such as the system’s rates and thresholds, progressivity and base.
Box 4.1: Tax wedge The tax wedge is a measure of the difference between the total labour cost to an employer and the corresponding disposable income of an employee. The tax wedge is the sum of personal income tax (at all levels of government), employee and employer social security contributions (SSC) and payroll taxes minus any cash benefits from government welfare programmes. The tax wedge is usually expressed as a percentage of the total labour costs. This measure is illustrated diagrammatically in Chart 4.1.
Chart 4.1: Illustration of the tax wedge
Labour costs
Net wages
Income tax
Employee SSC
Employer SSCPayroll tax
Net wages
Cash benefits
Disposable income
Tax wedge
4.2 BROAD INTERNATIONAL COMPARISONS
4.2.1 Direct tax mix in respect of individuals and payroll
Like other OECD countries, Australia raises the majority of its taxation revenue (60.9 per cent in 2003) from direct taxation levied on incomes — wages, salaries and profits, however, the

International comparison of Australia’s taxes
Page 60
composition of Australia’s taxation of earned income is different from that of most other OECD countries (Chart 4.2 and 4.3).
As discussed in Chapter 3, payroll taxes are levied on a similar basis to social security contributions and as such are considered a form of tax on labour. While it is difficult to substantiate the actual incidence of payroll taxes, it is widespread practice to assume that taxes levied in respect of remuneration are ultimately borne by the employee.
Chart 4.2 compares Australia’s direct tax mix in respect of individuals and payroll with the average for the OECD-10. Australia’s income tax from individuals accounts for over 85 per cent of the total direct tax mix in respect of individuals and payroll, compared with the average for the OECD-10 of around 60 per cent of the total tax mix. Social security contributions and payroll taxes account for the remaining 40 per cent of the total tax in respect of individuals and payroll for the OECD-10.
Chart 4.2: Australia’s direct tax mix in respect of individuals and payroll OECD-10, 2003
Australia OECD-10 unweighted average
Individuals' income tax
Payroll tax
Individuals' income tax
Payroll tax
Employee social security contributions
Other social security contributions
Source: OECD Revenue Statistics, 2005.
4.2.2 Direct taxation in respect of individuals and payroll
As discussed in detail in Appendix 3.1, classification issues make comparisons of the headline income tax burden on individuals difficult. Despite these limitations, including the need to exercise care when analysing income tax data disaggregated into its personal and corporate components, this is the most frequent measure used in commentary about tax burden.
Chart 4.3 compares Australia’s direct tax burden in respect of individuals and payroll with the OECD-10. Casual observers often conclude that Australia has relatively high levels of taxation on individuals’ incomes because Australia’s individual income tax burden is second highest in the OECD-10.
However, once social security contributions and payroll taxes are accounted for, Australia has the second lowest level of direct taxation on individuals and payroll in the OECD-10 (14.0 per cent of GDP). This is below the unweighted average of 16.3 per cent of GDP. In Japan, the Netherlands and Spain, social security contributions are a larger source of taxation revenue than individuals’ income tax.

Chapter 4: Wage and salary taxation
Page 61
Chart 4.3: Components of direct taxation in respect of individuals and payrolls(a) OECD-10, taxation revenue as a proportion of GDP, ordered by tax burden, 2003
0
5
10
15Ire
land
Japa
n
NZ
US
UK
Can
ada
Sw
itzer
land
Spa
in
Net
herla
nds
Ave
rage
0
5
10
15
Aus
tral
ia
Per cent of GDP Per cent of GDP
0
5
10
15
Irela
nd
Japa
n
NZ
US
UK
Can
ada
Sw
itzer
land
Spa
in
Net
herla
nds
Ave
rage
0
5
10
15
Aus
tral
ia
Per cent of GDP Per cent of GDP
0
5
10
Irela
nd
Japa
n
NZ
US
UK
Can
ada
Sw
itzer
land
Spa
in
Net
herla
nds
Ave
rage
0
5
10Per cent of GDP Per cent of GDP
Aus
tral
ia
0
5
10
15
20
Irela
nd
Japa
n
NZ
US
UK
Can
ada
Sw
itzer
land
Spa
in
Net
herla
nds
Ave
rage
0
5
10
15
20
Individuals' income tax Social security contributions Payroll tax
Unweighted average
Aus
tral
ia
Per cent of GDP Per cent of GDP
(a) For the purpose of international comparison, there are significant risks in relying on disaggregated data, especially in
disaggregating taxes on income, profits and capital gains into its individuals, corporate and other components. A description of these is provided in Appendix 3.1.
Source: OECD Revenue Statistics, 2005.

International comparison of Australia’s taxes
Page 62
Australia has always had a low tax burden in respect of individuals and payroll, when compared with the OECD-10 (Chart 4.4). In fact, Australia’s tax burden has on average been around 20 per cent lower than the OECD-10 over the period since 1965.
Chart 4.4: The Australian personal tax burden in perspective OECD-10, total direct taxation revenue in respect of individuals and payroll
as a proportion of GDP, 1965-2003
0
5
10
15
20
1965
1967
1969
1971
1973
1975
1977
1979
1981
1983
1985
1987
1989
1991
1993
1995
1997
1999
2001
2003
0
5
10
15
20
OECD-10
Australia
Per cent of GDP Per cent of GDP
Source: OECD Revenue Statistics, 2005. Over the past 40 years Australia’s personal tax burden has increased from around 8 per cent of GDP to 14 per cent of GDP. After an increase in the tax burden in the early 1970s, the burden has remained relatively stable between 13 and 16 per cent of GDP.
4.2.3 History of average and marginal tax rates
Chart 4.5 shows the top marginal tax rate, the marginal and average tax rates applicable to a male earning an average wage (male total average weekly earnings or MTAWE). Both measures include the Medicare levy where applicable.

Chapter 4: Wage and salary taxation
Page 63
Chart 4.5: Marginal and average personal tax rates Australia, 1965-66 to 2004-05
0
10
20
30
40
50
60
7019
65-6
6
1967
-68
1969
-70
1971
-72
1973
-74
1975
-76
1977
-78
1979
-80
1981
-82
1983
-84
1985
-86
1987
-88
1989
-90
1991
-92
1993
-94
1995
-96
1997
-98
1999
-00
2001
-02
2003
-04
0
10
20
30
40
50
60
70Per cent Per cent
Top marginal tax rate Marginal tax rate for MTAWE Average tax rate for MTAWE
Source: Australian Treasury estimates. Australia’s top marginal tax rate has decreased over the past 40 years from almost 70 per cent to its current level of 48.5 per cent (including the Medicare levy). The marginal tax rate for MTAWE has ranged from 28 per cent to 47 per cent. Since 2000-01, the marginal tax rate for a person on MTAWE has been 31.5 per cent (including Medicare levy).
The average tax rate (total tax as a proportion of income) for a person on MTAWE in Australia has been steady at around 22 per cent over the past 40 years. In comparison, the marginal tax rate (the rate of tax paid on an additional dollar of income) for the same person has averaged around 35 per cent.
4.2.4 Tax wedge
The tax wedge captures the overall difference between the disposable income of an employee and the corresponding costs incurred by their employer. It is the standard measure used for comparing tax burdens on wage income across countries and through time and is the cornerstone of the OECD’s publication Taxing Wages.
Tax wedge analysis demonstrates how personal income tax, social security contributions paid by employees and employers and cash benefits affect various types of families in different countries in the OECD. This allows for a country-based comparison of labour costs and the overall tax and benefit position of families. This analysis is discussed in greater detail in Appendix 4.1. Another measure of tax burden is the net personal average tax rate and this is considered in Appendix 4.2.
Chart 4.6 shows the composition of the tax wedge for the OECD-10 for an average worker with no dependent children. Cash benefits are not included as the average worker with no children does not receive any cash benefits in any OECD country. Chart 4.6 shows that the

International comparison of Australia’s taxes
Page 64
tax wedge for an average worker with no children in Australia is the fourth lowest in the OECD-10.
Chart 4.6: Tax wedge for an average worker OECD-10, 2005(a)
0
10
20
30
40
50
NZ
Irela
nd
Japa
n
US
Sw
itzer
land
Can
ada
UK
Net
herla
nds
Spa
in
0
10
20
30
40
50
Income tax Employee SSC Employer SSC
Per cent Per cent
Aus
tral
ia
(a) Refers to a single average worker with no dependants. The tax wedge includes income tax plus employee and employer
social security contributions. The OECD’s Taxing Wages publication includes payroll taxes in its treatment of employer social security contributions.
Source: OECD Taxing Wages, 2005.
Chart 4.7 shows the composition of the tax wedge for an average worker with no children in Australia against the OECD-10. This shows that while Australia’s structure of direct taxes on individuals and payroll varies from the average, the end result is that the proportion of labour costs that the average worker receives as disposable income in Australia is very similar to that for the average worker for the OECD-10. The actual disposable income depends on the wage levels as well as tax wedges.

Chapter 4: Wage and salary taxation
Page 65
Chart 4.7: Comparison of the tax wedge components for an average worker(a) Australia and OECD-10, 2005
Australia OECD-10 unweighted average
Income tax22.7 per
cent
Employer payroll tax 5.7 per cent
Disposable income 71.7 per cent
Income tax
13.5 per cent
Employee social
security contributions 7.1 per cent
Employer social security contributions 9.7 per cent
Disposable income 69.6 per cent
(a) Refers to a single average worker with no dependants.
Source: OECD Taxing Wages, 2005. The tax wedge varies depending on the level and composition of the family and private income. In order to compare tax systems, the OECD calculates tax wedges for eight different hypothetical family scenarios. Appendix 4.1 outlines these family scenarios and illustrates and compares the tax wedge across the OECD-30. Comparisons between the different family scenarios are considered in Appendix 4.3. The comparisons show the effect of the inclusion of dependants for single-and dual-income households as well as the effect of secondary earners entering the workforce.
In summary, the tax wedge for workers in Australia is consistently ranked among the lowest eight in the OECD-30 for each of the eight family types considered and among the lowest six in the OECD-10 countries. Australia’s tax wedge is lower than the average for the OECD-10 for all eight scenarios except for a single-income person earning 167 per cent of average wages.
Another measure of the tax burden is the net personal average tax rate. The net personal average tax rate is a measure of the employee’s total wage-based tax burden. The net personal average tax rate can be described as a measure of a family household’s wage-based disposable income, and is important since it is a measure of the employee’s incentive to increase the number of hours they work or to seek promotion.
The net personal average tax rate is the sum of personal income tax plus employee social security contributions, minus cash benefits as a percentage of gross wage earnings. That is, this measure excludes employer social security contributions and payroll taxes and the base is gross wages rather than total labour costs. The results of the net personal average tax rate for the eight different family types are contained in Appendix 4.2.

International comparison of Australia’s taxes
Page 66
Australia’s net personal average tax rate is generally higher than the average for the OECD-10 with two exceptions, sole parents with two children earning 67 per cent of average wages and single-income families with two children earning 100 per cent of average wages.
Box 4.2: Measures of wage earnings
The wage measure used in this chapter is the average wage for an average worker (AW). This measure is the OECD’s average wage measure and therefore allows for international comparisons. The average wage is the average gross wage for persons engaged in full-time manual or non-manual labour for a certain range of industries.2
In 2004-05 Australia’s average wage was A$51,169 (on a US dollars purchasing power parity basis this is US$36,851).
The OECD’s average wage measure differs from other commonly used average wage indicators in Australia.
One measure of wage earnings is average weekly ordinary time earnings for full-time adults (AWOTE). This measure includes all cash earnings of an employee which are received on a regular and recurring basis but excludes overtime payments. The average value of AWOTE for 2004-05 was A$51,206.
Another Australian measure of wage earnings is average weekly earnings (AWE). AWE is calculated on both full-time and part-time workers. AWE includes all cash earnings of an employee which are received on a regular and recurring basis, such as ordinary time and overtime payments. The average value of AWE for 2004-05 was A$40,356.
Male total average weekly earnings (MTAWE) is the same as AWE, but is calculated across males only. MTAWE has been used in the analysis in Chart 4.8 as it is the only wage series in Australia that is available back to 1960s. In 2004-05, MTAWE was around A$48,056.
Chart 4.8 shows the average wage across the OECD-10 on a purchasing power parity basis.
2 The average gross wage of a person engaged in full-time manual or non-manual labour in industry sectors C-K (inclusive) in the international classification. For Australia these sectors are: manufacturing, electricity gas and water, construction, wholesale trade, retail trade, accommodation, cafes and restaurants, transport and storage, communication services and finance and insurance.

Chapter 4: Wage and salary taxation
Page 67
Box 4.2: Measures of wage earnings (continued)
Chart 4.8: Gross wage earnings for an average worker OECD-10, 2005 (US dollars)
0
10,000
20,000
30,000
40,000
50,000
Spa
in NZ
Irela
nd
Can
ada
US
Japa
n
Sw
itzer
land
Net
herla
nds
UK
0
10,000
20,000
30,000
40,000
50,000US$ PPP US$ PPP
Aus
tral
ia
Source: OECD Taxing Wages, 2005.
4.3 DESCRIPTION OF TAX RATES
This section sets out the key attributes of the rate schedules for personal income tax, social security contributions and payroll taxes. The rates for the various components of wage and salary taxation impact on the tax wedge analysis.
4.3.1 Personal income tax rates
All of the OECD-10 have progressive personal income tax rates (that is, the average tax rate rises with income) with multiple rates and thresholds (progressivity is covered in greater detail in section 4.5).
Australia’s personal income tax system is progressive through the application of the A$6,000 tax free threshold and marginal tax rates for graduated levels of income. In addition, the low income tax offset ensures low income taxpayers with income up to A$21,600 have a tax free threshold of A$7,567 in 2005-06.
Based on available information, at least three of the OECD-10 automatically index their national income tax thresholds to inflation each year (Canada, the Netherlands and the United States). Canada introduced indexation of national income tax thresholds in 2000. Thresholds are indexed by the increase in the consumer price index for the period ending on 30 September of the preceding taxation year. The Netherlands indexes for inflation at the beginning of each year. The United States indexes its tax thresholds annually to inflation. Most US states do not index their tax thresholds.

International comparison of Australia’s taxes
Page 68
Other countries do not appear from the available information to have automatic indexation based on a legislative requirement to increase thresholds in line with inflation each year and instead rely on discretionary regular adjustments or other adjustment systems. Switzerland is required to make an adjustment after the cumulative inflation rate has increased by at least seven per cent since the last adjustment. Spain indexes its tax thresholds at 2 per cent to mitigate the effects of inflation. The United Kingdom also indexes thresholds by the increase in the retail price index unless the Parliament specifies this is not to occur.
In addition to national taxes, based on available information, four of the OECD-10 levy income tax on a sub-national basis (Canada, Japan, Switzerland and the United States). Analysis of the overall personal tax burden must take into account these taxes (national and sub-national tax rate schedules are documented in Appendix 4.5). Sub-national taxes may include state or provincial taxes as well as taxes levied at a local or municipal level.
The effect of the personal income tax rates for all levels of government is included in the tax wedge analysis.
4.3.2 Social security contributions rates
Social security contributions are payments to institutions of general government that are earmarked to provide social security benefits.
Examples of social security benefits funded through social security contributions include: unemployment insurance benefits and supplements; accident, injury and sickness benefits; old-age, disability and survivors’ pensions; family allowances; reimbursements for medical and hospital expenses and provision of hospital or medical services.
Social security contributions are usually levied on both employees and employers and there are generally separate contributory structures for different types of schemes. Generally social security contributions are levied as a function of gross earnings, payroll or the number of employees.
Social security contributions are generally imposed at a flat rate, however they can be progressive or regressive. They are generally applied up to a maximum level.
Rates and maximum levels vary greatly between countries which makes comparisons difficult (detailed information is contained in Appendix 4.5 in local denomination).
The OECD reports (OECD 2001) that while income taxes are progressive in all OECD countries, employee social security contributions are either neutral or regressive, particularly at high income levels.
4.3.3 Payroll tax rates
Payroll taxes are levied on a similar basis to social security contributions and as such classified as a tax on labour. While robust incidence analysis is extraordinarily difficult, it is widespread practice to assume that taxes levied in respect of remuneration are ultimately borne by the employee.

Chapter 4: Wage and salary taxation
Page 69
Unlike employer social security contributions, payroll taxes are not collected for the specific purpose of funding social security programmes.
Payroll taxes can be paid by employers, employees or the self-employed either as a proportion of payroll or as a fixed amount per person.
4.4 TOP MARGINAL TAX RATE
Chart 4.9 shows the top marginal tax rate3 for all OECD countries and the threshold to which the top marginal tax rate applies. The top marginal tax rate threshold is expressed as a multiple of the OECD’s measure of average wages (see Box 4.2).
Chart 4.9: Top marginal tax rates and thresholds (unweighted averages) OECD-30, 2005
0
2
4
6
8
10
12
Slo
vak
Rep
Hun
gary
Irela
ndD
enm
ark
Luxe
mbo
urg
Bel
gium
Mex
ico
UK
Ger
man
yN
ethe
rland
sIc
elan
dN
ZG
reec
eS
wed
enFi
nlan
dC
zech
Rep
Aus
tria
Nor
way
Turk
eyS
pain
Fran
ceC
anad
aP
olan
dS
witz
erla
ndK
orea
Japa
nP
ortu
gal
Italy
US
0
10
20
30
40
50
60
70
80
Australia (2004-05) Australia (from 2006-07)Average threshold = 2.4
Average top marginal tax rate = 46.7
Top threshold, multiple of the average wage (bars) Top marginal rate, per cent (dots)
Aus
tral
ia
Aus
tral
ia
Source: OECD Tax Database (preliminary data). In 2004-05 Australia’s top marginal tax rate applied to incomes over A$70,000. This equated to around 1.4 times average wages. The top marginal tax rate in 2006-07 will apply to incomes over A$125,000. This equates to around 2.2 times average wages. Australia’s top marginal tax rate is 48.5 per cent (including the Medicare levy). Chart 4.9 includes unweighted OECD-30 averages for the top marginal tax rate and the top threshold. The unweighted OECD-30 average threshold is 2.4 times average wages and the unweighted OECD-30 average top marginal tax rate is 46.7 per cent.
Australia’s top marginal tax rate is eleventh highest in the OECD-30. The threshold to which Australia’s top rate applies is currently ninth lowest in the OECD-30. However, changes to the threshold from 1 July 2006 will result in Australia’s ranking moving to twelfth highest in the OECD-30.
3 The top marginal tax rate is the all-in top marginal tax rate as calculated by the OECD. The all-in top marginal tax rate includes national and sub-national government personal income tax, plus employee social security contributions (as well as the impact of deductibility of social security contributions from national government taxes), resulting from a unit increase in gross wages.

International comparison of Australia’s taxes
Page 70
Chart 4.10: Top marginal tax rates and thresholds (unweighted averages) OECD-10, 2005
0
2
4
6
8
10
12Ire
land UK
Net
herla
nds
NZ
Spa
in
Can
ada
Sw
itzer
land
Japa
n
US
0
10
20
30
40
50
60
Australia (2004-05) Australia (from 2006-07)
Average threshold = 3.1
Average top marginal tax rate = 45.8
Top threshold, multiple of the average wage (bars) Top marginal rate, per cent (dots)
Aus
tral
ia
Aus
tral
ia
Source: OECD Tax Database (preliminary data). Chart 4.10 isolates the top marginal tax rate and threshold for only the OECD-10. The unweighted average threshold is 3.1 times average wages and the unweighted average top marginal tax rate is 45.8 per cent.
Chart 4.11 replicates Chart 4.9 but uses GDP OECD-30 weighted averages rather than OECD-30 unweighted averages.
Chart 4.11: Top marginal tax rates and thresholds (weighted averages) OECD-30, 2005
0
2
4
6
8
10
12
Slo
vak
Rep
Hun
gary
Irela
ndD
enm
ark
Luxe
mbo
urg
Bel
gium
Mex
ico
UK
Ger
man
yN
ethe
rland
sIc
elan
dN
ZG
reec
eS
wed
enFi
nlan
dC
zech
Rep
Aus
tria
Nor
way
Turk
eyS
pain
Fran
ceC
anad
aP
olan
dS
witz
erla
ndK
orea
Japa
nP
ortu
gal
Italy
US
0
10
20
30
40
50
60
70
80
Australia (2004-05)Australia (from 2006-07)Average threshold = 5.6
Average top marginal tax rate = 44.5
Top threshold, multiple of the average wage (bars) Top marginal rate, per cent (dots)
Aus
tral
ia
Aus
tral
ia
Source: OECD Tax Database (preliminary data). The weighted average threshold is 5.6 times average wages. Chart 4.11 illustrates the significance of the United States when computing a measure of weighted averages as the

Chapter 4: Wage and salary taxation
Page 71
weighted average threshold is higher than the individual threshold for every other OECD country.
Chart 4.12 shows the change in the top marginal tax rate for the OECD-30 from 2000 to 2005.
Chart 4.12: Top marginal tax rates OECD-30, 2000 and 2005
0
10
20
30
40
50
60
70
Slo
vak
Rep
Mex
ico
Kor
ea NZ
Icel
and
Cze
ch R
ep UK
Turk
eyA
ustri
aU
SIta
lyG
erm
any
Spa
inC
anad
aP
ortu
gal
Sw
itzer
land
Japa
nLu
xem
bour
gIre
land
Fran
ceG
reec
eN
orw
ayP
olan
dN
ethe
rland
sFi
nlan
dS
wed
enB
elgi
umD
enm
ark
Hun
gary
0
10
20
30
40
50
60
70
2000 2005
Per cent Per cent
Aus
tral
ia
Source: OECD Tax Database (preliminary data). Since 2000, seventeen countries in the OECD-30 have reduced their top marginal tax rate by varying magnitudes. This includes six countries in the OECD-10. Nine countries in the OECD-30 have increased their top marginal tax rate including two of the OECD-10. Australia is one of four countries in the OECD-30 that has not changed the top marginal tax rate (one of two in the OECD-10).
Chart 4.13 shows the change in the top statutory marginal tax rate for the OECD-30 from 2000 to 2005. The statutory rate is a partial measure that only includes the combined national and sub-national personal income tax rates. It does not include employee social security contributions.

International comparison of Australia’s taxes
Page 72
Chart 4.13: Top statutory marginal tax rate OECD-30, 2000 and 2005
0
10
20
30
40
50
60
70
Slo
vak
Rep
Mex
ico
Turk
eyC
zech
Rep
Hun
gary
Kor
eaLu
xem
bour
gN
ZG
reec
eU
KP
olan
dP
ortu
gal
US
Icel
and
Irela
ndS
witz
erla
ndN
orw
ayIta
lyS
pain
Ger
man
yC
anad
a
Aus
tria
Japa
nFi
nlan
dN
ethe
rland
sB
elgi
umFr
ance
Sw
eden
Den
mar
k
0
10
20
30
40
50
60
70
2000 2005
Per cent Per cent
Aus
tral
ia
Source: OECD Tax Database (preliminary data). Since 2000, nineteen countries in the OECD-30 have reduced their top statutory marginal tax rate by varying magnitudes. This includes five OECD-10 countries. Only two countries in the OECD-30 increased the top statutory marginal tax rate (only one in the OECD-10). Australia is one of nine countries in the OECD-30 that has not changed the top statutory marginal tax rate (one of four in the OECD-10).
Charts 4.12 and 4.13 are limited to changes in marginal tax rates and do not consider movements in thresholds. In Australia’s case, the threshold to which the top marginal tax rate applies has increased from A$50,000 in 1999-00 to A$70,000 in 2004-05 and will move to A$125,000 in 2006-07.

Chapter 4: Wage and salary taxation
Page 73
Box 4.3: Australia-United States comparison4
Calculating the tax wedge can be highly dependent on the location of the individual even within a country.
A highly stylised cameo that illustrates the difference in the tax wedge across and within countries is to compare a single high-income earner in Sydney to a single high-income earner in New York, Los Angeles and Houston.
The results in the table below illustrate the importance of taking into consideration all elements of the tax wedge when making international comparisons.
An analysis of the tax wedge includes the impact of federal, state, and city income taxes, social security contributions, the Medicare levy and payroll taxes. The analysis allows for state and local taxes to be claimed as a deduction from United States federal income tax. United States taxpayers are also entitled to a ‘personal exemption’ on their federal income tax. However, the analysis does not take into consideration the full range of deductions, such as work related deductions, that are available to the taxpayer in each country.
All-in tax wedge — single individual, no dependants Income A$ Australia — Sydney
resident 2006-07 (per cent)
United States — New York city resident 2006-07 (per cent)
United States – Los Angeles resident 2006-07 (per cent)
United States – Houston resident 2006-07 (per cent)
100,000 34.9 38.2 36.8 30.7
125,000 37.2 39.8 38.7 32.4
150,000 39.6 39.6 38.5 32.1 Source: Australian Treasury calculations; United States Revenue Service; New York State Department of Taxation and Finance; Californian Franchise Tax Board; Texas Workforce Commission.
4 Rates, thresholds and deductions for the New York state and city analysis are based on the latest information. However, New York State’s budget is currently under negotiation and some items could change retroactively for tax year 2006. Calculations for Los Angeles are based on the latest Californian tax rates in 2005 (2006 rates are not available until August). Texas does not levy state personal income tax.

International comparison of Australia’s taxes
Page 74
Box 4.4: Flat income tax systems in Eastern Europe
Over the past ten years there has been an increase in the number of flat income tax systems, especially in Eastern Europe. Flat income tax systems have been adopted in Estonia (1994), Lithuania (1994), Latvia (1995), Russia (2001), Serbia (2003), Slovakia (2004), the Ukraine (2004), Georgia (2005) and Romania (2005).
A pure flat income tax system taxes income at the same percentage rate along the full range of income. Most countries that have a flat income tax system also have either tax credits or a tax free threshold which adds a degree of progressivity to the system.
The main reasons that flat income tax rate systems have been adopted in Eastern Europe are:
• to encourage higher compliance with the tax system. Tax administration in some economies was extremely weak, with significant informal economic activity outside the tax system;
• to reduce complexity. Many of the economies in Eastern Europe that have adopted flat income taxes had various taxes at a range of rates that made it difficult for taxpayers to understand their tax obligations; and
• as part of broader tax reform to join the European Union.
Economies that have adopted flat income tax systems tend to have high levels of social security contributions. In many of the Eastern European economies social security contributions are the main element of the tax burden on labour.
The effect of introducing a flat income tax system on the tax burden can be illustrated by considering the experience in the Slovak Republic. This is the only ‘flat tax country’ in Eastern Europe that is a member of the OECD and as such is the only economy where OECD data are available on the tax wedge. The taxation of labour income in the Slovak Republic is similar to other Eastern European economies as social security contributions greatly exceed personal income taxation revenue.
In 2003, the personal income tax system in the Slovak Republic had five income brackets, with tax rates varying from 10 per cent to 38 per cent. A taxpayer on average earnings would face a marginal tax rate of 20 per cent. The corporate tax rate was 25 per cent, while the VAT rate was 20 per cent. In 2004, all of these rates were replaced with a flat tax rate of 19 per cent. The introduction of the flat rate was combined with a large increase in the basic allowance (it was more than doubled) and the removal of many forms of tax relief which led to a broadening of the tax base.

Chapter 4: Wage and salary taxation
Page 75
Box 4.4: Flat income tax systems in Eastern Europe (continued)
Table 4.1 compares average income tax rates and the tax wedge for a single individual in 2003 and 2004 (before and after the introduction of a flat tax system) for different percentages of average earnings. Despite the introduction of a flat income tax system, there have only been small changes in the tax wedge facing individuals for different income levels (see Table 4.1).
Table 4.1: Average income tax and tax wedge for a single individual before and after Slovak reform (2003 versus 2004)
67% of average wages 100% of average wages 167% of average wages
2003 2004 2003 2004 2003 2004
Income tax (per cent)
4.8 3.7 6.3 7.9 10.7 11.3
Tax wedge (per cent)
40.3 38.8 41.4 42.0 44.6 44.5
Source: OECD An International Perspective on Japanese Tax Reform, 2006.
Russia also introduced a flat income tax system in 2001. A single 12 per cent rate replaced a progressive schedule with rates of 12, 20 and 30 per cent; various exemptions from tax were eliminated; social security contribution rates were reduced; and the maximum tax free threshold was increased. As Russia is not a member of the OECD there is no comparative tax wedge data available to analyse the net effect of these changes.
4.5 PROGRESSIVITY
Progressivity measures the extent to which the income tax burden increases with income. Hence a more progressive tax system would have people on higher incomes paying a higher proportion of their income in tax than people on lower incomes.
Progressive personal income tax systems reflect the redistributive role played by governments. Progressive taxes are characterised by an increasing average rate of tax as income rises. As such (and in the absence of negative taxes), the marginal personal income rate of tax must lie above the average rate of tax.
However, it should be noted that progressivity does not in itself equate to equity. A progressive system may not be equitable if it results in a large number of higher income earners avoiding or evading taxes. The measure of progressivity discussed below is only relevant to questions of vertical equity. More broadly the progressivity of a tax system does not measure the equity of various expenditures. Lastly, a more progressive tax and welfare system generally results in higher effective marginal tax rates.
There are different measures of progressivity which vary in complexity. It is beyond the scope of this study to provide an in-depth analysis of these methods.
The OECD (OECD 2006) has developed a simple measure of determining progressivity. Using this methodology Chart 4.14, compares the progressivity of the tax wedge for a single

International comparison of Australia’s taxes
Page 76
individual with no dependants on 67 and 167 per cent of average wages.5 Higher numbers indicate higher progressivity.
Chart 4.14: Progressivity between 67 and 167 per cent average wages(a) OECD-10, 2005
0.0
0.1
0.2
0.3
0.4
0.5
Net
herla
nds
Japa
n
Spa
in
Can
ada
UK
US
Sw
itzer
land NZ
Irela
nd
0.0
0.1
0.2
0.3
0.4
0.5
Aus
tral
ia
Ratio Ratio
(a) Comparison for a single worker with no dependants. Source: OECD Taxing Wages, 2005. On this measure, Australia has the second most progressive tax system in the OECD-10 after Ireland for single incomes between 67 per cent of average wages and 167 per cent of average wages.
An OECD report (Whiteford 2005) shows that, of the 24 OECD countries considered in this study, Australia has the most progressive distribution of benefits on two different measures (Chart 4.15). This is the result of the relatively tightly targeted nature of Australia’s welfare system. The study also calculates a measure of churning (the notion that households can be both recipients of welfare and taxpayers simultaneously) across OECD countries where data were available. The results shows that Australia has the lowest level of churning across those countries.
5 Progressivity between 67 to 167 per cent average wages is calculated by ((T167-T67)/T167) where T167 is the tax wedge at 167 per cent average wages and T67 is the tax wedge at 67 per cent average wages.

Chapter 4: Wage and salary taxation
Page 77
Chart 4.15 shows progressivity of transfers through a ratio of the benefits received by the poorest quintile to benefits received by the richest quintile for the total population for the OECD-10.
Chart 4.15: Progressivity of transfers OECD-10, around 2000
0
2
4
6
8
10
12
14
Japa
n
Spa
in US
Can
ada
Net
herla
nds
Irela
nd UK NZ
0
2
4
6
8
10
12
14
Aus
tral
ia
Ratio Ratio
Source: Whiteford, OECD (2005).

International comparison of Australia’s taxes
Page 78
Chart 4.16 shows Whiteford’s measure of churning6 as a percentage of household disposable income and as a percentage of direct taxes. In both measures Australia has the lowest level of churn. Caution should be exercised when interpreting these results as the tax mix within a country can significantly affect the results. For example, countries with a high reliance on indirect taxes will have a high percentage of churn as a percentage of direct taxes.
Chart 4.16: Measures of churn Sub-set of OECD-10, 2000(a)
0
10
20
30
40
50
60
NZ
Net
herla
nds
US
Irela
nd
Can
ada
Japa
n
UK
Sw
itzer
land
0
10
20
30
40
50
60
Churning as per cent disposable income Churning as per cent direct taxes
Per cent Per cent
Aus
tral
ia
(a) Data on Spain not available. Source: Whiteford, OECD (2005).
4.6 EFFECTIVE MARGINAL TAX RATES
Effective marginal tax rates measure the percentage of a one dollar increase in income that is lost to income tax and income tests on government payments and services.
Appendices 4.1 and 4.2 detail results for the marginal tax wedge and the net personal marginal tax rate which are measures of effective marginal tax rates at specified income levels.
The results show that Australia’s marginal tax wedge and net personal marginal tax rate are generally relatively higher than the other OECD-10 countries. Again this is the result of the relatively tightly targeted nature of Australia’s welfare system.
Effective marginal tax rates can also be adjusted to take account of other factors that influence the decision to enter the workforce. One factor is child care which is considered in Box 4.5.
6 Churning is calculated by comparing the level of transfers by each decile with the level of direct taxes (income taxes and employee social security contributions) paid by each decile. Where transfers exceed taxes, the churning is the level of taxes and where taxes exceed transfers, churning is the level of transfers. This measure of churning only counts direct financial transfers, not indirect transfers through subsidised services such as health and education.

Chapter 4: Wage and salary taxation
Page 79
Box 4.5: Child care
A range of different measures are used to provide assistance for families who use child care. These measures can be delivered either through the tax system or through direct payments.
In some countries, child care payments are tax deductible. This approach can reduce the progressivity of the tax system. Other countries use tax credits and direct payments such as child care-related means-tested payments. These payments tend to be targeted towards low-income families or socially disadvantaged groups such as sole parents and are progressive because they are higher at lower levels of income. Support is sometimes available for parents caring for their own children at home (home-care or child-raising allowances).
Some countries, including Australia, use a combination of tax and direct payments. For example, Australia provides assistance through the Child Care Benefit (a means-tested payment) and the Child Care Tax Rebate (a non-refundable tax credit).
The OECD quantifies (OECD 2005) the net cost of purchasing centre-based child care (including the impact of child care related tax concessions and cash benefits available to parents) and provides an estimate of the effective tax burden including child care costs.
Chart 4.17 shows secondary earners and sole parents in Australia have the third lowest increase in the effective tax burden (including child care costs) as a per cent of gross earnings when starting a new job compared to the OECD-10. The effective tax burden includes the effect of income taxes, employees’ social security contributions, cash benefits as well as child care costs.
Chart 4.17: Effective tax burden including child care costs for secondary earner Sub-set of OECD-10, 2002(a)
82.4
100.8
79.2
63.9
67.1
63.072.5
77.7 77.9
-20
0
20
40
60
80
100
120
140
US
Japa
n
NZ
Can
ada
Net
herla
nds
Sw
itzer
land UK
Irela
nd
-20
0
20
40
60
80
100
120
140
Child care feesDecrease in cash benefitsIncrease in social security contributions
Increase in income taxTotal increase in effective tax burden and child care costs
Per cent of gross earnings in new job Per cent of gross earnings in new job
Aus
tral
ia
(a) Data on Spain not available. Source: OECD (2005).

International comparison of Australia’s taxes
Page 80
Box 4.5: Child care (continued)
Chart 4.18: Effective tax burden including child care costs for sole parent Sub-set of OECD-10, 2002(a)
96.692.486.6
78.0
40.9
117.5131.1
67.964.8
-20
0
20
40
60
80
100
120
140
US
UK
Japa
n
Net
herla
nds
NZ
Can
ada
Sw
itzer
land
Irela
nd
-20
0
20
40
60
80
100
120
140Per cent of gross earnings in new job Per cent of gross earnings in new job
Aus
tral
ia
Child care feesDecrease in cash benefitsIncrease in social security contributions
Increase in income taxTotal increase in effective tax burden and child care costs
(a) Data on Spain not available. Source: OECD (2005). This analysis is based on 2002 data and as such does not reflect recent policy initiatives, including in Australia’s case the Child Care Tax Rebate.
4.7 DESCRIPTION OF THE TAX BASE
Personal income tax systems are founded on an income base. Typically, a country’s assessable personal income base may include the following items: wages; salaries; allowances; tips; capital income (dividends, capital gains, interest payments and royalties); rents; partnership income; distribution from trusts; fringe benefits; imputed rents from owner-occupied housing; and income transfers (pensions, disability compensation, unemployment benefits and sick pay).
The majority of the OECD-10 include fringe benefits in the taxable income base. Nonetheless, most countries have a number of concessions and exclusions for fringe benefits in the tax base. Australia and New Zealand are the only two countries in the OECD-10 that levy a separate fringe benefits tax (see Appendix 4.5).
To calculate taxable income, assessable income is reduced by deductions. Deductions can be broadly categorised into personal allowance deductions and specific deductions.

Chapter 4: Wage and salary taxation
Page 81
Personal allowance deductions
Personal allowance deductions are provided on the basis of the individual’s family situation rather than their financial situation.
In many of the OECD-10, a personal allowance is provided with higher amounts paid to married couples with dependants. Personal allowances are provided in Ireland, Japan, the Netherlands, Spain, Switzerland, the United Kingdom and the United States.
An alternative to a personal allowance deduction is a tax free threshold. Australia has a tax free threshold rather than a personal allowance.
In addition, countries may operate a system of tax credits (or offsets) which are applied against a person’s tax liability rather than their income. In Canada a basic credit reduces a person’s tax liability but is available to all individuals and as such is equivalent to a tax free threshold.
Specific deductions
The majority of the OECD-10 countries allow for work-related deductions that are directly related to gaining or producing assessable income.
Table 4.2: Deduction for work-related expenses for OECD-10 Country Work-related expenses Comment
Australia Yes Directly related to gaining or producing an employee’s assessable income.
Canada Limited Only deductions specifically legislated are allowed, for example, accounting and legal fees are allowable deductions.
Ireland Yes Expenses incurred wholly, exclusively and necessarily in the performance of duties.
Japan Limited Specific deductions which exceed the standard deduction for employment income are allowed. Specific deductions include travelling expenses.
Netherlands Yes All expenses which are necessary to collect or maintain income.
New Zealand Limited Condition excludes expenditure that is of a capital nature, private, nature, exempt income, and non-residents’ foreign-sourced income nature, and also limits employment expenses due to withholding taxes.
Spain No Only a general standard deduction is available. Expenses relating to employment are generally not deductible.
Switzerland Yes
United Kingdom Yes, conditional Most deductions in the United Kingdom must be incurred wholly, exclusively and necessarily in the performance of an employee’s duties, a condition that precludes the deduction of many employment related expenses.
United States Yes Employees can deduct work-related expenses subject to limitation (expenses generally only deductible to the extent they exceed 2 per cent of adjusted gross income). The United States allows taxpayers the option of claiming a standard deduction in lieu of itemising deductions.
Many of the OECD-10 that levy social security contributions also allow this expense as a deduction. The United States also allows individuals to claim state and local taxes as a deduction from their federal income tax.

International comparison of Australia’s taxes
Page 82
Tax unit
The tax unit can be based on an individual or on a person’s spouse and dependants.
While the majority of the OECD-10 countries have the individual as the tax unit, joint taxation is possible in Canada, Spain, Ireland, Switzerland and the United States. According to the OECD (OECD 2006) the only countries in the OECD-10 where couples with average earnings can benefit from joint taxation are Ireland, Switzerland and the United States.
Australia’s personal income tax system is based on the individual. There are a few areas of personal income tax that are based on the combined family income. For example, the Australian Government levies a Medicare levy surcharge for individuals who do not have private health insurance and whose family income exceeds the relevant threshold. Family income, for Medicare levy surcharge purposes only, includes the income of both the taxpayer and their spouse.
Appendix 4.5 provides more detail on the tax base and the tax unit for each of the OECD-10.
Chapter 4: Wage and salary taxation
Page 83
REFERENCES
Australian Treasury 2003, ‘Treasury submission to the Senate Economics References Committee Inquiry into the Structure and Distributive Effects of the Australian Taxation System’, Economic Round, Spring, Treasury, Canberra, pp 27-56.
IBFD 2005, Asia Pacific handbook.
IBFD 2005, European tax handbook.
OECD 2001, Tax and the Economy a comparative assessment of OECD countries, OECD, Paris.
OECD 2002, Revenue Statistics 1965-2001, OECD, Paris.
OECD 2004, Tax Policy Studies, ‘Tax and the economy a comparative assessment of the OECD countries, OECD, Paris.
OECD 2005, Revenue Statistics 1965-2004, OECD, Paris.
OECD 2005, OECD social, employment and migration working papers, Can parents afford to work? Childcare costs, tax-benefit policies and work incentives, OECD, Paris.
OECD 2006, Fundamental reform of Personal Income Tax (forthcoming) OECD, Paris.
OECD 2006, Tax Database.
OECD 2006, Taxing wages 2005, OECD, Paris.
Owens, J 2006, ‘An international perspective on Japanese Tax Reform’, presented at OECD business day 14 March 2006, OECD.
Piper, S and Murphy, C 2005, ‘Flat personal income taxes: systems in practice in Eastern Europe economies’, Economic Roundup, Spring 2005, Treasury, Canberra, pp 37-52.
Whiteford, P 2005, ‘The Welfare Expenditure Debate: “Economic myths of the left and the right” revisited’, OECD.

International comparison of Australia’s taxes
Page 84
APPENDIX 4.1: TAX WEDGE ANALYSIS
TAX WEDGE ANALYSIS
The tax wedge is the sum of personal income tax (at all levels of government), employee and employer social security contributions and payroll taxes minus any cash benefits from government welfare programmes. The tax wedge is usually expressed as a percentage of the total labour costs. This measure is illustrated diagrammatically in Appendix chart 4.1.1.
Appendix chart 4.1.1: Illustration of the tax wedge
Labour costs
Net wages
Income tax
Employee SSC
Employer SSCPayroll tax
Net wages
Cash benefits
Disposable income
Tax wedge
The tax wedge is the most useful measure of the tax burden to consider because it takes into account the interchangeability of cash benefits and tax relief. The tax wedge for workers in Australia is consistently ranked amongst the lowest eight in the OECD-30 (Appendix table 4.1.3) for each of the eight family types considered later in this Appendix. Australia’s tax wedges are among the lowest six of the OECD-10 for all the family types (Appendix table 4.1.4).

Chapter 4: Wage and salary taxation
Page 85
TAX WEDGE COMPOSITION
Appendix table 4.1.1 outlines the composition of the tax wedge for a single individual earning the average wage with no dependants. In general, the tax wedge consists of income tax, employee and employer social security contributions, payroll tax, and cash benefits. For simplicity, only the components of an average worker's tax wedge are examined. This illustrates that the composition of the tax wedge and the proportions of the components vary significantly amongst the OECD-30.
Appendix table 4.1.1: Tax wedge for a single worker earning the average wage with no dependants, 2005
Employee social Employer social Labour costs insecurity security US dollars using
Total tax Income contributions contributions purchashing pwerCountry wedge tax plus payroll tax paritiesKorea 17.3 2.5 6.5 8.2 41,086Mexico 18.2 5.6 1.4 11.2 12,031New Zealand 20.5 20.5 0.0 0.0 27,274Ireland 25.7 11.4 4.7 9.7 34,395Japan 27.7 5.9 10.5 11.3 43,122Australia 28.3 22.7 0.0 5.7 39,062Iceland 29.0 23.4 0.2 5.4 33,953United States 29.1 14.6 7.3 7.3 34,144Switzerland 29.5 9.6 10.0 10.0 45,191Canada 31.6 14.8 6.2 10.5 34,965United Kingdom 33.5 15.7 8.2 9.6 50,982Luxembourg 35.3 11.1 12.3 11.9 46,531Portugal 36.2 8.1 8.9 19.2 24,933Norway 37.3 18.8 6.9 11.6 43,554Slovak Republic 38.3 6.9 10.6 20.8 15,748Netherlands 38.6 9.5 19.7 9.5 45,910Greece 38.8 4.3 12.5 21.9 33,050Spain 39.0 10.7 4.9 23.4 34,545Denmark 41.4 30.2 10.6 0.5 38,664Turkey 42.7 12.7 12.3 17.7 22,610Poland 43.6 5.3 21.3 17.0 19,548Czech Republic 43.8 8.6 9.3 25.9 20,559Finland 44.6 20.1 5.1 19.4 43,443Italy 45.4 13.6 6.9 24.9 36,011Austria 47.4 10.9 14.0 22.6 47,692Sweden 47.9 18.1 5.3 24.5 43,916France 50.1 10.8 9.6 29.7 47,824Hungary 50.5 14.3 10.0 26.3 18,559Germany 51.8 17.3 17.3 17.3 53,278Belgium 55.4 21.4 10.7 23.3 53,581Unweighted average: OECD 37.3 13.3 8.8 15.2 36,205 Source: OECD Taxing Wages, 2005.

International comparison of Australia's taxes
Page 86
ANALYSIS OF THE TAX WEDGE FOR DIFFERENT FAMILY TYPES
The OECD collects data on tax wedges for eight different hypothetical family types. These family types provide a broad representation of a large number of common circumstances. These eight cameos are summarised in Appendix table 4.1.2.
Appendix table 4.1.2: Characteristics of the different family types Family Marital Number of Number oftype status children earners First wage Second wage1 Single 0 1 67% 0%2 Single 0 1 100% 0%3 Single 0 1 167% 0%4 Single 2 1 67% 0%5 Married 2 1 100% 0%6 Married 2 2 100% 33%7 Married 2 2 100% 67%8 Married 0 2 100% 33% Source: OECD Taxing Wages, 2005.
Australia’s position for the eight family types
Appendix chart 4.1.2 and Appendix chart 4.1.3 show the tax wedge of the OECD-30 for the eight family types, with Australia's position highlighted. Australia is always ranked within the lowest eight amongst the OECD-30 for all the family types. Appendix chart 4.1.4 and Appendix chart 4.1.5 show the marginal tax wedge of the OECD-30 for the eight family types. The OECD averages and Australia’s rankings for the tax wedge and marginal tax wedge for the eight family types are summarised in Appendix table 4.1.3 to Appendix table 4.1.6.
The tax wedge for an average single worker in Australia is 28.3 per cent, which is the sixth lowest in the OECD-30 and is the fourth lowest in the OECD-10. New Zealand, Ireland and Japan have smaller tax wedges. Australia's marginal tax wedge for an average worker is 35.4 per cent, placing it sixth lowest in the OECD-30 and fourth lowest in the OECD-10.
Australia's tax wedge for a single worker earning 67 per cent of the average wage is 24.8 per cent, which is the sixth lowest in the OECD-30 and third lowest in the OECD-10. New Zealand and Ireland have smaller tax wedges. Australia's marginal tax wedge for this worker is 35.4 per cent, which is tenth lowest in the OECD-30 and fourth largest in the OECD-10. Among the OECD-10, the United Kingdom, Spain and the Netherlands have larger marginal tax wedges.
In Australia, the tax wedge for a single worker earning 167 per cent of the average wage is 35.6 per cent placing it eighth lowest in the OECD-30 and sixth lowest in the OECD-10. Australia’s marginal tax wedge for this worker is 51.4 per cent, which is sixteenth lowest in the OECD-30 and second largest in the OECD-10 after the Netherlands. Australia’s marginal tax wedge is slightly above the OECD-30 average.
Australia's tax wedge for a single parent earning 67 per cent of the average wage with two children is -5.5 per cent which is second lowest in the OECD-30 and the OECD-10 after Ireland. This means that the benefits received as cash transfers are larger than the total tax burden. New Zealand, the United States and Canada also provide a net benefit for this worker. The marginal tax wedge in Australia for this single parent is 68.3 per cent of labour

Chapter 4: Wage and salary taxation
Page 87
costs, which is the third largest in the OECD-30 after Belgium and the United Kingdom and is the second largest in the OECD-10.
The tax wedge in Australia for a single-income married couple earning the average wage with two children is 16.0 per cent of labour costs, which is the sixth lowest in the OECD-30 and fourth lowest amongst the OECD-10. Ireland has the lowest tax wedge for this family type. Australia's marginal tax wedge for this family type is 54.2 per cent, which is the tenth largest in the OECD-30 and the third largest in the OECD-10 after Canada and New Zealand.
In Australia, the tax wedge for a dual-income married couple with one partner earning 100 per cent and the other 33 per cent of the average wage with two children is 20.5 per cent, which is eighth lowest in the OECD-30 and fourth lowest amongst the OECD-10 countries. The United States, New Zealand and Ireland have lower tax wedges. Australia’s marginal tax wedge for this family type is 35.4 per cent which places Australia eighth lowest in the OECD-30 and sixth lowest in the OECD-10.
For a dual-income married couple with one partner earning 100 per cent and the other 67 per cent of the average wage with two children in Australia the tax wedge is 23.1 per cent, which is seventh lowest in the OECD-30 and fourth lowest in the OECD-10. Australia’s marginal tax wedge for this family type is 35.4 per cent which places Australia seventh lowest in the OECD-30 and fifth lowest in the OECD-10.
In Australia, a dual-income married couple with one partner earning 100 per cent and the other 33 per cent of the average wage with no children has a tax wedge of 25.2 per cent, which is sixth lowest in the OECD-30 and third lowest in the OECD-10 after New Zealand and Ireland. Australia’s marginal tax wedge for this family type is 35.4 per cent which places Australia eighth lowest in the OECD-30 and sixth lowest in the OECD-10.
In summary, Australia’s tax wedge is substantially closer to the OECD-10 average than the OECD-30 average. Of particular note is the tax wedge for a single parent earning 67 per cent of the average wage with two dependent children which is - 5.5 per cent. Spain, Netherlands, Switzerland and the United Kingdom generally have a higher tax wedge than Australia in all eight family scenarios. New Zealand and Ireland generally have a lower tax wedge than Australia for most family types.
Australia’s marginal tax wedge is above both the OECD-30 and OECD-10 averages for a single worker earning 167 per cent of the average wage with no children, a single parent earning 67 per cent of the average wage with two children and for a single income married couple earning the average wage with two children. For families with dependants, any high marginal tax wedges are a result of Australia’s relatively highly targeted social security system.

International comparison of Australia’s taxes
Page 88
App
endi
x ta
ble
4.1.
3: A
ustr
alia
’s ta
x w
edge
— c
ompa
rison
with
OEC
D-3
0 Si
ngle
Sing
leSi
ngle
Sing
leM
arrie
dM
arrie
dM
arrie
dM
arrie
dno
chi
ldre
nno
chi
ldre
nno
chi
ldre
n2
child
ren
2 ch
ildre
n2
child
ren
2 ch
ildre
nno
chi
ldre
n67
%10
0%16
7%67
%10
0%-0
%10
0%-3
3%10
0%-6
7%10
0%-3
3%A
ustra
lia's
tax
wed
ge24
.828
.335
.6-5
.516
.020
.523
.125
.2O
EC
D-3
0 av
erag
e ta
x w
edge
33.7
37.3
42.1
19.0
27.7
30.0
32.4
34.3
Aus
tralia
's ra
nk in
the
OE
CD
-30
66
82
68
76
N
ote:
The
cou
ntry
with
the
smal
lest
tax
wed
ge h
as a
rank
of o
ne.
Sour
ce: O
ECD
Tax
ing
Wag
es, 2
005.
A
ppen
dix
tabl
e 4.
1.4:
Aus
tral
ia’s
tax
wed
ge —
com
paris
on w
ith O
ECD
-10
Sing
leSi
ngle
Sing
leSi
ngle
Mar
ried
Mar
ried
Mar
ried
Mar
ried
no c
hild
ren
no c
hild
ren
no c
hild
ren
2 ch
ildre
n2
child
ren
2 ch
ildre
n2
child
ren
2 ch
ildre
n67
%10
0%16
7%67
%10
0%-0
%10
0%-3
3%10
0%-6
7%10
0%-3
3%A
ustra
lia's
tax
wed
ge24
.828
.335
.6-5
.516
.020
.523
.125
.2O
EC
D-1
0 av
erag
e ta
x w
edge
27.7
30.4
35.0
7.5
20.5
23.5
26.1
27.6
Aus
tralia
's ra
nk in
the
OE
CD
-10
34
62
44
43
N
ote:
The
cou
ntry
with
the
smal
lest
tax
wed
ge h
as a
rank
of o
ne.
Sour
ce: O
ECD
Tax
ing
Wag
es, 2
005.
A
ppen
dix
tabl
e 4.
1.5:
Aus
tral
ia’s
mar
gina
l tax
wed
ge —
com
paris
on w
ith O
ECD
-30
Sing
leSi
ngle
Sing
leSi
ngle
Mar
ried
Mar
ried
Mar
ried
Mar
ried
no c
hild
ren
no c
hild
ren
no c
hild
ren
2 ch
ildre
n2
child
ren
2 ch
ildre
n2
child
ren
no c
hild
ren
67%
100%
167%
67%
100%
-0%
100%
-33%
100%
-67%
100%
-33%
Aus
tralia
's m
argi
nal t
ax w
edge
35.4
35.4
51.4
68.3
54.2
35.4
35.4
35.4
OE
CD
-30
aver
age
mar
gina
l tax
wed
ge43
.046
.549
.246
.746
.844
.545
.544
.6A
ustra
lia's
rank
in th
e O
EC
D-3
010
616
2821
87
8
Not
e: T
he c
ount
ry w
ith th
e sm
alle
st m
argi
nal t
ax w
edge
has
a ra
nk o
f one
. So
urce
: OEC
D T
axin
g W
ages
, 200
5.
App
endi
x ta
ble
4.1.
6: A
ustr
alia
’s m
argi
nal t
ax w
edge
— c
ompa
rison
with
OEC
D-1
0 Si
ngle
Sing
leSi
ngle
Sing
leM
arrie
dM
arrie
dM
arrie
dM
arrie
dno
chi
ldre
nno
chi
ldre
nno
chi
ldre
n2
child
ren
2 ch
ildre
n2
child
ren
2 ch
ildre
nno
chi
ldre
n67
%10
0%16
7%67
%10
0%-0
%10
0%-3
3%10
0%-6
7%10
0%-3
3%A
ustra
lia's
mar
gina
l tax
wed
ge35
.435
.451
.468
.354
.235
.435
.435
.4O
EC
D-1
0 av
erag
e m
argi
nal t
ax w
edge
36.8
40.1
43.0
48.2
45.4
38.0
38.4
38.0
Aus
tralia
's ra
nk in
the
OE
CD
-10
74
99
86
56
N
ote:
The
cou
ntry
with
the
smal
lest
mar
gina
l tax
wed
ge h
as a
rank
of o
ne.
Sour
ce: O
ECD
Tax
ing
Wag
es, 2
005.

Chapter 4: Wage and salary taxation
Page 89
Appendix chart 4.1.2: Tax wedge (as a percentage of labour costs) for singles Tax wedge for a single worker earning 67 percent of the average wage with no children (left)
and for an average worker with no children (right), OECD-30
0 10 20 30 40 50 60
MexicoKorea
NZIrelandIceland
JapanUS
SwitzerlandCanada
Lux'bourgUK
PortugalNorwayGreece
Slovak RepSpain
DenmarkFinland
Neth'landsFrance
ItalyTurkey
Czech RepPolandAustria
HungarySweden
GermanyBelgium
Per cent
OECD-30 average
Australia
0 10 20 30 40 50 60
KoreaMexico
NZIrelandJapan
IcelandUS
SwitzerlandCanada
UKLux'bourg
PortugalNorway
Slovak RepNeth'lands
GreeceSpain
DenmarkTurkeyPoland
Czech RepFinland
ItalyAustria
SwedenFrance
HungaryGermanyBelgium
Per cent
OECD-30 average
Australia
Tax wedge for a single average worker earning 167 per cent of the average wage (left) and for a single parent earning 67 per cent of the average wage with two children (right), OECD-30
0 10 20 30 40 50 60 70
KoreaMexico
NZJapan
CanadaUS
Switzerland
IrelandIceland
UKSlovak Rep
PortugalNeth'lands
SpainLux'bourg
NorwayTurkeyPolandGreece
Czech RepDenmark
ItalyFinlandAustriaFrance
GermanySwedenHungaryBelgium
Per cent
OECD-30 averageAustralia
-20 -10 0 10 20 30 40 50
Ireland
NZUS
CanadaIceland
Lux'bourgUK
SwitzerlandDenmark
MexicoKorea
Czech RepNorway
Neth'landsSlovak Rep
PortugalJapan
AustriaHungary
ItalyFinland
SpainFrance
GermanyGreece
BelgiumSwedenTurkeyPoland
Per cent
OECD-30 average
Australia
Source: OECD Taxing Wages, 2005.

International comparison of Australia's taxes
Page 90
Appendix chart 4.1.3: Tax wedge (as a percentage of labour costs) for married couplesTax wedge for a single income married couple earning the average wage with two children (left)
and for a dual income married couple earning 100 and 33 per cent of the average wage with two children (right), OECD-30
0 10 20 30 40 50
IrelandIceland
USLux'bourg
NZ
KoreaMexico
SwitzerlandCanada
Slovak RepJapan
PortugalCzech Rep
UKNeth'lands
DenmarkNorway
SpainItaly
AustriaGermany
FinlandGreece
HungaryBelgiumFrancePoland
SwedenTurkey
Per cent
OECD-30 average
Australia
0 10 20 30 40 50
IrelandMexicoKorea
Lux'bourgNZUS
Iceland
SwitzerlandUK
CanadaJapan
PortugalSlovak Rep
NorwayNeth'lands
DenmarkCzech Rep
SpainAustriaFinlandGreece
ItalyHungary
FranceBelgium
GermanyTurkey
SwedenPoland
Per cent
OECD-30 averageAustralia
Tax wedge for a dual income married couple earning 100 and 67 per cent of the average wage with two children (left) and for a dual income married couple earning 100 and 33 per cent
with no children (right), OECD-30
0 10 20 30 40 50
KoreaMexicoIreland
NZLux'bourg
US
IcelandJapan
CanadaUK
Portugal
NorwayNeth'lands
DenmarkSpain
GreeceFinland
Czech RepAustria
ItalyHungary
TurkeyFrancePoland
SwedenGermanyBelgium
Per cent
OECD-30 average
Australia
Slovak Rep
Switzerland
0 10 20 30 40 50
MexicoKorea
IrelandNZ
Iceland
USJapan
SwitzerlandLux'bourg
CanadaUK
PortugalNorway
Slovak RepSpain
Neth'landsGreece
DenmarkFinland
ItalyTurkeyPoland
Czech RepAustriaFrance
SwedenGermanyBelgiumHungary
Per cent
OECD-30 average
Australia
Source: OECD Taxing Wages, 2005.

Chapter 4: Wage and salary taxation
Page 91
Appendix chart 4.1.4: Marginal Tax wedge for singles Marginal tax wedge for a single worker earning 67 per cent of the average wage with no children (left)
and for an average worker with no children (right), OECD-30
0 20 40 60 80
KoreaNZ
MexicoJapan
Ireland
USGreeceCanada
PortugalIceland
UKLux'bourgDenmark
NorwaySlovak Rep
TurkeyCzech Rep
PolandSpain
FinlandSwedenHungary
ItalyAustria
Neth'landsGermany
FranceBelgium
Per cent
OECD-30 averageAustralia
Switzerland
0 20 40 60 80 100
MexicoKoreaJapan
NZUS
SwitzerlandIceland
UKCanadaNorway
Slovak RepTurkeySpain
PolandPortugal
Czech RepSweden
DenmarkNeth'landsLux'bourg
ItalyIrelandGreeceFinlandFranceAustria
GermanyBelgiumHungary
Per cent
OECD-30 average
Australia
Marginal tax wedge for a single average worker earning 167 per cent of the average wage (left) and for a single parent earning 67 per cent of the average wage with two children (right), OECD-30
0 20 40 60 80
KoreaJapan
MexicoCanada
SpainNZ
AustriaSlovak RepSwitzerland
USIceland
GermanyUK
TurkeyIreland
Czech Rep
Neth'landsPolandNorway
Lux'bourgPortugal
ItalyFinlandFranceGreece
DenmarkHungarySwedenBelgium
Per cent
OECD-30 average
Australia
0 20 40 60 80
KoreaMexico
Lux'bourgUS
Japan
GreecePortugal
NZSpain
DenmarkNorway
Slovak RepTurkeyPolandIcelandFinland
SwedenHungary
Neth'landsItaly
CanadaAustria
GermanyCzech Rep
FranceIreland
BelgiumUK
Per cent
OECD-30 average
Australia
Switzerland
Source: OECD Taxing Wages, 2005.

International comparison of Australia's taxes
Page 92
Appendix chart 4.1.5: Marginal Tax wedge for married couples Marginal tax wedge for a single income married couple earning the average wage with two children (left) and for a dual income married couple earning 100 and 33 per cent
of the average wage with two children (right), OECD-30
0 20 40 60 80 100
KoreaMexico
Lux'bourgJapan
SwitzerlandIreland
PortugalUK
NorwayDenmark
Slovak RepTurkeySpain
PolandIceland
SwedenUS
Neth'landsFranceGreece
ItalyFinland
GermanyCanada
Czech RepAustria
NZBelgiumHungary
Per cent
OECD-30 average
Australia
0 20 40 60 80 100
MexicoKoreaJapan
NZIreland
US
Lux'bourgPortugal
UKNorway
Denmark
CanadaTurkey
Czech RepSpain
PolandIcelandFrance
SwedenNeth'lands
ItalyGreeceFinlandAustria
GermanyBelgiumHungary
Per cent
OECD-30 averageAustralia
Slovak Rep
Switzerland
Marginal tax wedge for a dual income married couple earning 100 and 67 per cent of the average wage with two children (left) and for a dual income married couple earning
100 and 33 per cent with no children (right), OECD-30
0 20 40 60 80 100
MexicoKoreaJapan
NZIreland
US
UKNorway
Denmark
Canada
TurkeySpain
PolandIceland
Portugal
Sweden
FranceItaly
GreeceFinlandAustria
BelgiumHungary
Per cent
OECD-30 average
Australia
Germany
Neth'lands
Czech Rep
Lux'bourg
Slovak Rep
Switzerland
0 20 40 60 80 100
MexicoKoreaJapan
NZIreland
USSwitzerland
Lux'bourgPortugalIceland
UKCanadaNorway
DenmarkSlovak Rep
TurkeySpain
PolandCzech Rep
SwedenNeth'lands
FranceItaly
GreeceFinlandAustria
GermanyBelgiumHungary
Per cent
OECD-30 averageAustralia
Source: OECD Taxing Wages, 2005.
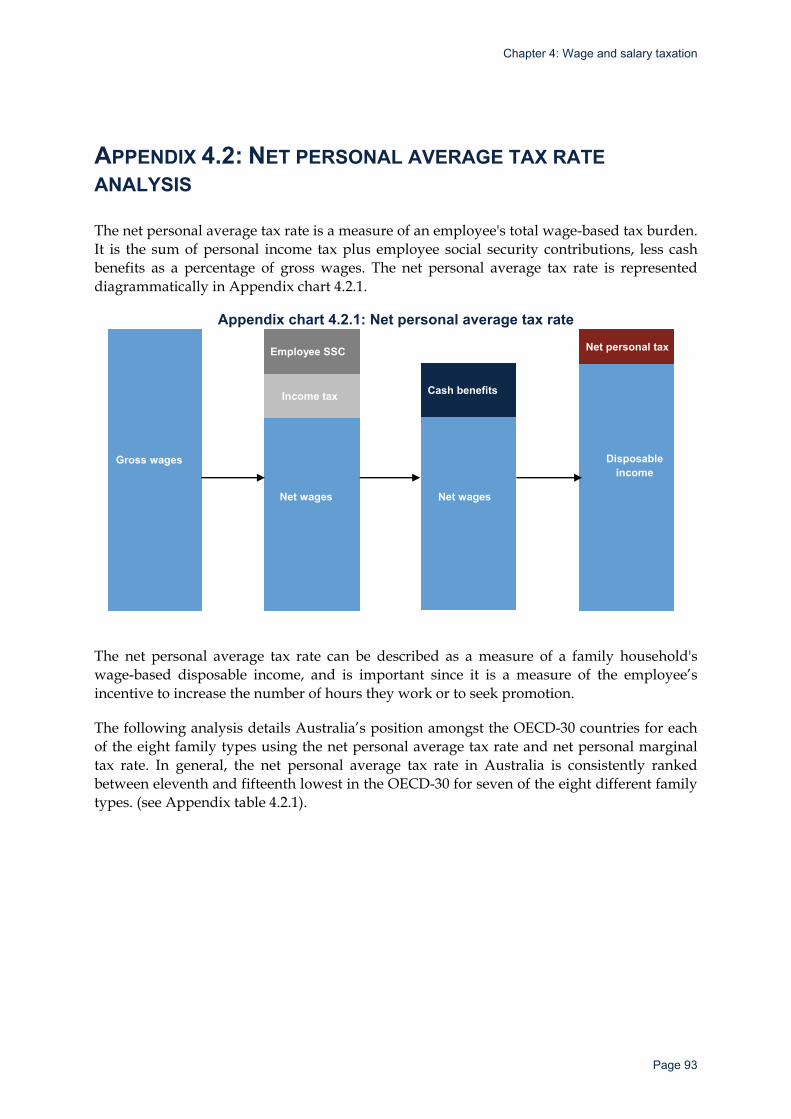
Chapter 4: Wage and salary taxation
Page 93
APPENDIX 4.2: NET PERSONAL AVERAGE TAX RATE ANALYSIS
The net personal average tax rate is a measure of an employee's total wage-based tax burden. It is the sum of personal income tax plus employee social security contributions, less cash benefits as a percentage of gross wages. The net personal average tax rate is represented diagrammatically in Appendix chart 4.2.1.
Appendix chart 4.2.1: Net personal average tax rate
Gross wages
Net wages Net wages
Income tax
Employee SSC
Cash benefits
Disposable income
Net personal tax
The net personal average tax rate can be described as a measure of a family household's wage-based disposable income, and is important since it is a measure of the employee’s incentive to increase the number of hours they work or to seek promotion.
The following analysis details Australia’s position amongst the OECD-30 countries for each of the eight family types using the net personal average tax rate and net personal marginal tax rate. In general, the net personal average tax rate in Australia is consistently ranked between eleventh and fifteenth lowest in the OECD-30 for seven of the eight different family types. (see Appendix table 4.2.1).

International comparison of Australia’s taxes
Page 94
AUSTRALIA’S POSITION FOR THE EIGHT FAMILY TYPES
Appendix chart 4.2.2 and Appendix chart 4.2.3 show the net personal average tax rate of the OECD-30 for the eight family types, with Australia’s position highlighted. Appendix chart 4.2.4 and Appendix chart 4.2.5 show the net personal marginal tax rate of the OECD-30 for the eight family types. The OECD averages and Australia’s rankings for the net personal average tax rate and net personal marginal tax rate are summarised in Appendix table 4.2.1 to Appendix table 4.2.4.
Australia’s net personal average tax rate for an average worker is 24.0 per cent, which places it thirteenth lowest in the OECD-30 and third largest in the OECD-10 after the United Kingdom and the Netherlands. The net personal marginal tax rate in Australia for an average worker with no children is 31.5 per cent, placing it ninth lowest in the OECD-30 and fifth lowest in the OECD-10.
In Australia, the net personal average tax rate for a single worker earning 67 per cent of the average wage with no children is 20.3 per cent, placing it fourteenth lowest in the OECD-30 and fourth highest in the OECD-10. The United States and the United Kingdom both have higher net personal average tax rates, while Canada and New Zealand have lower net personal average tax rates. The net personal marginal tax rate for a worker earning 67 per cent of the average wage in Australia is 31.5 per cent and is the thirteenth lowest in the OECD-30 and fourth highest in the OECD-10. This is within two percentage points of both OECD averages.
In Australia, a single worker earning 167 per cent of the average wage with no children has a net personal average tax rate of 31.7 per cent, placing it fifteenth lowest in the OECD-30 and the second largest in the OECD-10. This value is slightly below the OECD-30 average and above the OECD-10 average. The net personal marginal tax rate for this worker in Australia is 48.5 per cent of gross wages placing it eighth highest in the OECD-30 and second highest in the OECD-10.
For a single parent earning 67 per cent of the average wage with two children in Australia, the net personal average tax rate is -11.8 per cent, which is third lowest in the OECD-30 and the OECD-10. Eight other countries in the OECD-30 provide a net overall benefit to this family type and therefore have a negative net personal average tax rate. The net personal marginal tax rate in Australia for this single parent is 66.4 per cent, which is the second highest in the OECD-30 and the OECD-10 after the United Kingdom. For these single parents, the United States and Luxembourg are the only countries which have reasonably large net benefits and relatively low net personal marginal tax rates.
For a single-income married couple earning the average wage with two children, the net personal average tax rate is 10.9 per cent in Australia, placing it eleventh lowest in the OECD-30 and fourth lowest in the OECD-10. The lowest net personal average tax rate for this family type is in Ireland. The net personal marginal tax rate in Australia for this family type is 51.5 per cent, which is the fifth highest in the OECD-30 and third highest in the OECD-10.
In Australia a dual-income married couple with one partner earning 100 per cent and the other 33 per cent of the average wage with two children has a net personal average tax rate

Chapter 4: Wage and salary taxation
Page 95
of 15.7 per cent placing it twelfth lowest in the OECD-30 and fifth lowest in the OECD-10. Ireland has the lowest net personal average tax rate for these families.
In Australia, a dual-income married couple earning 100 per cent and 67 per cent of the average wage with two children has a net personal average tax rate of 18.5 per cent, which places Australia twelfth lowest in the OECD-30 and the fifth largest in the OECD-10.
For a dual-income married couple earning 100 per cent and 33 per cent of the average wage with no children, the Australian net personal average tax rate is 20.8 per cent of gross wages, which is thirteenth lowest in the OECD-30 and seventh lowest in the OECD-10.
In Australia, the net personal marginal tax rates for the last three family types discussed above all have a value of 31.5 per cent which places Australia either eleventh or thirteenth lowest in the OECD-30 and fifth highest in the OECD-10. The Netherlands and Canada have the highest net personal marginal tax rate in the OECD-10 for these family types.
In summary, Australia’s net personal average tax rate is placed between eleventh and fifteenth lowest in the OECD-30 for seven out of the eight family types. The exception is for a single worker earning 67 per cent of the average wage with two children for which Australia is third lowest in the OECD-30. Australia’s net personal marginal tax rate is above both the OECD-30 and OECD-10 averages for a single worker earning 167 per cent of the average wage with no children, a single parent earning 67 per cent of the average wage with two children and for a single income married couple earning the average wage with two children. For families with dependants, any high net personal marginal tax rates are a result of Australia’s relatively highly targeted social security system.

International comparison of Australia’s taxes
Page 96
App
endi
x ta
ble
4.2.
1: A
ustr
alia
’s n
et p
erso
nal a
vera
ge ta
x ra
te —
com
paris
on w
ith O
ECD
-30
Sing
leSi
ngle
Sing
leSi
ngle
Mar
ried
Mar
ried
Mar
ried
Mar
ried
no c
hild
ren
no c
hild
ren
no c
hild
ren
2 ch
ildre
n2
child
ren
2 ch
ildre
n2
child
ren
no c
hild
ren
67%
100%
167%
67%
100%
-0%
100%
-33%
100%
-67%
100%
-33%
Aus
tralia
's n
et p
erso
nal a
vera
ge ta
x ra
te20
.324
.031
.7-1
1.8
10.9
15.7
18.5
20.8
OE
CD
-30
aver
age
net p
erso
nal a
vera
ge ta
x ra
te22
.126
.232
.15.
014
.917
.620
.422
.8A
ustra
lia's
rank
in th
e O
EC
D-3
014
1315
311
1212
13
Not
e: T
he c
ount
ry w
ith th
e sm
alle
st n
et p
erso
nal a
vera
ge ta
x ra
te h
as a
rank
of o
ne.
Sour
ce: O
ECD
Tax
ing
Wag
es, 2
005.
A
ppen
dix
tabl
e 4.
2.2:
Aus
tral
ia’s
net
per
sona
l ave
rage
tax
rate
— c
ompa
rison
with
OEC
D-1
0 Si
ngle
Sing
leSi
ngle
Sing
leM
arrie
dM
arrie
dM
arrie
dM
arrie
dno
chi
ldre
nno
chi
ldre
nno
chi
ldre
n2
child
ren
2 ch
ildre
n2
child
ren
2 ch
ildre
nno
chi
ldre
n67
%10
0%16
7%67
%10
0%-0
%10
0%-3
3%10
0%-6
7%10
0%-3
3%A
ustra
lia's
net
per
sona
l ave
rage
tax
rate
20.3
24.0
31.7
-11.
810
.915
.718
.520
.8O
EC
D-1
0 av
erag
e ne
t per
sona
l ave
rage
tax
rate
19.6
22.9
28.4
-2.5
12.0
15.3
18.0
19.8
Aus
tralia
's ra
nk in
the
OE
CD
-10
78
93
45
67
N
ote:
The
cou
ntry
with
the
smal
lest
net
per
sona
l ave
rage
tax
rate
has
a ra
nk o
f one
. So
urce
: OEC
D T
axin
g W
ages
, 200
5.
App
endi
x ta
ble
4.2.
3: A
ustr
alia
’s n
et p
erso
nal m
argi
nal t
ax ra
te —
com
paris
on w
ith O
ECD
-30
Sing
leSi
ngle
Sing
leSi
ngle
Mar
ried
Mar
ried
Mar
ried
Mar
ried
no c
hild
ren
no c
hild
ren
no c
hild
ren
2 ch
ildre
n2
child
ren
2 ch
ildre
n2
child
ren
no c
hild
ren
67%
100%
167%
67%
100%
-0%
100%
-33%
100%
-67%
100%
-33%
Aus
tralia
's n
et p
erso
nal m
argi
nal t
ax ra
te31
.531
.548
.566
.451
.531
.531
.531
.5O
EC
D-3
0 av
erag
e ne
t per
sona
l mar
gina
l tax
rate
32.4
37.2
42.3
36.3
37.3
34.8
36.0
35.0
Aus
tralia
's ra
nk in
the
OE
CD
-30
139
2329
2613
1113
N
ote:
The
cou
ntry
with
the
smal
lest
net
per
sona
l mar
gina
l tax
rate
has
a ra
nk o
f one
. So
urce
: OEC
D T
axin
g W
ages
, 200
5.
App
endi
x ta
ble
4.2.
4: A
ustr
alia
’s n
et p
erso
nal m
argi
nal t
ax ra
te —
com
paris
on w
ith O
ECD
-10
Sing
leSi
ngle
Sing
leSi
ngle
Mar
ried
Mar
ried
Mar
ried
Mar
ried
no c
hild
ren
no c
hild
ren
no c
hild
ren
2 ch
ildre
n2
child
ren
2 ch
ildre
n2
child
ren
no c
hild
ren
67%
100%
167%
67%
100%
-0%
100%
-33%
100%
-67%
100%
-33%
Aus
tralia
's n
et p
erso
nal m
argi
nal t
ax ra
te31
.531
.548
.566
.451
.531
.531
.531
.5O
EC
D-1
0 av
erag
e ne
t per
sona
l mar
gina
l tax
rate
29.6
33.6
39.8
41.9
39.0
31.2
31.7
31.3
Aus
tralia
's ra
nk in
the
OE
CD
-10
75
99
86
66
N
ote:
The
cou
ntry
with
the
smal
lest
net
per
sona
l mar
gina
l tax
rate
has
a ra
nk o
f one
. So
urce
: OEC
D T
axin
g W
ages
, 200
5.

Chapter 4: Wage and salary taxation
Page 97
Appendix chart 4.2.2: Net personal average tax rate (as a percentage of gross wage earnings) for singles
Net personal average tax rate for a single worker earning 67 percent of the average wage with no children (left) and for an average worker with no children (right), OECD-30
0 10 20 30 40 50
MexicoKorea
IrelandPortugalGreece
SpainJapan
Canada
NZIceland
Lux'bourg
US
HungaryItalyUK
FinlandNorwayAustriaFrance
SwedenTurkeyPoland
Neth'landsBelgium
GermanyDenmark
Per cent
OECD-30 average
Australia
Czech Rep
Switzerland
Slovak Rep
0 10 20 30 40 50
MexicoKorea
IrelandJapanSpain
NZPortugalGreece
SwitzerlandSlovak Rep
CanadaUS
Czech RepIceland
UKLux'bourg
ItalyFranceNorwayTurkey
SwedenFinlandPolandAustria
Neth'landsHungary
DenmarkGermanyBelgium
OECD-30 average
Per cent
Australia
Net personal average tax rate for a single worker earning 167 per cent of the average wage (left) and for a single parent earning 67 per cent of the average wage with two children (right), OECD-30
0 10 20 30 40 50 60
KoreaMexicoJapan
Slovak RepSpain
NZSwitzerland
CanadaCzech Rep
PortugalUS
IrelandUK
Greece
TurkeyFranceIceland
ItalyPoland
Lux'bourgNorwayAustria
Neth'landsFinland
SwedenHungary
GermanyBelgium
Denmark
Per cent
OECD-30 average
Australia
-30 -20 -10 0 10 20 30 40
IrelandCanada
Czech RepUS
Lux'bourgNZ
HungaryIceland
UKItaly
Slovak RepMexicoAustria
SwitzerlandPortugal
KoreaNorway
SpainNeth'lands
FinlandDenmark
JapanFranceGreece
BelgiumSweden
GermanyTurkeyPoland
Per cent
OECD-30 average
Australia
Source: OECD Taxing Wages, 2005.

International comparison of Australia’s taxes
Page 98
Appendix chart 4.2.3: Net personal average tax rate (as a percentage of gross wage earnings) for married couples
Net personal average tax rate for a single income married couple earning the average wage with two children (left) and for a dual income married couple earning 100 and 33 per cent of the average wage with
two children (right), OECD-30
-10 0 10 20 30 40
IrelandLux'bourg
Czech Rep
USIcelandMexicoKorea
Portugal
CanadaSpain
ItalyNZ
JapanAustriaFrance
HungaryUK
NorwayNeth'lands
GreeceBelgium
GermanyFinland
SwedenDenmark
PolandTurkey
Per cent
OECD-30 average
AustraliaSwitzerland
Slovak Rep
0 10 20 30 40
IrelandMexico
Lux'bourgKorea
Slovak RepPortugal
SwitzerlandCzech Rep
USIceland
Spain
JapanCanadaHungary
ItalyUK
AustriaFrance
NZGreeceFinlandNorwaySweden
Neth'landsBelgium
GermanyTurkeyPoland
Denmark
Per cent
OECD-30 average
Australia
Net personal average tax rate for a dual income married couple earning 100 and 67 per cent of the average wage with two children (left) and for a dual income married couple earning 100 and 33 per cent
with no children (right), OECD-30
0 10 20 30 40
MexicoIrelandKorea
Lux'bourgSlovak Rep
PortugalSwitzerland
USJapanSpain
Czech Rep
CanadaHungary
NZGreeceIceland
UKItaly
AustriaFranceNorwayFinland
SwedenNeth'lands
TurkeyPoland
BelgiumGermanyDenmark
Per cent
OECD-30 average
Australia
0 10 20 30 40 50
MexicoKorea
IrelandPortugal
SpainJapan
Lux'bourg
Iceland
NZCanada
USGreece
ItalyUK
FranceNorwayFinland
HungaryAustria
SwedenTurkeyPoland
BelgiumGermanyDenmark
Per cent
OECD-30 average
Australia
Neth'lands
Czech Rep
Switzerland
Slovak Rep
Source: OECD Taxing Wages, 2005.

Chapter 4: Wage and salary taxation
Page 99
Appendix chart 4.2.4: Net personal marginal tax rate for singles Net personal marginal tax rate for a single worker earning 67 percent of the average wage with no
children (left) and for an average worker with no children (right), OECD-30
0 20 40 60 80
KoreaMexicoGreeceJapan
NZPortugal
Czech RepIreland
Canada
US
FranceTurkey
UKLux'bourg
SpainPoland
SwedenNorwayIceland
HungaryItaly
FinlandDenmark
AustriaNeth'lands
GermanyBelgium
Per cent
OECD-30 average
Australia
Switzerland
Slovak Rep
0 20 40 60 80
MexicoKoreaJapanSpain
US
Slovak RepCzech Rep
SwedenTurkey
NZUK
PortugalPoland
CanadaNorwayIcelandFrance
ItalyGreeceFinlandAustria
Neth'landsLux'bourg
IrelandDenmarkBelgium
GermanyHungary
Per cent
OECD-30 average
Australia
Switzerland
Net personal marginal tax rate for a single average worker earning 167 per cent of the average wage (left) and for a single parent earning 67 per cent of the average wage with two children (right), OECD-30
0 20 40 60 80
KoreaMexicoJapan
Slovak RepCanada
Czech RepTurkeySpain
SwitzerlandAustria
USNZ
IcelandUK
FrancePoland
GermanyIreland
PortugalItaly
NorwayLux'bourg
GreeceFinland
HungaryNeth'lands
SwedenBelgium
Denmark
Per cent
OECD-30 average
Australia
0 20 40 60 80
KoreaLux'bourg
MexicoGreeceJapan
USSwitzerland
FranceSpain
PortugalSlovak Rep
TurkeyPoland
SwedenNorway
HungaryItaly
FinlandNZ
DenmarkIcelandAustria
Neth'landsCzech Rep
GermanyCanadaBelgium
Ireland
UK
Per cent
OECD-30 average
Australia
Source: OECD Taxing Wages, 2005.

International comparison of Australia’s taxes
Page 100
Appendix chart 4.2.5: Net personal marginal tax rate for married couples Net personal marginal tax rate for a single income married couple earning the average wage with two children (left) and for a dual income married couple earning 100 and 33 per cent of the average wage
with two children (right), OECD-30
0 20 40 60 80
KoreaLux'bourg
MexicoJapan
Portugal
IrelandSpain
Slovak RepFrance
SwedenTurkey
UKPolandNorway
ItalyGreece
Czech RepIceland
DenmarkFinlandAustria
USNeth'lands
Germany
CanadaBelgium
NZHungary
Per cent
OECD-30 average
Australia
Switzerland
0 20 40 60 80
MexicoKoreaJapan
PortugalCzech Rep
IrelandFranceSpain
USSlovak Rep
Lux'bourg
SwedenTurkey
NZUK
PolandNorway
ItalyCanadaGreeceIceland
DenmarkFinlandAustria
Neth'landsGermanyBelgiumHungary
Per cent
OECD-30 average
Switzerland
Australia
Net personal marginal tax rate for a dual income married couple earning 100 and 67 per cent of the average wage with two children (left) and for a dual income married couple earning 100 and 33 per cent
with no children (right), OECD-30
0 20 40 60 80
MexicoKoreaJapan
IrelandSpain
USSlovak RepCzech RepSwitzerland
France
SwedenTurkey
UKNZ
PortugalPolandNorway
ItalyLux'bourg
CanadaGreeceIceland
DenmarkFinlandAustria
Neth'landsGermanyBelgiumHungary
Per cent
OECD-30 averageAustralia
0 20 40 60 80
MexicoKoreaJapan
PortugalIreland
SpainUS
Slovak RepCzech Rep
Lux'bourgFrance
SwedenTurkey
NZUK
PolandCanadaNorwayIceland
ItalyGreece
DenmarkFinlandAustria
Neth'landsGermanyBelgiumHungary
Per cent
OECD-30 average
Australia
Switzerland
Source: OECD Taxing Wages, 2005.

Chapter 4: Wage and salary taxation
Page 101
APPENDIX 4.3: TAX WEDGE FAMILY COMPARISONS
This appendix analyses the family type comparison of the tax wedge and the marginal tax wedge for each country in the OECD-30. Comparing different family types provides insights into the effects on tax and benefits of family composition and of additional earnings from a second earner. The family type comparisons examined in this appendix are:
(a) comparing the average worker (AW) with no children to a single-income married couple earning the average wage with two children. This demonstrates the difference between the tax treatment of singles and families;
(b) comparing a single worker earning 67 per cent of the average wage, to the same worker with two dependent children. This shows how the tax system treats the inclusion of dependants for single workers;
(c) comparing a dual-income married couple with no children, earning an average wage and 33 per cent of an average wage, to the same couple with two dependent children. This shows how the tax system treats the inclusion of dependants for married couples; and
(d) comparing a single-income married couple earning the average wage with two children, to a dual-income married couple with two children, with the second income being 33 per cent of the average wage. This shows the effect of a partner starting work or re-entering the labour force.
In general:
• Families receive assistance from cash benefits or the tax system in most OECD-30 countries compared to singles. Australia’s tax wedge reductions are the ninth largest in the OECD-30.
• Sole parents receive significant cash benefits across the OECD-30. Australia’s tax wedge reductions are the second largest in the OECD-30.
• Most OECD-30 countries offer assistance to families with dependant children, compared to families without children. Australia’s tax wedge reduction is similar to the OECD-30 average.
• Approximately half the OECD-30 countries have an increased tax wedge for families with a second earner compared to a single-income family. Australia’s tax wedge also increases for dual-earner families with higher incomes.

International comparison of Australia’s taxes
Page 102
Appendix chart 4.3.1: Tax wedge comparison of a single average worker with no children to a single-income married couple earning the average wage with two
children OECD-30
0
10
20
30
40
50
60
Kor
eaM
exic
oN
ZIre
land
Japa
n
Icel
and
US
Sw
itzer
land
Can
ada
UK
Lux'
bour
gP
ortu
gal
Nor
way
Slo
vak
Rep
Net
h'la
nds
Gre
ece
Spa
inD
enm
ark
Turk
eyP
olan
dC
zech
Rep
Finl
and
Italy
Aus
tria
Sw
eden
Fran
ceH
unga
ryG
erm
any
Bel
gium
0
10
20
30
40
50
60
Single AW with no children Married one earner at AW wage with two children
Per cent Per cent
Aus
tral
ia
Source: OECD Taxing Wages, 2005. Appendix chart 4.3.1 shows the tax wedge for a single worker earning the average wage compared to a single-income married couple earning the average wage with two children. In Australia, the tax wedge for a single-income married couple earning the average wage with two children is 12.3 percentage points lower than that of the average worker. Most OECD-30 countries reduce the tax wedge of married couples with dependent children, compared to the average single worker either through cash benefits or tax relief. Australia’s tax wedge reduction of 12.3 percentage points is the ninth largest in the OECD-30.
Appendix chart 4.3.2: Marginal tax wedge comparison of a single average worker with no children to a single-income married couple earning the average wage with two
children OECD-30
0
10
20
30
40
50
60
70
80
Mex
ico
Kor
eaJa
pan
NZ
US
Sw
itzer
land
Icel
and
UK
Can
ada
Nor
way
Slo
vak
Rep
Turk
eyS
pain
Pol
and
Por
tuga
lC
zech
Rep
Sw
eden
Den
mar
kN
eth'
land
sLu
x'bo
urg
Italy
Irela
ndG
reec
eFi
nlan
dFr
ance
Aus
tria
Ger
man
yB
elgi
umH
unga
ry
0
10
20
30
40
50
60
70
80
Single AW with no children Married one earner at AW wage with two children
Per cent Per cent
Aus
tral
ia
Source: OECD Taxing Wages, 2005.

Chapter 4: Wage and salary taxation
Page 103
Appendix chart 4.3.2 shows the marginal tax wedge for a single worker earning the average wage compared to a single-income married couple earning the average wage with two children. In Australia, the marginal tax wedge for this married couple is 18.9 percentage points larger than that of an average worker. This is the second highest difference in the OECD-30 after New Zealand, which has a difference of 30 percentage points. Canada and the United States have increases of 14 percentage points or more for the family with two children compared to the average worker.
Appendix chart 4.3.3: Tax wedge comparison of a single worker earning 67 per cent of the average wage with no children to a single parent earning 67 per cent of the
average wage with two children OECD-30
-20
-10
0
10
20
30
40
50
60
Mex
ico
Kor
ea NZ
Irela
ndIc
elan
d
Japa
nU
SS
witz
erla
ndC
anad
aLu
x'bo
urg
UK
Por
tuga
lN
orw
ayG
reec
eS
lova
k R
epS
pain
Den
mar
kFi
nlan
dN
eth'
land
sFr
ance
Italy
Turk
eyC
zech
Rep
Pol
and
Aus
tria
Hun
gary
Sw
eden
Ger
man
yB
elgi
um
-20
-10
0
10
20
30
40
50
60
Single 67% AW wage with no children Single 67% AW wage with two children
Per cent Per cent
Aus
tral
ia
Source: OECD Taxing Wages, 2005. Appendix chart 4.3.3 shows the tax wedge for a single worker earning 67 per cent of the average wage with no children, compared to a single worker earning the same amount with two children. In Australia, the tax wedge for a single parent earning 67 per cent of the average wage with two children is 30.3 percentage points lower than the corresponding single worker with no children. This is the second largest difference in the OECD-30 after Ireland. The United States and Canada also have differences larger than 25 percentage points.

International comparison of Australia’s taxes
Page 104
Appendix chart 4.3.4: Marginal tax wedge comparison of a single worker earning 67 per cent of the average wage with no children to a single parent earning 67 per cent
of the average wage with two children OECD-30
0
10
20
30
40
50
60
70
80
Kor
ea NZ
Mex
ico
Japa
nIre
land
Sw
itzer
land US
Gre
ece
Can
ada
Por
tuga
lIc
elan
dU
KLu
x'bo
urg
Den
mar
kN
orw
ayS
lova
k R
epTu
rkey
Cze
ch R
epP
olan
dS
pain
Finl
and
Sw
eden
Hun
gary
Italy
Aus
tria
Net
h'la
nds
Ger
man
yFr
ance
Bel
gium
0
10
20
30
40
50
60
70
80
Single 67% AW wage with no children Single 67% AW wage with two children
Per cent Per cent
Aus
tral
ia
Source: OECD Taxing Wages, 2005. Appendix chart 4.3.4 shows the marginal tax wedge for a single worker earning 67 per cent of the average wage with no children compared to the same worker with two children. In Australia, the marginal tax wedge for this worker with two children is 32.9 percentage points larger than that of the corresponding worker with no children. This is the largest difference in the OECD-30 followed by Ireland, the United Kingdom, Canada and New Zealand.
Appendix chart 4.3.5: Tax wedge comparison of a dual-income family earning 100 per cent and 33 per cent of the average wage with no children to the same family
type with two children OECD-30
0
10
20
30
40
50
60
Mex
ico
Kor
eaIre
land NZ
Icel
and
US
Japa
nS
witz
erla
ndLu
x'bo
urg
Can
ada
UK
Por
tuga
lN
orw
ayS
lova
k R
epS
pain
Net
h'la
nds
Gre
ece
Den
mar
kFi
nlan
dIta
lyTu
rkey
Pol
and
Cze
ch R
epA
ustri
aFr
ance
Sw
eden
Ger
man
yB
elgi
umH
unga
ry
0
10
20
30
40
50
60
100% and 33% AW wage with no children 100% and 33% AW wage with two children
Per cent Per cent
Aus
tral
ia
Source: OECD Taxing Wages, 2005.

Chapter 4: Wage and salary taxation
Page 105
Appendix chart 4.3.5 shows the tax wedge for a dual-income married couple earning 100 per cent and 33 per cent of the average wage with no children, compared to the same couple with two children. The tax wedge in Australia for this family with two children is 4.8 percentage points lower than the corresponding family with no children and is almost the same as the OECD-30 average, placing Australia thirteenth largest in the OECD-30.
Appendix chart 4.3.6: Marginal tax wedge comparison of a dual-income family earning 100 per cent and 33 per cent of the average wage with no children to the same family
type with two children OECD-30
0
10
20
30
40
50
60
70
80
Mex
ico
Kor
eaJa
pan
NZ
Irela
nd US
Sw
itzer
land
Lux'
bour
gP
ortu
gal
Icel
and
UK
Can
ada
Nor
way
Den
mar
kS
lova
k R
epTu
rkey
Spa
inP
olan
dC
zech
Rep
Sw
eden
Net
h'la
nds
Fran
ceIta
lyG
reec
eFi
nlan
dA
ustri
aG
erm
any
Bel
gium
Hun
gary
0
10
20
30
40
50
60
70
80
100% and 33% AW wage with no children 100% and 33% AW wage with two children
Per cent Per cent
Aus
tral
ia
Source: OECD Taxing Wages, 2005. Appendix chart 4.3.6 shows the marginal tax wedge for a dual-income married couple earning 100 per cent and 33 per cent of the average wage with no children, compared to the same couple with two children. The Australian marginal tax wedge is the same for both of these families. This is because the family tax benefit for families with two children at this income level is paid as a flat rate per child until a much higher income is reached. This is also the case for twenty other countries in the OECD-30.

International comparison of Australia’s taxes
Page 106
Appendix chart 4.3.7: Tax wedge comparison of a single-income married couple earning the average wage with two children to a dual-income couple earning
100 per cent and 33 per cent with two children OECD-30
0
10
20
30
40
50
60
Irela
ndIc
elan
dU
SLu
x'bo
urg
NZ
Kor
eaM
exic
oS
witz
erla
ndC
anad
aS
lova
k R
epJa
pan
Por
tuga
lC
zech
Rep UK
Net
h'la
nds
Den
mar
kN
orw
ayS
pain
Italy
Aus
tria
Ger
man
yFi
nlan
dG
reec
eH
unga
ryB
elgi
umFr
ance
Pol
and
Sw
eden
Turk
ey
0
10
20
30
40
50
60
Married one earner at AW wage with two children 100% and 33% AW wage with two children
Per cent Per cent
Aus
tral
ia
Source: OECD Taxing Wages, 2005. Appendix chart 4.3.7 shows the tax wedge for a single-income married couple earning the average wage with two children compared to the same couple with a second income of 33 per cent of the average wage. In Australia, if a previously unemployed spouse returns to work and earns 33 per cent of the average wage, the overall tax wedge of the family increases by 4.5 percentage points. This is the result of family benefits being progressively phased out as the family income increases. Australia’s increase in tax wedge is the eighth largest in the OECD-30. Most OECD-30 countries follow the same trend, with the tax wedge increasing at least slightly.
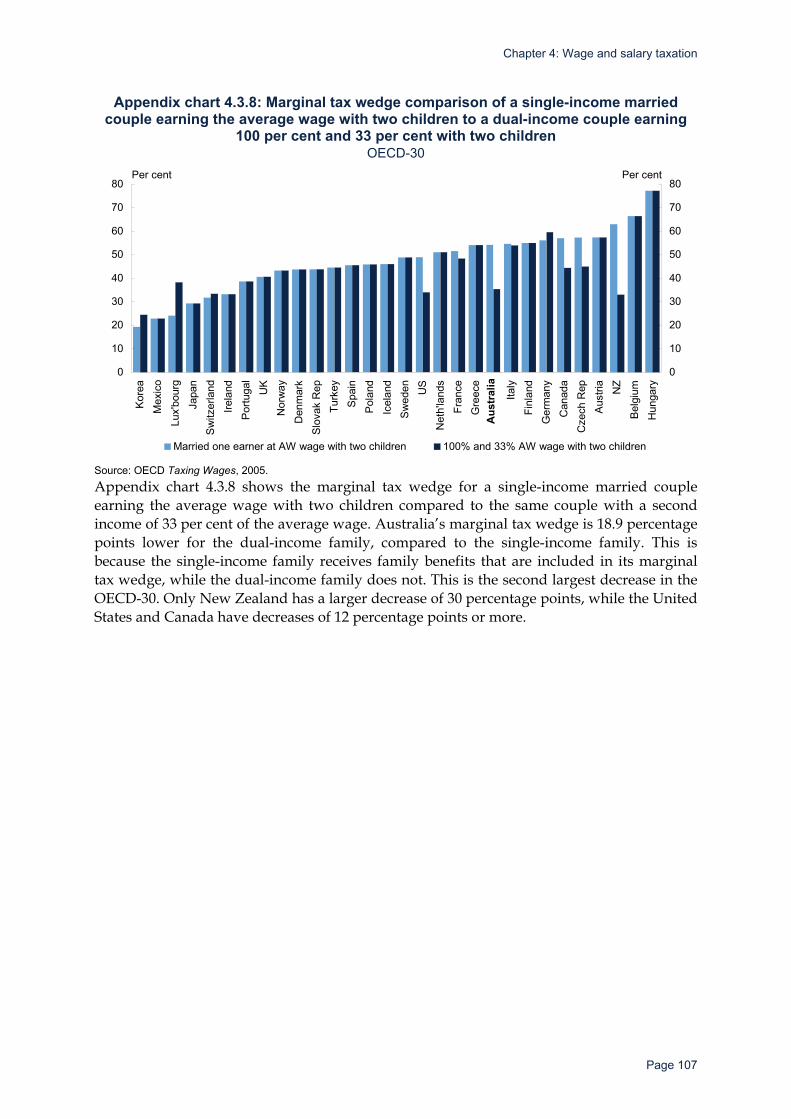
Chapter 4: Wage and salary taxation
Page 107
Appendix chart 4.3.8: Marginal tax wedge comparison of a single-income married couple earning the average wage with two children to a dual-income couple earning
100 per cent and 33 per cent with two children OECD-30
0
10
20
30
40
50
60
70
80
Kor
eaM
exic
oLu
x'bo
urg
Japa
nS
witz
erla
ndIre
land
Por
tuga
lU
KN
orw
ayD
enm
ark
Slo
vak
Rep
Turk
eyS
pain
Pol
and
Icel
and
Sw
eden US
Net
h'la
nds
Fran
ceG
reec
e
Italy
Finl
and
Ger
man
yC
anad
aC
zech
Rep
Aus
tria
NZ
Bel
gium
Hun
gary
0
10
20
30
40
50
60
70
80
Married one earner at AW wage with two children 100% and 33% AW wage with two children
Per cent Per cent
Aus
tral
ia
Source: OECD Taxing Wages, 2005. Appendix chart 4.3.8 shows the marginal tax wedge for a single-income married couple earning the average wage with two children compared to the same couple with a second income of 33 per cent of the average wage. Australia’s marginal tax wedge is 18.9 percentage points lower for the dual-income family, compared to the single-income family. This is because the single-income family receives family benefits that are included in its marginal tax wedge, while the dual-income family does not. This is the second largest decrease in the OECD-30. Only New Zealand has a larger decrease of 30 percentage points, while the United States and Canada have decreases of 12 percentage points or more.

International comparison of Australia’s taxes
Page 108
APPENDIX 4.4: NET PERSONAL AVERAGE RATE FAMILY COMPARISONS
This appendix contains a comparison of the net personal average tax rates between the pairs of family types discussed in Appendix 4.3.
Appendix chart 4.4.1: Net personal average tax rate comparison of a single average worker with no children to a single-income married couple earning the average wage
with two children OECD-30
-10
0
10
20
30
40
50
Mex
ico
Kor
eaIre
land
Japa
nS
pain NZ
Por
tuga
lG
reec
eS
witz
erla
ndS
lova
k R
epC
anad
aU
S
Cze
ch R
epIc
elan
dU
KLu
x'bo
urg
Italy
Fran
ceN
orw
ayTu
rkey
Sw
eden
Finl
and
Pol
and
Aus
tria
Net
h'la
nds
Hun
gary
Den
mar
kG
erm
any
Bel
gium
-10
0
10
20
30
40
50
Single AW with no children Married one earner at AW wage with two children
Per cent Per centA
ustr
alia
Source: OECD Taxing Wages, 2005. Appendix chart 4.4.1 shows the net personal average tax rate for a single average worker, compared to a single-income married couple earning the average wage with two children. In Australia, the net personal average tax rate of this family with two children is 13.1 percentage points lower than that for the average worker. This is the twelfth largest difference in the OECD-30, and is just above the OECD-30 average. Of the OECD-10 Ireland and the United States have larger differences than Australia.

Chapter 4: Wage and salary taxation
Page 109
Appendix chart 4.4.2: Net personal marginal tax rate comparison of a single average worker with no children to a single-income married couple earning the average wage
with two children
0
10
20
30
40
50
60
70
80
Mex
ico
Kor
eaJa
pan
Spa
in US
Sw
itzer
land
Slo
vak
Rep
Cze
ch R
ep
Sw
eden
Turk
ey NZ
UK
Por
tuga
lP
olan
dC
anad
aN
orw
ayIc
elan
dFr
ance
Italy
Gre
ece
Finl
and
Aus
tria
Net
h'la
nds
Lux'
bour
gIre
land
Den
mar
kB
elgi
umG
erm
any
Hun
gary
0
10
20
30
40
50
60
70
80
Single AW with no children Married one earner at AW wage with two children
Per cent Per cent
Aus
tral
ia
Source: OECD Taxing Wages, 2005. Appendix chart 4.4.2 shows the net personal marginal tax rate for a single worker earning the average wage compared to a single-income married couple earning the average wage with two children. In Australia, the net personal marginal tax rate for this married couple is 20 percentage points larger than that of an average worker. This is the second largest increase in the OECD-30. Ten countries in the OECD-30 have lower net personal marginal tax rates for families than for average workers without children.
Appendix chart 4.4.3: Net personal average tax rate comparison of a single worker earning 67 per cent of the average wage with no children to a single parent earning
67 per cent of the average wage with two children
-30
-20
-10
0
10
20
30
40
Mex
ico
Kor
eaIre
land
Por
tuga
lG
reec
eS
pain
Japa
nS
lova
k R
epC
anad
aS
witz
erla
nd NZ
Icel
and
Lux'
bour
g
US
Cze
ch R
epH
unga
ryIta
ly UK
Finl
and
Nor
way
Aus
tria
Fran
ceS
wed
enTu
rkey
Pol
and
Net
h'la
nds
Bel
gium
Ger
man
yD
enm
ark
-30
-20
-10
0
10
20
30
40
Single 67% AW wage with no children Single earner at 67% AW wage with two children
Per cent Per cent
Aus
tral
ia
Source: OECD Taxing Wages, 2005.

International comparison of Australia’s taxes
Page 110
Appendix chart 4.4.3 shows the net personal average tax rate for a single worker earning 67 per cent of the average wage with no children, compared to the same worker with two children. The net personal average tax rate provided by Australia to the single worker with two children is 32.1 percentage points lower than for the single person with no children. This decrease is the third-largest in the OECD-30. Ireland has the largest difference.
Appendix chart 4.4.4: Net personal marginal tax rate comparison of a single worker earning 67 per cent of the average wage with no children to a single parent earning
67 per cent of the average wage with two children
0
10
20
30
40
50
60
70
80
Kor
eaM
exic
oG
reec
eJa
pan
NZ
Por
tuga
lC
zech
Rep
Irela
ndC
anad
aS
witz
erla
nd US
Slo
vak
Rep
Fran
ceTu
rkey UK
Lux'
bour
gS
pain
Pol
and
Sw
eden
Nor
way
Icel
and
Hun
gary
Italy
Finl
and
Den
mar
kA
ustri
aN
eth'
land
sG
erm
any
Bel
gium
0
10
20
30
40
50
60
70
80
Single 67% AW wage with no children Single 67% AW wage with two children
Per cent Per cent
Aus
tral
ia
Source: OECD Taxing Wages, 2005. Appendix chart 4.4.4 shows the net personal marginal tax rate for a single worker earning 67 per cent of the average wage with no children compared to the same worker with two children. In Australia, the net personal marginal tax rate for this single parent is 34.9 percentage points larger than the same worker with no children. This is the third largest increase in the OECD-30 after the United Kingdom and Ireland. Eight countries in the OECD-30 have a higher net personal marginal tax rate for the single parent with two children.

Chapter 4: Wage and salary taxation
Page 111
Appendix chart 4.4.5: Net personal average tax rate comparison of a dual-income family earning 100 per cent and 33 per cent of the average wage with no children to
the same family type with two children
0
10
20
30
40
50
Mex
ico
Kor
eaIre
land
Por
tuga
lS
pain
Japa
nLu
x'bo
urg
Slo
vak
Rep
Icel
and
Sw
itzer
land NZ
Can
ada
US
Gre
ece
Cze
ch R
epIta
ly UK
Fran
ceN
orw
ayFi
nlan
dH
unga
ryA
ustri
aN
eth'
land
sS
wed
enTu
rkey
Pol
and
Bel
gium
Ger
man
yD
enm
ark
0
10
20
30
40
50
100% and 33% AW wage with no children 100% and 33% AW wage with two children
Per cent Per cent
Aus
tral
ia
Source: OECD Taxing Wages, 2005. Appendix chart 4.4.5 shows the net personal average tax rate for a dual-income married couple, earning 100 per cent and 33 per cent of the average wage with no children, compared to the same couple with two children. In Australia, the net personal average tax rate for this family with two children is 5.1 percentage points lower than for the corresponding family with no children. This is the thirteenth smallest difference in the OECD-30 and is almost the same as the OECD-30 average difference of 5.2 percentage points.
Appendix chart 4.4.6: Net personal marginal tax rate comparison of a dual-income family earning 100 per cent and 33 per cent of the average wage with no children to
the same family type with two children
0
10
20
30
40
50
60
70
80
Mex
ico
Kor
eaJa
pan
Por
tuga
lIre
land
Sw
itzer
land
Spa
in US
Slo
vak
Rep
Cze
ch R
epLu
x'bo
urg
Fran
ce
Sw
eden
Turk
ey NZ
UK
Pol
and
Can
ada
Nor
way
Icel
and
Italy
Gre
ece
Den
mar
kFi
nlan
dA
ustri
aN
eth'
land
sG
erm
any
Bel
gium
Hun
gary
0
10
20
30
40
50
60
70
80
100% and 33% AW wage with no children 100% and 33% AW wage with two children
Per cent Per cent
Aus
tral
ia
Source: OECD Taxing Wages, 2005.

International comparison of Australia’s taxes
Page 112
Appendix chart 4.4.6 shows the net personal marginal tax rate for a dual-income married couple earning 100 per cent and 33 per cent of the average wage with no children compared to the same couple with two children. Like the marginal tax wedge, the Australian net personal marginal tax rate is the same for both these families. This is because the family tax benefit for families with two children at this income level is paid as a flat rate per child until a much higher income is reached. Twenty other countries in the OECD-30 also have the same net personal marginal tax rates for these family types. The differences for most OECD-30 countries are generally quite small.
Appendix chart 4.4.7: Net personal average tax rate comparison of a single-income married couple earning the average wage with two children to a dual-income couple
earning 100 per cent and 33 per cent with two children
0
10
20
30
40
50
Irela
ndLu
x'bo
urg
Cze
ch R
epS
lova
k R
ep US
Icel
and
Mex
ico
Kor
eaP
ortu
gal
Sw
itzer
land
Can
ada
Spa
inIta
ly NZ
Japa
nA
ustri
aFr
ance
Hun
gary UK
Nor
way
Net
h'la
nds
Gre
ece
Bel
gium
Ger
man
yFi
nlan
dS
wed
enD
enm
ark
Pol
and
Turk
ey
0
10
20
30
40
50
Married one earner at AW wage with two children 100% and 33% AW wage with two children
Per cent Per centA
ustr
alia
Source: OECD Taxing Wages, 2005. Appendix chart 4.4.7 shows the net personal average tax rate for a single-income married couple earning the average wage with two children, compared to a dual-income married couple earning 100 per cent and 33 per cent of the average wage with two children. The net personal average tax rate in Australia for this dual-income family is 4.7 percentage points higher than for the single-income family. This difference is the seventh-largest increase in the OECD-30.

Chapter 4: Wage and salary taxation
Page 113
Appendix chart 4.4.8: Net personal marginal tax rate comparison of a single-income married couple earning the average wage with two children to a dual-income couple
earning 100 per cent and 33 per cent with two children
0
10
20
30
40
50
60
70
80
Kor
eaLu
x'bo
urg
Mex
ico
Japa
nP
ortu
gal
Sw
itzer
land
Irela
ndS
pain
Slo
vak
Rep
Fran
ceS
wed
enTu
rkey UK
Pol
and
Nor
way
Italy
Gre
ece
Cze
ch R
epIc
elan
dD
enm
ark
Finl
and
Aus
tria
US
Net
h'la
nds
Ger
man
y
Can
ada
Bel
gium N
ZH
unga
ry
0
10
20
30
40
50
60
70
80
Married one earner at AW wage with two children 100% and 33% AW wage with two children
Per cent Per cent
Aus
tral
ia
Source: OECD Taxing Wages, 2005. Appendix chart 4.4.8 shows the net personal marginal tax rate for a single-income married couple earning the average wage with two children, compared to a dual-income married couple earning 100 per cent and 33 per cent of the average wage with two children. In Australia, the net personal marginal tax rate is 20.0 percentage points smaller for the dual-income family than the single-income family. This is the second largest difference in the OECD-30 after New Zealand.

International comparison of Australia’s taxes
Page 114
APP
END
IX 4
.5: O
ECD
-10-
DES
CR
IPTI
VE W
AG
E A
ND
SA
LAR
Y TA
XATI
ON
TA
BLE
S
App
endi
x ta
ble
4.5.
1: O
ECD
-10
asse
ssab
le a
nd e
xem
pt in
com
e C
ount
ry
Ass
essa
ble
inco
me
Exem
pt in
com
e
Aust
ralia
Sa
lary
and
wag
e in
com
e, a
llow
ance
s, d
ivid
ends
, int
eres
t, ca
pita
l gai
ns, b
usin
ess
inco
me,
pe
nsio
ns, r
ents
, roy
altie
s, p
artn
ersh
ip in
com
e, d
istri
butio
ns fr
om tr
usts
, em
ploy
ee s
hare
/opt
ion
inte
rest
. Fr
inge
ben
efits
are
als
o ta
xed,
alth
ough
und
er a
diff
eren
t rat
e st
ruct
ure
to p
erso
nal i
ncom
e ta
x.
Num
ber o
f typ
es o
f exe
mpt
inco
me,
incl
udin
g di
sabi
lity
supp
ort p
ensi
ons,
ve
tera
ns a
ffairs
dis
abili
ty p
ensi
ons,
cer
tain
pay
and
allo
wan
ces
for
defe
nce
forc
e pe
rson
nel,
amou
nts
on w
hich
fam
ily tr
ust d
istri
butio
n ta
x ha
s be
en p
aid,
fam
ily p
aym
ents
suc
h as
fam
ily ta
x be
nefit
and
chi
ld c
are
bene
fit.
Can
ada
Inco
me
tax
sour
ces
(wor
ldw
ide
inco
me)
— e
mpl
oym
ent i
ncom
e, b
usin
ess
inco
me,
pro
perty
in
com
e an
d ca
pita
l gai
ns. P
rope
rty in
com
e co
nsis
ts o
f pas
sive
inco
me,
suc
h as
rent
, int
eres
t, ro
yalti
es a
nd d
ivid
ends
, ear
ned
thro
ugh
inve
stm
ent a
ctiv
ities
. Frin
ge b
enef
its a
re p
art o
f the
tax
base
.
Seve
ral t
ypes
of e
xem
pt in
com
e, in
clud
ing
capi
tal g
ains
real
ised
on
the
disp
ositi
on o
f a p
rinci
pal r
esid
ence
, dam
ages
for p
erso
nal i
njur
y, d
eath
be
nefit
s re
ceiv
ed u
nder
a li
fe in
sura
nce
polic
y.
Irela
nd
Inco
me
is ta
xed
acco
rdin
g to
a s
ched
ular
sys
tem
, bas
ed o
n th
e na
ture
of t
he in
com
e so
urce
. The
cu
rrent
app
licab
le s
ched
ules
are
: C
: pr
ofits
from
pay
men
t of i
nter
est a
nd d
ivid
ends
out
of p
ublic
reve
nue
whe
n pa
yabl
e in
Irel
and;
D
C
ase
I: tra
ding
pro
fits,
Cas
e II:
pro
fits
from
the
exer
cise
of p
rofe
ssio
ns, C
ase
III: u
ntax
ed
inte
rest
and
fore
ign
inco
me,
Cas
e IV
: any
oth
er in
com
e or
pro
fit n
ot o
ther
wis
e ta
xabl
e,
Cas
e V:
rent
al in
com
e fro
m la
nd in
Irel
and;
E:
in
com
e fro
m e
mpl
oym
ent a
nd p
ensi
ons;
F:
di
strib
utio
ns fr
om re
side
nt c
orpo
ratio
ns.
Spec
ific
exem
ptio
ns a
re g
rant
ed fo
r sev
eral
item
s, fo
r exa
mpl
e, ro
yalti
es
rece
ived
by
resi
dent
taxp
ayer
s fro
m p
aten
ts (p
rovi
ded
that
the
activ
ity
lead
ing
to it
s in
vent
ion
was
car
ried
out i
n Ire
land
).
Japa
n To
tal w
orld
wid
e in
com
e of
resi
dent
indi
vidu
als
is s
ubje
ct to
inco
me
tax.
The
re a
re 1
0 in
com
e so
urce
s th
at in
com
e ta
xes
appl
y to
: int
eres
t, di
vide
nd, r
eal e
stat
e, b
usin
ess,
em
ploy
men
t, re
tirem
ent,
fore
stry
, cap
ital g
ains
, occ
asio
nal a
nd m
isce
llane
ous
inco
me.
Som
e be
nefit
s in
kin
d re
ceiv
ed b
y th
e ta
xpay
ers
are
asse
ssab
le to
the
taxp
ayer
, for
exa
mpl
e, p
rivat
e us
e of
an
empl
oyer
pro
vide
d au
tom
obile
.
Seve
ral f
orm
s of
exe
mpt
em
ploy
men
t inc
ome,
suc
h as
som
e be
nefit
s in
ki
nd (f
or e
xam
ple
mov
ing
expe
nses
), co
mm
uter
allo
wan
ce u
p to
a
max
imum
thre
shol
d. E
xem
ptio
n fo
r int
eres
t acc
rued
from
cur
rent
ban
k de
posi
ts.
Net
herla
nds
A sc
hedu
lar s
yste
m o
pera
tes.
Onl
y th
e ite
ms
incl
uded
in th
e sc
hedu
le a
re ta
xabl
e. T
he s
ched
ule
cont
ains
diff
eren
t box
es.
Box
1 in
clud
es in
com
e fro
m e
mpl
oym
ent,
busi
ness
, oth
er a
ctiv
ities
, per
iodi
cal p
aym
ents
(fro
m
indi
vidu
als
and
the
stat
e), o
wne
r-occ
upie
d dw
ellin
gs. F
ringe
ben
efits
are
incl
uded
in th
e de
finiti
on o
f the
taxa
ble
wag
e.
Box
2 is
inco
me
from
sub
stan
tial s
hare
hold
ings
(div
iden
ds a
nd c
apita
l gai
ns) b
oth
resi
dent
and
no
n-re
side
nt c
ompa
nies
. Bo
x 3
is in
com
e fro
m s
avin
gs a
nd in
vest
men
t.
Exem
pt in
com
e Bo
x 3
— a
num
ber o
f ass
ets
are
excl
uded
from
the
taxa
ble
base
, inc
ludi
ng o
wne
r-oc
cupi
ed d
wel
lings
and
cer
tain
cap
ital
insu
ranc
e po
licie
s us
ed to
fina
nce
owne
r-occ
upie
d dw
ellin
gs.

Page 115
Chapter 4: Wage and salary taxation
Page 115
App
endi
x ta
ble
4.5.
1: O
ECD
-10
asse
ssab
le a
nd e
xem
pt in
com
e (c
ontin
ued)
C
ount
ry
Ass
essa
ble
inco
me
Exem
pt in
com
e N
ew Z
eala
nd
Res
iden
ts a
re s
ubje
ct to
inco
me
tax
on th
eir w
orld
wid
e in
com
e. A
n in
divi
dual
who
is a
n em
ploy
ee is
sub
ject
to ta
x on
all
mon
etar
y re
mun
erat
ion
paid
by
an e
mpl
oyer
. Mon
etar
y re
mun
erat
ion
mea
ns a
ny s
alar
y, w
age,
allo
wan
ce, b
onus
, gra
tuity
, ext
ra s
alar
y, c
ompe
nsat
ion
for l
oss
of e
mpl
oym
ent,
emol
umen
t of w
hate
ver k
ind,
or o
ther
ben
efit
in m
oney
, in
resp
ect o
f or
in re
latio
n to
the
empl
oym
ent o
r ser
vice
of t
he ta
xpay
er.
Gen
eral
ly, f
ringe
ben
efits
are
not
incl
uded
in a
sses
sabl
e in
com
e bu
t are
inst
ead
subj
ect t
o fri
nge
bene
fits
tax
at a
diff
eren
t rat
e.
Ran
ge o
f exe
mpt
inco
me
— in
clud
ing
reim
burs
ing
allo
wan
ces,
wor
ker’s
co
mpe
nsat
ion
unde
r the
Wor
ker’s
Com
pens
atio
n A
ct 1
956,
whe
ther
re
ceiv
ed a
s a
lum
p su
m o
r wee
kly
paym
ents
.
Spai
n In
com
e ta
x is
levi
ed o
n al
l wor
ldw
ide
inco
me.
Tax
paye
r inc
ome
is c
lass
ified
into
five
cat
egor
ies:
em
ploy
men
t inc
ome,
inve
stm
ent i
ncom
e, b
usin
ess
inco
me,
cap
ital g
ains
and
impu
ted
inco
me.
In
com
e is
taxa
ble
in th
e ye
ar o
f acc
rual
of t
he in
com
e, r
egar
dles
s of
the
time
of c
ash
rece
ipt.
If th
e in
com
e ha
s be
en g
ener
ated
dur
ing
mor
e th
an tw
o ye
ars,
onl
y 60
per
cen
t of i
t is
taxa
ble.
Seve
ral e
xem
pt fo
rms
of in
com
e, s
uch
as p
ensi
ons
paid
by
soci
al s
ecur
ity
to s
ever
ely
disa
bled
taxp
ayer
s.
Switz
erla
nd
Taxa
ble
on w
orld
wid
e in
com
e in
clud
ing:
ear
ned
inco
me,
em
ploy
men
t inc
ome,
inve
stm
ent
inco
me,
soc
ial s
ecur
ity p
aym
ents
and
inco
me
from
oth
er s
ourc
es. B
enef
its in
kin
d ar
e in
clud
ed in
em
ploy
men
t inc
ome
at th
eir m
arke
t val
ue. T
hese
incl
ude:
com
pany
car
s an
d ch
ild c
are
or
educ
atio
n ex
pens
es o
f chi
ldre
n pa
id b
y th
e em
ploy
er.
Seve
ral t
ypes
of e
xem
pt in
com
e, in
clud
ing
inte
rest
on
savi
ngs
acco
unts
(u
p to
cer
tain
lim
its),
inhe
ritan
ces,
gift
s an
d m
atrim
onia
l pro
perty
righ
ts.
Uni
ted
King
dom
To
tal i
ncom
e co
mpr
ises
inco
me
from
all
sour
ces.
Inco
me
rece
ived
by
an in
divi
dual
as
sala
ry a
nd
wag
es is
sub
ject
to in
com
e ta
x as
em
olum
ents
rece
ived
from
an
offic
e of
em
ploy
men
t. In
com
e al
so in
clud
es p
ensi
on in
com
e, d
ivid
ends
, int
eres
t, ro
yalti
es, r
enta
l inc
ome
and
capi
tal
gain
s.
A nu
mbe
r of s
peci
fic e
xem
pt in
com
e ca
tego
ries,
incl
udin
g in
tere
st o
n in
com
e ta
x re
paym
ents
.
Uni
ted
Stat
es
Uni
ted
Stat
es c
itize
ns a
nd re
side
nts
are
taxe
d on
all
inco
me
from
all
sour
ces.
Thi
s in
clud
es
wag
es, s
alar
y, b
usin
ess
inco
me,
and
inve
stm
ent i
ncom
e.
All i
ncom
e (o
ther
than
cap
ital g
ains
and
cer
tain
div
iden
ds) i
s co
mbi
ned
and
taxe
d at
the
sam
e ra
te.
Ther
e ar
e a
num
ber o
f cat
egor
ies
of e
xem
pt in
com
e, in
clud
ing
gifts
and
in
herit
ance
s, a
nd in
tere
st o
n bo
nds
issu
ed b
y U
S st
ates
and
m
unic
ipal
ities
for q
ualif
ied
publ
ic p
urpo
ses.
Sour
ce: v
ario
us, s
ee C
hapt
er 1
(1.4
.1).

Page 116
International comparison of Australia’s taxes
App
endi
x ta
ble
4.5.
2: O
ECD
-10
dedu
ctio
ns
Cou
ntry
Pe
rson
al a
llow
ance
s W
ork-
rela
ted
dedu
ctio
ns
Taxe
s/so
cial
sec
urity
O
ther
ded
uctio
ns
Aust
ralia
Wor
k-re
late
d de
duct
ions
are
dire
ctly
rela
ted
to g
aini
ng
or p
rodu
cing
an
empl
oyee
’s a
sses
sabl
e in
com
e.
O
ther
ded
uctio
ns in
clud
e gi
fts, f
ilm
indu
stry
ince
ntiv
es a
nd e
xpen
ses
such
as
the
cost
of m
anag
ing
tax
affa
irs.
Can
ada
Em
ploy
ees
only
ded
uct e
xpen
ses
spec
ifica
lly
legi
slat
ed (f
airly
lim
ited)
. Ex
ampl
es o
f spe
cific
ded
uctio
ns w
hich
are
all
subj
ect
to c
erta
in c
ondi
tions
— a
ccou
ntin
g an
d le
gal f
ees,
al
low
able
mot
or v
ehic
le e
xpen
ses,
trav
ellin
g ex
pens
es, p
arki
ng, s
uppl
ies,
sub
stitu
te’s
sal
ary,
offi
ce
rent
and
wor
k-in
-the-
hom
e ex
pens
es.
A ta
xpay
er m
ay d
educ
t ce
rtain
am
ount
s co
ntrib
uted
to a
n R
PP (a
re
gist
ered
pen
sion
pla
n)
Irela
nd
Tota
l exe
mpt
ion
appl
ies
from
inco
me
tax
for
inco
mes
up
to €
5,21
0 (d
oubl
e fo
r mar
ried
taxp
ayer
s).
Expe
nses
incu
rred
who
lly, e
xclu
sive
ly a
nd n
eces
saril
y in
the
perfo
rman
ce o
f the
dut
ies
of th
e of
fice
or
empl
oym
ent a
re d
educ
tible
. In
gene
ral,
dedu
ctio
ns a
re
allo
wed
for e
xpen
ditu
re o
n sp
ecia
l clo
thin
g w
orn
in th
e pe
rform
ance
of t
he ta
xpay
er’s
dut
ies,
exp
endi
ture
on
tool
s an
d ex
tra e
xpen
ditu
re in
curr
ed b
y co
mm
erci
al
trave
llers
.
Japa
n Ty
pes
of a
llow
ance
s av
aila
ble:
bas
ic,
spou
se, d
epen
dant
s.
Basi
c: ta
xpay
er m
ay d
educ
t ¥38
0,00
0 fro
m
inco
me.
Sp
ouse
: ¥38
0,00
0 (m
ust m
eet
requ
irem
ents
). D
epen
dant
: ¥38
0,00
0 pe
r dep
enda
nt (s
ame
requ
irem
ents
as
for t
he s
pous
e).
Spec
ific
dedu
ctio
ns th
at e
xcee
d th
e st
anda
rd
dedu
ctio
n fo
r em
ploy
men
t inc
ome
are
allo
wed
. Sp
ecifi
c de
duct
ions
incl
ude
trave
lling
expe
nses
.
D
educ
tions
for e
mpl
oym
ent i
ncom
e,
soci
al in
sura
nce
prem
ium
s an
d m
edic
al e
xpen
ses.
Net
herla
nds
Box
3 —
a b
asic
allo
wan
ce o
f €19
,522
(d
oubl
e fo
r mar
ried
coup
les)
. In
gen
eral
, in
com
putin
g ta
xabl
e in
com
e fro
m B
oxes
1
and
2, a
ll ex
pens
es in
curre
d w
hich
are
nec
essa
ry to
ob
tain
, col
lect
or m
aint
ain
inco
me
may
be
dedu
cted
. In
the
case
of B
ox 3
, exp
ense
s ar
e tre
ated
as
liabi
litie
s de
duct
ible
from
the
taxa
ble
base
. Cer
tain
ex
pens
es o
f a m
ixed
cha
ract
er a
re n
ot d
educ
tible
, or
are
dedu
ctib
le s
ubje
ct to
cer
tain
lim
its.

Page 117
Chapter 4: Wage and salary taxation
Page 117
App
endi
x ta
ble
4.5.
2: O
ECD
-10
dedu
ctio
ns (c
ontin
ued)
C
ount
ry
Pers
onal
allo
wan
ces
Wor
k re
late
d de
duct
ions
Ta
xes/
soci
al s
ecur
ity
Oth
er d
educ
tions
N
ew Z
eala
nd
Ex
pens
es in
curr
ed in
pro
duci
ng g
ross
inco
me
may
be
clai
med
as
a de
duct
ion
from
inco
me
limits
exp
endi
ture
th
at is
of a
cap
ital,
priv
ate,
exe
mpt
inco
me
and
non-
resi
dent
s’ fo
reig
n-so
urce
d in
com
e na
ture
, and
al
so li
mits
em
ploy
men
t exp
ense
s du
e to
with
hold
ing
taxe
s.
Spai
n Pe
rson
al a
llow
ance
of €
3,40
0 fo
r eac
h ta
xpay
er, d
oubl
e fo
r spo
uses
filin
g a
join
t tax
re
turn
. Fa
mily
allo
wan
ce d
epen
ds o
n th
e nu
mbe
r of
depe
ndan
ts, t
heir
age
and
inco
me.
S
ocia
l sec
urity
co
ntrib
utio
ns.
Trad
e un
ion
fees
, com
puls
ory
fees
pa
id to
pro
fess
iona
l ass
ocia
tions
and
le
gal e
xpen
ses
in c
onne
ctio
n w
ith
the
term
inat
ion
of e
mpl
oym
ent.
Switz
erla
nd
Taxp
ayer
may
ded
uct C
HF6
,100
in 2
006
for:
• ea
ch c
hild
und
er 1
8 ye
ars
of a
ge w
ho is
su
ppor
ted
by th
e ta
xpay
er;
• ea
ch c
hild
old
er th
an 1
8 ye
ars
who
is
stud
ying
or l
earn
ing
a tra
de a
nd w
ho is
su
ppor
ted
by th
e ta
xpay
er; a
nd
• ea
ch o
ther
per
son
inca
pabl
e of
gai
ning
em
ploy
men
t. Fo
r a m
arrie
d co
uple
, an
annu
al d
educ
tion
of C
HF7
,600
from
200
6 is
gra
nted
from
the
earn
ed in
com
e of
the
spou
se w
ith th
e lo
wer
in
com
e.
Nec
essa
ry w
ork-
rela
ted
expe
nses
are
ded
uctib
le.
Obl
igat
ory
soci
al s
ecur
ity
prem
ium
s ar
e fu
lly
dedu
ctib
le.
Prem
ium
s fo
r hea
lth in
sura
nce,
pr
ivat
e ac
cide
nt a
nd li
fe in
sura
nces
(a
s w
ell a
s in
tere
st re
ceiv
ed fr
om
savi
ngs
acco
unts
) are
ded
uctib
le u
p to
CH
F1,7
00 in
200
6 pe
r yea
r for
a
sing
le ta
xpay
er a
nd C
HF3
,300
in
2006
for a
mar
ried
coup
le, p
lus
700
for e
ach
min
or c
hild
or d
epen
dent
pe
rson
in n
eed.
If n
o pr
emiu
ms
are
paid
, sin
gle
taxp
ayer
s m
ay d
educ
t C
HF2
,550
in 2
006
and
mar
ried
taxp
ayer
s C
HF4
,950
in 2
006.
In
tere
st p
aid
on d
ebts
(lim
ited
to a
m
axim
um o
f CH
F50,
000
plus
in
vest
men
t inc
ome)
, alim
ony
and
child
sup
port
paym
ents
, exp
ense
s fo
r sic
knes
s (if
exc
eedi
ng 5
per
cen
t of
the
net i
ncom
e) a
nd d
onat
ions
(li
mite
d).

Page 118
International comparison of Australia’s taxes
App
endi
x ta
ble
4.5.
2: O
ECD
-10
dedu
ctio
ns (c
ontin
ued)
C
ount
ry
Pers
onal
allo
wan
ces
Wor
k re
late
d de
duct
ions
Ta
xes/
soci
al s
ecur
ity
Oth
er d
educ
tions
U
nite
d Ki
ngdo
m
Uni
ted
King
dom
per
sona
l allo
wan
ce
avai
labl
e to
all
taxp
ayer
s —
£4,
895
for
2005
/200
6.
Mos
t ded
uctio
ns in
the
Uni
ted
King
dom
mus
t be
incu
rred
who
lly, e
xclu
sive
ly a
nd n
eces
saril
y in
the
perfo
rman
ce o
f an
empl
oyee
’s d
utie
s, a
con
ditio
n th
at
prec
lude
s th
e de
duct
ion
of m
any
empl
oym
ent-r
elat
ed
expe
nses
.
Uni
ted
Stat
es
Fede
ral p
erso
nal e
xem
ptio
n of
US
$3,3
00 in
20
06. E
xem
ptio
n is
inde
xed
each
yea
r with
in
flatio
n.
Expe
nses
dire
ctly
rela
ted
to e
mpl
oym
ent i
ncom
e m
ay
be d
educ
ted.
St
ate
and
loca
l tax
es a
re
dedu
ctib
le w
here
a
taxp
ayer
cho
oses
to
item
ise
dedu
ctio
ns.
Taxp
ayer
s ca
n ta
ke a
sta
ndar
d de
duct
ion
(the
amou
nt d
epen
ds o
n th
e ta
xpay
er’s
filin
g st
atus
) or
item
ise
thei
r ded
uctio
ns.
Sour
ce: v
ario
us, s
ee C
hapt
er 1
(1.4
.1).
App
endi
x ta
ble
4.5.
3: O
ECD
-10
coun
trie
s —
tax
unit
Cou
ntry
Ta
x U
nit
Aust
ralia
In
divi
dual
Can
ada
Indi
vidu
al is
the
tax
unit,
but
join
t tax
atio
n is
als
o po
ssib
le.
Irela
nd
Gen
eral
ly b
ased
on
mar
ital s
tatu
s an
d nu
mbe
r of d
epen
dent
s, h
owev
er m
arrie
d ta
xpay
ers
can
choo
se s
epar
ate
treat
men
t.
Japa
n In
divi
dual
Net
herla
nds
Indi
vidu
al
New
Zea
land
In
divi
dual
Spai
n G
over
nmen
t reg
ulat
es w
heth
er a
per
son
is ta
xed
indi
vidu
ally
or j
oint
ly.
Switz
erla
nd
Mar
ried
coup
les
gene
rally
hav
e to
lodg
e ta
x re
turn
s to
geth
er a
nd th
e in
com
e is
then
agg
rega
ted.
Uni
ted
King
dom
In
divi
dual
Uni
ted
Stat
es
Tax
rate
s va
ry d
epen
ding
on
the
retu
rn s
tatu
s of
the
taxp
ayer
. The
re a
re fo
ur c
ateg
orie
s:
• m
arrie
d pe
rson
s fil
ing
join
t ret
urns
that
com
bine
all
thei
r inc
ome
and
dedu
ctio
ns;
• he
ads
of h
ouse
hold
s;
• un
mar
ried
indi
vidu
als,
that
is s
ingl
e ta
xpay
ers;
and
•
mar
ried
pers
ons
filin
g se
para
te re
turn
s, w
ith e
ach
spou
se re
porti
ng th
eir o
wn
inco
me
and
dedu
ctio
ns o
n a
sepa
rate
retu
rn.
Sour
ce: v
ario
us, s
ee C
hapt
er 1
(1.4
.1).
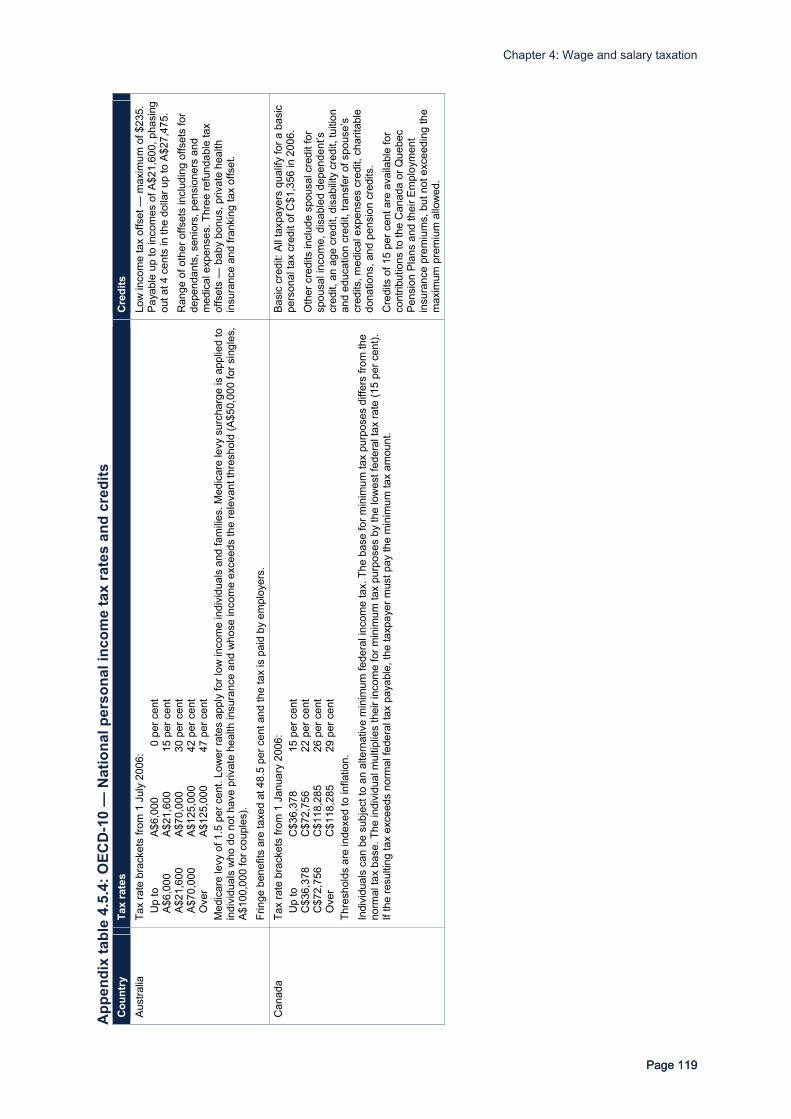
Page 119
Chapter 4: Wage and salary taxation
Page 119
App
endi
x ta
ble
4.5.
4: O
ECD
-10
— N
atio
nal p
erso
nal i
ncom
e ta
x ra
tes
and
cred
its
Cou
ntry
Ta
x ra
tes
Cre
dits
Au
stra
lia
Tax
rate
bra
cket
s fro
m 1
Jul
y 20
06:
Up
to
A$6,
000
0 pe
r cen
t A$
6,00
0 A$
21,6
00
15 p
er c
ent
A$21
,600
A$
70,0
00
30 p
er c
ent
A$70
,000
A$
125,
000
42 p
er c
ent
Ove
r A$
125,
000
47 p
er c
ent
Med
icar
e le
vy o
f 1.5
per
cen
t. Lo
wer
rate
s ap
ply
for l
ow in
com
e in
divi
dual
s an
d fa
milie
s. M
edic
are
levy
sur
char
ge is
app
lied
to
indi
vidu
als
who
do
not h
ave
priv
ate
heal
th in
sura
nce
and
who
se in
com
e ex
ceed
s th
e re
leva
nt th
resh
old
(A$5
0,00
0 fo
r sin
gles
, A$
100,
000
for c
oupl
es).
Frin
ge b
enef
its a
re ta
xed
at 4
8.5
per c
ent a
nd th
e ta
x is
pai
d by
em
ploy
ers.
Low
inco
me
tax
offs
et —
max
imum
of $
235.
Pa
yabl
e up
to in
com
es o
f A$2
1,60
0, p
hasi
ng
out a
t 4 c
ents
in th
e do
llar u
p to
A$2
7,47
5.
Ran
ge o
f oth
er o
ffset
s in
clud
ing
offs
ets
for
depe
ndan
ts, s
enio
rs, p
ensi
oner
s an
d m
edic
al e
xpen
ses.
Thr
ee re
fund
able
tax
offs
ets
— b
aby
bonu
s, p
rivat
e he
alth
in
sura
nce
and
frank
ing
tax
offs
et.
Can
ada
Tax
rate
bra
cket
s fro
m 1
Jan
uary
200
6:
Up
to
C$3
6,37
8 15
per
cen
t C
$36,
378
C$7
2,75
6 22
per
cen
t C
$72,
756
C$1
18,2
85
26 p
er c
ent
Ove
r C
$118
,285
29
per
cen
t Th
resh
olds
are
inde
xed
to in
flatio
n.
Indi
vidu
als
can
be s
ubje
ct to
an
alte
rnat
ive
min
imum
fede
ral i
ncom
e ta
x. T
he b
ase
for m
inim
um ta
x pu
rpos
es d
iffer
s fro
m th
e no
rmal
tax
base
. The
indi
vidu
al m
ultip
lies
thei
r inc
ome
for m
inim
um ta
x pu
rpos
es b
y th
e lo
wes
t fed
eral
tax
rate
(15
per c
ent).
If
the
resu
lting
tax
exce
eds
norm
al fe
dera
l tax
pay
able
, the
taxp
ayer
mus
t pay
the
min
imum
tax
amou
nt.
Basi
c cr
edit:
All
taxp
ayer
s qu
alify
for a
bas
ic
pers
onal
tax
cred
it of
C$1
,356
in 2
006.
O
ther
cre
dits
incl
ude
spou
sal c
redi
t for
sp
ousa
l inc
ome,
dis
able
d de
pend
ent’s
cr
edit,
an
age
cred
it, d
isab
ility
cred
it, tu
ition
an
d ed
ucat
ion
cred
it, tr
ansf
er o
f spo
use’
s cr
edits
, med
ical
exp
ense
s cr
edit,
cha
ritab
le
dona
tions
, and
pen
sion
cre
dits
. C
redi
ts o
f 15
per c
ent a
re a
vaila
ble
for
cont
ribut
ions
to th
e C
anad
a or
Que
bec
Pens
ion
Plan
s an
d th
eir E
mpl
oym
ent
insu
ranc
e pr
emiu
ms,
but
not
exc
eedi
ng th
e m
axim
um p
rem
ium
allo
wed
.

Page 120
International comparison of Australia’s taxes
App
endi
x ta
ble
4.5.
4: O
ECD
-10
— N
atio
nal p
erso
nal i
ncom
e ta
x ra
tes
and
cred
its (c
ontin
ued)
C
ount
ry
Tax
rate
s C
redi
ts
Irela
nd
Indi
vidu
als
can
dete
rmin
e, fo
r nat
iona
l inc
ome
tax
purp
oses
, if t
hey
are
taxe
d se
para
tely
or j
oint
ly. T
he s
tand
ard
and
high
er
rate
s of
inco
me
tax
are
20 a
nd 4
2 pe
r cen
t res
pect
ivel
y. T
ax a
t the
sta
ndar
d ra
te is
cha
rgea
ble
on in
com
e up
to th
e st
anda
rd
rate
cut
-off
poin
t. St
anda
rd c
ut-o
ff po
int S
ingl
e/w
idow
er
€32,
000
Mar
ried
coup
le (o
ne in
com
e)
up to
€41
,000
M
arrie
d co
uple
(tw
o in
com
es)
up to
a m
ax o
f €64
,000
(thr
esho
ld is
incr
ease
d by
the
amou
nt o
f the
low
est
inco
me
to a
max
imum
of €
23,0
00)
One
par
ent f
amily
€3
6,00
0 Ta
xpay
ers
with
inco
me
belo
w tw
ice
the
rele
vant
exe
mpt
ion
limit
(rele
vant
exe
mpt
ion
limit
is €
5,21
0 fo
r sin
gles
and
€10
,420
for
mar
ried
pers
ons)
pay
a lo
wer
rate
of t
ax k
now
n as
the
mar
gina
l rel
ief t
ax. T
he m
argi
nal r
elie
f lim
its th
e ta
x bu
rden
to
40 p
er c
ent.
A si
ngle
per
son
is e
ntitl
ed to
a c
redi
t of
€1,6
30 p
er y
ear.
The
mar
ried
pers
on’s
cre
dit
is €
3,26
0 pe
r yea
r. O
ther
cre
dits
are
ava
ilabl
e w
here
taxp
ayer
s ar
e el
igib
le, s
uch
as th
e PA
YE c
redi
t, w
idow
’s c
redi
t, de
pend
ent r
elat
ive’
s cr
edit,
an
d on
e pa
rent
fam
ily c
redi
t.
Japa
n Th
e fo
rmul
a is
inco
me
A-B-
C, w
here
A is
the
taxa
ble
inco
me
by ta
x ra
te, B
is s
tand
ard
dedu
ctio
n, a
nd C
is p
ropo
rtion
al ta
x re
duct
ion.
Tax
rate
bra
cket
s:
Ta
xabl
e In
com
e
Tax
Rat
e (p
er c
ent)
D
educ
tible
am
ount
of
eac
h br
acke
t O
ver
Not
Ove
r
A
B 0
¥3.3
M
10
0 ¥3
.3M
¥9
M
20
¥ 0.3
3M
¥9M
¥1
8M
30
¥ 1.2
3M
¥18M
37
¥ 2.4
9M
Prop
ortio
nal t
ax re
duct
ion
(C):
10 p
er c
ent o
f A-B
(cei
ling
¥125
,000
). Ta
x ra
te c
hang
es h
ave
been
pro
pose
d to
take
effe
ct fr
om
1 Ja
nuar
y 20
07 th
at a
re y
et to
be
legi
slat
ed.
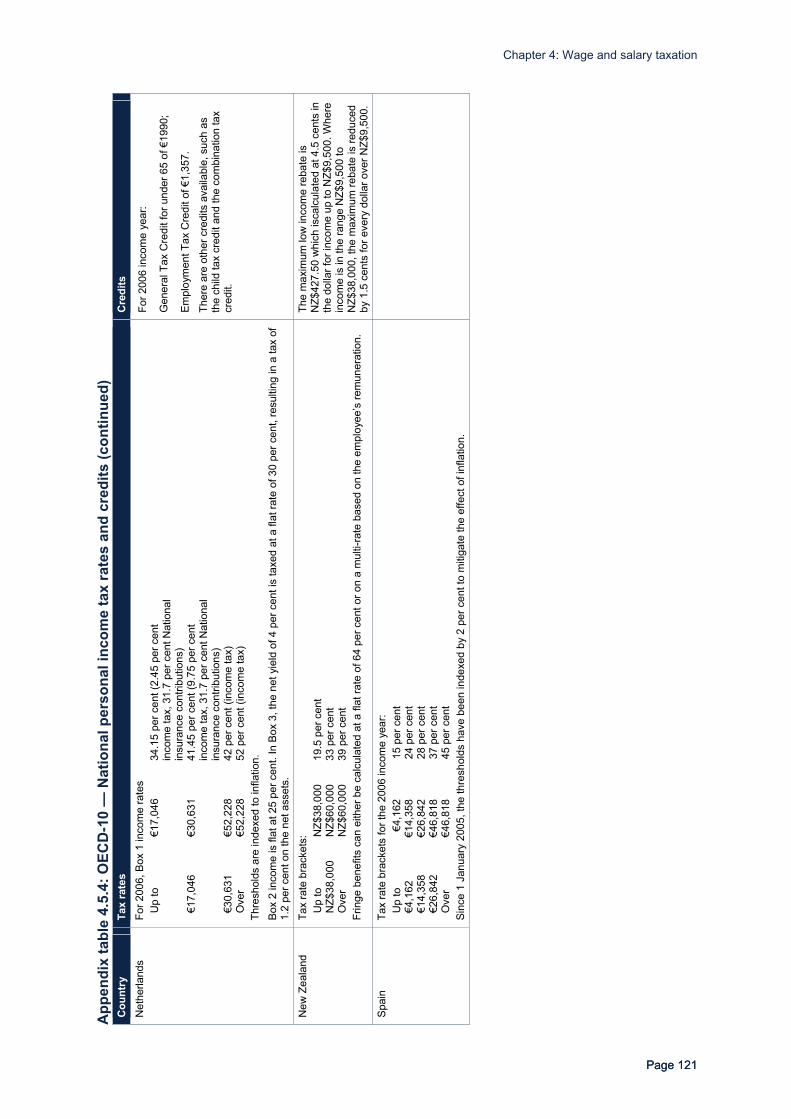
Page 121
Chapter 4: Wage and salary taxation
Page 121
App
endi
x ta
ble
4.5.
4: O
ECD
-10
— N
atio
nal p
erso
nal i
ncom
e ta
x ra
tes
and
cred
its (c
ontin
ued)
C
ount
ry
Tax
rate
s C
redi
ts
Net
herla
nds
For 2
006,
Box
1 in
com
e ra
tes
Up
to
€17,
046
34.1
5 pe
r cen
t (2.
45 p
er c
ent
inco
me
tax,
31.
7 pe
r cen
t Nat
iona
l in
sura
nce
cont
ribut
ions
) €1
7,04
6 €3
0,63
1 41
.45
per c
ent (
9.75
per
cen
t in
com
e ta
x, 3
1.7
per c
ent N
atio
nal
insu
ranc
e co
ntrib
utio
ns)
€30,
631
€52,
228
42 p
er c
ent (
inco
me
tax)
O
ver
€52,
228
52 p
er c
ent (
inco
me
tax)
Th
resh
olds
are
inde
xed
to in
flatio
n.
Box
2 in
com
e is
flat
at 2
5 pe
r cen
t. In
Box
3, t
he n
et y
ield
of 4
per
cen
t is
taxe
d at
a fl
at ra
te o
f 30
per c
ent,
resu
lting
in a
tax
of
1.2
per c
ent o
n th
e ne
t ass
ets.
For 2
006
inco
me
year
:
Gen
eral
Tax
Cre
dit f
or u
nder
65
of €
1990
;
Empl
oym
ent T
ax C
redi
t of €
1,35
7.
Ther
e ar
e ot
her c
redi
ts a
vaila
ble,
suc
h as
th
e ch
ild ta
x cr
edit
and
the
com
bina
tion
tax
cred
it.
New
Zea
land
Ta
x ra
te b
rack
ets:
U
p to
N
Z$38
,000
19
.5 p
er c
ent
NZ$
38,0
00
NZ$
60,0
00
33 p
er c
ent
Ove
r N
Z$60
,000
39
per
cen
t Fr
inge
ben
efits
can
eith
er b
e ca
lcul
ated
at a
flat
rate
of 6
4 pe
r cen
t or o
n a
mul
ti-ra
te b
ased
on
the
empl
oyee
’s re
mun
erat
ion.
The
max
imum
low
inco
me
reba
te is
N
Z$42
7.50
whi
ch is
calc
ulat
ed a
t 4.5
cen
ts in
th
e do
llar f
or in
com
e up
to N
Z$9,
500.
Whe
re
inco
me
is in
the
rang
e N
Z$9,
500
to
NZ$
38,0
00, t
he m
axim
um re
bate
is re
duce
d by
1.5
cen
ts fo
r eve
ry d
olla
r ove
r NZ$
9,50
0.
Spai
n Ta
x ra
te b
rack
ets
for t
he 2
006
inco
me
year
: U
p to
€4
,162
15 p
er c
ent
€4,1
62
€14,
358
24
per
cen
t €1
4,35
8 €2
6,84
2
28 p
er c
ent
€26,
842
€46,
818
37
per
cen
t O
ver
€46,
818
45
per
cen
t Si
nce
1 Ja
nuar
y 20
05, t
he th
resh
olds
hav
e be
en in
dexe
d by
2 p
er c
ent t
o m
itiga
te th
e ef
fect
of i
nfla
tion.

Page 122
International comparison of Australia’s taxes
App
endi
x ta
ble
4.5.
4: O
ECD
-10
— N
atio
nal p
erso
nal i
ncom
e ta
x ra
tes
and
cred
its (c
ontin
ued)
C
ount
ry
Tax
rate
s C
redi
ts
Switz
erla
nd
The
tota
l tax
bur
den
is li
mite
d to
11.
5 pe
r cen
t. Ta
x ra
te b
rack
ets
in 2
006
for m
arrie
d co
uple
s liv
ing
toge
ther
, and
to w
idow
ed, s
epar
ated
, div
orce
d or
sin
gle
pers
ons
livin
g w
ith c
hild
ren
who
are
min
or o
r stu
dyin
g at
thei
r exp
ense
:
Taxa
ble
Inco
me
Tax
on lo
wer
am
ount
R
ate
on
exce
ss
0 C
HF2
9,10
0 0
C
HF2
9,20
0 C
HF4
7,80
0 C
HF2
5 1
CH
F47,
900
CH
F54,
800
CH
F212
2
CH
F54,
900
CH
F70,
800
CH
F352
3
CH
F70,
900
CH
F85,
000
CH
F832
4
CH
F85,
100
CH
F97,
300
CH
F1,4
00
5 C
HF9
7,40
0 C
HF1
08,0
00
CH
F2,0
15
6 C
HF1
08,1
00
CH
F116
,900
C
HF2
,657
7
CH
F117
,000
C
HF1
23,9
00
CH
F3,2
80
8 C
HF1
24,0
00
CH
F129
,200
C
HF3
,840
9
CH
F129
,300
C
HF1
32,8
00
CH
F4,3
17
10
CH
F132
,900
C
HF1
34,6
00
CH
F4,6
77.9
9 11
C
HF1
34,7
00
CH
F136
,400
C
HF4
,875
12
C
HF1
36,5
00
CH
F843
,500
C
HF5
,091
13
C
HF8
43,6
00
C
HF9
7,01
4 11
.5
If ta
xabl
e in
com
e ex
ceed
s C
HF8
43,6
00, a
flat
rate
of 1
1.5
per c
ent a
pplie
d to
the
who
le in
com
e fo
r bot
h ty
pes
of ta
xpay
ers.
Sw
itzer
land
is re
quire
d to
mak
e a
thre
shol
d ad
just
men
t afte
r the
cum
ulat
ive
infla
tion
rate
has
incr
ease
d by
at l
east
7 p
er c
ent
sinc
e th
e la
st a
djus
tmen
t.
Uni
ted
King
dom
Ta
x ra
te b
rack
ets
inco
me
and
capi
tal g
ains
U
p to
₤2
,090
10
per
cen
t ₤2
,090
₤3
2,40
0 22
per
cen
t O
ver
₤32,
400
40 p
er c
ent
Thre
shol
ds a
re in
dexe
d in
line
with
infla
tion
unle
ss th
e Pa
rliam
ent s
peci
fies
this
is n
ot to
occ
ur
Low
inco
me
fam
ilies
may
be
entit
led
to a
w
orki
ng ta
x cr
edit
or c
hild
tax
cred
it.

Page 123
Chapter 4: Wage and salary taxation
Page 123
App
endi
x ta
ble
4.5.
4: O
ECD
-10
— N
atio
nal p
erso
nal i
ncom
e ta
x ra
tes
and
cred
its (c
ontin
ued)
C
ount
ry
Tax
rate
s C
redi
ts
Uni
ted
Stat
es
The
tax
thre
shol
ds v
ary
depe
ndin
g on
the
filin
g st
atus
of a
taxp
ayer
. The
re a
re fo
ur c
ateg
orie
s of
taxp
ayer
: mar
ried
pers
ons
filin
g jo
intly
, hea
ds o
f hou
seho
lds
and
unm
arrie
d an
d m
arrie
d pe
rson
s fil
ing
join
tly. T
he ra
tes
that
app
ly a
re th
e sa
me.
Fo
r unm
arrie
d (s
ingl
e ta
xpay
ers)
the
tax
rate
bra
cket
s fo
r 200
6 ar
e as
follo
ws:
U
p to
U
S$7,
550
10 p
er c
ent
US$
7,55
0 U
S$30
,650
15
per
cen
t U
S$30
,650
U
S$74
,200
25
per
cen
t U
S$74
,200
U
S$15
4,80
0 28
per
cen
t U
S$15
4,80
0 U
S$33
6,55
0 33
per
cen
t O
ver
US$
336,
550
35 p
er c
ent
Indi
vidu
als
are
subj
ect t
o al
tern
ativ
e m
inim
um ta
x if
the
alte
rnat
ive
min
imum
tax
exce
eds
thei
r reg
ular
tax.
The
bas
e fo
r the
al
tern
ativ
e m
inim
um ta
x is
slig
htly
diff
eren
t. To
cal
cula
te th
e al
tern
ativ
e m
inim
um ta
x th
e ta
xpay
er d
eter
min
es th
e al
tern
ativ
e m
inim
um ta
xabl
e in
com
e (A
MTI
) and
sub
tract
s th
e AM
TI e
xem
ptio
n am
ount
. Th
resh
olds
are
inde
xed
annu
ally
for i
nfla
tion.
Low
inco
me
wor
kers
with
dep
enda
nts
are
entit
led
to a
refu
ndab
le e
arne
d in
com
e cr
edit.
Sour
ce: v
ario
us, s
ee C
hapt
er 1
(1.4
.1).

Page 124
International comparison of Australia’s taxes
App
endi
x ta
ble
4.5.
5: O
ECD
-10
sub-
natio
nal p
erso
nal i
ncom
e ta
xes
Cou
ntry
B
ase
Rat
es
Cre
dits
Au
stra
lia
No
sub-
natio
nal p
erso
nal i
ncom
e ta
xes.
Can
ada
For a
ll pr
ovin
ces,
exc
ept Q
uebe
c, th
e fe
dera
l gov
ernm
ent
colle
cts
both
indi
vidu
al a
nd c
orpo
rate
tax
on b
ehal
f of t
he
prov
ince
s. In
con
side
ratio
n, th
e pr
ovin
ces
use
the
fede
ral
inco
me
tax
base
. Pro
vinc
es a
lso
impo
se p
rovi
ncia
l sur
taxe
s on
pro
vinc
ial t
ax o
r inc
ome
abov
e sp
ecifi
ed a
mou
nts.
Th
e O
EC
D u
ses
the
Prov
ince
of O
ntar
io a
s th
e re
pres
enta
tive
sub-
cent
ral g
over
nmen
t, as
this
is th
e m
ost
popu
lous
pro
vinc
e.
The
top
rate
var
ies
acro
ss th
e pr
ovin
ces
from
24
per c
ent i
n Q
uebe
c to
10
per
cen
t in
Albe
rta.
Ont
ario
’s b
asic
tax
rate
bra
cket
s fro
m 1
Jan
uary
200
6 ar
e:
Up
to
C$3
4,75
8 6.
05 p
er c
ent
C$3
4,75
8 C
$69,
517
9.15
per
cen
t O
ver
C$6
9,51
7 11
.16
per c
ent
The
thre
shol
ds a
re in
dexe
d to
infla
tion.
O
ntar
io a
lso
levi
es a
sur
tax
with
rate
s of
20
per c
ent a
nd 3
6 pe
r cen
t de
pend
ing
on th
e ta
xpay
er’s
inco
me.
Ont
ario
has
a b
asic
inco
me
tax
cred
it of
C$8
,377
. C
redi
ts fo
r the
Can
ada
Pens
ion
Plan
and
for
Empl
oym
ent I
nsur
ance
pr
emiu
ms.
Irela
nd
No
sub-
natio
nal p
erso
nal i
ncom
e ta
xes.
Japa
n Su
b-na
tiona
l inc
ome
taxe
s in
Jap
an c
onsi
st o
f a p
refe
ctur
al
inha
bita
nts’
tax
levi
ed b
y pr
efec
ture
s an
d a
mun
icip
al
inha
bita
nts’
tax
levi
ed b
y ci
ties,
tow
ns a
nd v
illage
s.
Stan
dard
per
cap
ita ta
x ra
te o
f pre
fect
ural
inha
bita
nts’
is
¥1,0
00.
Stan
dard
per
cap
ita ta
x ra
te o
f Mun
icip
al in
habi
tant
s’ is
¥2
,000
to ¥
3,00
0 de
pend
ing
on th
e si
ze o
f the
mun
icip
ality
. Ta
x lia
bilit
y is
obt
aine
d by
mul
tiply
ing
the
taxa
ble
inco
me
by
tax
rate
(A) a
nd d
educ
ting
the
amou
nt (B
). In
add
ition
, Pr
opor
tiona
l Red
uctio
n (C
).
Prop
ortio
nal t
ax re
duct
ion
(C):
7.5
per c
ent o
f cal
cula
ted
amou
nt, t
hat i
s A-
B (c
eilin
g ¥2
0,00
0).
Ta
xabl
e In
com
e
Tax
Rat
e (p
er c
ent)
Ded
uctib
le a
mou
nt
of e
ach
brac
ket
Ove
r N
ot O
ver
A
B Pr
efec
tual
Inha
bita
nts’
tax
0 ¥7
M
2
0 ¥7
M
3 ¥0
.07M
M
unic
ipal
Inha
bita
nts’
tax
0 ¥2
M
3
0 ¥2
M
¥7M
8 ¥0
.1M
¥7
M
10
¥0.2
4M
Tax
rate
cha
nges
are
pro
pose
d fo
r 1 J
anua
ry 2
007.
Com
bine
d fla
t rat
e of
10
per
cen
t.
Net
herla
nds
No
sub-
natio
nal p
erso
nal i
ncom
e ta
xes.
New
Zea
land
N
o su
b-na
tiona
l per
sona
l inc
ome
taxe
s.
Spai
n N
o su
b-na
tiona
l per
sona
l inc
ome
taxe
s, h
owev
er, w
e ha
ve
rece
ived
con
flict
ing
info
rmat
ion
on th
is is
sue.

Page 125
Chapter 4: Wage and salary taxation
Page 125
App
endi
x ta
ble
4.5.
5: O
ECD
-10
sub-
natio
nal p
erso
nal i
ncom
e ta
xes
(con
tinue
d)
Cou
ntry
B
ase
Rat
es
Cre
dits
Sw
itzer
land
Th
ere
are
no ru
les
on w
heth
er w
orld
wid
e or
onl
y do
mes
tic
inco
me
is ta
xabl
e. T
axab
le in
com
e in
clud
es a
ll re
curre
nt a
nd
non-
recu
rrent
inco
me
from
dep
ende
nt a
nd in
depe
nden
t ac
tiviti
es a
nd fr
om m
ovab
le a
nd im
mov
able
pro
perty
. It a
lso
incl
udes
pen
sion
s an
d so
cial
sec
urity
ben
efits
. Va
rious
form
s of
inco
me
are
exem
pt, i
nclu
ding
dam
ages
for
men
tal o
r phy
sica
l pai
n su
ffere
d.
The
OE
CD
use
s Zu
rich
as th
e ex
ampl
e ca
nton
al.
For a
ll ca
nton
s, a
ll ex
pens
es th
at a
re n
eces
sary
in o
rder
to
real
ise
taxa
ble
inco
me
are
dedu
ctib
le. S
ocia
l sec
urity
co
ntrib
utio
ns a
nd c
ontri
butio
ns to
app
rove
d sa
ving
s pl
ans,
pr
emiu
ms
for h
ealth
, priv
ate
acci
dent
and
life
insu
ranc
es u
p to
cer
tain
lim
its a
re a
ll de
duct
ible
. The
sta
ndar
d de
duct
ion
is
also
ava
ilabl
e w
ith h
ighe
r am
ount
s fo
r mar
ried
coup
les
and
amou
nts
vary
from
can
ton
to c
anto
n.
The
cant
ons
may
set
thei
r ow
n ta
x ra
tes.
The
can
tona
l law
s m
ust p
rovi
de
tax
redu
ctio
ns fo
r uns
epar
ated
spo
uses
, as
wel
l as
for w
idow
ed, s
epar
ated
, di
vorc
ed a
nd s
ingl
e ta
xpay
ers
mai
ntai
ning
chi
ldre
n or
nee
dy p
erso
ns.
Zuric
h ha
s 13
diff
eren
t tax
bra
cket
s at
a m
axim
um ra
te o
f 13
per c
ent.
Mun
icip
al in
com
e ta
xes
are
levi
ed in
the
form
of a
sur
char
ge o
n th
e ca
nton
al ta
x. T
he s
urch
arge
is e
qual
to th
e ba
sic
cant
onal
tax,
mul
tiplie
d by
a
mun
icip
al c
oeffi
cien
t. Th
e co
effic
ient
for t
he c
apita
l city
Zur
ich
in th
e ca
nton
of
Zur
ich
is 1
.22
(for 2
005)
.
Uni
ted
King
dom
N
o su
b-na
tiona
l per
sona
l inc
ome
taxe
s.
Uni
ted
Stat
es
Inco
me
tax
is im
pose
d by
mos
t sta
tes
(som
e us
ing
a pr
ogre
ssiv
e) a
nd b
y so
me
mun
icip
aliti
es b
ut it
is d
educ
tible
fo
r fed
eral
tax
purp
oses
for t
axpa
yers
that
item
ise
dedu
ctio
ns.
Som
e st
ates
als
o le
vy a
sal
es ta
x. P
erso
nal a
llow
ance
s an
d st
anda
rd d
educ
tions
var
y fro
m s
tate
to s
tate
.
Stat
e an
d lo
cal i
ncom
e ta
x ra
tes
vary
from
9.5
per
cen
t in
Verm
ont t
o 3
per c
ent i
n Ill
inoi
s.
New
Yor
k im
pose
s bo
th s
tate
and
city
inco
me
taxe
s. C
alifo
rnia
impo
ses
stat
e in
com
e ta
x. T
exas
doe
s no
t lev
y st
ate
inco
me
tax.
M
ichi
gan
has
a fla
t inc
ome
tax
rate
of 3
.90
per c
ent.
The
aver
age
wor
ker i
n th
e ca
meo
ana
lysi
s of
the
tax
wed
ge a
nd n
et p
erso
nal a
vera
ge ta
x ra
te is
as
sum
ed to
live
in D
etro
it, M
ichi
gan.
M
ost s
tate
s do
not
inde
x th
eir t
hres
hold
s.
Cre
dits
var
y fro
m s
tate
to
stat
e.
Sour
ce: v
ario
us, s
ee C
hapt
er 1
(1.4
.1).

International comparison of Australia’s taxes
Page 126
Appendix table 4.5.6: OECD-10 payroll taxes Country Payroll taxes Australia States levy payroll taxes. The OECD uses NSW as the indicative state. In NSW, payroll tax
applies at a 6 per cent flat rate above the A$600,000 firm wages threshold.
Canada n/a
Ireland n/a
Japan n/a
Netherlands n/a
New Zealand n/a
Spain n/a
Switzerland n/a
United Kingdom n/a
United States n/a Source: various, see Chapter 1 (1.4.1). Note: payroll taxes that are earmarked for social security expenditure are included in employer social security contributions (refer to Table 4.7).

Chapter 4: Wage and salary taxation
Page 127
App
endi
x ta
ble
4.5.
7: O
ECD
-10
soci
al s
ecur
ity c
ontr
ibut
ions
(SSC
) C
ount
ry
Empl
oyee
SSC
Em
ploy
er S
SC
Self-
empl
oyed
SSC
Au
stra
lia
No
soci
al s
ecur
ity c
ontri
butio
ns le
vied
.
Can
ada
Empl
oym
ent i
nsur
ance
— C
$729
per
wee
k.
Can
ada
Pens
ion
Plan
(CPP
) — 4
.95
per c
ent o
f inc
ome
up to
a m
axim
um
of C
$1,9
10.7
0 fo
r inc
ome
abov
e C
$3,5
00.
CPP
— 4
.95
per c
ent f
or e
arni
ngs
abov
e C
$3,5
00 u
p to
a
max
imum
of C
$1,9
10.7
0.
Pay
roll
taxe
s le
vied
in s
ome
juris
dict
ions
. Ont
ario
levy
1.
95 p
er c
ent t
o Em
ploy
er H
ealth
Tax
if p
ayro
ll ex
ceed
s C
$400
,000
. Em
ploy
ers
also
con
tribu
te to
pro
vinc
ial w
orke
rs’
com
pens
atio
n pl
an. R
ates
var
y fo
r exa
mpl
e in
Ont
ario
em
ploy
ers
in C
to K
indu
stry
pay
an
aver
age
of
2.61
per
cen
t.
The
self
empl
oyed
con
tribu
te
to C
PP a
t rat
e of
9.9
per
cen
t.
Irela
nd
Soci
al in
sura
nce
is le
vied
on
all e
arne
d in
com
e by
em
ploy
ed a
nd
self-
empl
oyed
per
sons
. Em
ploy
ees
pay
4 pe
r cen
t soc
ial i
nsur
ance
be
twee
n ce
rtain
inco
mes
bet
wee
n €6
,604
and
€46
,600
. A
heal
th le
vy is
cha
rged
at 2
per
cen
t on
all i
ncom
e.
Empl
oyer
con
tribu
tions
are
pay
able
as
a pe
rcen
tage
of
gros
s em
ploy
ee e
arni
ngs
less
allo
wab
le s
uper
annu
atio
n co
ntrib
utio
ns d
iffer
ent c
ateg
orie
s. T
he to
tal r
ate
is
10.7
5 pe
r cen
t on
all e
mpl
oym
ent i
ncom
e (n
o ce
iling)
.
Self-
empl
oyed
per
sons
pay
3
per c
ent s
ocia
l ins
uran
ce
on a
ll in
com
e. A
hea
lth le
vy
cont
ribut
ion
of 2
per
cen
t is
also
pay
able
on
all i
ncom
e by
all
pers
ons
who
se a
nnua
l in
com
e is
at l
east
€18
,512
.
Japa
n Pe
nsio
n: 7
.144
per
cen
t of t
otal
rem
uner
atio
n, u
p to
the
insu
rabl
e ce
iling
of
¥620
,000
mon
thly
and
¥1,
500,
000
for a
one
off
paym
ent.
The
prem
ium
rate
fo
r the
em
ploy
ee’s
pen
sion
is ra
ised
by
0.35
4 pe
r cen
t eve
ry y
ear f
rom
O
ctob
er 2
004,
reac
hing
a m
axim
um o
f 18.
30 p
er c
ent i
n 20
17 o
nwar
d.
Sick
ness
: 4.1
per
cen
t of t
otal
rem
uner
atio
n, u
p to
insu
rabl
e ce
iling
of
¥980
,000
(mon
thly
). U
nem
ploy
men
t: 0.
8 pe
r cen
t of g
ross
rem
uner
atio
n.
Wor
kmen
’s a
ccid
ent c
ompe
nsat
ion
insu
ranc
e: 0
.45
per c
ent o
f gro
ss y
early
re
mun
erat
ion.
Pu
blic
nur
sing
car
e: 0
.615
per
cen
t of m
onth
ly re
mun
erat
ion
and
bonu
s fo
r em
ploy
er a
nd e
mpl
oyee
age
d ov
er 4
0 up
to a
max
imum
of ¥
6,02
7 (n
ote
the
prem
ium
rate
of 0
.615
per
cen
t app
lied
from
1 M
ay 2
006)
.
Pens
ion:
7.1
44 p
er c
ent o
f tot
al re
mun
erat
ion,
up
to th
e in
sura
ble
ceili
ng o
f ¥62
0,00
0 (m
onth
ly) a
nd ¥
1,50
0,00
0 fo
r a
one
off p
aym
ent.
Sick
ness
: 4.1
per
cen
t of t
otal
rem
uner
atio
n, u
p to
insu
rabl
e ce
iling
of ¥
980,
000
(mon
thly
). U
nem
ploy
men
t: 1.
15 p
er c
ent o
f gro
ss re
mun
erat
ion.
W
orkm
en’s
acc
iden
t com
pens
atio
n in
sura
nce:
0.4
5 pe
r cen
t of
gro
ss y
early
rem
uner
atio
n.
Publ
ic n
ursi
ng c
are:
0.6
15 p
er c
ent o
f mon
thly
rem
uner
atio
n an
d bo
nus
for e
mpl
oyer
and
em
ploy
ee a
ged
over
40
up to
a
max
imum
of ¥
6,02
7 (n
ote
the
prem
ium
rate
of 0
.615
per
cen
t ap
plie
d fro
m 1
May
200
6).
Nat
iona
l pen
sion
is ¥
13,8
60
per m
onth
. The
mon
thly
pr
emiu
m is
rais
ed b
y ¥2
80
ever
y ye
ar fr
om A
pril
2005
an
d w
ill be
fixe
d at
¥16
,900
in
201
7 an
d on
war
d.

Page 128
International comparison of Australia’s taxes
App
endi
x ta
ble
4.5.
7: O
ECD
-10
soci
al s
ecur
ity c
ontr
ibut
ions
(SSC
) (co
ntin
ued)
C
ount
ry
Empl
oyee
SSC
Em
ploy
er S
SC
Self-
empl
oyed
SSC
N
ethe
rland
s Ta
x an
d na
tiona
l soc
ial s
ecur
ity c
ontri
butio
ns a
re le
vied
as
an a
ggre
gate
am
ount
. C
ontri
butio
ns a
re:
• O
ld A
ge P
ensi
on: 1
7.9
per c
ent o
f firs
t and
sec
ond
tax
brac
kets
(Box
1).
Indi
vidu
als
65 a
nd o
ver a
re e
xem
pt.
• W
idow
s an
d or
phan
s pe
nsio
n: 1
.25
per c
ent o
f firs
t and
sec
ond
tax
brac
kets
(Box
1).
• Ex
cept
iona
l Med
ical
exp
ense
s an
d di
sabi
lity:
12.
55 p
er c
ent o
f firs
t and
se
cond
tax
brac
kets
(Box
1).
• Al
so le
vies
une
mpl
oym
ent a
nd p
ublic
insu
ranc
e fo
r med
ical
car
e so
cial
se
curit
y co
ntrib
utio
ns.
Net
herla
nds
levi
es e
mpl
oyer
soc
ial s
ecur
ity c
ontri
butio
ns
for t
he g
ener
al u
nem
ploy
men
t fun
d, u
nem
ploy
men
t fun
d fo
r in
dust
rial i
nsur
ance
ass
ocia
tions
, inv
alid
ity, p
ublic
insu
ranc
e fo
r med
ical
car
e.
New
Zea
land
N
o so
cial
sec
urity
con
tribu
tions
are
levi
ed.
Spai
n G
ener
al c
ontri
butio
n sy
stem
has
a m
inim
um a
nd m
axim
um c
ontri
butio
n ba
se
that
is a
djus
ted
annu
ally
. For
200
6 th
e m
axim
um m
onth
ly b
ase
is €
2,89
7.70
. Em
ploy
ed p
erso
ns
Gen
eral
risk
s —
4.7
per
cen
t U
nem
ploy
men
t ins
uran
ce —
1.6
per
cen
t Pr
ofes
sion
al tr
aini
ng —
0.1
per
cen
t
Gen
eral
risk
s —
23.
6 pe
r cen
t U
nem
ploy
men
t — 6
.0 p
er c
ent
Wag
es fu
nd —
0.4
per
cen
t Pr
ofes
sion
al tr
aini
ng —
0.6
per
cen
t Em
ploy
ers
mus
t pay
a w
ork
acci
dent
insu
ranc
e w
hich
va
ries
depe
ndin
g on
job
type
, for
exa
mpl
e 0.
99 p
er c
ent
for o
ffice
wor
k, 1
3.5
per c
ent f
or a
irlin
es.
The
self-
empl
oyed
taxp
ayer
s’
effe
ctiv
e ra
te is
29.
8 pe
r cen
t.
Switz
erla
nd
The
empl
oyer
with
hold
s em
ploy
ee’s
con
tribu
tion.
O
ld a
ge a
nd s
urvi
vor i
nsur
ance
— 4
.20
per c
ent
Dis
abili
ty in
sura
nce
— 0
.7 p
er c
ent
Mili
tary
com
pens
atio
n —
0.1
5 pe
r cen
t U
nem
ploy
men
t ins
uran
ce —
1 p
er c
ent h
owev
er, n
o co
ntrib
utio
n is
levi
ed
on in
com
e in
exc
ess
of C
HF1
06,8
00.
Hea
lth in
sura
nce
is m
anda
tory
; how
ever
, it i
s th
e re
spon
sibi
lity
of th
e in
divi
dual
. N
on-a
ccid
ent i
nsur
ance
pre
miu
ms
are
paid
by
the
empl
oyee
s an
d va
ry
betw
een
1 pe
r cen
t and
4 p
er c
ent.
Empl
oyee
s w
ith a
nnua
l wag
es a
bove
CH
F19,
350
are
also
sub
ject
to
a co
mpa
ny’s
pen
sion
sch
eme.
Con
tribu
tions
and
insu
red
sala
ry v
ary
depe
ndin
g on
the
pens
ion
sche
me.
Old
age
and
sur
vivo
r ins
uran
ce —
4.2
0 pe
r cen
t D
isab
ility
insu
ranc
e —
0.7
per
cen
t M
ilita
ry c
ompe
nsat
ion
— 0
.15
per c
ent
Une
mpl
oym
ent i
nsur
ance
— 1
per
cen
t how
ever
, no
cont
ribut
ion
is le
vied
on
inco
me
in e
xces
s of
CH
F 10
6,80
0.
Old
age
and
sur
vivo
r in
sura
nce
— 7
.8 p
er c
ent
Dis
abili
ty in
sura
nce
—
1.4
per c
ent
Mili
tary
com
pens
atio
n —
0.
3 pe
r cen
t Lo
wer
rate
s ap
ply
for
self-
empl
oyed
per
sons
with
gr
oss
inco
me
betw
een
CH
F7,8
00 a
nd 5
0,70
0.

Page 129
Chapter 4: Wage and salary taxation
Page 129
App
endi
x ta
ble
4.5.
7: O
ECD
-10
soci
al s
ecur
ity c
ontr
ibut
ions
(SSC
) (co
ntin
ued)
C
ount
ry
Empl
oyee
SSC
Em
ploy
er S
SC
Self-
empl
oyed
SSC
U
nite
d Ki
ngdo
m
Nat
iona
l Ins
uran
ce c
ontri
butio
ns —
11
per c
ent f
or e
arni
ngs
betw
een
£94
and
£630
and
1 p
er c
ent o
n al
l ear
ning
s ab
ove
£630
. Red
uctio
ns to
9.
4 pe
r cen
t ava
ilabl
e if
the
empl
oyee
s pa
rtici
pate
s in
an
empl
oyer
-spo
nsor
ed p
ensi
on s
chem
e or
a p
erso
nal p
ensi
on p
lan,
whi
ch
cont
ract
the
empl
oyee
out
of t
he S
tate
Ear
ning
s R
elat
ed P
ensi
on S
chem
e (S
ERPS
).
Empl
oyer
s’ c
ontri
butio
ns o
f 12.
8 pe
r cen
t for
ear
ning
s ab
ove
£94
per w
eek.
For
em
ploy
ees
who
are
con
tract
ed o
ut th
ere
is a
reba
te o
f 3.5
per
cen
t on
earn
ings
bet
wee
n £8
2 an
d £6
30 p
er w
eek.
Self-
empl
oyed
per
sons
co
ntrib
ute
at fl
at ra
te o
f £2
.10
per w
eek.
The
re is
a
smal
l ear
ning
s ex
empt
ion
limit
of £
4,34
5.
Uni
ted
Stat
es
Two
soci
al s
ecur
ity ta
xes
are
impo
sed
by th
e na
tiona
l gov
ernm
ent:
the
old
age,
sur
vivo
rs a
nd d
isab
ility
insu
ranc
e ta
x (O
ASD
I) an
d th
e ho
spita
l in
sura
nce
tax
(Med
icar
e). T
he ta
x is
impo
sed
in e
qual
per
cent
ages
on
the
empl
oyer
and
em
ploy
ee.
OAS
DI:
6.2
per c
ent i
mpo
sed
on w
ages
up
to a
max
imum
of U
S$94
,200
in
200
6.
Med
icar
e: 1
.45
per c
ent o
n em
ploy
ee’s
wag
es.
OAS
DI:
6.2
per c
ent i
mpo
sed
on e
arni
ngs
up to
US
$94,
200
in 2
006.
M
edic
are:
1.4
5 pe
r cen
t on
all e
mpl
oyee
s’ w
ages
. U
nem
ploy
men
t Tax
: 6.2
per
cen
t on
earn
ings
up
to
US$
7,00
0. E
mpl
oyer
s w
ho p
ay th
e st
ate
unem
ploy
men
t tax
, on
a ti
mel
y ba
sis,
rece
ive
an o
ffset
cre
dit o
f up
to
5.4
per c
ent.
Self-
empl
oyed
taxp
ayer
s ar
e re
spon
sibl
e fo
r pay
ing
both
th
e em
ploy
ee a
nd e
mpl
oyer
O
ASD
I and
Med
icar
e co
ntrib
utio
ns.
Sour
ce: v
ario
us, s
ee C
hapt
er 1
(1.4
.1).

International comparison of Australia’s taxes
Page 130
APPENDIX 4.6: WAGE AND SALARY TAXATION DATA
Appendix table 4.6.1: Gross wage earnings in national currency and in US dollars for an average worker
CountryGross wage earnings in US dollars
using purchasing power paritiesAustralia 51,169 36,851Austria 33,624 36,934Belgium 36,396 41,101Canada 40,341 31,297Czech Republic 221,886 15,229Denmark 328,390 38,454Finland 32,722 35,035France 30,219 33,619Germany 41,074 44,086Greece 18,339 25,808Hungary 1,778,552 13,681Iceland 2,949,759 32,113Ireland 31,663 31,056Italy 22,759 27,060Japan 4,953,747 38,235Korea 28,729,826 37,702Luxembourg 40,500 40,984Mexico 79,997 10,688Netherlands 37,759 41,560New Zealand 40,949 27,274Norway 379,934 38,509Poland 30,000 16,232Portugal 13,299 20,148Slovak Republic 216,780 12,478Spain 20,701 26,451Sweden 309,854 33,154Switzerland 71,595 40,694Turkey 15,256 18,609United Kingdom 28,571 46,091United States 31,666 31,666
Gross wage earningsin national currency

Chapter 4: Wage and salary taxation
Page 131
Appendix table 4.6.2: Top marginal tax rate and threshold Combined top
marginal tax rate(a)All-in top
marginal rateThreshold multiple
(average production wage)Slovak Republic 2.9 19.0 0.5Hungary 56.0 69.5 0.8Ireland 42.0 48.0 0.9Denmark 55.0 63.0 1.0Luxembourg 33.9 47.9 1.0Belgium 45.1 59.3 1.1Mexico 22.5 32.1 1.2United Kingdom 40.0 41.0 1.3Australia (2004-05) 48.5 48.5 1.4Germany 44.3 44.3 1.4Netherlands 52.0 52.0 1.4Iceland 40.2 40.2 1.4New Zealand 39.0 39.0 1.5Greece 33.6 49.6 1.5Sweden 56.6 56.6 1.5Finland 49.9 56.5 1.9Czech Republic 28.0 40.5 1.9Austria 42.7 42.7 2.1Norway 43.5 51.3 2.1Australia (2006-07 on) 48.5 48.5 2.2Turkey 26.1 41.1 2.3Spain 45.0 45.0 2.6France 36.5 48.6 2.7Canada 46.4 46.4 2.9Poland 26.2 51.8 3.1Switzerland 37.8 47.9 3.6Korea 35.6 38.2 3.6Japan 47.1 47.9 4.5Portugal 35.6 46.6 4.6Italy 44.1 44.1 4.8United States 41.3 42.7 10.6Unweighted average 39.9 46.7 2.4Weighted average 41.4 44.5 5.6 Source: OECD Tax database (preliminary data) and Australian Treasury estimates. (a) Combined top marginal tax rate includes the national government and sub-national government (top marginal) rate, calculated as the additional national and sub-national government personal income tax resulting from a unit increase in gross wage earnings. The combined rate takes account of the effects of tax credits, the deductibility of sub-central taxes in central government taxes etc.