Embed Size (px)
Citation preview
Gateway Ref 18768
PbR and the Market Forces Factor (MFF) in 2013-14 Page 1 of 28
Payment by Results
PbR and the Market Forces Factor (MFF) in 2013-14
0
Gateway Ref 18768
DH INFORMATION READER BOX
Policy Clinical Estates HR Workforce Commissioner Development IM amp T Management Provider Development Finance Planning Performance Improvement and Efficiency Social Care Partnership Working
Document Purpose For Information
Gateway Reference 18768
Title PbR and the Market Forces Factor (MFF) in 2013-14
Author Department of Health Payment by Results team
Publication Date 28 February 2013
Target Audience PCT Cluster CEs NHS Trust CEs SHA Cluster CEs Care Trust CEs Foundation Trust CEs Medical Directors PCT Cluster Chairs NHS Trust Board Chairs Special HA CEs Directors of Finance Allied Health Professionals Communications Leads
Circulation List GPs
Description The purpose of this guidance is to provide a detailed explanation of the Market Forces Factor (MFF) in an accessible way It covers structure calculation application and scope of the MFF
Cross Ref Payment by Results Guidance for 2013-14
Superseded Docs PbR and the Market Forces Factor (MFF) in 2012-13
Action Required To note the contents
Timing NA
Contact Details
pbrcommsdhgsigovuk
Leeds LS2 7UE
Payment by Results team Department of Health Quarry House Quarry Hill
For Recipients Use
PbR and the Market Forces Factor (MFF) in 2013-14 Page 2 of 28
Gateway Ref 18768
Contents
Quick Guide ndash a brief introduction to the MFF and its use in PbR 5 Background 7 Unavoidable costs8 Application of the MFF within PbR 9
Underlying Index 9 Payment Index 9 Tariff calculation 10 MFF for payment 10
Components of the MFF 11 Staff index 11 Medical amp Dental (MampD) London Weighting 12 Buildings index 12 Land index 13 Other 14
Changes to the MFF 2013-14 14 Creating the MFF 14
Deriving an MFF value for newly merged trusts 15 Capping policy 15
Annex A ndash Composition of MFF 16 Annex B - The Staff Index 17
Underlying data for the staff index 17 Basing the MFF on NHS staff costs 17 Basing the MFF on external wage comparisons 18
Smoothing and Interpolation19 Smoothing19 Interpolation 20
Medical and Dental (MampD) London Weighting20 Annex C ndash Worked example calculation of MFF 21
Staff Index 21 Medical and dental (MampD) London weighting 21 Buildings Index 21 Land Index21 Overall Index 21
Annex D ndash Reference Cost Index (RCI) 23 Annex E ndash Tariff Calculation26 Annex F ndash Creating an index 28
PbR and the Market Forces Factor (MFF) in 2013-14 Page 3 of 28
Gateway Ref 18768
List of Figures
Figure 1 Range of MFF payment values in 2013-14 6 Figure 2 Comparison of relative trust MFF values 8
List of Tables
Table 1 Scaled MFF for RCI 24 Table 2 Average RCI kept at 100 25 Table 3 Rebasing MFF for Tariff Calculation 26 Table 4 Relative differences between providers A amp B 27
PbR and the Market Forces Factor (MFF) in 2013-14 Page 4 of 28
Gateway Ref 18768
Quick Guide ndash a brief introduction to the MFF and its use in PbR
1 The purpose of the Market Forces Factor (MFF) is to estimate the unavoidable cost differences1 of providing healthcare Within PbR the MFF directly funds providers for the relative level of unavoidable costs they face Accounting for unavoidable costs ensures a level basis across the country to provide equal amounts of healthcare per pound
2 The MFF was initially used in allocating resources to commissioners through the weighted capitation formula With the introduction of PbR the MFF also took on the role of reimbursing providers directly for the differences in unavoidable costs they face In both cases the MFF is used to adjust funding flows in higher cost areas commissioners receive higher levels of funding through the allocation formula so that they are able to meet the higher costs of providers for the same level of healthcare
3 Each NHS organisation receives an individual MFF value used to establish the level of unavoidable costs they face relative to each other organisation The relativities between organisations are determined using an index and all organisations are ranked within the index
4 There are two versions of the MFF index (a) the underlying index is used in the weighted capitation formula (b) the index used in PbR is known as the payment index
5 In the payment index the provider facing the lowest level of unavoidable costs ndash Cornwall Partnership NHS Foundation Trust ndash has the lowest value The payment index is set so that the lowest value is 10 to ensure that all providers receive non-negative MFF payments
6 Unless otherwise stated the index referred to in this document is the payment index
7 In 2013-14 the MFF index has a range from 10 to 12976 The range is illustrated in Figure 1 on the next page The lowest value on the chart of 100 is Cornwall Partnership NHS Foundation Trust and the highest value of 12976 belongs to University College London Hospitals NHS Foundation Trust
1 lsquoUnavoidable costsrsquo is the term used to refer to the costs that providers are unable to significantly influence The level of these costs varies across the country Land buildings and staff costs all include unavoidable elements Please see section on unavoidable costs for more detail
PbR and the Market Forces Factor (MFF) in 2013-14 Page 5 of 28
Gateway Ref 18768
Figure 1 Range of MFF payment values in 2013-14
8 To use the MFF as a mechanism to reimburse providers the value for each organisation is multiplied by the tariff price for each unit of activity As such the PbR income for each provider can be calculated as follows
PbR income = (activity tariff price) MFF value
9 As an example Trust A has an MFF value of 120 and undertakes 100 units of activity with a tariff price of pound500 per unit For this activity Trust A receives a total PbR income of pound60000 pound10000 of which is for MFF payments intended to compensate for the additional unavoidable costs they face compared to Cornwall Partnership NHS Foundation Trust
(100 500) 120 = pound50000 120 = pound60000
10 The provider facing the lowest level of unavoidable costs has an index value of one because they require no additional funding through the MFF the MFF recognises unavoidable cost differences
11 The MFF accounts for variation in unavoidable costs in several elements of provider running costs The elements are (a) non-medical staff (b) medical amp dental staff (c) land and (d) buildings
12 The level of cost differences within each element are calculated independently They are then combined to create an overall index for each organisation
PbR and the Market Forces Factor (MFF) in 2013-14 Page 6 of 28
Gateway Ref 18768
Background
13 The Market Forces Factor (MFF) was initially used in allocating resources for commissioners to use in commissioning healthcare services for their population Inclusion of the MFF is intended to ensure commissioners can afford the same level of care for their population where healthcare costs differ between geographical areas Accounting for the MFF means that commissioners receive different levels of funding not only dependent on the size and needs of their population but also the varying costs of services in different areas Commissioners in higher cost areas receive additional funding to ensure they can afford the same level of services relative to need as those in other areas
14 Commissioners pay a fixed national price for activity within the scope of the national tariff The price for each unit of activity is intended to cover the cost of service provision To calculate appropriate prices the tariff is based on national average costs reported by every NHS trust However some elements of costs vary by locality such variation means that a national price based on national average costs does not fairly reflect the costs of providers in all locations
15 The costs that vary by location are those subject to high competition notably from outside the NHS land is an example Other costs do not vary by locality all organisations face the same unit price for costs such as equipment and consumables
16 Trusts in areas with higher unavoidable costs require greater compensation to undertake activity comparable with a provider operating in a lower cost area As such commissioners from higher cost providers need more funding to afford services of equivalent quality and quantity The approach used to target funding to higher cost areas is the MFF
17 The Advisory Committee on Resource Allocation (ACRA) oversees the development of the allocation formula including the MFF element The application of the MFF to PbR is explicitly considered in any developments
PbR and the Market Forces Factor (MFF) in 2013-14 Page 7 of 28
Gateway Ref 18768
Unavoidable costs
18 lsquoUnavoidable costsrsquo is the term used to refer to the costs that providers are unable to significantly influence The level of these costs varies across the country Land buildings and staff costs all include unavoidable elements
19 Consider that hospitals are required in certain locations to serve given local populations Trusts can choose their location within this defined area but are confined within a specific region they must face the costs associated with this location For example hospitals that must be located in central London will face higher unavoidable costs than hospitals located in outer London
20 The differences in unavoidable costs that hospitals face need to be reflected in funding A trust facing unavoidable costs 20 greater than a provider located elsewhere should receive 20 additional funding The MFF is used to determine the differences in unavoidable costs between organisations such that each can be fairly reimbursed
21 The MFF compares the unavoidable costs between organisations and ranks them according to the relative level of unavoidable costs they face This is demonstrated diagrammatically in figure 2 Trust C is the lowest cost provider trust B faces unavoidable costs 5 greater than C and trust A faces costs 26 higher than C The MFF payment index used in PbR uses values to enable comparison between each provider relative to the lowest cost provider
Figure 2 Comparison of relative trust MFF values
Provider B (MFF = 105)
Provider C (MFF = 100)
Provider A (MFF = 126)
Provider A faces 20 higher unavoidable costs
than Trust B
Provider B faces 5 higher unavoidable costs
than Trust C
Provider A faces 26 higher unavoidable costs than provider C
22 As figure 3 illustrates given the relativities between trusts A and C and B and C the cost variation between providers A and B can be determined provider A faces unavoidable costs 20 higher than B
Difference in unavoidable costs = [(126-105)105] 100 = 20
PbR and the Market Forces Factor (MFF) in 2013-14 Page 8 of 28
Gateway Ref 18768
Application of the MFF within PbR
23 There are two versions of the MFF index (a) underlying index and (b) payment index
24 Both of these indices are based on the same set of data To use this data for different purposes it is transformed into different indices An index is a series of values all relative to the same base value By having a different base the index can be used in different ways
Underlying Index
25 The underlying index is the version first calculated and used to inform CCG allocations The underlying version is set so that the base to which all values in the index are relative is the average value The underlying index has an average value of 10 Organisations facing higher (lower) unavoidable costs than the average organisation have a value greater (less) than 10
26 The underlying index is also used in the calculation of the Reference Cost Index (RCI) See Annex D for further details and a worked example
Payment Index
27 The payment index is the version used for the national tariff This version of the index is set so that the base to which all values are relative is the minimum rather than the average The payment index has a minimum value of 10 The organisation with the value of 10 faces the lowest unavoidable costs Organisations with a value greater than 10 face higher costs than the minimum organisation For example an organisation with an index value of 102 is estimated to face unavoidable costs 2 greater than the lowest cost provider
28 The reason for creating an index with a base that is a minimum of 10 is to facilitate the PbR funding policy of a single national price To achieve this all providers must receive this price and then be compensated separately for the unavoidable costs they face If the MFF index used in PbR was the underlying version then the tariff price would include the level of unavoidable costs in the middle of the range of all providers Providers with lower unavoidable costs would be paid less than the tariff price after the application of the MFF
29 As suggested above use of the payment index separates avoidable and unavoidable costs The tariff reimburses the costs that all providers incur and the MFF separately compensates those facing more than the minimum level of unavoidable costs
PbR and the Market Forces Factor (MFF) in 2013-14 Page 9 of 28
Gateway Ref 18768
30 In practice the payment index is created by transforming the underlying index rather than going back to the base data The payment index is created by dividing each value in the underlying index by the minimum value This creates an index with a base of 10
31 Transforming the index means that a single provider has a different value in the underlying and payment index Despite this the relativities between providers are the same For example consider two trusts A and B If trust A is estimated to face unavoidable costs 15 higher than trust B then the MFF value of trust A will be 15 higher than that for trust B irrespective of which index is used (see Annex G for a more detailed explanation)
32 To apply the MFF for reimbursement tariff prices have to be adjusted to account for variation in unavoidable costs The stages in applying the MFF for PbR are outlined below
Tariff calculation
33 The MFF is used in the calculation of the national tariff For each HRG and admission type the tariff is based on the national average cost of the service Before determining the national average each providerrsquos unit costs are divided by their corresponding payment MFF value This is done for two reasons
34 Firstly it removes any bias of providing activity in higher cost areas For example suppose 80 of activity of an HRG is provided in a high cost area such as London and the remaining 20 is provided in a relatively low cost area such as Cornwall Without the removal of the MFF the tariff price would be biased upwards because of the London activity
35 Secondly dividing through by the MFF means that there is one national price (tariff) for services Providers are compensated separately for the unavoidable costs they incur in providing activity See the next sub-section for more detail
36 A worked example of the application of the MFF in tariff calculation is included in Annex C
MFF for payment
37 As stated above the tariff price of an HRG is based on the national average of costs reported by hospitals having adjusted for unavoidable cost differences above the minimum To compensate providers for their unavoidable cost pressures the MFF is applied as a proportion of the tariff price paid in addition to the tariff on each unit of activity
38 The tariff price includes the lowest possible level of unavoidable costs that an NHS organisation faces The lowest cost provider receives no additional funding for their activity All other providers receive an
PbR and the Market Forces Factor (MFF) in 2013-14 Page 10 of 28
Gateway Ref 18768
additional proportion of the tariff price as compensation for their unavoidable costs
39 The MFF is applied to a trust for a single HRG as follows
Total income = (Activity Tariff price) MFF value
40 Example 100 units of activity for HRG A are undertaken by Trust X The tariff price of HRG A is pound500 the trust has an MFF value of 120
Total income = 100 pound500 120 = pound60000
ie Trust X receives an extra pound10000 as a result of higher unavoidable costs than the lowest cost provider
Components of the MFF
41 The components of running costs considered to vary across the country are compensated for using the MFF The relative differences for each component cost are captured in separate indices Each component cost index is then aggregated into an overall MFF index to create the underlying index The components are described below See Annex A for an overview of the composition of the MFF
Staff index
42 The staff index applies to all non-medical NHS staff Unavoidable variation in staff costs arise because national pay scales implemented by the NHS (including regional pay allowances) do not fully reflect the variation in employment costs evident in the broader labour market If wages do not reflect the going rate for an area then this can lead to indirect costs such as greater use of agency staff and higher vacancy and turnover rates It can also lead to differences in staff productivity
43 The staff index is based on variation in wages in the private sector Annex B provides further information of the reasoning behind this approach The data source for the index is the Annual Survey of Hours and Earnings (ASHE) produced by the Office for National Statistics For 2011-12 onwards updated and more robust earnings data has been used (from the years 2007-2009)2
44 The staff index is based on the pattern of wages calculated within defined geographical ares (currently the previous PCT boundaries) and is intended to reflect local labour market conditions As trusts do not only employ staff from the geographical area in which their sites are located
2 For further information please see the HERU report lsquoThe Staff Market Forces Factor Component of the Resource Allocation Weighted Capitation Formula New estimatesrsquo httpwwwdhgovukprod_consum_dhgroupsdh_digitalassetsdocumentsdigitalassetdh_1 22621pdf
PbR and the Market Forces Factor (MFF) in 2013-14 Page 11 of 28
Gateway Ref 18768
the first stage is to smooth3 the variation in wage levels between areas to take into account the different labour market conditions in the areas A second stage of smoothing called interpolation4 undertaken at trust site level is used to take into account the precise location of trustsrsquo sites within an area and thus their distance from other areas Annex B outlines the smoothing and interpolation techniques
45 Interpolation is not used in the calculation of MFF values for Community Trusts As these trusts have taken over the services previously provided by PCTs activity will be spread across the catchment area of the trust and so it would not be appropriate to attribute all of the unavoidable cost differences to the location of the Head Quarters of the Community Trust Instead for newly created Community Trusts (ie those that have not merged with acute trusts) the staff MFF is calculated to reflect the full catchment area of the trust based on the previous PCTsrsquo MFFs
46 The values of the underlying staff index range between 08746 and 12340
Medical amp Dental (MampD) London Weighting
47 Analysis determined that medical staff costs do not vary in the same way as those of other staff groups5 Medical staff costs are however significantly higher in London than the rest of the country the MampD London weighting is required to compensate for this difference
48 The MampD London weighting is applied to trusts in London and is calculated as the ratio of the average paybill per head for hospital doctors in 2008-09 nationally to the average paybill per head excluding London This ratio is 10224 and trusts within what was London SHA receive this value all other trusts receive an MampD value of 10
Buildings index
49 The cost of buildings includes an unavoidable element because as an asset buildings have different worth in different parts of the country In an area where a building is worth more the trust will pay more in capital charges on this asset relative to a trust located in a lower cost area
50 The buildings index remains based on PCT geography The Building Cost Information Service (BCIS) analysed tender prices for public and private contracts between January 2007 and June 2010 to derive
3 smoothing is a form of weighted averages 4 Interpolation is a technique using two or more values to create an intermediate value 5 Both RARP 31 and 32 draw this conclusion RARP 31 Review of Specific Cost Approach to Market Forces Factor RARP 32 Review of the Market Forces Factor following the introduction of Payment by Results (2005) Exploring the General Labour Market Method httpwwwdhgovukenManagingyourorganisationFinanceandplanningAllocationsDH_410
PbR and the Market Forces Factor (MFF) in 2013-14 Page 12 of 28
8515
Gateway Ref 18768
location factors Average location factors for the period are provided for each PCT area Each trustrsquos buildings value is determined by the PCT area in which they are located To create the buildings index the location factors were divided by the mean value weighted by population A trust sites buildings index is determined by the PCT area where it is located An average of the site indices weighted by available bed numbers is used to provide the trust buildings index For Community Trusts population rather than bed numbers is used as the basis for averaging across PCT areas
51 The values of the buildings index range between 089 and 128
Land index
52 Land costs include unavoidable costs for two reasons (a) it cost trusts more to acquire land in certain areas of the country
relative to others and (b) the capital charges paid on this land will also be higher
53 The land index unlike the other indices is specific to each individual trust The only exception is Community Trusts which were formed to take over the provider functions of PCTs Their land index value is based on the previous PCT index values
54 A land index based on land value per hectare is calculated for each NHS Trust using net book value of land at 31 March 2009 as reported in the audited summarisation schedules 2008-09 The land areas for each individual trust were aggregated from the site level data available in the 2008-09 Estates Return Information Collection (ERIC)
55 Whilst it would be possible to use average land values for pre-defined geographic areas two drawbacks of this approach make the chosen method appropriate Firstly land prices are subject to variation within small geographic areas and secondly trusts have to pay capital charges relating specifically to the land value for the trust
56 The land index has the biggest range the lowest value is 0016 the maximum is 19550 representing a 1200-fold difference Given the gap between the lowest and highest values the land index for providers with high values has a significant impact on their overall MFF value This is in spite of the small proportion of costs that land accounts for (see creating the MFF section) The land component can often explain differences between index values of organisations
57 London Trusts that have a significant non-London site have a land index for each site weighted together in proportion to the 2004 VOA value and the share of available beds at each site The use of available beds recognises that land is typically used more intensively in central London compared to less urban areas
PbR and the Market Forces Factor (MFF) in 2013-14 Page 13 of 28
Gateway Ref 18768
Other
58 The category of ldquootherrdquo costs is included as an additional factor in the final MFF value The costs included in this element are all those that are not considered to vary by location As these costs do not vary by provider all organisations receive a value of 1 in relation to these costs
59 It is necessary for non-varying costs to be represented in the overall value as the MFF is applied to the full scope of costs not just those with elements that vary by area The MFF is a percentage of the tariff price As the tariff is based on total running costs per unit of activity the MFF must therefore reflect all components of costs that drive the price
Changes to the MFF 2013-14
60 There have been no changes to the source data for the MFF for 2013-14 the 2012-13 MFF has been rolled forward
61 PCTs ceased providing services in 2012-13 and will cease their commissioning functions in 2013-14 For the purposes of PbR the provider functions of PCTs have transferred to new or existing trusts and MFF values have been affected as follows Where the provider functions of PCTs have been transferred into
new Trusts the relevant previous PCT MFF values have been used to calculate an appropriate MFF value
Where other acute trusts have taken over PCT provider functions the MFF value of the acute Trust remains unchanged
Creating the MFF
62 The overall MFF value for each organisation is a combination of the components outlined above The elements are combined according to the proportion of total running costs that they account for This value is determined based on national proportions of expenditure on each component of the MFF reported in NHS accounts The proportion attributable to each element of the MFF is outlined below
Staff 549 MampD London Weighting 139 Buildings 27 Land 04 Other 281
63 To create an overall MFF value for an organisation the index value for each element of the MFF is multiplied by its proportion of total running costs This approach applies a weight to each element of the MFF equal to its weight within total costs The weighted index values are then
PbR and the Market Forces Factor (MFF) in 2013-14 Page 14 of 28
Gateway Ref 18768
summed together to give an overall figure for the organisation6 See Annex C for a worked example of the calculation for a trust with multiple sites
Deriving an MFF value for newly merged trusts
64 Organisations that merge will have a new MFF value calculated in line with the MFF methodology For organisations merging at the beginning of the financial year this new MFF will apply from the date of the merger For organisations merging in the middle of the financial year the new MFF will apply from the beginning of the following financial year (see PbR Guidance for full policy)
65 The methodology means that each site of a merging trust will be treated not as a proportion of the trust to which it previously belonged but as a proportion of the merged organisation as a whole This is necessary as the staff and buildings components of the MFF are defined at site level The site index values are combined according to their activity levels proxied by bed numbers as per the calculation of multiple site organisations (see Annex C for worked example)
66 In some instances it may be necessary to make further adjustments to the calculation of the merged land index value Where merging trusts have very different land index values and also vary significantly in the intensity of land use the individual land index values will be combined according to trust activity levels (proxied by bed numbers) This is in line with the method used for the staff and buildings components of the MFF and acts as an extension of the adjustments already in place to recognise the differing land use intensities for London trusts with significant sites out of London
Capping policy
67 A capping policy was introduced in 2009-10 to reduce volatilities in overall PbR income resulting from any changes in the MFF values It meant that given changes to the tariff providerrsquos overall income should not change by more than +-2 as a result of using the updated MFF as opposed to using the previous years MFF In 2013-14 all organisations will have moved to their target MFF values and are no longer subject to the capping policy The 2013-14 tariff information spreadsheet includes details of the past capped payment values for each trust
6 The impact of a single overall MFF value on an organisationsrsquo income is equal to the impact of applying the index value for each element separately to the proportion of costs it represents
PbR and the Market Forces Factor (MFF) in 2013-14 Page 15 of 28
Gateway Ref 18768
Annex A ndash Composition of MFF
MFF Index
(549) (139) (04) (27) (281)
Land BuildingsStaff OtherMampD
Data Evaluated at PCT level Applied to London Valuations specific to Evaluated at PCT level and assigned to trust trusts only trustsrsquo estates and assigned to trust Level
sites relative to national sites
Variation in private Land net book values Evidence sector wages Average paybill for (2008-09) and Estates Three year Assumed not to Base
(University of Warwick hospital doctors Return Information average of tender vary in any developments by 2008-09 Collection (2008-09) prices material way
HERU)
1 The index values of each of the four component indices (staff MampD land and buildings) are multiplied by the corresponding expenditure weight to give the overall MFF value A worked example is included in Annex C
PbR and the Market Forces Factor (MFF) in 2013-14 Page 16 of 28
Gateway Ref 18768
Annex B - The Staff Index
1 This annex outlines (a) Rationale for basing the staff index on private sector rather than
NHS wages (b) The application of smoothing and interpolation and (c) Rationale for the introduction of the Medical amp dental London
weighting
Underlying data for the staff index
1 The staff element of the MFF is the largest component Although the staff index is intended to reflect non-medical NHS staff cost variations it is based on private sector rather than NHS wages The rationale for this approach generates many queries
2 The aim of the MFF is to compensate for unavoidable cost differences between providers in the delivery of services For staff expenditure variation can occur directly or indirectly direct costs are the salaries paid to staff indirect costs include expenditure incurred through labour turnover agency staff costs vacancies and reduced productivity
3 High indirect costs of employment can arise for NHS providers where the wage rate they offer is below the prevailing wage rate of the area from which they draw their staff Organisations offering relatively low wages are likely to experience higher vacancy and turnover rates relative to other employers Lower wages are also associated with lower staff productivity Research commissioned by DH7 found evidence of these outcomes in a study into the variation in wages across NHS organisations
4 Geographical variation in staff costs can be determined in two ways using NHS employment costs or private sector wages as is the convention for the MFF A brief overview of each approach is set out below
Basing the MFF on NHS staff costs
5 Whilst it would be possible to base the staff index on actual NHS costs several problems with the approach make its use inappropriate Research commissioned8 by DH confirmed the arguments against the use of this method
7 RARP 32 Review of the Market Forces Factor following the introduction of Payment by Results (2005) Exploring the General Labour Market method httpwwwdhgovukenManagingyourorganisationFinanceandplanningAllocationsDH_410 8515 8 RARP 31 Review of the Specific Cost Approach to Market Forces Factor httpwwwdhgovukenManagingyourorganisationFinanceandplanningAllocationsDH_410 8515
PbR and the Market Forces Factor (MFF) in 2013-14 Page 17 of 28
Gateway Ref 18768
6 Lack of national data availability Although it is straightforward to obtain information about high level direct employment costs within the NHS there is currently limited availability of consistent detailed data on employment costs
7 Distinguishing between avoidable and unavoidable costs Where organisations incur greater than average costs it is almost impossible to distinguish between avoidable and unavoidable components of expenditure For example by dividing the MFF range into quintiles of trusts and controlling for trust type and location there is 35 variation in the number of nurses needed for the same output between quintile 1 and 5 It is unclear whether the reasons for this variation are caused by drivers of avoidable or unavoidable costs
8 Possibility of perverse incentives Using actual NHS costs any relative changes in NHS staff costs would feed directly into the MFF calculation any trust with higher relative costs would then receive a greater staff index value when the MFF is re-calculated This issue creates an incentive for trusts to raise their indirect staff costs which would increase the staff component of their MFF (assuming that not all trusts did this thereby leaving relative wage rates unchanged) resulting in greater income from the tariff
9 Reduced incentives to improve efficiency Trusts using staff more efficiently will face lower staff costs relative to those with less efficiency When the MFF is next calculated lower staff costs would be reflected in a lower MFF value and therefore a reduced (and relatively lower) tariff income Using the NHS staff costs approach the incentives to improve efficiency under PbR would be reduced
10 In light of these issues the research confirmed that the current approach using external wage comparisons to determine differences in staff costs is appropriate
Basing the MFF on external wage comparisons
11 Basing the staff index on private sector wages was the approach recommended by the University of Warwick The original argument was conceptual but supporting evidence is now available from work commissioned by DH
12 The premise of the approach is that the private sector does not implement national pay scales and as such wages offered reflect the cost of living and amenities in that area These factors are the key drivers of relative differences in pay
13 It would not be fair to simply take the actual average private sector wage in each area This is because occupational mix varies Some areas have a much higher proportion of staff working in highly paid occupations such as law and banking These differences need to be taken into account in
PbR and the Market Forces Factor (MFF) in 2013-14 Page 18 of 28
Gateway Ref 18768
the MFF in order to ensure that we are making like for like comparisons across the country Warwick do this using a statistical technique known as regression analysis It essentially works out what wages would be in an area if each area had the same mix of occupations We similarly take account of differences in the age and gender mix of the private sector workforce in different areas
14 The staff index compensates trusts for the unavoidable variation in direct staff costs and indirect employment costs arising where NHS wages do not reflect the local market rate
15 To test for evidence of indirect employment costs the Health Economics Research Unit (HERU) commissioned by DH determined the relationship between vacancy rates and the gap between NHS and private sector wages for different staff groups For nurses the evidence illustrates that vacancy rates are higher where the gap between NHS wages and private sector wages are greater
16 The Department of Health and the Department of Communities and Local Government have undertaken a number of reviews of the approach to compensating for unavoidable differences in staff costs Both Departments concluded that this approach to the MFF continues to be the best available methodology
Smoothing and Interpolation
17 Smoothing and interpolation are two approaches used to refine the staff MFF index values so that the values for each organisation better reflect the local labour markets from which they recruit
Smoothing
18 The methodology of the staff index creates the cliff edge problem whereby neighbouring PCTs receive markedly different staff cost values because of their geographical boundaries Cliff edges may lead to an inaccurate representation of staff costs faced by a provider This problem is particularly evident for providers within different PCTs but in close proximity and facing similar local labour market pressures Smoothing techniques soften cliff edges to produce a more continuous profile of staff costs across PCTs
19 HERU recommended that smoothing take into account the relative staff index of every PCT rather than just neighbouring ones as previously This approach recognises that NHS organisations draw their labour force from a variety of PCT areas Smoothing adjusts the relative level of staff index in a PCT by accounting for relative staff index in surrounding PCTs The weights of the relative costs in surrounding areas fall the further the distance from the base PCT Smoothing brings each PCTrsquos MFF more in line with those of its surrounding PCTs
PbR and the Market Forces Factor (MFF) in 2013-14 Page 19 of 28
Gateway Ref 18768
Interpolation
20 The smoothed relative costs for PCTs described above still result in cliff edges between trusts Two trusts operating near the border of neighbouring PCTs might have different relative staff costs but operate in the same labour market As a result HERU introduced a further refinement to smoothing interpolation
21 Interpolation takes account of the location within a PCT area of the trustsrsquo sites and thus the distance from other PCT areas It involves a second stage of smoothing carried out at trust level after smoothing at PCT level and further reduces the impact of cliff edges It works the same way as smoothing in that the staff index of a trust is the distance weighted average of the surrounding PCTsrsquo staff indices
22 Interpolation is carried out at trust site level Where a trust has more than one site the different indices for each site are weighted together in proportion to activity using bed numbers as a proxy on each site
Medical and Dental (MampD) London Weighting
23 The scope of the staff component of the MFF has been progressively expanded and since 2003-4 has included the whole workforce The research by HERU found no supporting evidence for the application of the staff MFF to doctors As such the coverage of the staff index was reduced in 2009-10 and a new element the Medical and Dental London Weighting is incorporated The MampD weighting reflects the greater cost of these employees in London relative to the rest of the country
24 HERU determined that pay setting mechanisms between medical and non-medical staff differ negating the need to apply the staff index to medical staff Although there is no national variation in medical staff costs there is a significant difference in the costs of doctors in London relative to the rest of the country As such a weighting for medical and dental staff is applied to trusts in London
PbR and the Market Forces Factor (MFF) in 2013-14 Page 20 of 28
Gateway Ref 18768
Annex C ndash Worked example calculation of MFF
1 This worked example shows the calculation of the MFF for Provider A
Staff Index
2 The staff index for a hospital trust is calculated based the staff index values for individual trusts There are two sites to Provider A These are in the locality of PCT Y and PCT Z
Sites PCT area Staff Index Activity 1 Y 10385 89 2 Z 10101 11
3 Staff MFF for Provider A is thus
(08910385) + (01100101) = 10354
Medical and dental (MampD) London weighting
4 This index is calculated as the ratio of the average hospital paybill of these staff groups in 2008-09 including London weighting to the average paybill excluding the London weighting
5 Provider A has no sites located within London and therefore receives a weighting of 100
Buildings Index
6 The Buildings Index is calculated in the same way as the Staff Index
Sites PCT area Building Index Activity 1 Y 09497 89 2 Z 09693 11
7 The calculation is thus
(08909497) + (01109693) = 09519
Land Index
8 The index value of the Provider A estate is 15374
Overall Index
9 The 4 components are combined using the breakdown of national expenditure between staff buildings land and other costs The latter is assumed not to vary across the country
PbR and the Market Forces Factor (MFF) in 2013-14 Page 21 of 28
Gateway Ref 18768
Index HCHS Expenditure Index Value Weighted Index (a) (b) (c) = (a)(b)
Staff 549 10354 05684 MampD 139 10000 01390 Buildings 27 09519 00257 Land 04 15374 00061 Other 281 10000 02810
index value is the same for all trusts
10 This gives an overall target MFF value of 05684 + 01390 + 00257 + 00061 + 02810 = 10203
11 This above value is the underlying index value for Provider A This index is centred around 1 To ensure that all trusts receive non-negative payment of the MFF the underlying index is converted to a payment index with a minimum value of 1
12 To set the minimum of the payment index to 1 the underlying index with an average of 1 is divided through by the minimum value In 2013-14 the minimum value is 09263 The final MFF value for Provider A to be used for payment is thus
102209263 = 11033
PbR and the Market Forces Factor (MFF) in 2013-14 Page 22 of 28
Gateway Ref 18768
Annex D ndash Reference Cost Index (RCI)
1 The RCI is an index of the relative cost efficiency of NHS organisations The RCI is adjusted by the MFF to ensure a fair comparison between organisations across England
2 For the RCI to be comparable year-on-year the index must have an average of 100 To ensure this the application of the MFF to reference costs must be cost neutral ie the total national value of Reference Costs submitted must be the same whether it includes or excludes the MFF To obtain cost neutrality the underlying MFF is scaled The extent of this scaling depends on the percentage difference between the quantum of Reference Costs prior to the application of MFF and after it
3 The following example shows how the MFF is used to calculate the MFF-adjusted RCI Table 1 shows how the underlying MFF is scaled so that the total quantum of Reference Costs is kept constant at pound4500 This is necessary to ensure the national average RCI is 100 The factor used to scale the underlying MFF is the percentage difference between Reference Costs prior to the application of the MFF and after its application (sum of column C divided by sum of column B)
PbR and the Market Forces Factor (MFF) in 2013-14 Page 23 of 28
Gateway Ref 18768
Table 1 Scaled MFF for RCI
A B C = B A D = A sum (C) sum (B) E = B D
Underlying MFF
Total Reference Costs Quantum (pound)
Total RC Quantum adjusted for underlying MFF (pound) Scaled MFF
Total RC Quantum adjusted for scaled MFF (pound)
Provider A 10249 1250 1220 09622 1299 Provider B 11021 1000 907 10346 967 Provider C 13349 1000 749 12532 798 Provider D 09270 1250 1348 08703 1436
4500 4225 4500
4 Table 2 shows that without the scaling of the MFF the average of RCI does not equal 100 (compare the averages of columns J and L) Having the average RCI at 100 allows easy comparison of providerrsquos relative efficiency year on year Irrespective of whether the average is 100 (and any scaling) a providerrsquos index value is always the same relative to the average For example Provider D is always 22 above average
From column L [(122 ndash 100) 100] 100 = 22 From column J [(115 ndash 94) 94] 100 = 22
PbR and the Market Forces Factor (MFF) in 2013-14 Page 24 of 28
Gateway Ref 18768
Table 2 Average RCI kept at 100
F G
H = (F G)100 I = A J = H I K = D L = H K
Actual Total Cost (pound)
Expected Total Cost (pound)
Base RCI
Underlyi ng MFF
MFF adjusted RCI (based on underlying MFF)
Scaled MFF
MFF adjusted RCI (based on scaled MFF)
Provider A
1250
1300 96 10249 94 09622 100 Provider B
1000
925 108 11021 98 10346 104 Provider C
1000
1100 91 13349 68 12532 73 Provider D
1250
1175 106 09270 115 08703 122 Average 100 94 100
(RCI figures to the nearest integer)
PbR and the Market Forces Factor (MFF) in 2013-14 Page 25 of 28
Gateway Ref 18768
Annex E ndash Tariff Calculation
1 Table 3 gives an example calculation of the tariff for an HRG The underlying MFF is rebased so that the minimum value is 1 (column D) by dividing the index through by the 2013-14 minimum value of 09263 Total costs are then divided by these MFF values (column E) The income for a provider is then the product of tariff price activity and rebased MFF (column F)
Table 3 Rebasing MFF for Tariff Calculation
A B C D = C min C
E = B D F = Tariff A D
Activity Total Costs (pound)
Underlying MFF
Rebased MFF to 1
Total Costs adjusted for rebased MFF (pound)
PbR Income (pound)
Provider A Provider
60 1250 10249 11064 1130 1528
B Provider
50 1000 11021 11898 840 1369
C Provider
20 1000 13349 14411 694 663
D 40 1250 09263 1 1250 921 Total 170 4500 3913 4483
Tariff = Total costs adjusted for MFF National activity = sum of column E sum of column A
= pound3913 170 = pound2302
PbR and the Market Forces Factor (MFF) in 2013-14 Page 26 of 28
Gateway Ref 18768
2 Table 4 shows the relative difference between providers A and B for the underlying and rebased (payment) index As is shown irrespective of the index the MFF of Provider B is always 753 greater than that of Provider A This relationship is true for all providers the relativities between providers is the same regardless of how the underlying MFF is scaled
Table 4 Relative differences between providers A amp B
X Y Z = ( Y X )-1
Provider Provider MFF Indices A B Difference Underlying (col C) 10249 11021 753 Rebased to 1 (col D) 11064 11898 753
PbR and the Market Forces Factor (MFF) in 2013-14 Page 27 of 28
Gateway Ref 18768
Annex F ndash Creating an index
1 An index is a ranking of numbers relative to the same base such that they can be directly compared
2 In the example below an index value can be attached to each of the numbers in column A An index is constructed by dividing each number by the base value of the index In common with the MFF the first index created is in column B which has an average value of 10 like the underlying MFF index This index is constructed by dividing each number by the average of the index 100
Values Index with an average of 1
Index with a minimum of 1
A B C 50 050 100 95 095 190 125 125 250 130 130 260 100 100 200
Average value 100 Minimum value 50
3 The index in column B represents a ranking relative to the average value in the list The average of the values in column a is 100 The value 50 in column A is half of the average so as a relative value 50 can be expressed as 05
4 Column C represents the transformation of the index to have a minimum value of 1 akin to the payment index 50 is the lowest of all the values in column A and so in the index in column C it has a value of 10
5 As stated in the guidance irrespective of the version of the MFF index the relative unavoidable cost differences between organisations are maintained In the example above it can be seen that the relative difference between the values 50 and 100 of column A is the same in both columns B and C ie 05 is half of 10 and 10 is half of 20 This also holds for every other combination of values For example 50 is 04 times small than 125 In columns B and C the relative difference in the associated index values is also 04 (050 125 = 04) and (10 25 = 04)
PbR and the Market Forces Factor (MFF) in 2013-14 Page 28 of 28
Gateway Ref 18768
List of Figures
Figure 1 Range of MFF payment values in 2013-14 6 Figure 2 Comparison of relative trust MFF values 8
List of Tables
Table 1 Scaled MFF for RCI 24 Table 2 Average RCI kept at 100 25 Table 3 Rebasing MFF for Tariff Calculation 26 Table 4 Relative differences between providers A amp B 27
PbR and the Market Forces Factor (MFF) in 2013-14 Page 4 of 28
Gateway Ref 18768
Quick Guide ndash a brief introduction to the MFF and its use in PbR
1 The purpose of the Market Forces Factor (MFF) is to estimate the unavoidable cost differences1 of providing healthcare Within PbR the MFF directly funds providers for the relative level of unavoidable costs they face Accounting for unavoidable costs ensures a level basis across the country to provide equal amounts of healthcare per pound
2 The MFF was initially used in allocating resources to commissioners through the weighted capitation formula With the introduction of PbR the MFF also took on the role of reimbursing providers directly for the differences in unavoidable costs they face In both cases the MFF is used to adjust funding flows in higher cost areas commissioners receive higher levels of funding through the allocation formula so that they are able to meet the higher costs of providers for the same level of healthcare
3 Each NHS organisation receives an individual MFF value used to establish the level of unavoidable costs they face relative to each other organisation The relativities between organisations are determined using an index and all organisations are ranked within the index
4 There are two versions of the MFF index (a) the underlying index is used in the weighted capitation formula (b) the index used in PbR is known as the payment index
5 In the payment index the provider facing the lowest level of unavoidable costs ndash Cornwall Partnership NHS Foundation Trust ndash has the lowest value The payment index is set so that the lowest value is 10 to ensure that all providers receive non-negative MFF payments
6 Unless otherwise stated the index referred to in this document is the payment index
7 In 2013-14 the MFF index has a range from 10 to 12976 The range is illustrated in Figure 1 on the next page The lowest value on the chart of 100 is Cornwall Partnership NHS Foundation Trust and the highest value of 12976 belongs to University College London Hospitals NHS Foundation Trust
1 lsquoUnavoidable costsrsquo is the term used to refer to the costs that providers are unable to significantly influence The level of these costs varies across the country Land buildings and staff costs all include unavoidable elements Please see section on unavoidable costs for more detail
PbR and the Market Forces Factor (MFF) in 2013-14 Page 5 of 28
Gateway Ref 18768
Figure 1 Range of MFF payment values in 2013-14
8 To use the MFF as a mechanism to reimburse providers the value for each organisation is multiplied by the tariff price for each unit of activity As such the PbR income for each provider can be calculated as follows
PbR income = (activity tariff price) MFF value
9 As an example Trust A has an MFF value of 120 and undertakes 100 units of activity with a tariff price of pound500 per unit For this activity Trust A receives a total PbR income of pound60000 pound10000 of which is for MFF payments intended to compensate for the additional unavoidable costs they face compared to Cornwall Partnership NHS Foundation Trust
(100 500) 120 = pound50000 120 = pound60000
10 The provider facing the lowest level of unavoidable costs has an index value of one because they require no additional funding through the MFF the MFF recognises unavoidable cost differences
11 The MFF accounts for variation in unavoidable costs in several elements of provider running costs The elements are (a) non-medical staff (b) medical amp dental staff (c) land and (d) buildings
12 The level of cost differences within each element are calculated independently They are then combined to create an overall index for each organisation
PbR and the Market Forces Factor (MFF) in 2013-14 Page 6 of 28
Gateway Ref 18768
Background
13 The Market Forces Factor (MFF) was initially used in allocating resources for commissioners to use in commissioning healthcare services for their population Inclusion of the MFF is intended to ensure commissioners can afford the same level of care for their population where healthcare costs differ between geographical areas Accounting for the MFF means that commissioners receive different levels of funding not only dependent on the size and needs of their population but also the varying costs of services in different areas Commissioners in higher cost areas receive additional funding to ensure they can afford the same level of services relative to need as those in other areas
14 Commissioners pay a fixed national price for activity within the scope of the national tariff The price for each unit of activity is intended to cover the cost of service provision To calculate appropriate prices the tariff is based on national average costs reported by every NHS trust However some elements of costs vary by locality such variation means that a national price based on national average costs does not fairly reflect the costs of providers in all locations
15 The costs that vary by location are those subject to high competition notably from outside the NHS land is an example Other costs do not vary by locality all organisations face the same unit price for costs such as equipment and consumables
16 Trusts in areas with higher unavoidable costs require greater compensation to undertake activity comparable with a provider operating in a lower cost area As such commissioners from higher cost providers need more funding to afford services of equivalent quality and quantity The approach used to target funding to higher cost areas is the MFF
17 The Advisory Committee on Resource Allocation (ACRA) oversees the development of the allocation formula including the MFF element The application of the MFF to PbR is explicitly considered in any developments
PbR and the Market Forces Factor (MFF) in 2013-14 Page 7 of 28
Gateway Ref 18768
Unavoidable costs
18 lsquoUnavoidable costsrsquo is the term used to refer to the costs that providers are unable to significantly influence The level of these costs varies across the country Land buildings and staff costs all include unavoidable elements
19 Consider that hospitals are required in certain locations to serve given local populations Trusts can choose their location within this defined area but are confined within a specific region they must face the costs associated with this location For example hospitals that must be located in central London will face higher unavoidable costs than hospitals located in outer London
20 The differences in unavoidable costs that hospitals face need to be reflected in funding A trust facing unavoidable costs 20 greater than a provider located elsewhere should receive 20 additional funding The MFF is used to determine the differences in unavoidable costs between organisations such that each can be fairly reimbursed
21 The MFF compares the unavoidable costs between organisations and ranks them according to the relative level of unavoidable costs they face This is demonstrated diagrammatically in figure 2 Trust C is the lowest cost provider trust B faces unavoidable costs 5 greater than C and trust A faces costs 26 higher than C The MFF payment index used in PbR uses values to enable comparison between each provider relative to the lowest cost provider
Figure 2 Comparison of relative trust MFF values
Provider B (MFF = 105)
Provider C (MFF = 100)
Provider A (MFF = 126)
Provider A faces 20 higher unavoidable costs
than Trust B
Provider B faces 5 higher unavoidable costs
than Trust C
Provider A faces 26 higher unavoidable costs than provider C
22 As figure 3 illustrates given the relativities between trusts A and C and B and C the cost variation between providers A and B can be determined provider A faces unavoidable costs 20 higher than B
Difference in unavoidable costs = [(126-105)105] 100 = 20
PbR and the Market Forces Factor (MFF) in 2013-14 Page 8 of 28
Gateway Ref 18768
Application of the MFF within PbR
23 There are two versions of the MFF index (a) underlying index and (b) payment index
24 Both of these indices are based on the same set of data To use this data for different purposes it is transformed into different indices An index is a series of values all relative to the same base value By having a different base the index can be used in different ways
Underlying Index
25 The underlying index is the version first calculated and used to inform CCG allocations The underlying version is set so that the base to which all values in the index are relative is the average value The underlying index has an average value of 10 Organisations facing higher (lower) unavoidable costs than the average organisation have a value greater (less) than 10
26 The underlying index is also used in the calculation of the Reference Cost Index (RCI) See Annex D for further details and a worked example
Payment Index
27 The payment index is the version used for the national tariff This version of the index is set so that the base to which all values are relative is the minimum rather than the average The payment index has a minimum value of 10 The organisation with the value of 10 faces the lowest unavoidable costs Organisations with a value greater than 10 face higher costs than the minimum organisation For example an organisation with an index value of 102 is estimated to face unavoidable costs 2 greater than the lowest cost provider
28 The reason for creating an index with a base that is a minimum of 10 is to facilitate the PbR funding policy of a single national price To achieve this all providers must receive this price and then be compensated separately for the unavoidable costs they face If the MFF index used in PbR was the underlying version then the tariff price would include the level of unavoidable costs in the middle of the range of all providers Providers with lower unavoidable costs would be paid less than the tariff price after the application of the MFF
29 As suggested above use of the payment index separates avoidable and unavoidable costs The tariff reimburses the costs that all providers incur and the MFF separately compensates those facing more than the minimum level of unavoidable costs
PbR and the Market Forces Factor (MFF) in 2013-14 Page 9 of 28
Gateway Ref 18768
30 In practice the payment index is created by transforming the underlying index rather than going back to the base data The payment index is created by dividing each value in the underlying index by the minimum value This creates an index with a base of 10
31 Transforming the index means that a single provider has a different value in the underlying and payment index Despite this the relativities between providers are the same For example consider two trusts A and B If trust A is estimated to face unavoidable costs 15 higher than trust B then the MFF value of trust A will be 15 higher than that for trust B irrespective of which index is used (see Annex G for a more detailed explanation)
32 To apply the MFF for reimbursement tariff prices have to be adjusted to account for variation in unavoidable costs The stages in applying the MFF for PbR are outlined below
Tariff calculation
33 The MFF is used in the calculation of the national tariff For each HRG and admission type the tariff is based on the national average cost of the service Before determining the national average each providerrsquos unit costs are divided by their corresponding payment MFF value This is done for two reasons
34 Firstly it removes any bias of providing activity in higher cost areas For example suppose 80 of activity of an HRG is provided in a high cost area such as London and the remaining 20 is provided in a relatively low cost area such as Cornwall Without the removal of the MFF the tariff price would be biased upwards because of the London activity
35 Secondly dividing through by the MFF means that there is one national price (tariff) for services Providers are compensated separately for the unavoidable costs they incur in providing activity See the next sub-section for more detail
36 A worked example of the application of the MFF in tariff calculation is included in Annex C
MFF for payment
37 As stated above the tariff price of an HRG is based on the national average of costs reported by hospitals having adjusted for unavoidable cost differences above the minimum To compensate providers for their unavoidable cost pressures the MFF is applied as a proportion of the tariff price paid in addition to the tariff on each unit of activity
38 The tariff price includes the lowest possible level of unavoidable costs that an NHS organisation faces The lowest cost provider receives no additional funding for their activity All other providers receive an
PbR and the Market Forces Factor (MFF) in 2013-14 Page 10 of 28
Gateway Ref 18768
additional proportion of the tariff price as compensation for their unavoidable costs
39 The MFF is applied to a trust for a single HRG as follows
Total income = (Activity Tariff price) MFF value
40 Example 100 units of activity for HRG A are undertaken by Trust X The tariff price of HRG A is pound500 the trust has an MFF value of 120
Total income = 100 pound500 120 = pound60000
ie Trust X receives an extra pound10000 as a result of higher unavoidable costs than the lowest cost provider
Components of the MFF
41 The components of running costs considered to vary across the country are compensated for using the MFF The relative differences for each component cost are captured in separate indices Each component cost index is then aggregated into an overall MFF index to create the underlying index The components are described below See Annex A for an overview of the composition of the MFF
Staff index
42 The staff index applies to all non-medical NHS staff Unavoidable variation in staff costs arise because national pay scales implemented by the NHS (including regional pay allowances) do not fully reflect the variation in employment costs evident in the broader labour market If wages do not reflect the going rate for an area then this can lead to indirect costs such as greater use of agency staff and higher vacancy and turnover rates It can also lead to differences in staff productivity
43 The staff index is based on variation in wages in the private sector Annex B provides further information of the reasoning behind this approach The data source for the index is the Annual Survey of Hours and Earnings (ASHE) produced by the Office for National Statistics For 2011-12 onwards updated and more robust earnings data has been used (from the years 2007-2009)2
44 The staff index is based on the pattern of wages calculated within defined geographical ares (currently the previous PCT boundaries) and is intended to reflect local labour market conditions As trusts do not only employ staff from the geographical area in which their sites are located
2 For further information please see the HERU report lsquoThe Staff Market Forces Factor Component of the Resource Allocation Weighted Capitation Formula New estimatesrsquo httpwwwdhgovukprod_consum_dhgroupsdh_digitalassetsdocumentsdigitalassetdh_1 22621pdf
PbR and the Market Forces Factor (MFF) in 2013-14 Page 11 of 28
Gateway Ref 18768
the first stage is to smooth3 the variation in wage levels between areas to take into account the different labour market conditions in the areas A second stage of smoothing called interpolation4 undertaken at trust site level is used to take into account the precise location of trustsrsquo sites within an area and thus their distance from other areas Annex B outlines the smoothing and interpolation techniques
45 Interpolation is not used in the calculation of MFF values for Community Trusts As these trusts have taken over the services previously provided by PCTs activity will be spread across the catchment area of the trust and so it would not be appropriate to attribute all of the unavoidable cost differences to the location of the Head Quarters of the Community Trust Instead for newly created Community Trusts (ie those that have not merged with acute trusts) the staff MFF is calculated to reflect the full catchment area of the trust based on the previous PCTsrsquo MFFs
46 The values of the underlying staff index range between 08746 and 12340
Medical amp Dental (MampD) London Weighting
47 Analysis determined that medical staff costs do not vary in the same way as those of other staff groups5 Medical staff costs are however significantly higher in London than the rest of the country the MampD London weighting is required to compensate for this difference
48 The MampD London weighting is applied to trusts in London and is calculated as the ratio of the average paybill per head for hospital doctors in 2008-09 nationally to the average paybill per head excluding London This ratio is 10224 and trusts within what was London SHA receive this value all other trusts receive an MampD value of 10
Buildings index
49 The cost of buildings includes an unavoidable element because as an asset buildings have different worth in different parts of the country In an area where a building is worth more the trust will pay more in capital charges on this asset relative to a trust located in a lower cost area
50 The buildings index remains based on PCT geography The Building Cost Information Service (BCIS) analysed tender prices for public and private contracts between January 2007 and June 2010 to derive
3 smoothing is a form of weighted averages 4 Interpolation is a technique using two or more values to create an intermediate value 5 Both RARP 31 and 32 draw this conclusion RARP 31 Review of Specific Cost Approach to Market Forces Factor RARP 32 Review of the Market Forces Factor following the introduction of Payment by Results (2005) Exploring the General Labour Market Method httpwwwdhgovukenManagingyourorganisationFinanceandplanningAllocationsDH_410
PbR and the Market Forces Factor (MFF) in 2013-14 Page 12 of 28
8515
Gateway Ref 18768
location factors Average location factors for the period are provided for each PCT area Each trustrsquos buildings value is determined by the PCT area in which they are located To create the buildings index the location factors were divided by the mean value weighted by population A trust sites buildings index is determined by the PCT area where it is located An average of the site indices weighted by available bed numbers is used to provide the trust buildings index For Community Trusts population rather than bed numbers is used as the basis for averaging across PCT areas
51 The values of the buildings index range between 089 and 128
Land index
52 Land costs include unavoidable costs for two reasons (a) it cost trusts more to acquire land in certain areas of the country
relative to others and (b) the capital charges paid on this land will also be higher
53 The land index unlike the other indices is specific to each individual trust The only exception is Community Trusts which were formed to take over the provider functions of PCTs Their land index value is based on the previous PCT index values
54 A land index based on land value per hectare is calculated for each NHS Trust using net book value of land at 31 March 2009 as reported in the audited summarisation schedules 2008-09 The land areas for each individual trust were aggregated from the site level data available in the 2008-09 Estates Return Information Collection (ERIC)
55 Whilst it would be possible to use average land values for pre-defined geographic areas two drawbacks of this approach make the chosen method appropriate Firstly land prices are subject to variation within small geographic areas and secondly trusts have to pay capital charges relating specifically to the land value for the trust
56 The land index has the biggest range the lowest value is 0016 the maximum is 19550 representing a 1200-fold difference Given the gap between the lowest and highest values the land index for providers with high values has a significant impact on their overall MFF value This is in spite of the small proportion of costs that land accounts for (see creating the MFF section) The land component can often explain differences between index values of organisations
57 London Trusts that have a significant non-London site have a land index for each site weighted together in proportion to the 2004 VOA value and the share of available beds at each site The use of available beds recognises that land is typically used more intensively in central London compared to less urban areas
PbR and the Market Forces Factor (MFF) in 2013-14 Page 13 of 28
Gateway Ref 18768
Other
58 The category of ldquootherrdquo costs is included as an additional factor in the final MFF value The costs included in this element are all those that are not considered to vary by location As these costs do not vary by provider all organisations receive a value of 1 in relation to these costs
59 It is necessary for non-varying costs to be represented in the overall value as the MFF is applied to the full scope of costs not just those with elements that vary by area The MFF is a percentage of the tariff price As the tariff is based on total running costs per unit of activity the MFF must therefore reflect all components of costs that drive the price
Changes to the MFF 2013-14
60 There have been no changes to the source data for the MFF for 2013-14 the 2012-13 MFF has been rolled forward
61 PCTs ceased providing services in 2012-13 and will cease their commissioning functions in 2013-14 For the purposes of PbR the provider functions of PCTs have transferred to new or existing trusts and MFF values have been affected as follows Where the provider functions of PCTs have been transferred into
new Trusts the relevant previous PCT MFF values have been used to calculate an appropriate MFF value
Where other acute trusts have taken over PCT provider functions the MFF value of the acute Trust remains unchanged
Creating the MFF
62 The overall MFF value for each organisation is a combination of the components outlined above The elements are combined according to the proportion of total running costs that they account for This value is determined based on national proportions of expenditure on each component of the MFF reported in NHS accounts The proportion attributable to each element of the MFF is outlined below
Staff 549 MampD London Weighting 139 Buildings 27 Land 04 Other 281
63 To create an overall MFF value for an organisation the index value for each element of the MFF is multiplied by its proportion of total running costs This approach applies a weight to each element of the MFF equal to its weight within total costs The weighted index values are then
PbR and the Market Forces Factor (MFF) in 2013-14 Page 14 of 28
Gateway Ref 18768
summed together to give an overall figure for the organisation6 See Annex C for a worked example of the calculation for a trust with multiple sites
Deriving an MFF value for newly merged trusts
64 Organisations that merge will have a new MFF value calculated in line with the MFF methodology For organisations merging at the beginning of the financial year this new MFF will apply from the date of the merger For organisations merging in the middle of the financial year the new MFF will apply from the beginning of the following financial year (see PbR Guidance for full policy)
65 The methodology means that each site of a merging trust will be treated not as a proportion of the trust to which it previously belonged but as a proportion of the merged organisation as a whole This is necessary as the staff and buildings components of the MFF are defined at site level The site index values are combined according to their activity levels proxied by bed numbers as per the calculation of multiple site organisations (see Annex C for worked example)
66 In some instances it may be necessary to make further adjustments to the calculation of the merged land index value Where merging trusts have very different land index values and also vary significantly in the intensity of land use the individual land index values will be combined according to trust activity levels (proxied by bed numbers) This is in line with the method used for the staff and buildings components of the MFF and acts as an extension of the adjustments already in place to recognise the differing land use intensities for London trusts with significant sites out of London
Capping policy
67 A capping policy was introduced in 2009-10 to reduce volatilities in overall PbR income resulting from any changes in the MFF values It meant that given changes to the tariff providerrsquos overall income should not change by more than +-2 as a result of using the updated MFF as opposed to using the previous years MFF In 2013-14 all organisations will have moved to their target MFF values and are no longer subject to the capping policy The 2013-14 tariff information spreadsheet includes details of the past capped payment values for each trust
6 The impact of a single overall MFF value on an organisationsrsquo income is equal to the impact of applying the index value for each element separately to the proportion of costs it represents
PbR and the Market Forces Factor (MFF) in 2013-14 Page 15 of 28
Gateway Ref 18768
Annex A ndash Composition of MFF
MFF Index
(549) (139) (04) (27) (281)
Land BuildingsStaff OtherMampD
Data Evaluated at PCT level Applied to London Valuations specific to Evaluated at PCT level and assigned to trust trusts only trustsrsquo estates and assigned to trust Level
sites relative to national sites
Variation in private Land net book values Evidence sector wages Average paybill for (2008-09) and Estates Three year Assumed not to Base
(University of Warwick hospital doctors Return Information average of tender vary in any developments by 2008-09 Collection (2008-09) prices material way
HERU)
1 The index values of each of the four component indices (staff MampD land and buildings) are multiplied by the corresponding expenditure weight to give the overall MFF value A worked example is included in Annex C
PbR and the Market Forces Factor (MFF) in 2013-14 Page 16 of 28
Gateway Ref 18768
Annex B - The Staff Index
1 This annex outlines (a) Rationale for basing the staff index on private sector rather than
NHS wages (b) The application of smoothing and interpolation and (c) Rationale for the introduction of the Medical amp dental London
weighting
Underlying data for the staff index
1 The staff element of the MFF is the largest component Although the staff index is intended to reflect non-medical NHS staff cost variations it is based on private sector rather than NHS wages The rationale for this approach generates many queries
2 The aim of the MFF is to compensate for unavoidable cost differences between providers in the delivery of services For staff expenditure variation can occur directly or indirectly direct costs are the salaries paid to staff indirect costs include expenditure incurred through labour turnover agency staff costs vacancies and reduced productivity
3 High indirect costs of employment can arise for NHS providers where the wage rate they offer is below the prevailing wage rate of the area from which they draw their staff Organisations offering relatively low wages are likely to experience higher vacancy and turnover rates relative to other employers Lower wages are also associated with lower staff productivity Research commissioned by DH7 found evidence of these outcomes in a study into the variation in wages across NHS organisations
4 Geographical variation in staff costs can be determined in two ways using NHS employment costs or private sector wages as is the convention for the MFF A brief overview of each approach is set out below
Basing the MFF on NHS staff costs
5 Whilst it would be possible to base the staff index on actual NHS costs several problems with the approach make its use inappropriate Research commissioned8 by DH confirmed the arguments against the use of this method
7 RARP 32 Review of the Market Forces Factor following the introduction of Payment by Results (2005) Exploring the General Labour Market method httpwwwdhgovukenManagingyourorganisationFinanceandplanningAllocationsDH_410 8515 8 RARP 31 Review of the Specific Cost Approach to Market Forces Factor httpwwwdhgovukenManagingyourorganisationFinanceandplanningAllocationsDH_410 8515
PbR and the Market Forces Factor (MFF) in 2013-14 Page 17 of 28
Gateway Ref 18768
6 Lack of national data availability Although it is straightforward to obtain information about high level direct employment costs within the NHS there is currently limited availability of consistent detailed data on employment costs
7 Distinguishing between avoidable and unavoidable costs Where organisations incur greater than average costs it is almost impossible to distinguish between avoidable and unavoidable components of expenditure For example by dividing the MFF range into quintiles of trusts and controlling for trust type and location there is 35 variation in the number of nurses needed for the same output between quintile 1 and 5 It is unclear whether the reasons for this variation are caused by drivers of avoidable or unavoidable costs
8 Possibility of perverse incentives Using actual NHS costs any relative changes in NHS staff costs would feed directly into the MFF calculation any trust with higher relative costs would then receive a greater staff index value when the MFF is re-calculated This issue creates an incentive for trusts to raise their indirect staff costs which would increase the staff component of their MFF (assuming that not all trusts did this thereby leaving relative wage rates unchanged) resulting in greater income from the tariff
9 Reduced incentives to improve efficiency Trusts using staff more efficiently will face lower staff costs relative to those with less efficiency When the MFF is next calculated lower staff costs would be reflected in a lower MFF value and therefore a reduced (and relatively lower) tariff income Using the NHS staff costs approach the incentives to improve efficiency under PbR would be reduced
10 In light of these issues the research confirmed that the current approach using external wage comparisons to determine differences in staff costs is appropriate
Basing the MFF on external wage comparisons
11 Basing the staff index on private sector wages was the approach recommended by the University of Warwick The original argument was conceptual but supporting evidence is now available from work commissioned by DH
12 The premise of the approach is that the private sector does not implement national pay scales and as such wages offered reflect the cost of living and amenities in that area These factors are the key drivers of relative differences in pay
13 It would not be fair to simply take the actual average private sector wage in each area This is because occupational mix varies Some areas have a much higher proportion of staff working in highly paid occupations such as law and banking These differences need to be taken into account in
PbR and the Market Forces Factor (MFF) in 2013-14 Page 18 of 28
Gateway Ref 18768
the MFF in order to ensure that we are making like for like comparisons across the country Warwick do this using a statistical technique known as regression analysis It essentially works out what wages would be in an area if each area had the same mix of occupations We similarly take account of differences in the age and gender mix of the private sector workforce in different areas
14 The staff index compensates trusts for the unavoidable variation in direct staff costs and indirect employment costs arising where NHS wages do not reflect the local market rate
15 To test for evidence of indirect employment costs the Health Economics Research Unit (HERU) commissioned by DH determined the relationship between vacancy rates and the gap between NHS and private sector wages for different staff groups For nurses the evidence illustrates that vacancy rates are higher where the gap between NHS wages and private sector wages are greater
16 The Department of Health and the Department of Communities and Local Government have undertaken a number of reviews of the approach to compensating for unavoidable differences in staff costs Both Departments concluded that this approach to the MFF continues to be the best available methodology
Smoothing and Interpolation
17 Smoothing and interpolation are two approaches used to refine the staff MFF index values so that the values for each organisation better reflect the local labour markets from which they recruit
Smoothing
18 The methodology of the staff index creates the cliff edge problem whereby neighbouring PCTs receive markedly different staff cost values because of their geographical boundaries Cliff edges may lead to an inaccurate representation of staff costs faced by a provider This problem is particularly evident for providers within different PCTs but in close proximity and facing similar local labour market pressures Smoothing techniques soften cliff edges to produce a more continuous profile of staff costs across PCTs
19 HERU recommended that smoothing take into account the relative staff index of every PCT rather than just neighbouring ones as previously This approach recognises that NHS organisations draw their labour force from a variety of PCT areas Smoothing adjusts the relative level of staff index in a PCT by accounting for relative staff index in surrounding PCTs The weights of the relative costs in surrounding areas fall the further the distance from the base PCT Smoothing brings each PCTrsquos MFF more in line with those of its surrounding PCTs
PbR and the Market Forces Factor (MFF) in 2013-14 Page 19 of 28
Gateway Ref 18768
Interpolation
20 The smoothed relative costs for PCTs described above still result in cliff edges between trusts Two trusts operating near the border of neighbouring PCTs might have different relative staff costs but operate in the same labour market As a result HERU introduced a further refinement to smoothing interpolation
21 Interpolation takes account of the location within a PCT area of the trustsrsquo sites and thus the distance from other PCT areas It involves a second stage of smoothing carried out at trust level after smoothing at PCT level and further reduces the impact of cliff edges It works the same way as smoothing in that the staff index of a trust is the distance weighted average of the surrounding PCTsrsquo staff indices
22 Interpolation is carried out at trust site level Where a trust has more than one site the different indices for each site are weighted together in proportion to activity using bed numbers as a proxy on each site
Medical and Dental (MampD) London Weighting
23 The scope of the staff component of the MFF has been progressively expanded and since 2003-4 has included the whole workforce The research by HERU found no supporting evidence for the application of the staff MFF to doctors As such the coverage of the staff index was reduced in 2009-10 and a new element the Medical and Dental London Weighting is incorporated The MampD weighting reflects the greater cost of these employees in London relative to the rest of the country
24 HERU determined that pay setting mechanisms between medical and non-medical staff differ negating the need to apply the staff index to medical staff Although there is no national variation in medical staff costs there is a significant difference in the costs of doctors in London relative to the rest of the country As such a weighting for medical and dental staff is applied to trusts in London
PbR and the Market Forces Factor (MFF) in 2013-14 Page 20 of 28
Gateway Ref 18768
Annex C ndash Worked example calculation of MFF
1 This worked example shows the calculation of the MFF for Provider A
Staff Index
2 The staff index for a hospital trust is calculated based the staff index values for individual trusts There are two sites to Provider A These are in the locality of PCT Y and PCT Z
Sites PCT area Staff Index Activity 1 Y 10385 89 2 Z 10101 11
3 Staff MFF for Provider A is thus
(08910385) + (01100101) = 10354
Medical and dental (MampD) London weighting
4 This index is calculated as the ratio of the average hospital paybill of these staff groups in 2008-09 including London weighting to the average paybill excluding the London weighting
5 Provider A has no sites located within London and therefore receives a weighting of 100
Buildings Index
6 The Buildings Index is calculated in the same way as the Staff Index
Sites PCT area Building Index Activity 1 Y 09497 89 2 Z 09693 11
7 The calculation is thus
(08909497) + (01109693) = 09519
Land Index
8 The index value of the Provider A estate is 15374
Overall Index
9 The 4 components are combined using the breakdown of national expenditure between staff buildings land and other costs The latter is assumed not to vary across the country
PbR and the Market Forces Factor (MFF) in 2013-14 Page 21 of 28
Gateway Ref 18768
Index HCHS Expenditure Index Value Weighted Index (a) (b) (c) = (a)(b)
Staff 549 10354 05684 MampD 139 10000 01390 Buildings 27 09519 00257 Land 04 15374 00061 Other 281 10000 02810
index value is the same for all trusts
10 This gives an overall target MFF value of 05684 + 01390 + 00257 + 00061 + 02810 = 10203
11 This above value is the underlying index value for Provider A This index is centred around 1 To ensure that all trusts receive non-negative payment of the MFF the underlying index is converted to a payment index with a minimum value of 1
12 To set the minimum of the payment index to 1 the underlying index with an average of 1 is divided through by the minimum value In 2013-14 the minimum value is 09263 The final MFF value for Provider A to be used for payment is thus
102209263 = 11033
PbR and the Market Forces Factor (MFF) in 2013-14 Page 22 of 28
Gateway Ref 18768
Annex D ndash Reference Cost Index (RCI)
1 The RCI is an index of the relative cost efficiency of NHS organisations The RCI is adjusted by the MFF to ensure a fair comparison between organisations across England
2 For the RCI to be comparable year-on-year the index must have an average of 100 To ensure this the application of the MFF to reference costs must be cost neutral ie the total national value of Reference Costs submitted must be the same whether it includes or excludes the MFF To obtain cost neutrality the underlying MFF is scaled The extent of this scaling depends on the percentage difference between the quantum of Reference Costs prior to the application of MFF and after it
3 The following example shows how the MFF is used to calculate the MFF-adjusted RCI Table 1 shows how the underlying MFF is scaled so that the total quantum of Reference Costs is kept constant at pound4500 This is necessary to ensure the national average RCI is 100 The factor used to scale the underlying MFF is the percentage difference between Reference Costs prior to the application of the MFF and after its application (sum of column C divided by sum of column B)
PbR and the Market Forces Factor (MFF) in 2013-14 Page 23 of 28
Gateway Ref 18768
Table 1 Scaled MFF for RCI
A B C = B A D = A sum (C) sum (B) E = B D
Underlying MFF
Total Reference Costs Quantum (pound)
Total RC Quantum adjusted for underlying MFF (pound) Scaled MFF
Total RC Quantum adjusted for scaled MFF (pound)
Provider A 10249 1250 1220 09622 1299 Provider B 11021 1000 907 10346 967 Provider C 13349 1000 749 12532 798 Provider D 09270 1250 1348 08703 1436
4500 4225 4500
4 Table 2 shows that without the scaling of the MFF the average of RCI does not equal 100 (compare the averages of columns J and L) Having the average RCI at 100 allows easy comparison of providerrsquos relative efficiency year on year Irrespective of whether the average is 100 (and any scaling) a providerrsquos index value is always the same relative to the average For example Provider D is always 22 above average
From column L [(122 ndash 100) 100] 100 = 22 From column J [(115 ndash 94) 94] 100 = 22
PbR and the Market Forces Factor (MFF) in 2013-14 Page 24 of 28
Gateway Ref 18768
Table 2 Average RCI kept at 100
F G
H = (F G)100 I = A J = H I K = D L = H K
Actual Total Cost (pound)
Expected Total Cost (pound)
Base RCI
Underlyi ng MFF
MFF adjusted RCI (based on underlying MFF)
Scaled MFF
MFF adjusted RCI (based on scaled MFF)
Provider A
1250
1300 96 10249 94 09622 100 Provider B
1000
925 108 11021 98 10346 104 Provider C
1000
1100 91 13349 68 12532 73 Provider D
1250
1175 106 09270 115 08703 122 Average 100 94 100
(RCI figures to the nearest integer)
PbR and the Market Forces Factor (MFF) in 2013-14 Page 25 of 28
Gateway Ref 18768
Annex E ndash Tariff Calculation
1 Table 3 gives an example calculation of the tariff for an HRG The underlying MFF is rebased so that the minimum value is 1 (column D) by dividing the index through by the 2013-14 minimum value of 09263 Total costs are then divided by these MFF values (column E) The income for a provider is then the product of tariff price activity and rebased MFF (column F)
Table 3 Rebasing MFF for Tariff Calculation
A B C D = C min C
E = B D F = Tariff A D
Activity Total Costs (pound)
Underlying MFF
Rebased MFF to 1
Total Costs adjusted for rebased MFF (pound)
PbR Income (pound)
Provider A Provider
60 1250 10249 11064 1130 1528
B Provider
50 1000 11021 11898 840 1369
C Provider
20 1000 13349 14411 694 663
D 40 1250 09263 1 1250 921 Total 170 4500 3913 4483
Tariff = Total costs adjusted for MFF National activity = sum of column E sum of column A
= pound3913 170 = pound2302
PbR and the Market Forces Factor (MFF) in 2013-14 Page 26 of 28
Gateway Ref 18768
2 Table 4 shows the relative difference between providers A and B for the underlying and rebased (payment) index As is shown irrespective of the index the MFF of Provider B is always 753 greater than that of Provider A This relationship is true for all providers the relativities between providers is the same regardless of how the underlying MFF is scaled
Table 4 Relative differences between providers A amp B
X Y Z = ( Y X )-1
Provider Provider MFF Indices A B Difference Underlying (col C) 10249 11021 753 Rebased to 1 (col D) 11064 11898 753
PbR and the Market Forces Factor (MFF) in 2013-14 Page 27 of 28
Gateway Ref 18768
Annex F ndash Creating an index
1 An index is a ranking of numbers relative to the same base such that they can be directly compared
2 In the example below an index value can be attached to each of the numbers in column A An index is constructed by dividing each number by the base value of the index In common with the MFF the first index created is in column B which has an average value of 10 like the underlying MFF index This index is constructed by dividing each number by the average of the index 100
Values Index with an average of 1
Index with a minimum of 1
A B C 50 050 100 95 095 190 125 125 250 130 130 260 100 100 200
Average value 100 Minimum value 50
3 The index in column B represents a ranking relative to the average value in the list The average of the values in column a is 100 The value 50 in column A is half of the average so as a relative value 50 can be expressed as 05
4 Column C represents the transformation of the index to have a minimum value of 1 akin to the payment index 50 is the lowest of all the values in column A and so in the index in column C it has a value of 10
5 As stated in the guidance irrespective of the version of the MFF index the relative unavoidable cost differences between organisations are maintained In the example above it can be seen that the relative difference between the values 50 and 100 of column A is the same in both columns B and C ie 05 is half of 10 and 10 is half of 20 This also holds for every other combination of values For example 50 is 04 times small than 125 In columns B and C the relative difference in the associated index values is also 04 (050 125 = 04) and (10 25 = 04)
PbR and the Market Forces Factor (MFF) in 2013-14 Page 28 of 28
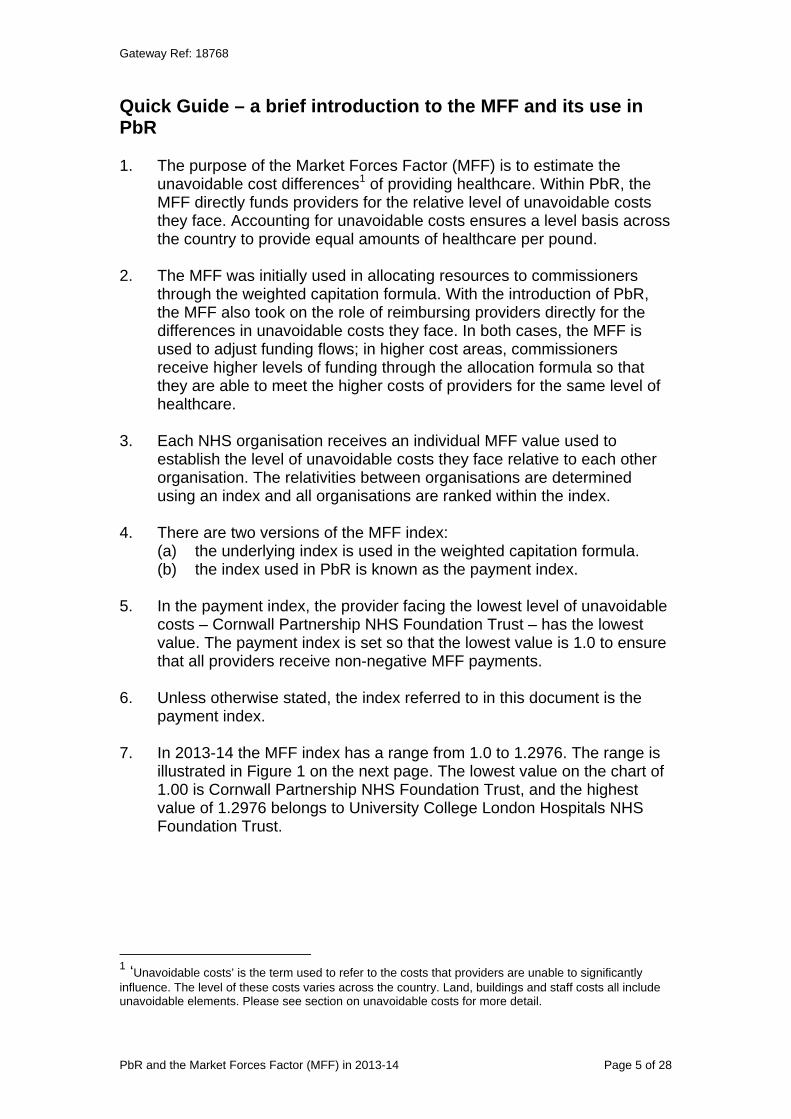
Gateway Ref 18768
Quick Guide ndash a brief introduction to the MFF and its use in PbR
1 The purpose of the Market Forces Factor (MFF) is to estimate the unavoidable cost differences1 of providing healthcare Within PbR the MFF directly funds providers for the relative level of unavoidable costs they face Accounting for unavoidable costs ensures a level basis across the country to provide equal amounts of healthcare per pound
2 The MFF was initially used in allocating resources to commissioners through the weighted capitation formula With the introduction of PbR the MFF also took on the role of reimbursing providers directly for the differences in unavoidable costs they face In both cases the MFF is used to adjust funding flows in higher cost areas commissioners receive higher levels of funding through the allocation formula so that they are able to meet the higher costs of providers for the same level of healthcare
3 Each NHS organisation receives an individual MFF value used to establish the level of unavoidable costs they face relative to each other organisation The relativities between organisations are determined using an index and all organisations are ranked within the index
4 There are two versions of the MFF index (a) the underlying index is used in the weighted capitation formula (b) the index used in PbR is known as the payment index
5 In the payment index the provider facing the lowest level of unavoidable costs ndash Cornwall Partnership NHS Foundation Trust ndash has the lowest value The payment index is set so that the lowest value is 10 to ensure that all providers receive non-negative MFF payments
6 Unless otherwise stated the index referred to in this document is the payment index
7 In 2013-14 the MFF index has a range from 10 to 12976 The range is illustrated in Figure 1 on the next page The lowest value on the chart of 100 is Cornwall Partnership NHS Foundation Trust and the highest value of 12976 belongs to University College London Hospitals NHS Foundation Trust
1 lsquoUnavoidable costsrsquo is the term used to refer to the costs that providers are unable to significantly influence The level of these costs varies across the country Land buildings and staff costs all include unavoidable elements Please see section on unavoidable costs for more detail
PbR and the Market Forces Factor (MFF) in 2013-14 Page 5 of 28
Gateway Ref 18768
Figure 1 Range of MFF payment values in 2013-14
8 To use the MFF as a mechanism to reimburse providers the value for each organisation is multiplied by the tariff price for each unit of activity As such the PbR income for each provider can be calculated as follows
PbR income = (activity tariff price) MFF value
9 As an example Trust A has an MFF value of 120 and undertakes 100 units of activity with a tariff price of pound500 per unit For this activity Trust A receives a total PbR income of pound60000 pound10000 of which is for MFF payments intended to compensate for the additional unavoidable costs they face compared to Cornwall Partnership NHS Foundation Trust
(100 500) 120 = pound50000 120 = pound60000
10 The provider facing the lowest level of unavoidable costs has an index value of one because they require no additional funding through the MFF the MFF recognises unavoidable cost differences
11 The MFF accounts for variation in unavoidable costs in several elements of provider running costs The elements are (a) non-medical staff (b) medical amp dental staff (c) land and (d) buildings
12 The level of cost differences within each element are calculated independently They are then combined to create an overall index for each organisation
PbR and the Market Forces Factor (MFF) in 2013-14 Page 6 of 28
Gateway Ref 18768
Background
13 The Market Forces Factor (MFF) was initially used in allocating resources for commissioners to use in commissioning healthcare services for their population Inclusion of the MFF is intended to ensure commissioners can afford the same level of care for their population where healthcare costs differ between geographical areas Accounting for the MFF means that commissioners receive different levels of funding not only dependent on the size and needs of their population but also the varying costs of services in different areas Commissioners in higher cost areas receive additional funding to ensure they can afford the same level of services relative to need as those in other areas
14 Commissioners pay a fixed national price for activity within the scope of the national tariff The price for each unit of activity is intended to cover the cost of service provision To calculate appropriate prices the tariff is based on national average costs reported by every NHS trust However some elements of costs vary by locality such variation means that a national price based on national average costs does not fairly reflect the costs of providers in all locations
15 The costs that vary by location are those subject to high competition notably from outside the NHS land is an example Other costs do not vary by locality all organisations face the same unit price for costs such as equipment and consumables
16 Trusts in areas with higher unavoidable costs require greater compensation to undertake activity comparable with a provider operating in a lower cost area As such commissioners from higher cost providers need more funding to afford services of equivalent quality and quantity The approach used to target funding to higher cost areas is the MFF
17 The Advisory Committee on Resource Allocation (ACRA) oversees the development of the allocation formula including the MFF element The application of the MFF to PbR is explicitly considered in any developments
PbR and the Market Forces Factor (MFF) in 2013-14 Page 7 of 28
Gateway Ref 18768
Unavoidable costs
18 lsquoUnavoidable costsrsquo is the term used to refer to the costs that providers are unable to significantly influence The level of these costs varies across the country Land buildings and staff costs all include unavoidable elements
19 Consider that hospitals are required in certain locations to serve given local populations Trusts can choose their location within this defined area but are confined within a specific region they must face the costs associated with this location For example hospitals that must be located in central London will face higher unavoidable costs than hospitals located in outer London
20 The differences in unavoidable costs that hospitals face need to be reflected in funding A trust facing unavoidable costs 20 greater than a provider located elsewhere should receive 20 additional funding The MFF is used to determine the differences in unavoidable costs between organisations such that each can be fairly reimbursed
21 The MFF compares the unavoidable costs between organisations and ranks them according to the relative level of unavoidable costs they face This is demonstrated diagrammatically in figure 2 Trust C is the lowest cost provider trust B faces unavoidable costs 5 greater than C and trust A faces costs 26 higher than C The MFF payment index used in PbR uses values to enable comparison between each provider relative to the lowest cost provider
Figure 2 Comparison of relative trust MFF values
Provider B (MFF = 105)
Provider C (MFF = 100)
Provider A (MFF = 126)
Provider A faces 20 higher unavoidable costs
than Trust B
Provider B faces 5 higher unavoidable costs
than Trust C
Provider A faces 26 higher unavoidable costs than provider C
22 As figure 3 illustrates given the relativities between trusts A and C and B and C the cost variation between providers A and B can be determined provider A faces unavoidable costs 20 higher than B
Difference in unavoidable costs = [(126-105)105] 100 = 20
PbR and the Market Forces Factor (MFF) in 2013-14 Page 8 of 28
Gateway Ref 18768
Application of the MFF within PbR
23 There are two versions of the MFF index (a) underlying index and (b) payment index
24 Both of these indices are based on the same set of data To use this data for different purposes it is transformed into different indices An index is a series of values all relative to the same base value By having a different base the index can be used in different ways
Underlying Index
25 The underlying index is the version first calculated and used to inform CCG allocations The underlying version is set so that the base to which all values in the index are relative is the average value The underlying index has an average value of 10 Organisations facing higher (lower) unavoidable costs than the average organisation have a value greater (less) than 10
26 The underlying index is also used in the calculation of the Reference Cost Index (RCI) See Annex D for further details and a worked example
Payment Index
27 The payment index is the version used for the national tariff This version of the index is set so that the base to which all values are relative is the minimum rather than the average The payment index has a minimum value of 10 The organisation with the value of 10 faces the lowest unavoidable costs Organisations with a value greater than 10 face higher costs than the minimum organisation For example an organisation with an index value of 102 is estimated to face unavoidable costs 2 greater than the lowest cost provider
28 The reason for creating an index with a base that is a minimum of 10 is to facilitate the PbR funding policy of a single national price To achieve this all providers must receive this price and then be compensated separately for the unavoidable costs they face If the MFF index used in PbR was the underlying version then the tariff price would include the level of unavoidable costs in the middle of the range of all providers Providers with lower unavoidable costs would be paid less than the tariff price after the application of the MFF
29 As suggested above use of the payment index separates avoidable and unavoidable costs The tariff reimburses the costs that all providers incur and the MFF separately compensates those facing more than the minimum level of unavoidable costs
PbR and the Market Forces Factor (MFF) in 2013-14 Page 9 of 28
Gateway Ref 18768
30 In practice the payment index is created by transforming the underlying index rather than going back to the base data The payment index is created by dividing each value in the underlying index by the minimum value This creates an index with a base of 10
31 Transforming the index means that a single provider has a different value in the underlying and payment index Despite this the relativities between providers are the same For example consider two trusts A and B If trust A is estimated to face unavoidable costs 15 higher than trust B then the MFF value of trust A will be 15 higher than that for trust B irrespective of which index is used (see Annex G for a more detailed explanation)
32 To apply the MFF for reimbursement tariff prices have to be adjusted to account for variation in unavoidable costs The stages in applying the MFF for PbR are outlined below
Tariff calculation
33 The MFF is used in the calculation of the national tariff For each HRG and admission type the tariff is based on the national average cost of the service Before determining the national average each providerrsquos unit costs are divided by their corresponding payment MFF value This is done for two reasons
34 Firstly it removes any bias of providing activity in higher cost areas For example suppose 80 of activity of an HRG is provided in a high cost area such as London and the remaining 20 is provided in a relatively low cost area such as Cornwall Without the removal of the MFF the tariff price would be biased upwards because of the London activity
35 Secondly dividing through by the MFF means that there is one national price (tariff) for services Providers are compensated separately for the unavoidable costs they incur in providing activity See the next sub-section for more detail
36 A worked example of the application of the MFF in tariff calculation is included in Annex C
MFF for payment
37 As stated above the tariff price of an HRG is based on the national average of costs reported by hospitals having adjusted for unavoidable cost differences above the minimum To compensate providers for their unavoidable cost pressures the MFF is applied as a proportion of the tariff price paid in addition to the tariff on each unit of activity
38 The tariff price includes the lowest possible level of unavoidable costs that an NHS organisation faces The lowest cost provider receives no additional funding for their activity All other providers receive an
PbR and the Market Forces Factor (MFF) in 2013-14 Page 10 of 28
Gateway Ref 18768
additional proportion of the tariff price as compensation for their unavoidable costs
39 The MFF is applied to a trust for a single HRG as follows
Total income = (Activity Tariff price) MFF value
40 Example 100 units of activity for HRG A are undertaken by Trust X The tariff price of HRG A is pound500 the trust has an MFF value of 120
Total income = 100 pound500 120 = pound60000
ie Trust X receives an extra pound10000 as a result of higher unavoidable costs than the lowest cost provider
Components of the MFF
41 The components of running costs considered to vary across the country are compensated for using the MFF The relative differences for each component cost are captured in separate indices Each component cost index is then aggregated into an overall MFF index to create the underlying index The components are described below See Annex A for an overview of the composition of the MFF
Staff index
42 The staff index applies to all non-medical NHS staff Unavoidable variation in staff costs arise because national pay scales implemented by the NHS (including regional pay allowances) do not fully reflect the variation in employment costs evident in the broader labour market If wages do not reflect the going rate for an area then this can lead to indirect costs such as greater use of agency staff and higher vacancy and turnover rates It can also lead to differences in staff productivity
43 The staff index is based on variation in wages in the private sector Annex B provides further information of the reasoning behind this approach The data source for the index is the Annual Survey of Hours and Earnings (ASHE) produced by the Office for National Statistics For 2011-12 onwards updated and more robust earnings data has been used (from the years 2007-2009)2
44 The staff index is based on the pattern of wages calculated within defined geographical ares (currently the previous PCT boundaries) and is intended to reflect local labour market conditions As trusts do not only employ staff from the geographical area in which their sites are located
2 For further information please see the HERU report lsquoThe Staff Market Forces Factor Component of the Resource Allocation Weighted Capitation Formula New estimatesrsquo httpwwwdhgovukprod_consum_dhgroupsdh_digitalassetsdocumentsdigitalassetdh_1 22621pdf
PbR and the Market Forces Factor (MFF) in 2013-14 Page 11 of 28
Gateway Ref 18768
the first stage is to smooth3 the variation in wage levels between areas to take into account the different labour market conditions in the areas A second stage of smoothing called interpolation4 undertaken at trust site level is used to take into account the precise location of trustsrsquo sites within an area and thus their distance from other areas Annex B outlines the smoothing and interpolation techniques
45 Interpolation is not used in the calculation of MFF values for Community Trusts As these trusts have taken over the services previously provided by PCTs activity will be spread across the catchment area of the trust and so it would not be appropriate to attribute all of the unavoidable cost differences to the location of the Head Quarters of the Community Trust Instead for newly created Community Trusts (ie those that have not merged with acute trusts) the staff MFF is calculated to reflect the full catchment area of the trust based on the previous PCTsrsquo MFFs
46 The values of the underlying staff index range between 08746 and 12340
Medical amp Dental (MampD) London Weighting
47 Analysis determined that medical staff costs do not vary in the same way as those of other staff groups5 Medical staff costs are however significantly higher in London than the rest of the country the MampD London weighting is required to compensate for this difference
48 The MampD London weighting is applied to trusts in London and is calculated as the ratio of the average paybill per head for hospital doctors in 2008-09 nationally to the average paybill per head excluding London This ratio is 10224 and trusts within what was London SHA receive this value all other trusts receive an MampD value of 10
Buildings index
49 The cost of buildings includes an unavoidable element because as an asset buildings have different worth in different parts of the country In an area where a building is worth more the trust will pay more in capital charges on this asset relative to a trust located in a lower cost area
50 The buildings index remains based on PCT geography The Building Cost Information Service (BCIS) analysed tender prices for public and private contracts between January 2007 and June 2010 to derive
3 smoothing is a form of weighted averages 4 Interpolation is a technique using two or more values to create an intermediate value 5 Both RARP 31 and 32 draw this conclusion RARP 31 Review of Specific Cost Approach to Market Forces Factor RARP 32 Review of the Market Forces Factor following the introduction of Payment by Results (2005) Exploring the General Labour Market Method httpwwwdhgovukenManagingyourorganisationFinanceandplanningAllocationsDH_410
PbR and the Market Forces Factor (MFF) in 2013-14 Page 12 of 28
8515
Gateway Ref 18768
location factors Average location factors for the period are provided for each PCT area Each trustrsquos buildings value is determined by the PCT area in which they are located To create the buildings index the location factors were divided by the mean value weighted by population A trust sites buildings index is determined by the PCT area where it is located An average of the site indices weighted by available bed numbers is used to provide the trust buildings index For Community Trusts population rather than bed numbers is used as the basis for averaging across PCT areas
51 The values of the buildings index range between 089 and 128
Land index
52 Land costs include unavoidable costs for two reasons (a) it cost trusts more to acquire land in certain areas of the country
relative to others and (b) the capital charges paid on this land will also be higher
53 The land index unlike the other indices is specific to each individual trust The only exception is Community Trusts which were formed to take over the provider functions of PCTs Their land index value is based on the previous PCT index values
54 A land index based on land value per hectare is calculated for each NHS Trust using net book value of land at 31 March 2009 as reported in the audited summarisation schedules 2008-09 The land areas for each individual trust were aggregated from the site level data available in the 2008-09 Estates Return Information Collection (ERIC)
55 Whilst it would be possible to use average land values for pre-defined geographic areas two drawbacks of this approach make the chosen method appropriate Firstly land prices are subject to variation within small geographic areas and secondly trusts have to pay capital charges relating specifically to the land value for the trust
56 The land index has the biggest range the lowest value is 0016 the maximum is 19550 representing a 1200-fold difference Given the gap between the lowest and highest values the land index for providers with high values has a significant impact on their overall MFF value This is in spite of the small proportion of costs that land accounts for (see creating the MFF section) The land component can often explain differences between index values of organisations
57 London Trusts that have a significant non-London site have a land index for each site weighted together in proportion to the 2004 VOA value and the share of available beds at each site The use of available beds recognises that land is typically used more intensively in central London compared to less urban areas
PbR and the Market Forces Factor (MFF) in 2013-14 Page 13 of 28
Gateway Ref 18768
Other
58 The category of ldquootherrdquo costs is included as an additional factor in the final MFF value The costs included in this element are all those that are not considered to vary by location As these costs do not vary by provider all organisations receive a value of 1 in relation to these costs
59 It is necessary for non-varying costs to be represented in the overall value as the MFF is applied to the full scope of costs not just those with elements that vary by area The MFF is a percentage of the tariff price As the tariff is based on total running costs per unit of activity the MFF must therefore reflect all components of costs that drive the price
Changes to the MFF 2013-14
60 There have been no changes to the source data for the MFF for 2013-14 the 2012-13 MFF has been rolled forward
61 PCTs ceased providing services in 2012-13 and will cease their commissioning functions in 2013-14 For the purposes of PbR the provider functions of PCTs have transferred to new or existing trusts and MFF values have been affected as follows Where the provider functions of PCTs have been transferred into
new Trusts the relevant previous PCT MFF values have been used to calculate an appropriate MFF value
Where other acute trusts have taken over PCT provider functions the MFF value of the acute Trust remains unchanged
Creating the MFF
62 The overall MFF value for each organisation is a combination of the components outlined above The elements are combined according to the proportion of total running costs that they account for This value is determined based on national proportions of expenditure on each component of the MFF reported in NHS accounts The proportion attributable to each element of the MFF is outlined below
Staff 549 MampD London Weighting 139 Buildings 27 Land 04 Other 281
63 To create an overall MFF value for an organisation the index value for each element of the MFF is multiplied by its proportion of total running costs This approach applies a weight to each element of the MFF equal to its weight within total costs The weighted index values are then
PbR and the Market Forces Factor (MFF) in 2013-14 Page 14 of 28
Gateway Ref 18768
summed together to give an overall figure for the organisation6 See Annex C for a worked example of the calculation for a trust with multiple sites
Deriving an MFF value for newly merged trusts
64 Organisations that merge will have a new MFF value calculated in line with the MFF methodology For organisations merging at the beginning of the financial year this new MFF will apply from the date of the merger For organisations merging in the middle of the financial year the new MFF will apply from the beginning of the following financial year (see PbR Guidance for full policy)
65 The methodology means that each site of a merging trust will be treated not as a proportion of the trust to which it previously belonged but as a proportion of the merged organisation as a whole This is necessary as the staff and buildings components of the MFF are defined at site level The site index values are combined according to their activity levels proxied by bed numbers as per the calculation of multiple site organisations (see Annex C for worked example)
66 In some instances it may be necessary to make further adjustments to the calculation of the merged land index value Where merging trusts have very different land index values and also vary significantly in the intensity of land use the individual land index values will be combined according to trust activity levels (proxied by bed numbers) This is in line with the method used for the staff and buildings components of the MFF and acts as an extension of the adjustments already in place to recognise the differing land use intensities for London trusts with significant sites out of London
Capping policy
67 A capping policy was introduced in 2009-10 to reduce volatilities in overall PbR income resulting from any changes in the MFF values It meant that given changes to the tariff providerrsquos overall income should not change by more than +-2 as a result of using the updated MFF as opposed to using the previous years MFF In 2013-14 all organisations will have moved to their target MFF values and are no longer subject to the capping policy The 2013-14 tariff information spreadsheet includes details of the past capped payment values for each trust
6 The impact of a single overall MFF value on an organisationsrsquo income is equal to the impact of applying the index value for each element separately to the proportion of costs it represents
PbR and the Market Forces Factor (MFF) in 2013-14 Page 15 of 28
Gateway Ref 18768
Annex A ndash Composition of MFF
MFF Index
(549) (139) (04) (27) (281)
Land BuildingsStaff OtherMampD
Data Evaluated at PCT level Applied to London Valuations specific to Evaluated at PCT level and assigned to trust trusts only trustsrsquo estates and assigned to trust Level
sites relative to national sites
Variation in private Land net book values Evidence sector wages Average paybill for (2008-09) and Estates Three year Assumed not to Base
(University of Warwick hospital doctors Return Information average of tender vary in any developments by 2008-09 Collection (2008-09) prices material way
HERU)
1 The index values of each of the four component indices (staff MampD land and buildings) are multiplied by the corresponding expenditure weight to give the overall MFF value A worked example is included in Annex C
PbR and the Market Forces Factor (MFF) in 2013-14 Page 16 of 28
Gateway Ref 18768
Annex B - The Staff Index
1 This annex outlines (a) Rationale for basing the staff index on private sector rather than
NHS wages (b) The application of smoothing and interpolation and (c) Rationale for the introduction of the Medical amp dental London
weighting
Underlying data for the staff index
1 The staff element of the MFF is the largest component Although the staff index is intended to reflect non-medical NHS staff cost variations it is based on private sector rather than NHS wages The rationale for this approach generates many queries
2 The aim of the MFF is to compensate for unavoidable cost differences between providers in the delivery of services For staff expenditure variation can occur directly or indirectly direct costs are the salaries paid to staff indirect costs include expenditure incurred through labour turnover agency staff costs vacancies and reduced productivity
3 High indirect costs of employment can arise for NHS providers where the wage rate they offer is below the prevailing wage rate of the area from which they draw their staff Organisations offering relatively low wages are likely to experience higher vacancy and turnover rates relative to other employers Lower wages are also associated with lower staff productivity Research commissioned by DH7 found evidence of these outcomes in a study into the variation in wages across NHS organisations
4 Geographical variation in staff costs can be determined in two ways using NHS employment costs or private sector wages as is the convention for the MFF A brief overview of each approach is set out below
Basing the MFF on NHS staff costs
5 Whilst it would be possible to base the staff index on actual NHS costs several problems with the approach make its use inappropriate Research commissioned8 by DH confirmed the arguments against the use of this method
7 RARP 32 Review of the Market Forces Factor following the introduction of Payment by Results (2005) Exploring the General Labour Market method httpwwwdhgovukenManagingyourorganisationFinanceandplanningAllocationsDH_410 8515 8 RARP 31 Review of the Specific Cost Approach to Market Forces Factor httpwwwdhgovukenManagingyourorganisationFinanceandplanningAllocationsDH_410 8515
PbR and the Market Forces Factor (MFF) in 2013-14 Page 17 of 28
Gateway Ref 18768
6 Lack of national data availability Although it is straightforward to obtain information about high level direct employment costs within the NHS there is currently limited availability of consistent detailed data on employment costs
7 Distinguishing between avoidable and unavoidable costs Where organisations incur greater than average costs it is almost impossible to distinguish between avoidable and unavoidable components of expenditure For example by dividing the MFF range into quintiles of trusts and controlling for trust type and location there is 35 variation in the number of nurses needed for the same output between quintile 1 and 5 It is unclear whether the reasons for this variation are caused by drivers of avoidable or unavoidable costs
8 Possibility of perverse incentives Using actual NHS costs any relative changes in NHS staff costs would feed directly into the MFF calculation any trust with higher relative costs would then receive a greater staff index value when the MFF is re-calculated This issue creates an incentive for trusts to raise their indirect staff costs which would increase the staff component of their MFF (assuming that not all trusts did this thereby leaving relative wage rates unchanged) resulting in greater income from the tariff
9 Reduced incentives to improve efficiency Trusts using staff more efficiently will face lower staff costs relative to those with less efficiency When the MFF is next calculated lower staff costs would be reflected in a lower MFF value and therefore a reduced (and relatively lower) tariff income Using the NHS staff costs approach the incentives to improve efficiency under PbR would be reduced
10 In light of these issues the research confirmed that the current approach using external wage comparisons to determine differences in staff costs is appropriate
Basing the MFF on external wage comparisons
11 Basing the staff index on private sector wages was the approach recommended by the University of Warwick The original argument was conceptual but supporting evidence is now available from work commissioned by DH
12 The premise of the approach is that the private sector does not implement national pay scales and as such wages offered reflect the cost of living and amenities in that area These factors are the key drivers of relative differences in pay
13 It would not be fair to simply take the actual average private sector wage in each area This is because occupational mix varies Some areas have a much higher proportion of staff working in highly paid occupations such as law and banking These differences need to be taken into account in
PbR and the Market Forces Factor (MFF) in 2013-14 Page 18 of 28
Gateway Ref 18768
the MFF in order to ensure that we are making like for like comparisons across the country Warwick do this using a statistical technique known as regression analysis It essentially works out what wages would be in an area if each area had the same mix of occupations We similarly take account of differences in the age and gender mix of the private sector workforce in different areas
14 The staff index compensates trusts for the unavoidable variation in direct staff costs and indirect employment costs arising where NHS wages do not reflect the local market rate
15 To test for evidence of indirect employment costs the Health Economics Research Unit (HERU) commissioned by DH determined the relationship between vacancy rates and the gap between NHS and private sector wages for different staff groups For nurses the evidence illustrates that vacancy rates are higher where the gap between NHS wages and private sector wages are greater
16 The Department of Health and the Department of Communities and Local Government have undertaken a number of reviews of the approach to compensating for unavoidable differences in staff costs Both Departments concluded that this approach to the MFF continues to be the best available methodology
Smoothing and Interpolation
17 Smoothing and interpolation are two approaches used to refine the staff MFF index values so that the values for each organisation better reflect the local labour markets from which they recruit
Smoothing
18 The methodology of the staff index creates the cliff edge problem whereby neighbouring PCTs receive markedly different staff cost values because of their geographical boundaries Cliff edges may lead to an inaccurate representation of staff costs faced by a provider This problem is particularly evident for providers within different PCTs but in close proximity and facing similar local labour market pressures Smoothing techniques soften cliff edges to produce a more continuous profile of staff costs across PCTs
19 HERU recommended that smoothing take into account the relative staff index of every PCT rather than just neighbouring ones as previously This approach recognises that NHS organisations draw their labour force from a variety of PCT areas Smoothing adjusts the relative level of staff index in a PCT by accounting for relative staff index in surrounding PCTs The weights of the relative costs in surrounding areas fall the further the distance from the base PCT Smoothing brings each PCTrsquos MFF more in line with those of its surrounding PCTs
PbR and the Market Forces Factor (MFF) in 2013-14 Page 19 of 28
Gateway Ref 18768
Interpolation
20 The smoothed relative costs for PCTs described above still result in cliff edges between trusts Two trusts operating near the border of neighbouring PCTs might have different relative staff costs but operate in the same labour market As a result HERU introduced a further refinement to smoothing interpolation
21 Interpolation takes account of the location within a PCT area of the trustsrsquo sites and thus the distance from other PCT areas It involves a second stage of smoothing carried out at trust level after smoothing at PCT level and further reduces the impact of cliff edges It works the same way as smoothing in that the staff index of a trust is the distance weighted average of the surrounding PCTsrsquo staff indices
22 Interpolation is carried out at trust site level Where a trust has more than one site the different indices for each site are weighted together in proportion to activity using bed numbers as a proxy on each site
Medical and Dental (MampD) London Weighting
23 The scope of the staff component of the MFF has been progressively expanded and since 2003-4 has included the whole workforce The research by HERU found no supporting evidence for the application of the staff MFF to doctors As such the coverage of the staff index was reduced in 2009-10 and a new element the Medical and Dental London Weighting is incorporated The MampD weighting reflects the greater cost of these employees in London relative to the rest of the country
24 HERU determined that pay setting mechanisms between medical and non-medical staff differ negating the need to apply the staff index to medical staff Although there is no national variation in medical staff costs there is a significant difference in the costs of doctors in London relative to the rest of the country As such a weighting for medical and dental staff is applied to trusts in London
PbR and the Market Forces Factor (MFF) in 2013-14 Page 20 of 28
Gateway Ref 18768
Annex C ndash Worked example calculation of MFF
1 This worked example shows the calculation of the MFF for Provider A
Staff Index
2 The staff index for a hospital trust is calculated based the staff index values for individual trusts There are two sites to Provider A These are in the locality of PCT Y and PCT Z
Sites PCT area Staff Index Activity 1 Y 10385 89 2 Z 10101 11
3 Staff MFF for Provider A is thus
(08910385) + (01100101) = 10354
Medical and dental (MampD) London weighting
4 This index is calculated as the ratio of the average hospital paybill of these staff groups in 2008-09 including London weighting to the average paybill excluding the London weighting
5 Provider A has no sites located within London and therefore receives a weighting of 100
Buildings Index
6 The Buildings Index is calculated in the same way as the Staff Index
Sites PCT area Building Index Activity 1 Y 09497 89 2 Z 09693 11
7 The calculation is thus
(08909497) + (01109693) = 09519
Land Index
8 The index value of the Provider A estate is 15374
Overall Index
9 The 4 components are combined using the breakdown of national expenditure between staff buildings land and other costs The latter is assumed not to vary across the country
PbR and the Market Forces Factor (MFF) in 2013-14 Page 21 of 28
Gateway Ref 18768
Index HCHS Expenditure Index Value Weighted Index (a) (b) (c) = (a)(b)
Staff 549 10354 05684 MampD 139 10000 01390 Buildings 27 09519 00257 Land 04 15374 00061 Other 281 10000 02810
index value is the same for all trusts
10 This gives an overall target MFF value of 05684 + 01390 + 00257 + 00061 + 02810 = 10203
11 This above value is the underlying index value for Provider A This index is centred around 1 To ensure that all trusts receive non-negative payment of the MFF the underlying index is converted to a payment index with a minimum value of 1
12 To set the minimum of the payment index to 1 the underlying index with an average of 1 is divided through by the minimum value In 2013-14 the minimum value is 09263 The final MFF value for Provider A to be used for payment is thus
102209263 = 11033
PbR and the Market Forces Factor (MFF) in 2013-14 Page 22 of 28
Gateway Ref 18768
Annex D ndash Reference Cost Index (RCI)
1 The RCI is an index of the relative cost efficiency of NHS organisations The RCI is adjusted by the MFF to ensure a fair comparison between organisations across England
2 For the RCI to be comparable year-on-year the index must have an average of 100 To ensure this the application of the MFF to reference costs must be cost neutral ie the total national value of Reference Costs submitted must be the same whether it includes or excludes the MFF To obtain cost neutrality the underlying MFF is scaled The extent of this scaling depends on the percentage difference between the quantum of Reference Costs prior to the application of MFF and after it
3 The following example shows how the MFF is used to calculate the MFF-adjusted RCI Table 1 shows how the underlying MFF is scaled so that the total quantum of Reference Costs is kept constant at pound4500 This is necessary to ensure the national average RCI is 100 The factor used to scale the underlying MFF is the percentage difference between Reference Costs prior to the application of the MFF and after its application (sum of column C divided by sum of column B)
PbR and the Market Forces Factor (MFF) in 2013-14 Page 23 of 28
Gateway Ref 18768
Table 1 Scaled MFF for RCI
A B C = B A D = A sum (C) sum (B) E = B D
Underlying MFF
Total Reference Costs Quantum (pound)
Total RC Quantum adjusted for underlying MFF (pound) Scaled MFF
Total RC Quantum adjusted for scaled MFF (pound)
Provider A 10249 1250 1220 09622 1299 Provider B 11021 1000 907 10346 967 Provider C 13349 1000 749 12532 798 Provider D 09270 1250 1348 08703 1436
4500 4225 4500
4 Table 2 shows that without the scaling of the MFF the average of RCI does not equal 100 (compare the averages of columns J and L) Having the average RCI at 100 allows easy comparison of providerrsquos relative efficiency year on year Irrespective of whether the average is 100 (and any scaling) a providerrsquos index value is always the same relative to the average For example Provider D is always 22 above average
From column L [(122 ndash 100) 100] 100 = 22 From column J [(115 ndash 94) 94] 100 = 22
PbR and the Market Forces Factor (MFF) in 2013-14 Page 24 of 28
Gateway Ref 18768
Table 2 Average RCI kept at 100
F G
H = (F G)100 I = A J = H I K = D L = H K
Actual Total Cost (pound)
Expected Total Cost (pound)
Base RCI
Underlyi ng MFF
MFF adjusted RCI (based on underlying MFF)
Scaled MFF
MFF adjusted RCI (based on scaled MFF)
Provider A
1250
1300 96 10249 94 09622 100 Provider B
1000
925 108 11021 98 10346 104 Provider C
1000
1100 91 13349 68 12532 73 Provider D
1250
1175 106 09270 115 08703 122 Average 100 94 100
(RCI figures to the nearest integer)
PbR and the Market Forces Factor (MFF) in 2013-14 Page 25 of 28
Gateway Ref 18768
Annex E ndash Tariff Calculation
1 Table 3 gives an example calculation of the tariff for an HRG The underlying MFF is rebased so that the minimum value is 1 (column D) by dividing the index through by the 2013-14 minimum value of 09263 Total costs are then divided by these MFF values (column E) The income for a provider is then the product of tariff price activity and rebased MFF (column F)
Table 3 Rebasing MFF for Tariff Calculation
A B C D = C min C
E = B D F = Tariff A D
Activity Total Costs (pound)
Underlying MFF
Rebased MFF to 1
Total Costs adjusted for rebased MFF (pound)
PbR Income (pound)
Provider A Provider
60 1250 10249 11064 1130 1528
B Provider
50 1000 11021 11898 840 1369
C Provider
20 1000 13349 14411 694 663
D 40 1250 09263 1 1250 921 Total 170 4500 3913 4483
Tariff = Total costs adjusted for MFF National activity = sum of column E sum of column A
= pound3913 170 = pound2302
PbR and the Market Forces Factor (MFF) in 2013-14 Page 26 of 28
Gateway Ref 18768
2 Table 4 shows the relative difference between providers A and B for the underlying and rebased (payment) index As is shown irrespective of the index the MFF of Provider B is always 753 greater than that of Provider A This relationship is true for all providers the relativities between providers is the same regardless of how the underlying MFF is scaled
Table 4 Relative differences between providers A amp B
X Y Z = ( Y X )-1
Provider Provider MFF Indices A B Difference Underlying (col C) 10249 11021 753 Rebased to 1 (col D) 11064 11898 753
PbR and the Market Forces Factor (MFF) in 2013-14 Page 27 of 28
Gateway Ref 18768
Annex F ndash Creating an index
1 An index is a ranking of numbers relative to the same base such that they can be directly compared
2 In the example below an index value can be attached to each of the numbers in column A An index is constructed by dividing each number by the base value of the index In common with the MFF the first index created is in column B which has an average value of 10 like the underlying MFF index This index is constructed by dividing each number by the average of the index 100
Values Index with an average of 1
Index with a minimum of 1
A B C 50 050 100 95 095 190 125 125 250 130 130 260 100 100 200
Average value 100 Minimum value 50
3 The index in column B represents a ranking relative to the average value in the list The average of the values in column a is 100 The value 50 in column A is half of the average so as a relative value 50 can be expressed as 05
4 Column C represents the transformation of the index to have a minimum value of 1 akin to the payment index 50 is the lowest of all the values in column A and so in the index in column C it has a value of 10
5 As stated in the guidance irrespective of the version of the MFF index the relative unavoidable cost differences between organisations are maintained In the example above it can be seen that the relative difference between the values 50 and 100 of column A is the same in both columns B and C ie 05 is half of 10 and 10 is half of 20 This also holds for every other combination of values For example 50 is 04 times small than 125 In columns B and C the relative difference in the associated index values is also 04 (050 125 = 04) and (10 25 = 04)
PbR and the Market Forces Factor (MFF) in 2013-14 Page 28 of 28
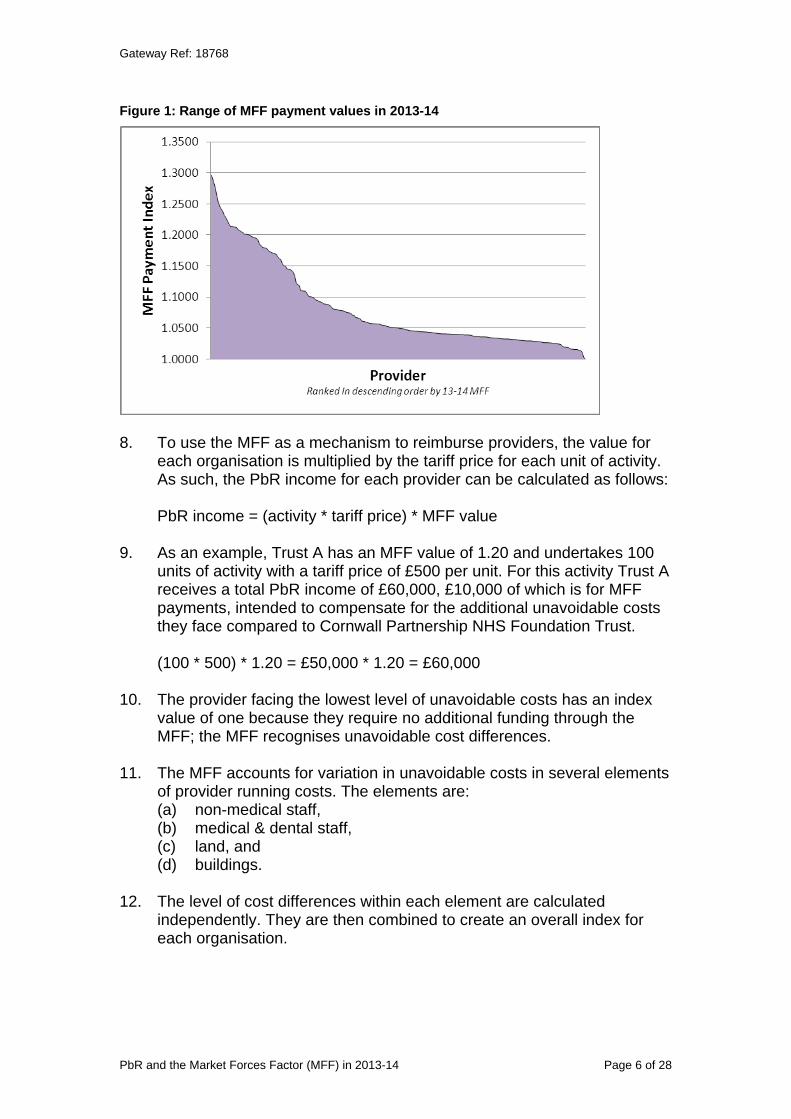
Gateway Ref 18768
Figure 1 Range of MFF payment values in 2013-14
8 To use the MFF as a mechanism to reimburse providers the value for each organisation is multiplied by the tariff price for each unit of activity As such the PbR income for each provider can be calculated as follows
PbR income = (activity tariff price) MFF value
9 As an example Trust A has an MFF value of 120 and undertakes 100 units of activity with a tariff price of pound500 per unit For this activity Trust A receives a total PbR income of pound60000 pound10000 of which is for MFF payments intended to compensate for the additional unavoidable costs they face compared to Cornwall Partnership NHS Foundation Trust
(100 500) 120 = pound50000 120 = pound60000
10 The provider facing the lowest level of unavoidable costs has an index value of one because they require no additional funding through the MFF the MFF recognises unavoidable cost differences
11 The MFF accounts for variation in unavoidable costs in several elements of provider running costs The elements are (a) non-medical staff (b) medical amp dental staff (c) land and (d) buildings
12 The level of cost differences within each element are calculated independently They are then combined to create an overall index for each organisation
PbR and the Market Forces Factor (MFF) in 2013-14 Page 6 of 28
Gateway Ref 18768
Background
13 The Market Forces Factor (MFF) was initially used in allocating resources for commissioners to use in commissioning healthcare services for their population Inclusion of the MFF is intended to ensure commissioners can afford the same level of care for their population where healthcare costs differ between geographical areas Accounting for the MFF means that commissioners receive different levels of funding not only dependent on the size and needs of their population but also the varying costs of services in different areas Commissioners in higher cost areas receive additional funding to ensure they can afford the same level of services relative to need as those in other areas
14 Commissioners pay a fixed national price for activity within the scope of the national tariff The price for each unit of activity is intended to cover the cost of service provision To calculate appropriate prices the tariff is based on national average costs reported by every NHS trust However some elements of costs vary by locality such variation means that a national price based on national average costs does not fairly reflect the costs of providers in all locations
15 The costs that vary by location are those subject to high competition notably from outside the NHS land is an example Other costs do not vary by locality all organisations face the same unit price for costs such as equipment and consumables
16 Trusts in areas with higher unavoidable costs require greater compensation to undertake activity comparable with a provider operating in a lower cost area As such commissioners from higher cost providers need more funding to afford services of equivalent quality and quantity The approach used to target funding to higher cost areas is the MFF
17 The Advisory Committee on Resource Allocation (ACRA) oversees the development of the allocation formula including the MFF element The application of the MFF to PbR is explicitly considered in any developments
PbR and the Market Forces Factor (MFF) in 2013-14 Page 7 of 28
Gateway Ref 18768
Unavoidable costs
18 lsquoUnavoidable costsrsquo is the term used to refer to the costs that providers are unable to significantly influence The level of these costs varies across the country Land buildings and staff costs all include unavoidable elements
19 Consider that hospitals are required in certain locations to serve given local populations Trusts can choose their location within this defined area but are confined within a specific region they must face the costs associated with this location For example hospitals that must be located in central London will face higher unavoidable costs than hospitals located in outer London
20 The differences in unavoidable costs that hospitals face need to be reflected in funding A trust facing unavoidable costs 20 greater than a provider located elsewhere should receive 20 additional funding The MFF is used to determine the differences in unavoidable costs between organisations such that each can be fairly reimbursed
21 The MFF compares the unavoidable costs between organisations and ranks them according to the relative level of unavoidable costs they face This is demonstrated diagrammatically in figure 2 Trust C is the lowest cost provider trust B faces unavoidable costs 5 greater than C and trust A faces costs 26 higher than C The MFF payment index used in PbR uses values to enable comparison between each provider relative to the lowest cost provider
Figure 2 Comparison of relative trust MFF values
Provider B (MFF = 105)
Provider C (MFF = 100)
Provider A (MFF = 126)
Provider A faces 20 higher unavoidable costs
than Trust B
Provider B faces 5 higher unavoidable costs
than Trust C
Provider A faces 26 higher unavoidable costs than provider C
22 As figure 3 illustrates given the relativities between trusts A and C and B and C the cost variation between providers A and B can be determined provider A faces unavoidable costs 20 higher than B
Difference in unavoidable costs = [(126-105)105] 100 = 20
PbR and the Market Forces Factor (MFF) in 2013-14 Page 8 of 28
Gateway Ref 18768
Application of the MFF within PbR
23 There are two versions of the MFF index (a) underlying index and (b) payment index
24 Both of these indices are based on the same set of data To use this data for different purposes it is transformed into different indices An index is a series of values all relative to the same base value By having a different base the index can be used in different ways
Underlying Index
25 The underlying index is the version first calculated and used to inform CCG allocations The underlying version is set so that the base to which all values in the index are relative is the average value The underlying index has an average value of 10 Organisations facing higher (lower) unavoidable costs than the average organisation have a value greater (less) than 10
26 The underlying index is also used in the calculation of the Reference Cost Index (RCI) See Annex D for further details and a worked example
Payment Index
27 The payment index is the version used for the national tariff This version of the index is set so that the base to which all values are relative is the minimum rather than the average The payment index has a minimum value of 10 The organisation with the value of 10 faces the lowest unavoidable costs Organisations with a value greater than 10 face higher costs than the minimum organisation For example an organisation with an index value of 102 is estimated to face unavoidable costs 2 greater than the lowest cost provider
28 The reason for creating an index with a base that is a minimum of 10 is to facilitate the PbR funding policy of a single national price To achieve this all providers must receive this price and then be compensated separately for the unavoidable costs they face If the MFF index used in PbR was the underlying version then the tariff price would include the level of unavoidable costs in the middle of the range of all providers Providers with lower unavoidable costs would be paid less than the tariff price after the application of the MFF
29 As suggested above use of the payment index separates avoidable and unavoidable costs The tariff reimburses the costs that all providers incur and the MFF separately compensates those facing more than the minimum level of unavoidable costs
PbR and the Market Forces Factor (MFF) in 2013-14 Page 9 of 28
Gateway Ref 18768
30 In practice the payment index is created by transforming the underlying index rather than going back to the base data The payment index is created by dividing each value in the underlying index by the minimum value This creates an index with a base of 10
31 Transforming the index means that a single provider has a different value in the underlying and payment index Despite this the relativities between providers are the same For example consider two trusts A and B If trust A is estimated to face unavoidable costs 15 higher than trust B then the MFF value of trust A will be 15 higher than that for trust B irrespective of which index is used (see Annex G for a more detailed explanation)
32 To apply the MFF for reimbursement tariff prices have to be adjusted to account for variation in unavoidable costs The stages in applying the MFF for PbR are outlined below
Tariff calculation
33 The MFF is used in the calculation of the national tariff For each HRG and admission type the tariff is based on the national average cost of the service Before determining the national average each providerrsquos unit costs are divided by their corresponding payment MFF value This is done for two reasons
34 Firstly it removes any bias of providing activity in higher cost areas For example suppose 80 of activity of an HRG is provided in a high cost area such as London and the remaining 20 is provided in a relatively low cost area such as Cornwall Without the removal of the MFF the tariff price would be biased upwards because of the London activity
35 Secondly dividing through by the MFF means that there is one national price (tariff) for services Providers are compensated separately for the unavoidable costs they incur in providing activity See the next sub-section for more detail
36 A worked example of the application of the MFF in tariff calculation is included in Annex C
MFF for payment
37 As stated above the tariff price of an HRG is based on the national average of costs reported by hospitals having adjusted for unavoidable cost differences above the minimum To compensate providers for their unavoidable cost pressures the MFF is applied as a proportion of the tariff price paid in addition to the tariff on each unit of activity
38 The tariff price includes the lowest possible level of unavoidable costs that an NHS organisation faces The lowest cost provider receives no additional funding for their activity All other providers receive an
PbR and the Market Forces Factor (MFF) in 2013-14 Page 10 of 28
Gateway Ref 18768
additional proportion of the tariff price as compensation for their unavoidable costs
39 The MFF is applied to a trust for a single HRG as follows
Total income = (Activity Tariff price) MFF value
40 Example 100 units of activity for HRG A are undertaken by Trust X The tariff price of HRG A is pound500 the trust has an MFF value of 120
Total income = 100 pound500 120 = pound60000
ie Trust X receives an extra pound10000 as a result of higher unavoidable costs than the lowest cost provider
Components of the MFF
41 The components of running costs considered to vary across the country are compensated for using the MFF The relative differences for each component cost are captured in separate indices Each component cost index is then aggregated into an overall MFF index to create the underlying index The components are described below See Annex A for an overview of the composition of the MFF
Staff index
42 The staff index applies to all non-medical NHS staff Unavoidable variation in staff costs arise because national pay scales implemented by the NHS (including regional pay allowances) do not fully reflect the variation in employment costs evident in the broader labour market If wages do not reflect the going rate for an area then this can lead to indirect costs such as greater use of agency staff and higher vacancy and turnover rates It can also lead to differences in staff productivity
43 The staff index is based on variation in wages in the private sector Annex B provides further information of the reasoning behind this approach The data source for the index is the Annual Survey of Hours and Earnings (ASHE) produced by the Office for National Statistics For 2011-12 onwards updated and more robust earnings data has been used (from the years 2007-2009)2
44 The staff index is based on the pattern of wages calculated within defined geographical ares (currently the previous PCT boundaries) and is intended to reflect local labour market conditions As trusts do not only employ staff from the geographical area in which their sites are located
2 For further information please see the HERU report lsquoThe Staff Market Forces Factor Component of the Resource Allocation Weighted Capitation Formula New estimatesrsquo httpwwwdhgovukprod_consum_dhgroupsdh_digitalassetsdocumentsdigitalassetdh_1 22621pdf
PbR and the Market Forces Factor (MFF) in 2013-14 Page 11 of 28
Gateway Ref 18768
the first stage is to smooth3 the variation in wage levels between areas to take into account the different labour market conditions in the areas A second stage of smoothing called interpolation4 undertaken at trust site level is used to take into account the precise location of trustsrsquo sites within an area and thus their distance from other areas Annex B outlines the smoothing and interpolation techniques
45 Interpolation is not used in the calculation of MFF values for Community Trusts As these trusts have taken over the services previously provided by PCTs activity will be spread across the catchment area of the trust and so it would not be appropriate to attribute all of the unavoidable cost differences to the location of the Head Quarters of the Community Trust Instead for newly created Community Trusts (ie those that have not merged with acute trusts) the staff MFF is calculated to reflect the full catchment area of the trust based on the previous PCTsrsquo MFFs
46 The values of the underlying staff index range between 08746 and 12340
Medical amp Dental (MampD) London Weighting
47 Analysis determined that medical staff costs do not vary in the same way as those of other staff groups5 Medical staff costs are however significantly higher in London than the rest of the country the MampD London weighting is required to compensate for this difference
48 The MampD London weighting is applied to trusts in London and is calculated as the ratio of the average paybill per head for hospital doctors in 2008-09 nationally to the average paybill per head excluding London This ratio is 10224 and trusts within what was London SHA receive this value all other trusts receive an MampD value of 10
Buildings index
49 The cost of buildings includes an unavoidable element because as an asset buildings have different worth in different parts of the country In an area where a building is worth more the trust will pay more in capital charges on this asset relative to a trust located in a lower cost area
50 The buildings index remains based on PCT geography The Building Cost Information Service (BCIS) analysed tender prices for public and private contracts between January 2007 and June 2010 to derive
3 smoothing is a form of weighted averages 4 Interpolation is a technique using two or more values to create an intermediate value 5 Both RARP 31 and 32 draw this conclusion RARP 31 Review of Specific Cost Approach to Market Forces Factor RARP 32 Review of the Market Forces Factor following the introduction of Payment by Results (2005) Exploring the General Labour Market Method httpwwwdhgovukenManagingyourorganisationFinanceandplanningAllocationsDH_410
PbR and the Market Forces Factor (MFF) in 2013-14 Page 12 of 28
8515
Gateway Ref 18768
location factors Average location factors for the period are provided for each PCT area Each trustrsquos buildings value is determined by the PCT area in which they are located To create the buildings index the location factors were divided by the mean value weighted by population A trust sites buildings index is determined by the PCT area where it is located An average of the site indices weighted by available bed numbers is used to provide the trust buildings index For Community Trusts population rather than bed numbers is used as the basis for averaging across PCT areas
51 The values of the buildings index range between 089 and 128
Land index
52 Land costs include unavoidable costs for two reasons (a) it cost trusts more to acquire land in certain areas of the country
relative to others and (b) the capital charges paid on this land will also be higher
53 The land index unlike the other indices is specific to each individual trust The only exception is Community Trusts which were formed to take over the provider functions of PCTs Their land index value is based on the previous PCT index values
54 A land index based on land value per hectare is calculated for each NHS Trust using net book value of land at 31 March 2009 as reported in the audited summarisation schedules 2008-09 The land areas for each individual trust were aggregated from the site level data available in the 2008-09 Estates Return Information Collection (ERIC)
55 Whilst it would be possible to use average land values for pre-defined geographic areas two drawbacks of this approach make the chosen method appropriate Firstly land prices are subject to variation within small geographic areas and secondly trusts have to pay capital charges relating specifically to the land value for the trust
56 The land index has the biggest range the lowest value is 0016 the maximum is 19550 representing a 1200-fold difference Given the gap between the lowest and highest values the land index for providers with high values has a significant impact on their overall MFF value This is in spite of the small proportion of costs that land accounts for (see creating the MFF section) The land component can often explain differences between index values of organisations
57 London Trusts that have a significant non-London site have a land index for each site weighted together in proportion to the 2004 VOA value and the share of available beds at each site The use of available beds recognises that land is typically used more intensively in central London compared to less urban areas
PbR and the Market Forces Factor (MFF) in 2013-14 Page 13 of 28
Gateway Ref 18768
Other
58 The category of ldquootherrdquo costs is included as an additional factor in the final MFF value The costs included in this element are all those that are not considered to vary by location As these costs do not vary by provider all organisations receive a value of 1 in relation to these costs
59 It is necessary for non-varying costs to be represented in the overall value as the MFF is applied to the full scope of costs not just those with elements that vary by area The MFF is a percentage of the tariff price As the tariff is based on total running costs per unit of activity the MFF must therefore reflect all components of costs that drive the price
Changes to the MFF 2013-14
60 There have been no changes to the source data for the MFF for 2013-14 the 2012-13 MFF has been rolled forward
61 PCTs ceased providing services in 2012-13 and will cease their commissioning functions in 2013-14 For the purposes of PbR the provider functions of PCTs have transferred to new or existing trusts and MFF values have been affected as follows Where the provider functions of PCTs have been transferred into
new Trusts the relevant previous PCT MFF values have been used to calculate an appropriate MFF value
Where other acute trusts have taken over PCT provider functions the MFF value of the acute Trust remains unchanged
Creating the MFF
62 The overall MFF value for each organisation is a combination of the components outlined above The elements are combined according to the proportion of total running costs that they account for This value is determined based on national proportions of expenditure on each component of the MFF reported in NHS accounts The proportion attributable to each element of the MFF is outlined below
Staff 549 MampD London Weighting 139 Buildings 27 Land 04 Other 281
63 To create an overall MFF value for an organisation the index value for each element of the MFF is multiplied by its proportion of total running costs This approach applies a weight to each element of the MFF equal to its weight within total costs The weighted index values are then
PbR and the Market Forces Factor (MFF) in 2013-14 Page 14 of 28
Gateway Ref 18768
summed together to give an overall figure for the organisation6 See Annex C for a worked example of the calculation for a trust with multiple sites
Deriving an MFF value for newly merged trusts
64 Organisations that merge will have a new MFF value calculated in line with the MFF methodology For organisations merging at the beginning of the financial year this new MFF will apply from the date of the merger For organisations merging in the middle of the financial year the new MFF will apply from the beginning of the following financial year (see PbR Guidance for full policy)
65 The methodology means that each site of a merging trust will be treated not as a proportion of the trust to which it previously belonged but as a proportion of the merged organisation as a whole This is necessary as the staff and buildings components of the MFF are defined at site level The site index values are combined according to their activity levels proxied by bed numbers as per the calculation of multiple site organisations (see Annex C for worked example)
66 In some instances it may be necessary to make further adjustments to the calculation of the merged land index value Where merging trusts have very different land index values and also vary significantly in the intensity of land use the individual land index values will be combined according to trust activity levels (proxied by bed numbers) This is in line with the method used for the staff and buildings components of the MFF and acts as an extension of the adjustments already in place to recognise the differing land use intensities for London trusts with significant sites out of London
Capping policy
67 A capping policy was introduced in 2009-10 to reduce volatilities in overall PbR income resulting from any changes in the MFF values It meant that given changes to the tariff providerrsquos overall income should not change by more than +-2 as a result of using the updated MFF as opposed to using the previous years MFF In 2013-14 all organisations will have moved to their target MFF values and are no longer subject to the capping policy The 2013-14 tariff information spreadsheet includes details of the past capped payment values for each trust
6 The impact of a single overall MFF value on an organisationsrsquo income is equal to the impact of applying the index value for each element separately to the proportion of costs it represents
PbR and the Market Forces Factor (MFF) in 2013-14 Page 15 of 28
Gateway Ref 18768
Annex A ndash Composition of MFF
MFF Index
(549) (139) (04) (27) (281)
Land BuildingsStaff OtherMampD
Data Evaluated at PCT level Applied to London Valuations specific to Evaluated at PCT level and assigned to trust trusts only trustsrsquo estates and assigned to trust Level
sites relative to national sites
Variation in private Land net book values Evidence sector wages Average paybill for (2008-09) and Estates Three year Assumed not to Base
(University of Warwick hospital doctors Return Information average of tender vary in any developments by 2008-09 Collection (2008-09) prices material way
HERU)
1 The index values of each of the four component indices (staff MampD land and buildings) are multiplied by the corresponding expenditure weight to give the overall MFF value A worked example is included in Annex C
PbR and the Market Forces Factor (MFF) in 2013-14 Page 16 of 28
Gateway Ref 18768
Annex B - The Staff Index
1 This annex outlines (a) Rationale for basing the staff index on private sector rather than
NHS wages (b) The application of smoothing and interpolation and (c) Rationale for the introduction of the Medical amp dental London
weighting
Underlying data for the staff index
1 The staff element of the MFF is the largest component Although the staff index is intended to reflect non-medical NHS staff cost variations it is based on private sector rather than NHS wages The rationale for this approach generates many queries
2 The aim of the MFF is to compensate for unavoidable cost differences between providers in the delivery of services For staff expenditure variation can occur directly or indirectly direct costs are the salaries paid to staff indirect costs include expenditure incurred through labour turnover agency staff costs vacancies and reduced productivity
3 High indirect costs of employment can arise for NHS providers where the wage rate they offer is below the prevailing wage rate of the area from which they draw their staff Organisations offering relatively low wages are likely to experience higher vacancy and turnover rates relative to other employers Lower wages are also associated with lower staff productivity Research commissioned by DH7 found evidence of these outcomes in a study into the variation in wages across NHS organisations
4 Geographical variation in staff costs can be determined in two ways using NHS employment costs or private sector wages as is the convention for the MFF A brief overview of each approach is set out below
Basing the MFF on NHS staff costs
5 Whilst it would be possible to base the staff index on actual NHS costs several problems with the approach make its use inappropriate Research commissioned8 by DH confirmed the arguments against the use of this method
7 RARP 32 Review of the Market Forces Factor following the introduction of Payment by Results (2005) Exploring the General Labour Market method httpwwwdhgovukenManagingyourorganisationFinanceandplanningAllocationsDH_410 8515 8 RARP 31 Review of the Specific Cost Approach to Market Forces Factor httpwwwdhgovukenManagingyourorganisationFinanceandplanningAllocationsDH_410 8515
PbR and the Market Forces Factor (MFF) in 2013-14 Page 17 of 28
Gateway Ref 18768
6 Lack of national data availability Although it is straightforward to obtain information about high level direct employment costs within the NHS there is currently limited availability of consistent detailed data on employment costs
7 Distinguishing between avoidable and unavoidable costs Where organisations incur greater than average costs it is almost impossible to distinguish between avoidable and unavoidable components of expenditure For example by dividing the MFF range into quintiles of trusts and controlling for trust type and location there is 35 variation in the number of nurses needed for the same output between quintile 1 and 5 It is unclear whether the reasons for this variation are caused by drivers of avoidable or unavoidable costs
8 Possibility of perverse incentives Using actual NHS costs any relative changes in NHS staff costs would feed directly into the MFF calculation any trust with higher relative costs would then receive a greater staff index value when the MFF is re-calculated This issue creates an incentive for trusts to raise their indirect staff costs which would increase the staff component of their MFF (assuming that not all trusts did this thereby leaving relative wage rates unchanged) resulting in greater income from the tariff
9 Reduced incentives to improve efficiency Trusts using staff more efficiently will face lower staff costs relative to those with less efficiency When the MFF is next calculated lower staff costs would be reflected in a lower MFF value and therefore a reduced (and relatively lower) tariff income Using the NHS staff costs approach the incentives to improve efficiency under PbR would be reduced
10 In light of these issues the research confirmed that the current approach using external wage comparisons to determine differences in staff costs is appropriate
Basing the MFF on external wage comparisons
11 Basing the staff index on private sector wages was the approach recommended by the University of Warwick The original argument was conceptual but supporting evidence is now available from work commissioned by DH
12 The premise of the approach is that the private sector does not implement national pay scales and as such wages offered reflect the cost of living and amenities in that area These factors are the key drivers of relative differences in pay
13 It would not be fair to simply take the actual average private sector wage in each area This is because occupational mix varies Some areas have a much higher proportion of staff working in highly paid occupations such as law and banking These differences need to be taken into account in
PbR and the Market Forces Factor (MFF) in 2013-14 Page 18 of 28
Gateway Ref 18768
the MFF in order to ensure that we are making like for like comparisons across the country Warwick do this using a statistical technique known as regression analysis It essentially works out what wages would be in an area if each area had the same mix of occupations We similarly take account of differences in the age and gender mix of the private sector workforce in different areas
14 The staff index compensates trusts for the unavoidable variation in direct staff costs and indirect employment costs arising where NHS wages do not reflect the local market rate
15 To test for evidence of indirect employment costs the Health Economics Research Unit (HERU) commissioned by DH determined the relationship between vacancy rates and the gap between NHS and private sector wages for different staff groups For nurses the evidence illustrates that vacancy rates are higher where the gap between NHS wages and private sector wages are greater
16 The Department of Health and the Department of Communities and Local Government have undertaken a number of reviews of the approach to compensating for unavoidable differences in staff costs Both Departments concluded that this approach to the MFF continues to be the best available methodology
Smoothing and Interpolation
17 Smoothing and interpolation are two approaches used to refine the staff MFF index values so that the values for each organisation better reflect the local labour markets from which they recruit
Smoothing
18 The methodology of the staff index creates the cliff edge problem whereby neighbouring PCTs receive markedly different staff cost values because of their geographical boundaries Cliff edges may lead to an inaccurate representation of staff costs faced by a provider This problem is particularly evident for providers within different PCTs but in close proximity and facing similar local labour market pressures Smoothing techniques soften cliff edges to produce a more continuous profile of staff costs across PCTs
19 HERU recommended that smoothing take into account the relative staff index of every PCT rather than just neighbouring ones as previously This approach recognises that NHS organisations draw their labour force from a variety of PCT areas Smoothing adjusts the relative level of staff index in a PCT by accounting for relative staff index in surrounding PCTs The weights of the relative costs in surrounding areas fall the further the distance from the base PCT Smoothing brings each PCTrsquos MFF more in line with those of its surrounding PCTs
PbR and the Market Forces Factor (MFF) in 2013-14 Page 19 of 28
Gateway Ref 18768
Interpolation
20 The smoothed relative costs for PCTs described above still result in cliff edges between trusts Two trusts operating near the border of neighbouring PCTs might have different relative staff costs but operate in the same labour market As a result HERU introduced a further refinement to smoothing interpolation
21 Interpolation takes account of the location within a PCT area of the trustsrsquo sites and thus the distance from other PCT areas It involves a second stage of smoothing carried out at trust level after smoothing at PCT level and further reduces the impact of cliff edges It works the same way as smoothing in that the staff index of a trust is the distance weighted average of the surrounding PCTsrsquo staff indices
22 Interpolation is carried out at trust site level Where a trust has more than one site the different indices for each site are weighted together in proportion to activity using bed numbers as a proxy on each site
Medical and Dental (MampD) London Weighting
23 The scope of the staff component of the MFF has been progressively expanded and since 2003-4 has included the whole workforce The research by HERU found no supporting evidence for the application of the staff MFF to doctors As such the coverage of the staff index was reduced in 2009-10 and a new element the Medical and Dental London Weighting is incorporated The MampD weighting reflects the greater cost of these employees in London relative to the rest of the country
24 HERU determined that pay setting mechanisms between medical and non-medical staff differ negating the need to apply the staff index to medical staff Although there is no national variation in medical staff costs there is a significant difference in the costs of doctors in London relative to the rest of the country As such a weighting for medical and dental staff is applied to trusts in London
PbR and the Market Forces Factor (MFF) in 2013-14 Page 20 of 28
Gateway Ref 18768
Annex C ndash Worked example calculation of MFF
1 This worked example shows the calculation of the MFF for Provider A
Staff Index
2 The staff index for a hospital trust is calculated based the staff index values for individual trusts There are two sites to Provider A These are in the locality of PCT Y and PCT Z
Sites PCT area Staff Index Activity 1 Y 10385 89 2 Z 10101 11
3 Staff MFF for Provider A is thus
(08910385) + (01100101) = 10354
Medical and dental (MampD) London weighting
4 This index is calculated as the ratio of the average hospital paybill of these staff groups in 2008-09 including London weighting to the average paybill excluding the London weighting
5 Provider A has no sites located within London and therefore receives a weighting of 100
Buildings Index
6 The Buildings Index is calculated in the same way as the Staff Index
Sites PCT area Building Index Activity 1 Y 09497 89 2 Z 09693 11
7 The calculation is thus
(08909497) + (01109693) = 09519
Land Index
8 The index value of the Provider A estate is 15374
Overall Index
9 The 4 components are combined using the breakdown of national expenditure between staff buildings land and other costs The latter is assumed not to vary across the country
PbR and the Market Forces Factor (MFF) in 2013-14 Page 21 of 28
Gateway Ref 18768
Index HCHS Expenditure Index Value Weighted Index (a) (b) (c) = (a)(b)
Staff 549 10354 05684 MampD 139 10000 01390 Buildings 27 09519 00257 Land 04 15374 00061 Other 281 10000 02810
index value is the same for all trusts
10 This gives an overall target MFF value of 05684 + 01390 + 00257 + 00061 + 02810 = 10203
11 This above value is the underlying index value for Provider A This index is centred around 1 To ensure that all trusts receive non-negative payment of the MFF the underlying index is converted to a payment index with a minimum value of 1
12 To set the minimum of the payment index to 1 the underlying index with an average of 1 is divided through by the minimum value In 2013-14 the minimum value is 09263 The final MFF value for Provider A to be used for payment is thus
102209263 = 11033
PbR and the Market Forces Factor (MFF) in 2013-14 Page 22 of 28
Gateway Ref 18768
Annex D ndash Reference Cost Index (RCI)
1 The RCI is an index of the relative cost efficiency of NHS organisations The RCI is adjusted by the MFF to ensure a fair comparison between organisations across England
2 For the RCI to be comparable year-on-year the index must have an average of 100 To ensure this the application of the MFF to reference costs must be cost neutral ie the total national value of Reference Costs submitted must be the same whether it includes or excludes the MFF To obtain cost neutrality the underlying MFF is scaled The extent of this scaling depends on the percentage difference between the quantum of Reference Costs prior to the application of MFF and after it
3 The following example shows how the MFF is used to calculate the MFF-adjusted RCI Table 1 shows how the underlying MFF is scaled so that the total quantum of Reference Costs is kept constant at pound4500 This is necessary to ensure the national average RCI is 100 The factor used to scale the underlying MFF is the percentage difference between Reference Costs prior to the application of the MFF and after its application (sum of column C divided by sum of column B)
PbR and the Market Forces Factor (MFF) in 2013-14 Page 23 of 28
Gateway Ref 18768
Table 1 Scaled MFF for RCI
A B C = B A D = A sum (C) sum (B) E = B D
Underlying MFF
Total Reference Costs Quantum (pound)
Total RC Quantum adjusted for underlying MFF (pound) Scaled MFF
Total RC Quantum adjusted for scaled MFF (pound)
Provider A 10249 1250 1220 09622 1299 Provider B 11021 1000 907 10346 967 Provider C 13349 1000 749 12532 798 Provider D 09270 1250 1348 08703 1436
4500 4225 4500
4 Table 2 shows that without the scaling of the MFF the average of RCI does not equal 100 (compare the averages of columns J and L) Having the average RCI at 100 allows easy comparison of providerrsquos relative efficiency year on year Irrespective of whether the average is 100 (and any scaling) a providerrsquos index value is always the same relative to the average For example Provider D is always 22 above average
From column L [(122 ndash 100) 100] 100 = 22 From column J [(115 ndash 94) 94] 100 = 22
PbR and the Market Forces Factor (MFF) in 2013-14 Page 24 of 28
Gateway Ref 18768
Table 2 Average RCI kept at 100
F G
H = (F G)100 I = A J = H I K = D L = H K
Actual Total Cost (pound)
Expected Total Cost (pound)
Base RCI
Underlyi ng MFF
MFF adjusted RCI (based on underlying MFF)
Scaled MFF
MFF adjusted RCI (based on scaled MFF)
Provider A
1250
1300 96 10249 94 09622 100 Provider B
1000
925 108 11021 98 10346 104 Provider C
1000
1100 91 13349 68 12532 73 Provider D
1250
1175 106 09270 115 08703 122 Average 100 94 100
(RCI figures to the nearest integer)
PbR and the Market Forces Factor (MFF) in 2013-14 Page 25 of 28
Gateway Ref 18768
Annex E ndash Tariff Calculation
1 Table 3 gives an example calculation of the tariff for an HRG The underlying MFF is rebased so that the minimum value is 1 (column D) by dividing the index through by the 2013-14 minimum value of 09263 Total costs are then divided by these MFF values (column E) The income for a provider is then the product of tariff price activity and rebased MFF (column F)
Table 3 Rebasing MFF for Tariff Calculation
A B C D = C min C
E = B D F = Tariff A D
Activity Total Costs (pound)
Underlying MFF
Rebased MFF to 1
Total Costs adjusted for rebased MFF (pound)
PbR Income (pound)
Provider A Provider
60 1250 10249 11064 1130 1528
B Provider
50 1000 11021 11898 840 1369
C Provider
20 1000 13349 14411 694 663
D 40 1250 09263 1 1250 921 Total 170 4500 3913 4483
Tariff = Total costs adjusted for MFF National activity = sum of column E sum of column A
= pound3913 170 = pound2302
PbR and the Market Forces Factor (MFF) in 2013-14 Page 26 of 28
Gateway Ref 18768
2 Table 4 shows the relative difference between providers A and B for the underlying and rebased (payment) index As is shown irrespective of the index the MFF of Provider B is always 753 greater than that of Provider A This relationship is true for all providers the relativities between providers is the same regardless of how the underlying MFF is scaled
Table 4 Relative differences between providers A amp B
X Y Z = ( Y X )-1
Provider Provider MFF Indices A B Difference Underlying (col C) 10249 11021 753 Rebased to 1 (col D) 11064 11898 753
PbR and the Market Forces Factor (MFF) in 2013-14 Page 27 of 28
Gateway Ref 18768
Annex F ndash Creating an index
1 An index is a ranking of numbers relative to the same base such that they can be directly compared
2 In the example below an index value can be attached to each of the numbers in column A An index is constructed by dividing each number by the base value of the index In common with the MFF the first index created is in column B which has an average value of 10 like the underlying MFF index This index is constructed by dividing each number by the average of the index 100
Values Index with an average of 1
Index with a minimum of 1
A B C 50 050 100 95 095 190 125 125 250 130 130 260 100 100 200
Average value 100 Minimum value 50
3 The index in column B represents a ranking relative to the average value in the list The average of the values in column a is 100 The value 50 in column A is half of the average so as a relative value 50 can be expressed as 05
4 Column C represents the transformation of the index to have a minimum value of 1 akin to the payment index 50 is the lowest of all the values in column A and so in the index in column C it has a value of 10
5 As stated in the guidance irrespective of the version of the MFF index the relative unavoidable cost differences between organisations are maintained In the example above it can be seen that the relative difference between the values 50 and 100 of column A is the same in both columns B and C ie 05 is half of 10 and 10 is half of 20 This also holds for every other combination of values For example 50 is 04 times small than 125 In columns B and C the relative difference in the associated index values is also 04 (050 125 = 04) and (10 25 = 04)
PbR and the Market Forces Factor (MFF) in 2013-14 Page 28 of 28
Gateway Ref 18768
Background
13 The Market Forces Factor (MFF) was initially used in allocating resources for commissioners to use in commissioning healthcare services for their population Inclusion of the MFF is intended to ensure commissioners can afford the same level of care for their population where healthcare costs differ between geographical areas Accounting for the MFF means that commissioners receive different levels of funding not only dependent on the size and needs of their population but also the varying costs of services in different areas Commissioners in higher cost areas receive additional funding to ensure they can afford the same level of services relative to need as those in other areas
14 Commissioners pay a fixed national price for activity within the scope of the national tariff The price for each unit of activity is intended to cover the cost of service provision To calculate appropriate prices the tariff is based on national average costs reported by every NHS trust However some elements of costs vary by locality such variation means that a national price based on national average costs does not fairly reflect the costs of providers in all locations
15 The costs that vary by location are those subject to high competition notably from outside the NHS land is an example Other costs do not vary by locality all organisations face the same unit price for costs such as equipment and consumables
16 Trusts in areas with higher unavoidable costs require greater compensation to undertake activity comparable with a provider operating in a lower cost area As such commissioners from higher cost providers need more funding to afford services of equivalent quality and quantity The approach used to target funding to higher cost areas is the MFF
17 The Advisory Committee on Resource Allocation (ACRA) oversees the development of the allocation formula including the MFF element The application of the MFF to PbR is explicitly considered in any developments
PbR and the Market Forces Factor (MFF) in 2013-14 Page 7 of 28
Gateway Ref 18768
Unavoidable costs
18 lsquoUnavoidable costsrsquo is the term used to refer to the costs that providers are unable to significantly influence The level of these costs varies across the country Land buildings and staff costs all include unavoidable elements
19 Consider that hospitals are required in certain locations to serve given local populations Trusts can choose their location within this defined area but are confined within a specific region they must face the costs associated with this location For example hospitals that must be located in central London will face higher unavoidable costs than hospitals located in outer London
20 The differences in unavoidable costs that hospitals face need to be reflected in funding A trust facing unavoidable costs 20 greater than a provider located elsewhere should receive 20 additional funding The MFF is used to determine the differences in unavoidable costs between organisations such that each can be fairly reimbursed
21 The MFF compares the unavoidable costs between organisations and ranks them according to the relative level of unavoidable costs they face This is demonstrated diagrammatically in figure 2 Trust C is the lowest cost provider trust B faces unavoidable costs 5 greater than C and trust A faces costs 26 higher than C The MFF payment index used in PbR uses values to enable comparison between each provider relative to the lowest cost provider
Figure 2 Comparison of relative trust MFF values
Provider B (MFF = 105)
Provider C (MFF = 100)
Provider A (MFF = 126)
Provider A faces 20 higher unavoidable costs
than Trust B
Provider B faces 5 higher unavoidable costs
than Trust C
Provider A faces 26 higher unavoidable costs than provider C
22 As figure 3 illustrates given the relativities between trusts A and C and B and C the cost variation between providers A and B can be determined provider A faces unavoidable costs 20 higher than B
Difference in unavoidable costs = [(126-105)105] 100 = 20
PbR and the Market Forces Factor (MFF) in 2013-14 Page 8 of 28
Gateway Ref 18768
Application of the MFF within PbR
23 There are two versions of the MFF index (a) underlying index and (b) payment index
24 Both of these indices are based on the same set of data To use this data for different purposes it is transformed into different indices An index is a series of values all relative to the same base value By having a different base the index can be used in different ways
Underlying Index
25 The underlying index is the version first calculated and used to inform CCG allocations The underlying version is set so that the base to which all values in the index are relative is the average value The underlying index has an average value of 10 Organisations facing higher (lower) unavoidable costs than the average organisation have a value greater (less) than 10
26 The underlying index is also used in the calculation of the Reference Cost Index (RCI) See Annex D for further details and a worked example
Payment Index
27 The payment index is the version used for the national tariff This version of the index is set so that the base to which all values are relative is the minimum rather than the average The payment index has a minimum value of 10 The organisation with the value of 10 faces the lowest unavoidable costs Organisations with a value greater than 10 face higher costs than the minimum organisation For example an organisation with an index value of 102 is estimated to face unavoidable costs 2 greater than the lowest cost provider
28 The reason for creating an index with a base that is a minimum of 10 is to facilitate the PbR funding policy of a single national price To achieve this all providers must receive this price and then be compensated separately for the unavoidable costs they face If the MFF index used in PbR was the underlying version then the tariff price would include the level of unavoidable costs in the middle of the range of all providers Providers with lower unavoidable costs would be paid less than the tariff price after the application of the MFF
29 As suggested above use of the payment index separates avoidable and unavoidable costs The tariff reimburses the costs that all providers incur and the MFF separately compensates those facing more than the minimum level of unavoidable costs
PbR and the Market Forces Factor (MFF) in 2013-14 Page 9 of 28
Gateway Ref 18768
30 In practice the payment index is created by transforming the underlying index rather than going back to the base data The payment index is created by dividing each value in the underlying index by the minimum value This creates an index with a base of 10
31 Transforming the index means that a single provider has a different value in the underlying and payment index Despite this the relativities between providers are the same For example consider two trusts A and B If trust A is estimated to face unavoidable costs 15 higher than trust B then the MFF value of trust A will be 15 higher than that for trust B irrespective of which index is used (see Annex G for a more detailed explanation)
32 To apply the MFF for reimbursement tariff prices have to be adjusted to account for variation in unavoidable costs The stages in applying the MFF for PbR are outlined below
Tariff calculation
33 The MFF is used in the calculation of the national tariff For each HRG and admission type the tariff is based on the national average cost of the service Before determining the national average each providerrsquos unit costs are divided by their corresponding payment MFF value This is done for two reasons
34 Firstly it removes any bias of providing activity in higher cost areas For example suppose 80 of activity of an HRG is provided in a high cost area such as London and the remaining 20 is provided in a relatively low cost area such as Cornwall Without the removal of the MFF the tariff price would be biased upwards because of the London activity
35 Secondly dividing through by the MFF means that there is one national price (tariff) for services Providers are compensated separately for the unavoidable costs they incur in providing activity See the next sub-section for more detail
36 A worked example of the application of the MFF in tariff calculation is included in Annex C
MFF for payment
37 As stated above the tariff price of an HRG is based on the national average of costs reported by hospitals having adjusted for unavoidable cost differences above the minimum To compensate providers for their unavoidable cost pressures the MFF is applied as a proportion of the tariff price paid in addition to the tariff on each unit of activity
38 The tariff price includes the lowest possible level of unavoidable costs that an NHS organisation faces The lowest cost provider receives no additional funding for their activity All other providers receive an
PbR and the Market Forces Factor (MFF) in 2013-14 Page 10 of 28
Gateway Ref 18768
additional proportion of the tariff price as compensation for their unavoidable costs
39 The MFF is applied to a trust for a single HRG as follows
Total income = (Activity Tariff price) MFF value
40 Example 100 units of activity for HRG A are undertaken by Trust X The tariff price of HRG A is pound500 the trust has an MFF value of 120
Total income = 100 pound500 120 = pound60000
ie Trust X receives an extra pound10000 as a result of higher unavoidable costs than the lowest cost provider
Components of the MFF
41 The components of running costs considered to vary across the country are compensated for using the MFF The relative differences for each component cost are captured in separate indices Each component cost index is then aggregated into an overall MFF index to create the underlying index The components are described below See Annex A for an overview of the composition of the MFF
Staff index
42 The staff index applies to all non-medical NHS staff Unavoidable variation in staff costs arise because national pay scales implemented by the NHS (including regional pay allowances) do not fully reflect the variation in employment costs evident in the broader labour market If wages do not reflect the going rate for an area then this can lead to indirect costs such as greater use of agency staff and higher vacancy and turnover rates It can also lead to differences in staff productivity
43 The staff index is based on variation in wages in the private sector Annex B provides further information of the reasoning behind this approach The data source for the index is the Annual Survey of Hours and Earnings (ASHE) produced by the Office for National Statistics For 2011-12 onwards updated and more robust earnings data has been used (from the years 2007-2009)2
44 The staff index is based on the pattern of wages calculated within defined geographical ares (currently the previous PCT boundaries) and is intended to reflect local labour market conditions As trusts do not only employ staff from the geographical area in which their sites are located
2 For further information please see the HERU report lsquoThe Staff Market Forces Factor Component of the Resource Allocation Weighted Capitation Formula New estimatesrsquo httpwwwdhgovukprod_consum_dhgroupsdh_digitalassetsdocumentsdigitalassetdh_1 22621pdf
PbR and the Market Forces Factor (MFF) in 2013-14 Page 11 of 28
Gateway Ref 18768
the first stage is to smooth3 the variation in wage levels between areas to take into account the different labour market conditions in the areas A second stage of smoothing called interpolation4 undertaken at trust site level is used to take into account the precise location of trustsrsquo sites within an area and thus their distance from other areas Annex B outlines the smoothing and interpolation techniques
45 Interpolation is not used in the calculation of MFF values for Community Trusts As these trusts have taken over the services previously provided by PCTs activity will be spread across the catchment area of the trust and so it would not be appropriate to attribute all of the unavoidable cost differences to the location of the Head Quarters of the Community Trust Instead for newly created Community Trusts (ie those that have not merged with acute trusts) the staff MFF is calculated to reflect the full catchment area of the trust based on the previous PCTsrsquo MFFs
46 The values of the underlying staff index range between 08746 and 12340
Medical amp Dental (MampD) London Weighting
47 Analysis determined that medical staff costs do not vary in the same way as those of other staff groups5 Medical staff costs are however significantly higher in London than the rest of the country the MampD London weighting is required to compensate for this difference
48 The MampD London weighting is applied to trusts in London and is calculated as the ratio of the average paybill per head for hospital doctors in 2008-09 nationally to the average paybill per head excluding London This ratio is 10224 and trusts within what was London SHA receive this value all other trusts receive an MampD value of 10
Buildings index
49 The cost of buildings includes an unavoidable element because as an asset buildings have different worth in different parts of the country In an area where a building is worth more the trust will pay more in capital charges on this asset relative to a trust located in a lower cost area
50 The buildings index remains based on PCT geography The Building Cost Information Service (BCIS) analysed tender prices for public and private contracts between January 2007 and June 2010 to derive
3 smoothing is a form of weighted averages 4 Interpolation is a technique using two or more values to create an intermediate value 5 Both RARP 31 and 32 draw this conclusion RARP 31 Review of Specific Cost Approach to Market Forces Factor RARP 32 Review of the Market Forces Factor following the introduction of Payment by Results (2005) Exploring the General Labour Market Method httpwwwdhgovukenManagingyourorganisationFinanceandplanningAllocationsDH_410
PbR and the Market Forces Factor (MFF) in 2013-14 Page 12 of 28
8515
Gateway Ref 18768
location factors Average location factors for the period are provided for each PCT area Each trustrsquos buildings value is determined by the PCT area in which they are located To create the buildings index the location factors were divided by the mean value weighted by population A trust sites buildings index is determined by the PCT area where it is located An average of the site indices weighted by available bed numbers is used to provide the trust buildings index For Community Trusts population rather than bed numbers is used as the basis for averaging across PCT areas
51 The values of the buildings index range between 089 and 128
Land index
52 Land costs include unavoidable costs for two reasons (a) it cost trusts more to acquire land in certain areas of the country
relative to others and (b) the capital charges paid on this land will also be higher
53 The land index unlike the other indices is specific to each individual trust The only exception is Community Trusts which were formed to take over the provider functions of PCTs Their land index value is based on the previous PCT index values
54 A land index based on land value per hectare is calculated for each NHS Trust using net book value of land at 31 March 2009 as reported in the audited summarisation schedules 2008-09 The land areas for each individual trust were aggregated from the site level data available in the 2008-09 Estates Return Information Collection (ERIC)
55 Whilst it would be possible to use average land values for pre-defined geographic areas two drawbacks of this approach make the chosen method appropriate Firstly land prices are subject to variation within small geographic areas and secondly trusts have to pay capital charges relating specifically to the land value for the trust
56 The land index has the biggest range the lowest value is 0016 the maximum is 19550 representing a 1200-fold difference Given the gap between the lowest and highest values the land index for providers with high values has a significant impact on their overall MFF value This is in spite of the small proportion of costs that land accounts for (see creating the MFF section) The land component can often explain differences between index values of organisations
57 London Trusts that have a significant non-London site have a land index for each site weighted together in proportion to the 2004 VOA value and the share of available beds at each site The use of available beds recognises that land is typically used more intensively in central London compared to less urban areas
PbR and the Market Forces Factor (MFF) in 2013-14 Page 13 of 28
Gateway Ref 18768
Other
58 The category of ldquootherrdquo costs is included as an additional factor in the final MFF value The costs included in this element are all those that are not considered to vary by location As these costs do not vary by provider all organisations receive a value of 1 in relation to these costs
59 It is necessary for non-varying costs to be represented in the overall value as the MFF is applied to the full scope of costs not just those with elements that vary by area The MFF is a percentage of the tariff price As the tariff is based on total running costs per unit of activity the MFF must therefore reflect all components of costs that drive the price
Changes to the MFF 2013-14
60 There have been no changes to the source data for the MFF for 2013-14 the 2012-13 MFF has been rolled forward
61 PCTs ceased providing services in 2012-13 and will cease their commissioning functions in 2013-14 For the purposes of PbR the provider functions of PCTs have transferred to new or existing trusts and MFF values have been affected as follows Where the provider functions of PCTs have been transferred into
new Trusts the relevant previous PCT MFF values have been used to calculate an appropriate MFF value
Where other acute trusts have taken over PCT provider functions the MFF value of the acute Trust remains unchanged
Creating the MFF
62 The overall MFF value for each organisation is a combination of the components outlined above The elements are combined according to the proportion of total running costs that they account for This value is determined based on national proportions of expenditure on each component of the MFF reported in NHS accounts The proportion attributable to each element of the MFF is outlined below
Staff 549 MampD London Weighting 139 Buildings 27 Land 04 Other 281
63 To create an overall MFF value for an organisation the index value for each element of the MFF is multiplied by its proportion of total running costs This approach applies a weight to each element of the MFF equal to its weight within total costs The weighted index values are then
PbR and the Market Forces Factor (MFF) in 2013-14 Page 14 of 28
Gateway Ref 18768
summed together to give an overall figure for the organisation6 See Annex C for a worked example of the calculation for a trust with multiple sites
Deriving an MFF value for newly merged trusts
64 Organisations that merge will have a new MFF value calculated in line with the MFF methodology For organisations merging at the beginning of the financial year this new MFF will apply from the date of the merger For organisations merging in the middle of the financial year the new MFF will apply from the beginning of the following financial year (see PbR Guidance for full policy)
65 The methodology means that each site of a merging trust will be treated not as a proportion of the trust to which it previously belonged but as a proportion of the merged organisation as a whole This is necessary as the staff and buildings components of the MFF are defined at site level The site index values are combined according to their activity levels proxied by bed numbers as per the calculation of multiple site organisations (see Annex C for worked example)
66 In some instances it may be necessary to make further adjustments to the calculation of the merged land index value Where merging trusts have very different land index values and also vary significantly in the intensity of land use the individual land index values will be combined according to trust activity levels (proxied by bed numbers) This is in line with the method used for the staff and buildings components of the MFF and acts as an extension of the adjustments already in place to recognise the differing land use intensities for London trusts with significant sites out of London
Capping policy
67 A capping policy was introduced in 2009-10 to reduce volatilities in overall PbR income resulting from any changes in the MFF values It meant that given changes to the tariff providerrsquos overall income should not change by more than +-2 as a result of using the updated MFF as opposed to using the previous years MFF In 2013-14 all organisations will have moved to their target MFF values and are no longer subject to the capping policy The 2013-14 tariff information spreadsheet includes details of the past capped payment values for each trust
6 The impact of a single overall MFF value on an organisationsrsquo income is equal to the impact of applying the index value for each element separately to the proportion of costs it represents
PbR and the Market Forces Factor (MFF) in 2013-14 Page 15 of 28
Gateway Ref 18768
Annex A ndash Composition of MFF
MFF Index
(549) (139) (04) (27) (281)
Land BuildingsStaff OtherMampD
Data Evaluated at PCT level Applied to London Valuations specific to Evaluated at PCT level and assigned to trust trusts only trustsrsquo estates and assigned to trust Level
sites relative to national sites
Variation in private Land net book values Evidence sector wages Average paybill for (2008-09) and Estates Three year Assumed not to Base
(University of Warwick hospital doctors Return Information average of tender vary in any developments by 2008-09 Collection (2008-09) prices material way
HERU)
1 The index values of each of the four component indices (staff MampD land and buildings) are multiplied by the corresponding expenditure weight to give the overall MFF value A worked example is included in Annex C
PbR and the Market Forces Factor (MFF) in 2013-14 Page 16 of 28
Gateway Ref 18768
Annex B - The Staff Index
1 This annex outlines (a) Rationale for basing the staff index on private sector rather than
NHS wages (b) The application of smoothing and interpolation and (c) Rationale for the introduction of the Medical amp dental London
weighting
Underlying data for the staff index
1 The staff element of the MFF is the largest component Although the staff index is intended to reflect non-medical NHS staff cost variations it is based on private sector rather than NHS wages The rationale for this approach generates many queries
2 The aim of the MFF is to compensate for unavoidable cost differences between providers in the delivery of services For staff expenditure variation can occur directly or indirectly direct costs are the salaries paid to staff indirect costs include expenditure incurred through labour turnover agency staff costs vacancies and reduced productivity
3 High indirect costs of employment can arise for NHS providers where the wage rate they offer is below the prevailing wage rate of the area from which they draw their staff Organisations offering relatively low wages are likely to experience higher vacancy and turnover rates relative to other employers Lower wages are also associated with lower staff productivity Research commissioned by DH7 found evidence of these outcomes in a study into the variation in wages across NHS organisations
4 Geographical variation in staff costs can be determined in two ways using NHS employment costs or private sector wages as is the convention for the MFF A brief overview of each approach is set out below
Basing the MFF on NHS staff costs
5 Whilst it would be possible to base the staff index on actual NHS costs several problems with the approach make its use inappropriate Research commissioned8 by DH confirmed the arguments against the use of this method
7 RARP 32 Review of the Market Forces Factor following the introduction of Payment by Results (2005) Exploring the General Labour Market method httpwwwdhgovukenManagingyourorganisationFinanceandplanningAllocationsDH_410 8515 8 RARP 31 Review of the Specific Cost Approach to Market Forces Factor httpwwwdhgovukenManagingyourorganisationFinanceandplanningAllocationsDH_410 8515
PbR and the Market Forces Factor (MFF) in 2013-14 Page 17 of 28
Gateway Ref 18768
6 Lack of national data availability Although it is straightforward to obtain information about high level direct employment costs within the NHS there is currently limited availability of consistent detailed data on employment costs
7 Distinguishing between avoidable and unavoidable costs Where organisations incur greater than average costs it is almost impossible to distinguish between avoidable and unavoidable components of expenditure For example by dividing the MFF range into quintiles of trusts and controlling for trust type and location there is 35 variation in the number of nurses needed for the same output between quintile 1 and 5 It is unclear whether the reasons for this variation are caused by drivers of avoidable or unavoidable costs
8 Possibility of perverse incentives Using actual NHS costs any relative changes in NHS staff costs would feed directly into the MFF calculation any trust with higher relative costs would then receive a greater staff index value when the MFF is re-calculated This issue creates an incentive for trusts to raise their indirect staff costs which would increase the staff component of their MFF (assuming that not all trusts did this thereby leaving relative wage rates unchanged) resulting in greater income from the tariff
9 Reduced incentives to improve efficiency Trusts using staff more efficiently will face lower staff costs relative to those with less efficiency When the MFF is next calculated lower staff costs would be reflected in a lower MFF value and therefore a reduced (and relatively lower) tariff income Using the NHS staff costs approach the incentives to improve efficiency under PbR would be reduced
10 In light of these issues the research confirmed that the current approach using external wage comparisons to determine differences in staff costs is appropriate
Basing the MFF on external wage comparisons
11 Basing the staff index on private sector wages was the approach recommended by the University of Warwick The original argument was conceptual but supporting evidence is now available from work commissioned by DH
12 The premise of the approach is that the private sector does not implement national pay scales and as such wages offered reflect the cost of living and amenities in that area These factors are the key drivers of relative differences in pay
13 It would not be fair to simply take the actual average private sector wage in each area This is because occupational mix varies Some areas have a much higher proportion of staff working in highly paid occupations such as law and banking These differences need to be taken into account in
PbR and the Market Forces Factor (MFF) in 2013-14 Page 18 of 28
Gateway Ref 18768
the MFF in order to ensure that we are making like for like comparisons across the country Warwick do this using a statistical technique known as regression analysis It essentially works out what wages would be in an area if each area had the same mix of occupations We similarly take account of differences in the age and gender mix of the private sector workforce in different areas
14 The staff index compensates trusts for the unavoidable variation in direct staff costs and indirect employment costs arising where NHS wages do not reflect the local market rate
15 To test for evidence of indirect employment costs the Health Economics Research Unit (HERU) commissioned by DH determined the relationship between vacancy rates and the gap between NHS and private sector wages for different staff groups For nurses the evidence illustrates that vacancy rates are higher where the gap between NHS wages and private sector wages are greater
16 The Department of Health and the Department of Communities and Local Government have undertaken a number of reviews of the approach to compensating for unavoidable differences in staff costs Both Departments concluded that this approach to the MFF continues to be the best available methodology
Smoothing and Interpolation
17 Smoothing and interpolation are two approaches used to refine the staff MFF index values so that the values for each organisation better reflect the local labour markets from which they recruit
Smoothing
18 The methodology of the staff index creates the cliff edge problem whereby neighbouring PCTs receive markedly different staff cost values because of their geographical boundaries Cliff edges may lead to an inaccurate representation of staff costs faced by a provider This problem is particularly evident for providers within different PCTs but in close proximity and facing similar local labour market pressures Smoothing techniques soften cliff edges to produce a more continuous profile of staff costs across PCTs
19 HERU recommended that smoothing take into account the relative staff index of every PCT rather than just neighbouring ones as previously This approach recognises that NHS organisations draw their labour force from a variety of PCT areas Smoothing adjusts the relative level of staff index in a PCT by accounting for relative staff index in surrounding PCTs The weights of the relative costs in surrounding areas fall the further the distance from the base PCT Smoothing brings each PCTrsquos MFF more in line with those of its surrounding PCTs
PbR and the Market Forces Factor (MFF) in 2013-14 Page 19 of 28
Gateway Ref 18768
Interpolation
20 The smoothed relative costs for PCTs described above still result in cliff edges between trusts Two trusts operating near the border of neighbouring PCTs might have different relative staff costs but operate in the same labour market As a result HERU introduced a further refinement to smoothing interpolation
21 Interpolation takes account of the location within a PCT area of the trustsrsquo sites and thus the distance from other PCT areas It involves a second stage of smoothing carried out at trust level after smoothing at PCT level and further reduces the impact of cliff edges It works the same way as smoothing in that the staff index of a trust is the distance weighted average of the surrounding PCTsrsquo staff indices
22 Interpolation is carried out at trust site level Where a trust has more than one site the different indices for each site are weighted together in proportion to activity using bed numbers as a proxy on each site
Medical and Dental (MampD) London Weighting
23 The scope of the staff component of the MFF has been progressively expanded and since 2003-4 has included the whole workforce The research by HERU found no supporting evidence for the application of the staff MFF to doctors As such the coverage of the staff index was reduced in 2009-10 and a new element the Medical and Dental London Weighting is incorporated The MampD weighting reflects the greater cost of these employees in London relative to the rest of the country
24 HERU determined that pay setting mechanisms between medical and non-medical staff differ negating the need to apply the staff index to medical staff Although there is no national variation in medical staff costs there is a significant difference in the costs of doctors in London relative to the rest of the country As such a weighting for medical and dental staff is applied to trusts in London
PbR and the Market Forces Factor (MFF) in 2013-14 Page 20 of 28
Gateway Ref 18768
Annex C ndash Worked example calculation of MFF
1 This worked example shows the calculation of the MFF for Provider A
Staff Index
2 The staff index for a hospital trust is calculated based the staff index values for individual trusts There are two sites to Provider A These are in the locality of PCT Y and PCT Z
Sites PCT area Staff Index Activity 1 Y 10385 89 2 Z 10101 11
3 Staff MFF for Provider A is thus
(08910385) + (01100101) = 10354
Medical and dental (MampD) London weighting
4 This index is calculated as the ratio of the average hospital paybill of these staff groups in 2008-09 including London weighting to the average paybill excluding the London weighting
5 Provider A has no sites located within London and therefore receives a weighting of 100
Buildings Index
6 The Buildings Index is calculated in the same way as the Staff Index
Sites PCT area Building Index Activity 1 Y 09497 89 2 Z 09693 11
7 The calculation is thus
(08909497) + (01109693) = 09519
Land Index
8 The index value of the Provider A estate is 15374
Overall Index
9 The 4 components are combined using the breakdown of national expenditure between staff buildings land and other costs The latter is assumed not to vary across the country
PbR and the Market Forces Factor (MFF) in 2013-14 Page 21 of 28
Gateway Ref 18768
Index HCHS Expenditure Index Value Weighted Index (a) (b) (c) = (a)(b)
Staff 549 10354 05684 MampD 139 10000 01390 Buildings 27 09519 00257 Land 04 15374 00061 Other 281 10000 02810
index value is the same for all trusts
10 This gives an overall target MFF value of 05684 + 01390 + 00257 + 00061 + 02810 = 10203
11 This above value is the underlying index value for Provider A This index is centred around 1 To ensure that all trusts receive non-negative payment of the MFF the underlying index is converted to a payment index with a minimum value of 1
12 To set the minimum of the payment index to 1 the underlying index with an average of 1 is divided through by the minimum value In 2013-14 the minimum value is 09263 The final MFF value for Provider A to be used for payment is thus
102209263 = 11033
PbR and the Market Forces Factor (MFF) in 2013-14 Page 22 of 28
Gateway Ref 18768
Annex D ndash Reference Cost Index (RCI)
1 The RCI is an index of the relative cost efficiency of NHS organisations The RCI is adjusted by the MFF to ensure a fair comparison between organisations across England
2 For the RCI to be comparable year-on-year the index must have an average of 100 To ensure this the application of the MFF to reference costs must be cost neutral ie the total national value of Reference Costs submitted must be the same whether it includes or excludes the MFF To obtain cost neutrality the underlying MFF is scaled The extent of this scaling depends on the percentage difference between the quantum of Reference Costs prior to the application of MFF and after it
3 The following example shows how the MFF is used to calculate the MFF-adjusted RCI Table 1 shows how the underlying MFF is scaled so that the total quantum of Reference Costs is kept constant at pound4500 This is necessary to ensure the national average RCI is 100 The factor used to scale the underlying MFF is the percentage difference between Reference Costs prior to the application of the MFF and after its application (sum of column C divided by sum of column B)
PbR and the Market Forces Factor (MFF) in 2013-14 Page 23 of 28
Gateway Ref 18768
Table 1 Scaled MFF for RCI
A B C = B A D = A sum (C) sum (B) E = B D
Underlying MFF
Total Reference Costs Quantum (pound)
Total RC Quantum adjusted for underlying MFF (pound) Scaled MFF
Total RC Quantum adjusted for scaled MFF (pound)
Provider A 10249 1250 1220 09622 1299 Provider B 11021 1000 907 10346 967 Provider C 13349 1000 749 12532 798 Provider D 09270 1250 1348 08703 1436
4500 4225 4500
4 Table 2 shows that without the scaling of the MFF the average of RCI does not equal 100 (compare the averages of columns J and L) Having the average RCI at 100 allows easy comparison of providerrsquos relative efficiency year on year Irrespective of whether the average is 100 (and any scaling) a providerrsquos index value is always the same relative to the average For example Provider D is always 22 above average
From column L [(122 ndash 100) 100] 100 = 22 From column J [(115 ndash 94) 94] 100 = 22
PbR and the Market Forces Factor (MFF) in 2013-14 Page 24 of 28
Gateway Ref 18768
Table 2 Average RCI kept at 100
F G
H = (F G)100 I = A J = H I K = D L = H K
Actual Total Cost (pound)
Expected Total Cost (pound)
Base RCI
Underlyi ng MFF
MFF adjusted RCI (based on underlying MFF)
Scaled MFF
MFF adjusted RCI (based on scaled MFF)
Provider A
1250
1300 96 10249 94 09622 100 Provider B
1000
925 108 11021 98 10346 104 Provider C
1000
1100 91 13349 68 12532 73 Provider D
1250
1175 106 09270 115 08703 122 Average 100 94 100
(RCI figures to the nearest integer)
PbR and the Market Forces Factor (MFF) in 2013-14 Page 25 of 28
Gateway Ref 18768
Annex E ndash Tariff Calculation
1 Table 3 gives an example calculation of the tariff for an HRG The underlying MFF is rebased so that the minimum value is 1 (column D) by dividing the index through by the 2013-14 minimum value of 09263 Total costs are then divided by these MFF values (column E) The income for a provider is then the product of tariff price activity and rebased MFF (column F)
Table 3 Rebasing MFF for Tariff Calculation
A B C D = C min C
E = B D F = Tariff A D
Activity Total Costs (pound)
Underlying MFF
Rebased MFF to 1
Total Costs adjusted for rebased MFF (pound)
PbR Income (pound)
Provider A Provider
60 1250 10249 11064 1130 1528
B Provider
50 1000 11021 11898 840 1369
C Provider
20 1000 13349 14411 694 663
D 40 1250 09263 1 1250 921 Total 170 4500 3913 4483
Tariff = Total costs adjusted for MFF National activity = sum of column E sum of column A
= pound3913 170 = pound2302
PbR and the Market Forces Factor (MFF) in 2013-14 Page 26 of 28
Gateway Ref 18768
2 Table 4 shows the relative difference between providers A and B for the underlying and rebased (payment) index As is shown irrespective of the index the MFF of Provider B is always 753 greater than that of Provider A This relationship is true for all providers the relativities between providers is the same regardless of how the underlying MFF is scaled
Table 4 Relative differences between providers A amp B
X Y Z = ( Y X )-1
Provider Provider MFF Indices A B Difference Underlying (col C) 10249 11021 753 Rebased to 1 (col D) 11064 11898 753
PbR and the Market Forces Factor (MFF) in 2013-14 Page 27 of 28
Gateway Ref 18768
Annex F ndash Creating an index
1 An index is a ranking of numbers relative to the same base such that they can be directly compared
2 In the example below an index value can be attached to each of the numbers in column A An index is constructed by dividing each number by the base value of the index In common with the MFF the first index created is in column B which has an average value of 10 like the underlying MFF index This index is constructed by dividing each number by the average of the index 100
Values Index with an average of 1
Index with a minimum of 1
A B C 50 050 100 95 095 190 125 125 250 130 130 260 100 100 200
Average value 100 Minimum value 50
3 The index in column B represents a ranking relative to the average value in the list The average of the values in column a is 100 The value 50 in column A is half of the average so as a relative value 50 can be expressed as 05
4 Column C represents the transformation of the index to have a minimum value of 1 akin to the payment index 50 is the lowest of all the values in column A and so in the index in column C it has a value of 10
5 As stated in the guidance irrespective of the version of the MFF index the relative unavoidable cost differences between organisations are maintained In the example above it can be seen that the relative difference between the values 50 and 100 of column A is the same in both columns B and C ie 05 is half of 10 and 10 is half of 20 This also holds for every other combination of values For example 50 is 04 times small than 125 In columns B and C the relative difference in the associated index values is also 04 (050 125 = 04) and (10 25 = 04)
PbR and the Market Forces Factor (MFF) in 2013-14 Page 28 of 28
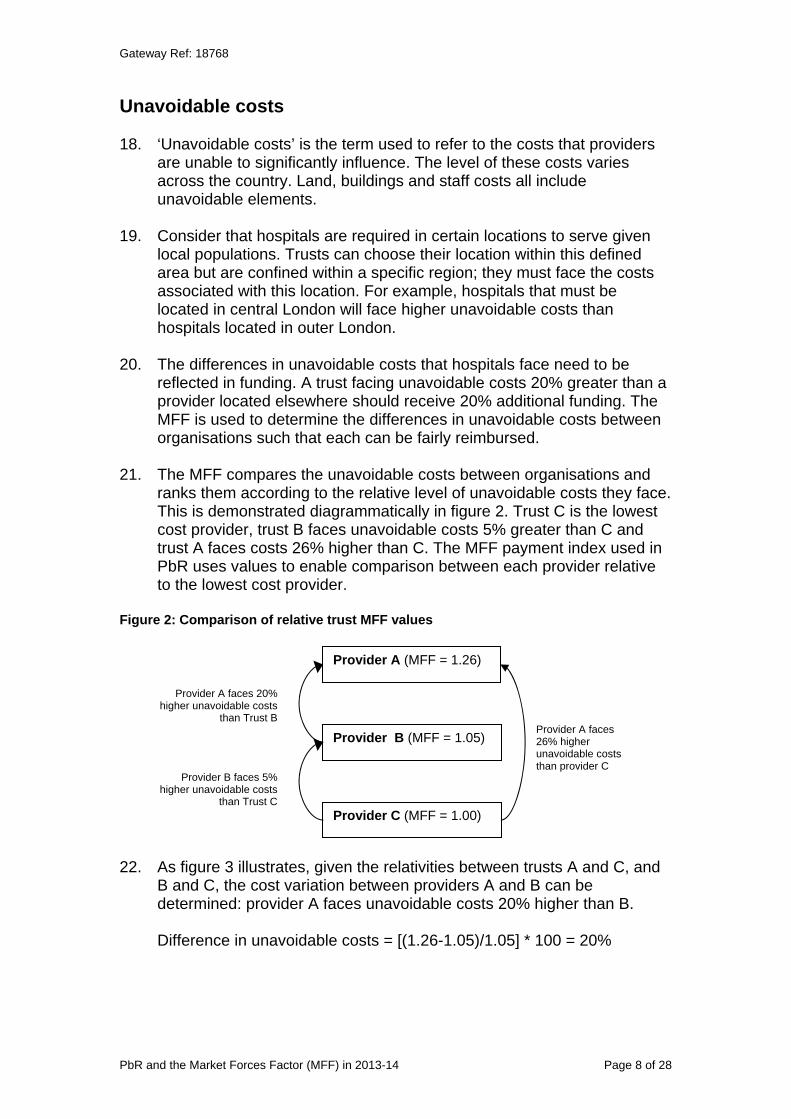
Gateway Ref 18768
Unavoidable costs
18 lsquoUnavoidable costsrsquo is the term used to refer to the costs that providers are unable to significantly influence The level of these costs varies across the country Land buildings and staff costs all include unavoidable elements
19 Consider that hospitals are required in certain locations to serve given local populations Trusts can choose their location within this defined area but are confined within a specific region they must face the costs associated with this location For example hospitals that must be located in central London will face higher unavoidable costs than hospitals located in outer London
20 The differences in unavoidable costs that hospitals face need to be reflected in funding A trust facing unavoidable costs 20 greater than a provider located elsewhere should receive 20 additional funding The MFF is used to determine the differences in unavoidable costs between organisations such that each can be fairly reimbursed
21 The MFF compares the unavoidable costs between organisations and ranks them according to the relative level of unavoidable costs they face This is demonstrated diagrammatically in figure 2 Trust C is the lowest cost provider trust B faces unavoidable costs 5 greater than C and trust A faces costs 26 higher than C The MFF payment index used in PbR uses values to enable comparison between each provider relative to the lowest cost provider
Figure 2 Comparison of relative trust MFF values
Provider B (MFF = 105)
Provider C (MFF = 100)
Provider A (MFF = 126)
Provider A faces 20 higher unavoidable costs
than Trust B
Provider B faces 5 higher unavoidable costs
than Trust C
Provider A faces 26 higher unavoidable costs than provider C
22 As figure 3 illustrates given the relativities between trusts A and C and B and C the cost variation between providers A and B can be determined provider A faces unavoidable costs 20 higher than B
Difference in unavoidable costs = [(126-105)105] 100 = 20
PbR and the Market Forces Factor (MFF) in 2013-14 Page 8 of 28
Gateway Ref 18768
Application of the MFF within PbR
23 There are two versions of the MFF index (a) underlying index and (b) payment index
24 Both of these indices are based on the same set of data To use this data for different purposes it is transformed into different indices An index is a series of values all relative to the same base value By having a different base the index can be used in different ways
Underlying Index
25 The underlying index is the version first calculated and used to inform CCG allocations The underlying version is set so that the base to which all values in the index are relative is the average value The underlying index has an average value of 10 Organisations facing higher (lower) unavoidable costs than the average organisation have a value greater (less) than 10
26 The underlying index is also used in the calculation of the Reference Cost Index (RCI) See Annex D for further details and a worked example
Payment Index
27 The payment index is the version used for the national tariff This version of the index is set so that the base to which all values are relative is the minimum rather than the average The payment index has a minimum value of 10 The organisation with the value of 10 faces the lowest unavoidable costs Organisations with a value greater than 10 face higher costs than the minimum organisation For example an organisation with an index value of 102 is estimated to face unavoidable costs 2 greater than the lowest cost provider
28 The reason for creating an index with a base that is a minimum of 10 is to facilitate the PbR funding policy of a single national price To achieve this all providers must receive this price and then be compensated separately for the unavoidable costs they face If the MFF index used in PbR was the underlying version then the tariff price would include the level of unavoidable costs in the middle of the range of all providers Providers with lower unavoidable costs would be paid less than the tariff price after the application of the MFF
29 As suggested above use of the payment index separates avoidable and unavoidable costs The tariff reimburses the costs that all providers incur and the MFF separately compensates those facing more than the minimum level of unavoidable costs
PbR and the Market Forces Factor (MFF) in 2013-14 Page 9 of 28
Gateway Ref 18768
30 In practice the payment index is created by transforming the underlying index rather than going back to the base data The payment index is created by dividing each value in the underlying index by the minimum value This creates an index with a base of 10
31 Transforming the index means that a single provider has a different value in the underlying and payment index Despite this the relativities between providers are the same For example consider two trusts A and B If trust A is estimated to face unavoidable costs 15 higher than trust B then the MFF value of trust A will be 15 higher than that for trust B irrespective of which index is used (see Annex G for a more detailed explanation)
32 To apply the MFF for reimbursement tariff prices have to be adjusted to account for variation in unavoidable costs The stages in applying the MFF for PbR are outlined below
Tariff calculation
33 The MFF is used in the calculation of the national tariff For each HRG and admission type the tariff is based on the national average cost of the service Before determining the national average each providerrsquos unit costs are divided by their corresponding payment MFF value This is done for two reasons
34 Firstly it removes any bias of providing activity in higher cost areas For example suppose 80 of activity of an HRG is provided in a high cost area such as London and the remaining 20 is provided in a relatively low cost area such as Cornwall Without the removal of the MFF the tariff price would be biased upwards because of the London activity
35 Secondly dividing through by the MFF means that there is one national price (tariff) for services Providers are compensated separately for the unavoidable costs they incur in providing activity See the next sub-section for more detail
36 A worked example of the application of the MFF in tariff calculation is included in Annex C
MFF for payment
37 As stated above the tariff price of an HRG is based on the national average of costs reported by hospitals having adjusted for unavoidable cost differences above the minimum To compensate providers for their unavoidable cost pressures the MFF is applied as a proportion of the tariff price paid in addition to the tariff on each unit of activity
38 The tariff price includes the lowest possible level of unavoidable costs that an NHS organisation faces The lowest cost provider receives no additional funding for their activity All other providers receive an
PbR and the Market Forces Factor (MFF) in 2013-14 Page 10 of 28
Gateway Ref 18768
additional proportion of the tariff price as compensation for their unavoidable costs
39 The MFF is applied to a trust for a single HRG as follows
Total income = (Activity Tariff price) MFF value
40 Example 100 units of activity for HRG A are undertaken by Trust X The tariff price of HRG A is pound500 the trust has an MFF value of 120
Total income = 100 pound500 120 = pound60000
ie Trust X receives an extra pound10000 as a result of higher unavoidable costs than the lowest cost provider
Components of the MFF
41 The components of running costs considered to vary across the country are compensated for using the MFF The relative differences for each component cost are captured in separate indices Each component cost index is then aggregated into an overall MFF index to create the underlying index The components are described below See Annex A for an overview of the composition of the MFF
Staff index
42 The staff index applies to all non-medical NHS staff Unavoidable variation in staff costs arise because national pay scales implemented by the NHS (including regional pay allowances) do not fully reflect the variation in employment costs evident in the broader labour market If wages do not reflect the going rate for an area then this can lead to indirect costs such as greater use of agency staff and higher vacancy and turnover rates It can also lead to differences in staff productivity
43 The staff index is based on variation in wages in the private sector Annex B provides further information of the reasoning behind this approach The data source for the index is the Annual Survey of Hours and Earnings (ASHE) produced by the Office for National Statistics For 2011-12 onwards updated and more robust earnings data has been used (from the years 2007-2009)2
44 The staff index is based on the pattern of wages calculated within defined geographical ares (currently the previous PCT boundaries) and is intended to reflect local labour market conditions As trusts do not only employ staff from the geographical area in which their sites are located
2 For further information please see the HERU report lsquoThe Staff Market Forces Factor Component of the Resource Allocation Weighted Capitation Formula New estimatesrsquo httpwwwdhgovukprod_consum_dhgroupsdh_digitalassetsdocumentsdigitalassetdh_1 22621pdf
PbR and the Market Forces Factor (MFF) in 2013-14 Page 11 of 28
Gateway Ref 18768
the first stage is to smooth3 the variation in wage levels between areas to take into account the different labour market conditions in the areas A second stage of smoothing called interpolation4 undertaken at trust site level is used to take into account the precise location of trustsrsquo sites within an area and thus their distance from other areas Annex B outlines the smoothing and interpolation techniques
45 Interpolation is not used in the calculation of MFF values for Community Trusts As these trusts have taken over the services previously provided by PCTs activity will be spread across the catchment area of the trust and so it would not be appropriate to attribute all of the unavoidable cost differences to the location of the Head Quarters of the Community Trust Instead for newly created Community Trusts (ie those that have not merged with acute trusts) the staff MFF is calculated to reflect the full catchment area of the trust based on the previous PCTsrsquo MFFs
46 The values of the underlying staff index range between 08746 and 12340
Medical amp Dental (MampD) London Weighting
47 Analysis determined that medical staff costs do not vary in the same way as those of other staff groups5 Medical staff costs are however significantly higher in London than the rest of the country the MampD London weighting is required to compensate for this difference
48 The MampD London weighting is applied to trusts in London and is calculated as the ratio of the average paybill per head for hospital doctors in 2008-09 nationally to the average paybill per head excluding London This ratio is 10224 and trusts within what was London SHA receive this value all other trusts receive an MampD value of 10
Buildings index
49 The cost of buildings includes an unavoidable element because as an asset buildings have different worth in different parts of the country In an area where a building is worth more the trust will pay more in capital charges on this asset relative to a trust located in a lower cost area
50 The buildings index remains based on PCT geography The Building Cost Information Service (BCIS) analysed tender prices for public and private contracts between January 2007 and June 2010 to derive
3 smoothing is a form of weighted averages 4 Interpolation is a technique using two or more values to create an intermediate value 5 Both RARP 31 and 32 draw this conclusion RARP 31 Review of Specific Cost Approach to Market Forces Factor RARP 32 Review of the Market Forces Factor following the introduction of Payment by Results (2005) Exploring the General Labour Market Method httpwwwdhgovukenManagingyourorganisationFinanceandplanningAllocationsDH_410
PbR and the Market Forces Factor (MFF) in 2013-14 Page 12 of 28
8515
Gateway Ref 18768
location factors Average location factors for the period are provided for each PCT area Each trustrsquos buildings value is determined by the PCT area in which they are located To create the buildings index the location factors were divided by the mean value weighted by population A trust sites buildings index is determined by the PCT area where it is located An average of the site indices weighted by available bed numbers is used to provide the trust buildings index For Community Trusts population rather than bed numbers is used as the basis for averaging across PCT areas
51 The values of the buildings index range between 089 and 128
Land index
52 Land costs include unavoidable costs for two reasons (a) it cost trusts more to acquire land in certain areas of the country
relative to others and (b) the capital charges paid on this land will also be higher
53 The land index unlike the other indices is specific to each individual trust The only exception is Community Trusts which were formed to take over the provider functions of PCTs Their land index value is based on the previous PCT index values
54 A land index based on land value per hectare is calculated for each NHS Trust using net book value of land at 31 March 2009 as reported in the audited summarisation schedules 2008-09 The land areas for each individual trust were aggregated from the site level data available in the 2008-09 Estates Return Information Collection (ERIC)
55 Whilst it would be possible to use average land values for pre-defined geographic areas two drawbacks of this approach make the chosen method appropriate Firstly land prices are subject to variation within small geographic areas and secondly trusts have to pay capital charges relating specifically to the land value for the trust
56 The land index has the biggest range the lowest value is 0016 the maximum is 19550 representing a 1200-fold difference Given the gap between the lowest and highest values the land index for providers with high values has a significant impact on their overall MFF value This is in spite of the small proportion of costs that land accounts for (see creating the MFF section) The land component can often explain differences between index values of organisations
57 London Trusts that have a significant non-London site have a land index for each site weighted together in proportion to the 2004 VOA value and the share of available beds at each site The use of available beds recognises that land is typically used more intensively in central London compared to less urban areas
PbR and the Market Forces Factor (MFF) in 2013-14 Page 13 of 28
Gateway Ref 18768
Other
58 The category of ldquootherrdquo costs is included as an additional factor in the final MFF value The costs included in this element are all those that are not considered to vary by location As these costs do not vary by provider all organisations receive a value of 1 in relation to these costs
59 It is necessary for non-varying costs to be represented in the overall value as the MFF is applied to the full scope of costs not just those with elements that vary by area The MFF is a percentage of the tariff price As the tariff is based on total running costs per unit of activity the MFF must therefore reflect all components of costs that drive the price
Changes to the MFF 2013-14
60 There have been no changes to the source data for the MFF for 2013-14 the 2012-13 MFF has been rolled forward
61 PCTs ceased providing services in 2012-13 and will cease their commissioning functions in 2013-14 For the purposes of PbR the provider functions of PCTs have transferred to new or existing trusts and MFF values have been affected as follows Where the provider functions of PCTs have been transferred into
new Trusts the relevant previous PCT MFF values have been used to calculate an appropriate MFF value
Where other acute trusts have taken over PCT provider functions the MFF value of the acute Trust remains unchanged
Creating the MFF
62 The overall MFF value for each organisation is a combination of the components outlined above The elements are combined according to the proportion of total running costs that they account for This value is determined based on national proportions of expenditure on each component of the MFF reported in NHS accounts The proportion attributable to each element of the MFF is outlined below
Staff 549 MampD London Weighting 139 Buildings 27 Land 04 Other 281
63 To create an overall MFF value for an organisation the index value for each element of the MFF is multiplied by its proportion of total running costs This approach applies a weight to each element of the MFF equal to its weight within total costs The weighted index values are then
PbR and the Market Forces Factor (MFF) in 2013-14 Page 14 of 28
Gateway Ref 18768
summed together to give an overall figure for the organisation6 See Annex C for a worked example of the calculation for a trust with multiple sites
Deriving an MFF value for newly merged trusts
64 Organisations that merge will have a new MFF value calculated in line with the MFF methodology For organisations merging at the beginning of the financial year this new MFF will apply from the date of the merger For organisations merging in the middle of the financial year the new MFF will apply from the beginning of the following financial year (see PbR Guidance for full policy)
65 The methodology means that each site of a merging trust will be treated not as a proportion of the trust to which it previously belonged but as a proportion of the merged organisation as a whole This is necessary as the staff and buildings components of the MFF are defined at site level The site index values are combined according to their activity levels proxied by bed numbers as per the calculation of multiple site organisations (see Annex C for worked example)
66 In some instances it may be necessary to make further adjustments to the calculation of the merged land index value Where merging trusts have very different land index values and also vary significantly in the intensity of land use the individual land index values will be combined according to trust activity levels (proxied by bed numbers) This is in line with the method used for the staff and buildings components of the MFF and acts as an extension of the adjustments already in place to recognise the differing land use intensities for London trusts with significant sites out of London
Capping policy
67 A capping policy was introduced in 2009-10 to reduce volatilities in overall PbR income resulting from any changes in the MFF values It meant that given changes to the tariff providerrsquos overall income should not change by more than +-2 as a result of using the updated MFF as opposed to using the previous years MFF In 2013-14 all organisations will have moved to their target MFF values and are no longer subject to the capping policy The 2013-14 tariff information spreadsheet includes details of the past capped payment values for each trust
6 The impact of a single overall MFF value on an organisationsrsquo income is equal to the impact of applying the index value for each element separately to the proportion of costs it represents
PbR and the Market Forces Factor (MFF) in 2013-14 Page 15 of 28
Gateway Ref 18768
Annex A ndash Composition of MFF
MFF Index
(549) (139) (04) (27) (281)
Land BuildingsStaff OtherMampD
Data Evaluated at PCT level Applied to London Valuations specific to Evaluated at PCT level and assigned to trust trusts only trustsrsquo estates and assigned to trust Level
sites relative to national sites
Variation in private Land net book values Evidence sector wages Average paybill for (2008-09) and Estates Three year Assumed not to Base
(University of Warwick hospital doctors Return Information average of tender vary in any developments by 2008-09 Collection (2008-09) prices material way
HERU)
1 The index values of each of the four component indices (staff MampD land and buildings) are multiplied by the corresponding expenditure weight to give the overall MFF value A worked example is included in Annex C
PbR and the Market Forces Factor (MFF) in 2013-14 Page 16 of 28
Gateway Ref 18768
Annex B - The Staff Index
1 This annex outlines (a) Rationale for basing the staff index on private sector rather than
NHS wages (b) The application of smoothing and interpolation and (c) Rationale for the introduction of the Medical amp dental London
weighting
Underlying data for the staff index
1 The staff element of the MFF is the largest component Although the staff index is intended to reflect non-medical NHS staff cost variations it is based on private sector rather than NHS wages The rationale for this approach generates many queries
2 The aim of the MFF is to compensate for unavoidable cost differences between providers in the delivery of services For staff expenditure variation can occur directly or indirectly direct costs are the salaries paid to staff indirect costs include expenditure incurred through labour turnover agency staff costs vacancies and reduced productivity
3 High indirect costs of employment can arise for NHS providers where the wage rate they offer is below the prevailing wage rate of the area from which they draw their staff Organisations offering relatively low wages are likely to experience higher vacancy and turnover rates relative to other employers Lower wages are also associated with lower staff productivity Research commissioned by DH7 found evidence of these outcomes in a study into the variation in wages across NHS organisations
4 Geographical variation in staff costs can be determined in two ways using NHS employment costs or private sector wages as is the convention for the MFF A brief overview of each approach is set out below
Basing the MFF on NHS staff costs
5 Whilst it would be possible to base the staff index on actual NHS costs several problems with the approach make its use inappropriate Research commissioned8 by DH confirmed the arguments against the use of this method
7 RARP 32 Review of the Market Forces Factor following the introduction of Payment by Results (2005) Exploring the General Labour Market method httpwwwdhgovukenManagingyourorganisationFinanceandplanningAllocationsDH_410 8515 8 RARP 31 Review of the Specific Cost Approach to Market Forces Factor httpwwwdhgovukenManagingyourorganisationFinanceandplanningAllocationsDH_410 8515
PbR and the Market Forces Factor (MFF) in 2013-14 Page 17 of 28
Gateway Ref 18768
6 Lack of national data availability Although it is straightforward to obtain information about high level direct employment costs within the NHS there is currently limited availability of consistent detailed data on employment costs
7 Distinguishing between avoidable and unavoidable costs Where organisations incur greater than average costs it is almost impossible to distinguish between avoidable and unavoidable components of expenditure For example by dividing the MFF range into quintiles of trusts and controlling for trust type and location there is 35 variation in the number of nurses needed for the same output between quintile 1 and 5 It is unclear whether the reasons for this variation are caused by drivers of avoidable or unavoidable costs
8 Possibility of perverse incentives Using actual NHS costs any relative changes in NHS staff costs would feed directly into the MFF calculation any trust with higher relative costs would then receive a greater staff index value when the MFF is re-calculated This issue creates an incentive for trusts to raise their indirect staff costs which would increase the staff component of their MFF (assuming that not all trusts did this thereby leaving relative wage rates unchanged) resulting in greater income from the tariff
9 Reduced incentives to improve efficiency Trusts using staff more efficiently will face lower staff costs relative to those with less efficiency When the MFF is next calculated lower staff costs would be reflected in a lower MFF value and therefore a reduced (and relatively lower) tariff income Using the NHS staff costs approach the incentives to improve efficiency under PbR would be reduced
10 In light of these issues the research confirmed that the current approach using external wage comparisons to determine differences in staff costs is appropriate
Basing the MFF on external wage comparisons
11 Basing the staff index on private sector wages was the approach recommended by the University of Warwick The original argument was conceptual but supporting evidence is now available from work commissioned by DH
12 The premise of the approach is that the private sector does not implement national pay scales and as such wages offered reflect the cost of living and amenities in that area These factors are the key drivers of relative differences in pay
13 It would not be fair to simply take the actual average private sector wage in each area This is because occupational mix varies Some areas have a much higher proportion of staff working in highly paid occupations such as law and banking These differences need to be taken into account in
PbR and the Market Forces Factor (MFF) in 2013-14 Page 18 of 28
Gateway Ref 18768
the MFF in order to ensure that we are making like for like comparisons across the country Warwick do this using a statistical technique known as regression analysis It essentially works out what wages would be in an area if each area had the same mix of occupations We similarly take account of differences in the age and gender mix of the private sector workforce in different areas
14 The staff index compensates trusts for the unavoidable variation in direct staff costs and indirect employment costs arising where NHS wages do not reflect the local market rate
15 To test for evidence of indirect employment costs the Health Economics Research Unit (HERU) commissioned by DH determined the relationship between vacancy rates and the gap between NHS and private sector wages for different staff groups For nurses the evidence illustrates that vacancy rates are higher where the gap between NHS wages and private sector wages are greater
16 The Department of Health and the Department of Communities and Local Government have undertaken a number of reviews of the approach to compensating for unavoidable differences in staff costs Both Departments concluded that this approach to the MFF continues to be the best available methodology
Smoothing and Interpolation
17 Smoothing and interpolation are two approaches used to refine the staff MFF index values so that the values for each organisation better reflect the local labour markets from which they recruit
Smoothing
18 The methodology of the staff index creates the cliff edge problem whereby neighbouring PCTs receive markedly different staff cost values because of their geographical boundaries Cliff edges may lead to an inaccurate representation of staff costs faced by a provider This problem is particularly evident for providers within different PCTs but in close proximity and facing similar local labour market pressures Smoothing techniques soften cliff edges to produce a more continuous profile of staff costs across PCTs
19 HERU recommended that smoothing take into account the relative staff index of every PCT rather than just neighbouring ones as previously This approach recognises that NHS organisations draw their labour force from a variety of PCT areas Smoothing adjusts the relative level of staff index in a PCT by accounting for relative staff index in surrounding PCTs The weights of the relative costs in surrounding areas fall the further the distance from the base PCT Smoothing brings each PCTrsquos MFF more in line with those of its surrounding PCTs
PbR and the Market Forces Factor (MFF) in 2013-14 Page 19 of 28
Gateway Ref 18768
Interpolation
20 The smoothed relative costs for PCTs described above still result in cliff edges between trusts Two trusts operating near the border of neighbouring PCTs might have different relative staff costs but operate in the same labour market As a result HERU introduced a further refinement to smoothing interpolation
21 Interpolation takes account of the location within a PCT area of the trustsrsquo sites and thus the distance from other PCT areas It involves a second stage of smoothing carried out at trust level after smoothing at PCT level and further reduces the impact of cliff edges It works the same way as smoothing in that the staff index of a trust is the distance weighted average of the surrounding PCTsrsquo staff indices
22 Interpolation is carried out at trust site level Where a trust has more than one site the different indices for each site are weighted together in proportion to activity using bed numbers as a proxy on each site
Medical and Dental (MampD) London Weighting
23 The scope of the staff component of the MFF has been progressively expanded and since 2003-4 has included the whole workforce The research by HERU found no supporting evidence for the application of the staff MFF to doctors As such the coverage of the staff index was reduced in 2009-10 and a new element the Medical and Dental London Weighting is incorporated The MampD weighting reflects the greater cost of these employees in London relative to the rest of the country
24 HERU determined that pay setting mechanisms between medical and non-medical staff differ negating the need to apply the staff index to medical staff Although there is no national variation in medical staff costs there is a significant difference in the costs of doctors in London relative to the rest of the country As such a weighting for medical and dental staff is applied to trusts in London
PbR and the Market Forces Factor (MFF) in 2013-14 Page 20 of 28
Gateway Ref 18768
Annex C ndash Worked example calculation of MFF
1 This worked example shows the calculation of the MFF for Provider A
Staff Index
2 The staff index for a hospital trust is calculated based the staff index values for individual trusts There are two sites to Provider A These are in the locality of PCT Y and PCT Z
Sites PCT area Staff Index Activity 1 Y 10385 89 2 Z 10101 11
3 Staff MFF for Provider A is thus
(08910385) + (01100101) = 10354
Medical and dental (MampD) London weighting
4 This index is calculated as the ratio of the average hospital paybill of these staff groups in 2008-09 including London weighting to the average paybill excluding the London weighting
5 Provider A has no sites located within London and therefore receives a weighting of 100
Buildings Index
6 The Buildings Index is calculated in the same way as the Staff Index
Sites PCT area Building Index Activity 1 Y 09497 89 2 Z 09693 11
7 The calculation is thus
(08909497) + (01109693) = 09519
Land Index
8 The index value of the Provider A estate is 15374
Overall Index
9 The 4 components are combined using the breakdown of national expenditure between staff buildings land and other costs The latter is assumed not to vary across the country
PbR and the Market Forces Factor (MFF) in 2013-14 Page 21 of 28
Gateway Ref 18768
Index HCHS Expenditure Index Value Weighted Index (a) (b) (c) = (a)(b)
Staff 549 10354 05684 MampD 139 10000 01390 Buildings 27 09519 00257 Land 04 15374 00061 Other 281 10000 02810
index value is the same for all trusts
10 This gives an overall target MFF value of 05684 + 01390 + 00257 + 00061 + 02810 = 10203
11 This above value is the underlying index value for Provider A This index is centred around 1 To ensure that all trusts receive non-negative payment of the MFF the underlying index is converted to a payment index with a minimum value of 1
12 To set the minimum of the payment index to 1 the underlying index with an average of 1 is divided through by the minimum value In 2013-14 the minimum value is 09263 The final MFF value for Provider A to be used for payment is thus
102209263 = 11033
PbR and the Market Forces Factor (MFF) in 2013-14 Page 22 of 28
Gateway Ref 18768
Annex D ndash Reference Cost Index (RCI)
1 The RCI is an index of the relative cost efficiency of NHS organisations The RCI is adjusted by the MFF to ensure a fair comparison between organisations across England
2 For the RCI to be comparable year-on-year the index must have an average of 100 To ensure this the application of the MFF to reference costs must be cost neutral ie the total national value of Reference Costs submitted must be the same whether it includes or excludes the MFF To obtain cost neutrality the underlying MFF is scaled The extent of this scaling depends on the percentage difference between the quantum of Reference Costs prior to the application of MFF and after it
3 The following example shows how the MFF is used to calculate the MFF-adjusted RCI Table 1 shows how the underlying MFF is scaled so that the total quantum of Reference Costs is kept constant at pound4500 This is necessary to ensure the national average RCI is 100 The factor used to scale the underlying MFF is the percentage difference between Reference Costs prior to the application of the MFF and after its application (sum of column C divided by sum of column B)
PbR and the Market Forces Factor (MFF) in 2013-14 Page 23 of 28
Gateway Ref 18768
Table 1 Scaled MFF for RCI
A B C = B A D = A sum (C) sum (B) E = B D
Underlying MFF
Total Reference Costs Quantum (pound)
Total RC Quantum adjusted for underlying MFF (pound) Scaled MFF
Total RC Quantum adjusted for scaled MFF (pound)
Provider A 10249 1250 1220 09622 1299 Provider B 11021 1000 907 10346 967 Provider C 13349 1000 749 12532 798 Provider D 09270 1250 1348 08703 1436
4500 4225 4500
4 Table 2 shows that without the scaling of the MFF the average of RCI does not equal 100 (compare the averages of columns J and L) Having the average RCI at 100 allows easy comparison of providerrsquos relative efficiency year on year Irrespective of whether the average is 100 (and any scaling) a providerrsquos index value is always the same relative to the average For example Provider D is always 22 above average
From column L [(122 ndash 100) 100] 100 = 22 From column J [(115 ndash 94) 94] 100 = 22
PbR and the Market Forces Factor (MFF) in 2013-14 Page 24 of 28
Gateway Ref 18768
Table 2 Average RCI kept at 100
F G
H = (F G)100 I = A J = H I K = D L = H K
Actual Total Cost (pound)
Expected Total Cost (pound)
Base RCI
Underlyi ng MFF
MFF adjusted RCI (based on underlying MFF)
Scaled MFF
MFF adjusted RCI (based on scaled MFF)
Provider A
1250
1300 96 10249 94 09622 100 Provider B
1000
925 108 11021 98 10346 104 Provider C
1000
1100 91 13349 68 12532 73 Provider D
1250
1175 106 09270 115 08703 122 Average 100 94 100
(RCI figures to the nearest integer)
PbR and the Market Forces Factor (MFF) in 2013-14 Page 25 of 28
Gateway Ref 18768
Annex E ndash Tariff Calculation
1 Table 3 gives an example calculation of the tariff for an HRG The underlying MFF is rebased so that the minimum value is 1 (column D) by dividing the index through by the 2013-14 minimum value of 09263 Total costs are then divided by these MFF values (column E) The income for a provider is then the product of tariff price activity and rebased MFF (column F)
Table 3 Rebasing MFF for Tariff Calculation
A B C D = C min C
E = B D F = Tariff A D
Activity Total Costs (pound)
Underlying MFF
Rebased MFF to 1
Total Costs adjusted for rebased MFF (pound)
PbR Income (pound)
Provider A Provider
60 1250 10249 11064 1130 1528
B Provider
50 1000 11021 11898 840 1369
C Provider
20 1000 13349 14411 694 663
D 40 1250 09263 1 1250 921 Total 170 4500 3913 4483
Tariff = Total costs adjusted for MFF National activity = sum of column E sum of column A
= pound3913 170 = pound2302
PbR and the Market Forces Factor (MFF) in 2013-14 Page 26 of 28
Gateway Ref 18768
2 Table 4 shows the relative difference between providers A and B for the underlying and rebased (payment) index As is shown irrespective of the index the MFF of Provider B is always 753 greater than that of Provider A This relationship is true for all providers the relativities between providers is the same regardless of how the underlying MFF is scaled
Table 4 Relative differences between providers A amp B
X Y Z = ( Y X )-1
Provider Provider MFF Indices A B Difference Underlying (col C) 10249 11021 753 Rebased to 1 (col D) 11064 11898 753
PbR and the Market Forces Factor (MFF) in 2013-14 Page 27 of 28
Gateway Ref 18768
Annex F ndash Creating an index
1 An index is a ranking of numbers relative to the same base such that they can be directly compared
2 In the example below an index value can be attached to each of the numbers in column A An index is constructed by dividing each number by the base value of the index In common with the MFF the first index created is in column B which has an average value of 10 like the underlying MFF index This index is constructed by dividing each number by the average of the index 100
Values Index with an average of 1
Index with a minimum of 1
A B C 50 050 100 95 095 190 125 125 250 130 130 260 100 100 200
Average value 100 Minimum value 50
3 The index in column B represents a ranking relative to the average value in the list The average of the values in column a is 100 The value 50 in column A is half of the average so as a relative value 50 can be expressed as 05
4 Column C represents the transformation of the index to have a minimum value of 1 akin to the payment index 50 is the lowest of all the values in column A and so in the index in column C it has a value of 10
5 As stated in the guidance irrespective of the version of the MFF index the relative unavoidable cost differences between organisations are maintained In the example above it can be seen that the relative difference between the values 50 and 100 of column A is the same in both columns B and C ie 05 is half of 10 and 10 is half of 20 This also holds for every other combination of values For example 50 is 04 times small than 125 In columns B and C the relative difference in the associated index values is also 04 (050 125 = 04) and (10 25 = 04)
PbR and the Market Forces Factor (MFF) in 2013-14 Page 28 of 28
Gateway Ref 18768
summed together to give an overall figure for the organisation6 See Annex C for a worked example of the calculation for a trust with multiple sites
Deriving an MFF value for newly merged trusts
64 Organisations that merge will have a new MFF value calculated in line with the MFF methodology For organisations merging at the beginning of the financial year this new MFF will apply from the date of the merger For organisations merging in the middle of the financial year the new MFF will apply from the beginning of the following financial year (see PbR Guidance for full policy)
65 The methodology means that each site of a merging trust will be treated not as a proportion of the trust to which it previously belonged but as a proportion of the merged organisation as a whole This is necessary as the staff and buildings components of the MFF are defined at site level The site index values are combined according to their activity levels proxied by bed numbers as per the calculation of multiple site organisations (see Annex C for worked example)
66 In some instances it may be necessary to make further adjustments to the calculation of the merged land index value Where merging trusts have very different land index values and also vary significantly in the intensity of land use the individual land index values will be combined according to trust activity levels (proxied by bed numbers) This is in line with the method used for the staff and buildings components of the MFF and acts as an extension of the adjustments already in place to recognise the differing land use intensities for London trusts with significant sites out of London
Capping policy
67 A capping policy was introduced in 2009-10 to reduce volatilities in overall PbR income resulting from any changes in the MFF values It meant that given changes to the tariff providerrsquos overall income should not change by more than +-2 as a result of using the updated MFF as opposed to using the previous years MFF In 2013-14 all organisations will have moved to their target MFF values and are no longer subject to the capping policy The 2013-14 tariff information spreadsheet includes details of the past capped payment values for each trust
6 The impact of a single overall MFF value on an organisationsrsquo income is equal to the impact of applying the index value for each element separately to the proportion of costs it represents
PbR and the Market Forces Factor (MFF) in 2013-14 Page 15 of 28
Gateway Ref 18768
Annex A ndash Composition of MFF
MFF Index
(549) (139) (04) (27) (281)
Land BuildingsStaff OtherMampD
Data Evaluated at PCT level Applied to London Valuations specific to Evaluated at PCT level and assigned to trust trusts only trustsrsquo estates and assigned to trust Level
sites relative to national sites
Variation in private Land net book values Evidence sector wages Average paybill for (2008-09) and Estates Three year Assumed not to Base
(University of Warwick hospital doctors Return Information average of tender vary in any developments by 2008-09 Collection (2008-09) prices material way
HERU)
1 The index values of each of the four component indices (staff MampD land and buildings) are multiplied by the corresponding expenditure weight to give the overall MFF value A worked example is included in Annex C
PbR and the Market Forces Factor (MFF) in 2013-14 Page 16 of 28
Gateway Ref 18768
Annex B - The Staff Index
1 This annex outlines (a) Rationale for basing the staff index on private sector rather than
NHS wages (b) The application of smoothing and interpolation and (c) Rationale for the introduction of the Medical amp dental London
weighting
Underlying data for the staff index
1 The staff element of the MFF is the largest component Although the staff index is intended to reflect non-medical NHS staff cost variations it is based on private sector rather than NHS wages The rationale for this approach generates many queries
2 The aim of the MFF is to compensate for unavoidable cost differences between providers in the delivery of services For staff expenditure variation can occur directly or indirectly direct costs are the salaries paid to staff indirect costs include expenditure incurred through labour turnover agency staff costs vacancies and reduced productivity
3 High indirect costs of employment can arise for NHS providers where the wage rate they offer is below the prevailing wage rate of the area from which they draw their staff Organisations offering relatively low wages are likely to experience higher vacancy and turnover rates relative to other employers Lower wages are also associated with lower staff productivity Research commissioned by DH7 found evidence of these outcomes in a study into the variation in wages across NHS organisations
4 Geographical variation in staff costs can be determined in two ways using NHS employment costs or private sector wages as is the convention for the MFF A brief overview of each approach is set out below
Basing the MFF on NHS staff costs
5 Whilst it would be possible to base the staff index on actual NHS costs several problems with the approach make its use inappropriate Research commissioned8 by DH confirmed the arguments against the use of this method
7 RARP 32 Review of the Market Forces Factor following the introduction of Payment by Results (2005) Exploring the General Labour Market method httpwwwdhgovukenManagingyourorganisationFinanceandplanningAllocationsDH_410 8515 8 RARP 31 Review of the Specific Cost Approach to Market Forces Factor httpwwwdhgovukenManagingyourorganisationFinanceandplanningAllocationsDH_410 8515
PbR and the Market Forces Factor (MFF) in 2013-14 Page 17 of 28
Gateway Ref 18768
6 Lack of national data availability Although it is straightforward to obtain information about high level direct employment costs within the NHS there is currently limited availability of consistent detailed data on employment costs
7 Distinguishing between avoidable and unavoidable costs Where organisations incur greater than average costs it is almost impossible to distinguish between avoidable and unavoidable components of expenditure For example by dividing the MFF range into quintiles of trusts and controlling for trust type and location there is 35 variation in the number of nurses needed for the same output between quintile 1 and 5 It is unclear whether the reasons for this variation are caused by drivers of avoidable or unavoidable costs
8 Possibility of perverse incentives Using actual NHS costs any relative changes in NHS staff costs would feed directly into the MFF calculation any trust with higher relative costs would then receive a greater staff index value when the MFF is re-calculated This issue creates an incentive for trusts to raise their indirect staff costs which would increase the staff component of their MFF (assuming that not all trusts did this thereby leaving relative wage rates unchanged) resulting in greater income from the tariff
9 Reduced incentives to improve efficiency Trusts using staff more efficiently will face lower staff costs relative to those with less efficiency When the MFF is next calculated lower staff costs would be reflected in a lower MFF value and therefore a reduced (and relatively lower) tariff income Using the NHS staff costs approach the incentives to improve efficiency under PbR would be reduced
10 In light of these issues the research confirmed that the current approach using external wage comparisons to determine differences in staff costs is appropriate
Basing the MFF on external wage comparisons
11 Basing the staff index on private sector wages was the approach recommended by the University of Warwick The original argument was conceptual but supporting evidence is now available from work commissioned by DH
12 The premise of the approach is that the private sector does not implement national pay scales and as such wages offered reflect the cost of living and amenities in that area These factors are the key drivers of relative differences in pay
13 It would not be fair to simply take the actual average private sector wage in each area This is because occupational mix varies Some areas have a much higher proportion of staff working in highly paid occupations such as law and banking These differences need to be taken into account in
PbR and the Market Forces Factor (MFF) in 2013-14 Page 18 of 28
Gateway Ref 18768
the MFF in order to ensure that we are making like for like comparisons across the country Warwick do this using a statistical technique known as regression analysis It essentially works out what wages would be in an area if each area had the same mix of occupations We similarly take account of differences in the age and gender mix of the private sector workforce in different areas
14 The staff index compensates trusts for the unavoidable variation in direct staff costs and indirect employment costs arising where NHS wages do not reflect the local market rate
15 To test for evidence of indirect employment costs the Health Economics Research Unit (HERU) commissioned by DH determined the relationship between vacancy rates and the gap between NHS and private sector wages for different staff groups For nurses the evidence illustrates that vacancy rates are higher where the gap between NHS wages and private sector wages are greater
16 The Department of Health and the Department of Communities and Local Government have undertaken a number of reviews of the approach to compensating for unavoidable differences in staff costs Both Departments concluded that this approach to the MFF continues to be the best available methodology
Smoothing and Interpolation
17 Smoothing and interpolation are two approaches used to refine the staff MFF index values so that the values for each organisation better reflect the local labour markets from which they recruit
Smoothing
18 The methodology of the staff index creates the cliff edge problem whereby neighbouring PCTs receive markedly different staff cost values because of their geographical boundaries Cliff edges may lead to an inaccurate representation of staff costs faced by a provider This problem is particularly evident for providers within different PCTs but in close proximity and facing similar local labour market pressures Smoothing techniques soften cliff edges to produce a more continuous profile of staff costs across PCTs
19 HERU recommended that smoothing take into account the relative staff index of every PCT rather than just neighbouring ones as previously This approach recognises that NHS organisations draw their labour force from a variety of PCT areas Smoothing adjusts the relative level of staff index in a PCT by accounting for relative staff index in surrounding PCTs The weights of the relative costs in surrounding areas fall the further the distance from the base PCT Smoothing brings each PCTrsquos MFF more in line with those of its surrounding PCTs
PbR and the Market Forces Factor (MFF) in 2013-14 Page 19 of 28
Gateway Ref 18768
Interpolation
20 The smoothed relative costs for PCTs described above still result in cliff edges between trusts Two trusts operating near the border of neighbouring PCTs might have different relative staff costs but operate in the same labour market As a result HERU introduced a further refinement to smoothing interpolation
21 Interpolation takes account of the location within a PCT area of the trustsrsquo sites and thus the distance from other PCT areas It involves a second stage of smoothing carried out at trust level after smoothing at PCT level and further reduces the impact of cliff edges It works the same way as smoothing in that the staff index of a trust is the distance weighted average of the surrounding PCTsrsquo staff indices
22 Interpolation is carried out at trust site level Where a trust has more than one site the different indices for each site are weighted together in proportion to activity using bed numbers as a proxy on each site
Medical and Dental (MampD) London Weighting
23 The scope of the staff component of the MFF has been progressively expanded and since 2003-4 has included the whole workforce The research by HERU found no supporting evidence for the application of the staff MFF to doctors As such the coverage of the staff index was reduced in 2009-10 and a new element the Medical and Dental London Weighting is incorporated The MampD weighting reflects the greater cost of these employees in London relative to the rest of the country
24 HERU determined that pay setting mechanisms between medical and non-medical staff differ negating the need to apply the staff index to medical staff Although there is no national variation in medical staff costs there is a significant difference in the costs of doctors in London relative to the rest of the country As such a weighting for medical and dental staff is applied to trusts in London
PbR and the Market Forces Factor (MFF) in 2013-14 Page 20 of 28
Gateway Ref 18768
Annex C ndash Worked example calculation of MFF
1 This worked example shows the calculation of the MFF for Provider A
Staff Index
2 The staff index for a hospital trust is calculated based the staff index values for individual trusts There are two sites to Provider A These are in the locality of PCT Y and PCT Z
Sites PCT area Staff Index Activity 1 Y 10385 89 2 Z 10101 11
3 Staff MFF for Provider A is thus
(08910385) + (01100101) = 10354
Medical and dental (MampD) London weighting
4 This index is calculated as the ratio of the average hospital paybill of these staff groups in 2008-09 including London weighting to the average paybill excluding the London weighting
5 Provider A has no sites located within London and therefore receives a weighting of 100
Buildings Index
6 The Buildings Index is calculated in the same way as the Staff Index
Sites PCT area Building Index Activity 1 Y 09497 89 2 Z 09693 11
7 The calculation is thus
(08909497) + (01109693) = 09519
Land Index
8 The index value of the Provider A estate is 15374
Overall Index
9 The 4 components are combined using the breakdown of national expenditure between staff buildings land and other costs The latter is assumed not to vary across the country
PbR and the Market Forces Factor (MFF) in 2013-14 Page 21 of 28
Gateway Ref 18768
Index HCHS Expenditure Index Value Weighted Index (a) (b) (c) = (a)(b)
Staff 549 10354 05684 MampD 139 10000 01390 Buildings 27 09519 00257 Land 04 15374 00061 Other 281 10000 02810
index value is the same for all trusts
10 This gives an overall target MFF value of 05684 + 01390 + 00257 + 00061 + 02810 = 10203
11 This above value is the underlying index value for Provider A This index is centred around 1 To ensure that all trusts receive non-negative payment of the MFF the underlying index is converted to a payment index with a minimum value of 1
12 To set the minimum of the payment index to 1 the underlying index with an average of 1 is divided through by the minimum value In 2013-14 the minimum value is 09263 The final MFF value for Provider A to be used for payment is thus
102209263 = 11033
PbR and the Market Forces Factor (MFF) in 2013-14 Page 22 of 28
Gateway Ref 18768
Annex D ndash Reference Cost Index (RCI)
1 The RCI is an index of the relative cost efficiency of NHS organisations The RCI is adjusted by the MFF to ensure a fair comparison between organisations across England
2 For the RCI to be comparable year-on-year the index must have an average of 100 To ensure this the application of the MFF to reference costs must be cost neutral ie the total national value of Reference Costs submitted must be the same whether it includes or excludes the MFF To obtain cost neutrality the underlying MFF is scaled The extent of this scaling depends on the percentage difference between the quantum of Reference Costs prior to the application of MFF and after it
3 The following example shows how the MFF is used to calculate the MFF-adjusted RCI Table 1 shows how the underlying MFF is scaled so that the total quantum of Reference Costs is kept constant at pound4500 This is necessary to ensure the national average RCI is 100 The factor used to scale the underlying MFF is the percentage difference between Reference Costs prior to the application of the MFF and after its application (sum of column C divided by sum of column B)
PbR and the Market Forces Factor (MFF) in 2013-14 Page 23 of 28
Gateway Ref 18768
Table 1 Scaled MFF for RCI
A B C = B A D = A sum (C) sum (B) E = B D
Underlying MFF
Total Reference Costs Quantum (pound)
Total RC Quantum adjusted for underlying MFF (pound) Scaled MFF
Total RC Quantum adjusted for scaled MFF (pound)
Provider A 10249 1250 1220 09622 1299 Provider B 11021 1000 907 10346 967 Provider C 13349 1000 749 12532 798 Provider D 09270 1250 1348 08703 1436
4500 4225 4500
4 Table 2 shows that without the scaling of the MFF the average of RCI does not equal 100 (compare the averages of columns J and L) Having the average RCI at 100 allows easy comparison of providerrsquos relative efficiency year on year Irrespective of whether the average is 100 (and any scaling) a providerrsquos index value is always the same relative to the average For example Provider D is always 22 above average
From column L [(122 ndash 100) 100] 100 = 22 From column J [(115 ndash 94) 94] 100 = 22
PbR and the Market Forces Factor (MFF) in 2013-14 Page 24 of 28
Gateway Ref 18768
Table 2 Average RCI kept at 100
F G
H = (F G)100 I = A J = H I K = D L = H K
Actual Total Cost (pound)
Expected Total Cost (pound)
Base RCI
Underlyi ng MFF
MFF adjusted RCI (based on underlying MFF)
Scaled MFF
MFF adjusted RCI (based on scaled MFF)
Provider A
1250
1300 96 10249 94 09622 100 Provider B
1000
925 108 11021 98 10346 104 Provider C
1000
1100 91 13349 68 12532 73 Provider D
1250
1175 106 09270 115 08703 122 Average 100 94 100
(RCI figures to the nearest integer)
PbR and the Market Forces Factor (MFF) in 2013-14 Page 25 of 28
Gateway Ref 18768
Annex E ndash Tariff Calculation
1 Table 3 gives an example calculation of the tariff for an HRG The underlying MFF is rebased so that the minimum value is 1 (column D) by dividing the index through by the 2013-14 minimum value of 09263 Total costs are then divided by these MFF values (column E) The income for a provider is then the product of tariff price activity and rebased MFF (column F)
Table 3 Rebasing MFF for Tariff Calculation
A B C D = C min C
E = B D F = Tariff A D
Activity Total Costs (pound)
Underlying MFF
Rebased MFF to 1
Total Costs adjusted for rebased MFF (pound)
PbR Income (pound)
Provider A Provider
60 1250 10249 11064 1130 1528
B Provider
50 1000 11021 11898 840 1369
C Provider
20 1000 13349 14411 694 663
D 40 1250 09263 1 1250 921 Total 170 4500 3913 4483
Tariff = Total costs adjusted for MFF National activity = sum of column E sum of column A
= pound3913 170 = pound2302
PbR and the Market Forces Factor (MFF) in 2013-14 Page 26 of 28
Gateway Ref 18768
2 Table 4 shows the relative difference between providers A and B for the underlying and rebased (payment) index As is shown irrespective of the index the MFF of Provider B is always 753 greater than that of Provider A This relationship is true for all providers the relativities between providers is the same regardless of how the underlying MFF is scaled
Table 4 Relative differences between providers A amp B
X Y Z = ( Y X )-1
Provider Provider MFF Indices A B Difference Underlying (col C) 10249 11021 753 Rebased to 1 (col D) 11064 11898 753
PbR and the Market Forces Factor (MFF) in 2013-14 Page 27 of 28
Gateway Ref 18768
Annex F ndash Creating an index
1 An index is a ranking of numbers relative to the same base such that they can be directly compared
2 In the example below an index value can be attached to each of the numbers in column A An index is constructed by dividing each number by the base value of the index In common with the MFF the first index created is in column B which has an average value of 10 like the underlying MFF index This index is constructed by dividing each number by the average of the index 100
Values Index with an average of 1
Index with a minimum of 1
A B C 50 050 100 95 095 190 125 125 250 130 130 260 100 100 200
Average value 100 Minimum value 50
3 The index in column B represents a ranking relative to the average value in the list The average of the values in column a is 100 The value 50 in column A is half of the average so as a relative value 50 can be expressed as 05
4 Column C represents the transformation of the index to have a minimum value of 1 akin to the payment index 50 is the lowest of all the values in column A and so in the index in column C it has a value of 10
5 As stated in the guidance irrespective of the version of the MFF index the relative unavoidable cost differences between organisations are maintained In the example above it can be seen that the relative difference between the values 50 and 100 of column A is the same in both columns B and C ie 05 is half of 10 and 10 is half of 20 This also holds for every other combination of values For example 50 is 04 times small than 125 In columns B and C the relative difference in the associated index values is also 04 (050 125 = 04) and (10 25 = 04)
PbR and the Market Forces Factor (MFF) in 2013-14 Page 28 of 28
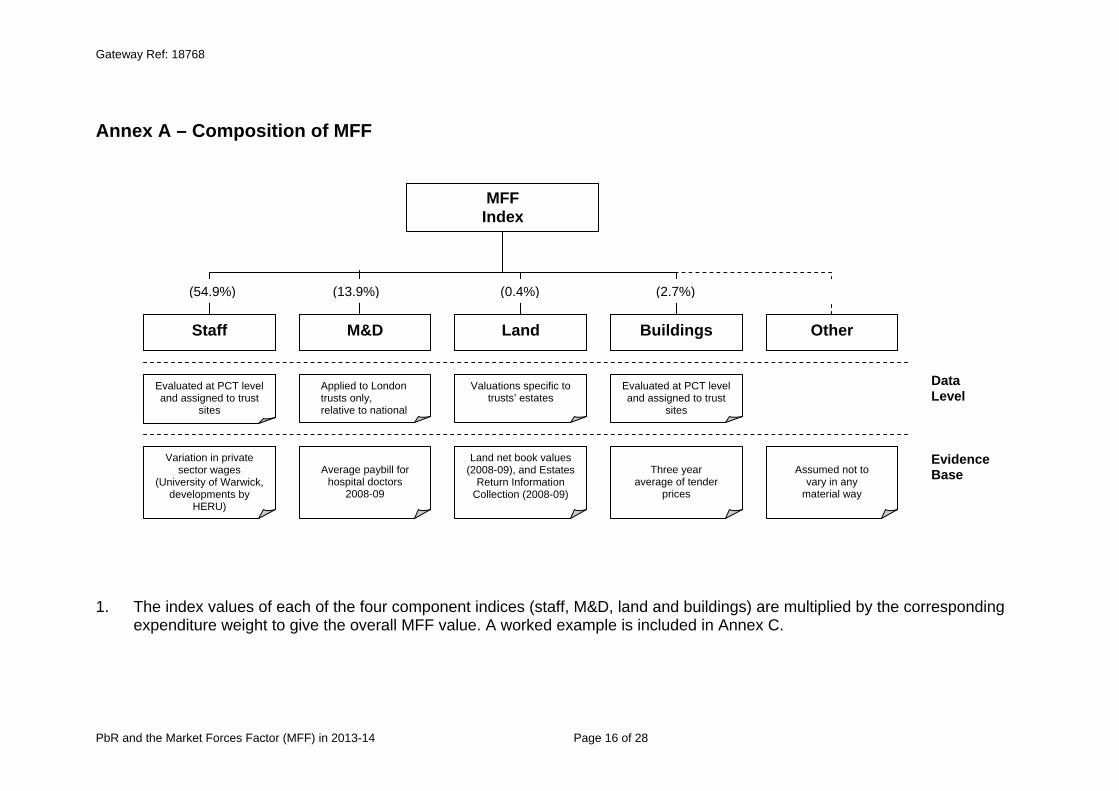
Gateway Ref 18768
Annex A ndash Composition of MFF
MFF Index
(549) (139) (04) (27) (281)
Land BuildingsStaff OtherMampD
Data Evaluated at PCT level Applied to London Valuations specific to Evaluated at PCT level and assigned to trust trusts only trustsrsquo estates and assigned to trust Level
sites relative to national sites
Variation in private Land net book values Evidence sector wages Average paybill for (2008-09) and Estates Three year Assumed not to Base
(University of Warwick hospital doctors Return Information average of tender vary in any developments by 2008-09 Collection (2008-09) prices material way
HERU)
1 The index values of each of the four component indices (staff MampD land and buildings) are multiplied by the corresponding expenditure weight to give the overall MFF value A worked example is included in Annex C
PbR and the Market Forces Factor (MFF) in 2013-14 Page 16 of 28
Gateway Ref 18768
Annex B - The Staff Index
1 This annex outlines (a) Rationale for basing the staff index on private sector rather than
NHS wages (b) The application of smoothing and interpolation and (c) Rationale for the introduction of the Medical amp dental London
weighting
Underlying data for the staff index
1 The staff element of the MFF is the largest component Although the staff index is intended to reflect non-medical NHS staff cost variations it is based on private sector rather than NHS wages The rationale for this approach generates many queries
2 The aim of the MFF is to compensate for unavoidable cost differences between providers in the delivery of services For staff expenditure variation can occur directly or indirectly direct costs are the salaries paid to staff indirect costs include expenditure incurred through labour turnover agency staff costs vacancies and reduced productivity
3 High indirect costs of employment can arise for NHS providers where the wage rate they offer is below the prevailing wage rate of the area from which they draw their staff Organisations offering relatively low wages are likely to experience higher vacancy and turnover rates relative to other employers Lower wages are also associated with lower staff productivity Research commissioned by DH7 found evidence of these outcomes in a study into the variation in wages across NHS organisations
4 Geographical variation in staff costs can be determined in two ways using NHS employment costs or private sector wages as is the convention for the MFF A brief overview of each approach is set out below
Basing the MFF on NHS staff costs
5 Whilst it would be possible to base the staff index on actual NHS costs several problems with the approach make its use inappropriate Research commissioned8 by DH confirmed the arguments against the use of this method
7 RARP 32 Review of the Market Forces Factor following the introduction of Payment by Results (2005) Exploring the General Labour Market method httpwwwdhgovukenManagingyourorganisationFinanceandplanningAllocationsDH_410 8515 8 RARP 31 Review of the Specific Cost Approach to Market Forces Factor httpwwwdhgovukenManagingyourorganisationFinanceandplanningAllocationsDH_410 8515
PbR and the Market Forces Factor (MFF) in 2013-14 Page 17 of 28
Gateway Ref 18768
6 Lack of national data availability Although it is straightforward to obtain information about high level direct employment costs within the NHS there is currently limited availability of consistent detailed data on employment costs
7 Distinguishing between avoidable and unavoidable costs Where organisations incur greater than average costs it is almost impossible to distinguish between avoidable and unavoidable components of expenditure For example by dividing the MFF range into quintiles of trusts and controlling for trust type and location there is 35 variation in the number of nurses needed for the same output between quintile 1 and 5 It is unclear whether the reasons for this variation are caused by drivers of avoidable or unavoidable costs
8 Possibility of perverse incentives Using actual NHS costs any relative changes in NHS staff costs would feed directly into the MFF calculation any trust with higher relative costs would then receive a greater staff index value when the MFF is re-calculated This issue creates an incentive for trusts to raise their indirect staff costs which would increase the staff component of their MFF (assuming that not all trusts did this thereby leaving relative wage rates unchanged) resulting in greater income from the tariff
9 Reduced incentives to improve efficiency Trusts using staff more efficiently will face lower staff costs relative to those with less efficiency When the MFF is next calculated lower staff costs would be reflected in a lower MFF value and therefore a reduced (and relatively lower) tariff income Using the NHS staff costs approach the incentives to improve efficiency under PbR would be reduced
10 In light of these issues the research confirmed that the current approach using external wage comparisons to determine differences in staff costs is appropriate
Basing the MFF on external wage comparisons
11 Basing the staff index on private sector wages was the approach recommended by the University of Warwick The original argument was conceptual but supporting evidence is now available from work commissioned by DH
12 The premise of the approach is that the private sector does not implement national pay scales and as such wages offered reflect the cost of living and amenities in that area These factors are the key drivers of relative differences in pay
13 It would not be fair to simply take the actual average private sector wage in each area This is because occupational mix varies Some areas have a much higher proportion of staff working in highly paid occupations such as law and banking These differences need to be taken into account in
PbR and the Market Forces Factor (MFF) in 2013-14 Page 18 of 28
Gateway Ref 18768
the MFF in order to ensure that we are making like for like comparisons across the country Warwick do this using a statistical technique known as regression analysis It essentially works out what wages would be in an area if each area had the same mix of occupations We similarly take account of differences in the age and gender mix of the private sector workforce in different areas
14 The staff index compensates trusts for the unavoidable variation in direct staff costs and indirect employment costs arising where NHS wages do not reflect the local market rate
15 To test for evidence of indirect employment costs the Health Economics Research Unit (HERU) commissioned by DH determined the relationship between vacancy rates and the gap between NHS and private sector wages for different staff groups For nurses the evidence illustrates that vacancy rates are higher where the gap between NHS wages and private sector wages are greater
16 The Department of Health and the Department of Communities and Local Government have undertaken a number of reviews of the approach to compensating for unavoidable differences in staff costs Both Departments concluded that this approach to the MFF continues to be the best available methodology
Smoothing and Interpolation
17 Smoothing and interpolation are two approaches used to refine the staff MFF index values so that the values for each organisation better reflect the local labour markets from which they recruit
Smoothing
18 The methodology of the staff index creates the cliff edge problem whereby neighbouring PCTs receive markedly different staff cost values because of their geographical boundaries Cliff edges may lead to an inaccurate representation of staff costs faced by a provider This problem is particularly evident for providers within different PCTs but in close proximity and facing similar local labour market pressures Smoothing techniques soften cliff edges to produce a more continuous profile of staff costs across PCTs
19 HERU recommended that smoothing take into account the relative staff index of every PCT rather than just neighbouring ones as previously This approach recognises that NHS organisations draw their labour force from a variety of PCT areas Smoothing adjusts the relative level of staff index in a PCT by accounting for relative staff index in surrounding PCTs The weights of the relative costs in surrounding areas fall the further the distance from the base PCT Smoothing brings each PCTrsquos MFF more in line with those of its surrounding PCTs
PbR and the Market Forces Factor (MFF) in 2013-14 Page 19 of 28
Gateway Ref 18768
Interpolation
20 The smoothed relative costs for PCTs described above still result in cliff edges between trusts Two trusts operating near the border of neighbouring PCTs might have different relative staff costs but operate in the same labour market As a result HERU introduced a further refinement to smoothing interpolation
21 Interpolation takes account of the location within a PCT area of the trustsrsquo sites and thus the distance from other PCT areas It involves a second stage of smoothing carried out at trust level after smoothing at PCT level and further reduces the impact of cliff edges It works the same way as smoothing in that the staff index of a trust is the distance weighted average of the surrounding PCTsrsquo staff indices
22 Interpolation is carried out at trust site level Where a trust has more than one site the different indices for each site are weighted together in proportion to activity using bed numbers as a proxy on each site
Medical and Dental (MampD) London Weighting
23 The scope of the staff component of the MFF has been progressively expanded and since 2003-4 has included the whole workforce The research by HERU found no supporting evidence for the application of the staff MFF to doctors As such the coverage of the staff index was reduced in 2009-10 and a new element the Medical and Dental London Weighting is incorporated The MampD weighting reflects the greater cost of these employees in London relative to the rest of the country
24 HERU determined that pay setting mechanisms between medical and non-medical staff differ negating the need to apply the staff index to medical staff Although there is no national variation in medical staff costs there is a significant difference in the costs of doctors in London relative to the rest of the country As such a weighting for medical and dental staff is applied to trusts in London
PbR and the Market Forces Factor (MFF) in 2013-14 Page 20 of 28
Gateway Ref 18768
Annex C ndash Worked example calculation of MFF
1 This worked example shows the calculation of the MFF for Provider A
Staff Index
2 The staff index for a hospital trust is calculated based the staff index values for individual trusts There are two sites to Provider A These are in the locality of PCT Y and PCT Z
Sites PCT area Staff Index Activity 1 Y 10385 89 2 Z 10101 11
3 Staff MFF for Provider A is thus
(08910385) + (01100101) = 10354
Medical and dental (MampD) London weighting
4 This index is calculated as the ratio of the average hospital paybill of these staff groups in 2008-09 including London weighting to the average paybill excluding the London weighting
5 Provider A has no sites located within London and therefore receives a weighting of 100
Buildings Index
6 The Buildings Index is calculated in the same way as the Staff Index
Sites PCT area Building Index Activity 1 Y 09497 89 2 Z 09693 11
7 The calculation is thus
(08909497) + (01109693) = 09519
Land Index
8 The index value of the Provider A estate is 15374
Overall Index
9 The 4 components are combined using the breakdown of national expenditure between staff buildings land and other costs The latter is assumed not to vary across the country
PbR and the Market Forces Factor (MFF) in 2013-14 Page 21 of 28
Gateway Ref 18768
Index HCHS Expenditure Index Value Weighted Index (a) (b) (c) = (a)(b)
Staff 549 10354 05684 MampD 139 10000 01390 Buildings 27 09519 00257 Land 04 15374 00061 Other 281 10000 02810
index value is the same for all trusts
10 This gives an overall target MFF value of 05684 + 01390 + 00257 + 00061 + 02810 = 10203
11 This above value is the underlying index value for Provider A This index is centred around 1 To ensure that all trusts receive non-negative payment of the MFF the underlying index is converted to a payment index with a minimum value of 1
12 To set the minimum of the payment index to 1 the underlying index with an average of 1 is divided through by the minimum value In 2013-14 the minimum value is 09263 The final MFF value for Provider A to be used for payment is thus
102209263 = 11033
PbR and the Market Forces Factor (MFF) in 2013-14 Page 22 of 28
Gateway Ref 18768
Annex D ndash Reference Cost Index (RCI)
1 The RCI is an index of the relative cost efficiency of NHS organisations The RCI is adjusted by the MFF to ensure a fair comparison between organisations across England
2 For the RCI to be comparable year-on-year the index must have an average of 100 To ensure this the application of the MFF to reference costs must be cost neutral ie the total national value of Reference Costs submitted must be the same whether it includes or excludes the MFF To obtain cost neutrality the underlying MFF is scaled The extent of this scaling depends on the percentage difference between the quantum of Reference Costs prior to the application of MFF and after it
3 The following example shows how the MFF is used to calculate the MFF-adjusted RCI Table 1 shows how the underlying MFF is scaled so that the total quantum of Reference Costs is kept constant at pound4500 This is necessary to ensure the national average RCI is 100 The factor used to scale the underlying MFF is the percentage difference between Reference Costs prior to the application of the MFF and after its application (sum of column C divided by sum of column B)
PbR and the Market Forces Factor (MFF) in 2013-14 Page 23 of 28
Gateway Ref 18768
Table 1 Scaled MFF for RCI
A B C = B A D = A sum (C) sum (B) E = B D
Underlying MFF
Total Reference Costs Quantum (pound)
Total RC Quantum adjusted for underlying MFF (pound) Scaled MFF
Total RC Quantum adjusted for scaled MFF (pound)
Provider A 10249 1250 1220 09622 1299 Provider B 11021 1000 907 10346 967 Provider C 13349 1000 749 12532 798 Provider D 09270 1250 1348 08703 1436
4500 4225 4500
4 Table 2 shows that without the scaling of the MFF the average of RCI does not equal 100 (compare the averages of columns J and L) Having the average RCI at 100 allows easy comparison of providerrsquos relative efficiency year on year Irrespective of whether the average is 100 (and any scaling) a providerrsquos index value is always the same relative to the average For example Provider D is always 22 above average
From column L [(122 ndash 100) 100] 100 = 22 From column J [(115 ndash 94) 94] 100 = 22
PbR and the Market Forces Factor (MFF) in 2013-14 Page 24 of 28
Gateway Ref 18768
Table 2 Average RCI kept at 100
F G
H = (F G)100 I = A J = H I K = D L = H K
Actual Total Cost (pound)
Expected Total Cost (pound)
Base RCI
Underlyi ng MFF
MFF adjusted RCI (based on underlying MFF)
Scaled MFF
MFF adjusted RCI (based on scaled MFF)
Provider A
1250
1300 96 10249 94 09622 100 Provider B
1000
925 108 11021 98 10346 104 Provider C
1000
1100 91 13349 68 12532 73 Provider D
1250
1175 106 09270 115 08703 122 Average 100 94 100
(RCI figures to the nearest integer)
PbR and the Market Forces Factor (MFF) in 2013-14 Page 25 of 28
Gateway Ref 18768
Annex E ndash Tariff Calculation
1 Table 3 gives an example calculation of the tariff for an HRG The underlying MFF is rebased so that the minimum value is 1 (column D) by dividing the index through by the 2013-14 minimum value of 09263 Total costs are then divided by these MFF values (column E) The income for a provider is then the product of tariff price activity and rebased MFF (column F)
Table 3 Rebasing MFF for Tariff Calculation
A B C D = C min C
E = B D F = Tariff A D
Activity Total Costs (pound)
Underlying MFF
Rebased MFF to 1
Total Costs adjusted for rebased MFF (pound)
PbR Income (pound)
Provider A Provider
60 1250 10249 11064 1130 1528
B Provider
50 1000 11021 11898 840 1369
C Provider
20 1000 13349 14411 694 663
D 40 1250 09263 1 1250 921 Total 170 4500 3913 4483
Tariff = Total costs adjusted for MFF National activity = sum of column E sum of column A
= pound3913 170 = pound2302
PbR and the Market Forces Factor (MFF) in 2013-14 Page 26 of 28
Gateway Ref 18768
2 Table 4 shows the relative difference between providers A and B for the underlying and rebased (payment) index As is shown irrespective of the index the MFF of Provider B is always 753 greater than that of Provider A This relationship is true for all providers the relativities between providers is the same regardless of how the underlying MFF is scaled
Table 4 Relative differences between providers A amp B
X Y Z = ( Y X )-1
Provider Provider MFF Indices A B Difference Underlying (col C) 10249 11021 753 Rebased to 1 (col D) 11064 11898 753
PbR and the Market Forces Factor (MFF) in 2013-14 Page 27 of 28
Gateway Ref 18768
Annex F ndash Creating an index
1 An index is a ranking of numbers relative to the same base such that they can be directly compared
2 In the example below an index value can be attached to each of the numbers in column A An index is constructed by dividing each number by the base value of the index In common with the MFF the first index created is in column B which has an average value of 10 like the underlying MFF index This index is constructed by dividing each number by the average of the index 100
Values Index with an average of 1
Index with a minimum of 1
A B C 50 050 100 95 095 190 125 125 250 130 130 260 100 100 200
Average value 100 Minimum value 50
3 The index in column B represents a ranking relative to the average value in the list The average of the values in column a is 100 The value 50 in column A is half of the average so as a relative value 50 can be expressed as 05
4 Column C represents the transformation of the index to have a minimum value of 1 akin to the payment index 50 is the lowest of all the values in column A and so in the index in column C it has a value of 10
5 As stated in the guidance irrespective of the version of the MFF index the relative unavoidable cost differences between organisations are maintained In the example above it can be seen that the relative difference between the values 50 and 100 of column A is the same in both columns B and C ie 05 is half of 10 and 10 is half of 20 This also holds for every other combination of values For example 50 is 04 times small than 125 In columns B and C the relative difference in the associated index values is also 04 (050 125 = 04) and (10 25 = 04)
PbR and the Market Forces Factor (MFF) in 2013-14 Page 28 of 28
Gateway Ref 18768
Annex B - The Staff Index
1 This annex outlines (a) Rationale for basing the staff index on private sector rather than
NHS wages (b) The application of smoothing and interpolation and (c) Rationale for the introduction of the Medical amp dental London
weighting
Underlying data for the staff index
1 The staff element of the MFF is the largest component Although the staff index is intended to reflect non-medical NHS staff cost variations it is based on private sector rather than NHS wages The rationale for this approach generates many queries
2 The aim of the MFF is to compensate for unavoidable cost differences between providers in the delivery of services For staff expenditure variation can occur directly or indirectly direct costs are the salaries paid to staff indirect costs include expenditure incurred through labour turnover agency staff costs vacancies and reduced productivity
3 High indirect costs of employment can arise for NHS providers where the wage rate they offer is below the prevailing wage rate of the area from which they draw their staff Organisations offering relatively low wages are likely to experience higher vacancy and turnover rates relative to other employers Lower wages are also associated with lower staff productivity Research commissioned by DH7 found evidence of these outcomes in a study into the variation in wages across NHS organisations
4 Geographical variation in staff costs can be determined in two ways using NHS employment costs or private sector wages as is the convention for the MFF A brief overview of each approach is set out below
Basing the MFF on NHS staff costs
5 Whilst it would be possible to base the staff index on actual NHS costs several problems with the approach make its use inappropriate Research commissioned8 by DH confirmed the arguments against the use of this method
7 RARP 32 Review of the Market Forces Factor following the introduction of Payment by Results (2005) Exploring the General Labour Market method httpwwwdhgovukenManagingyourorganisationFinanceandplanningAllocationsDH_410 8515 8 RARP 31 Review of the Specific Cost Approach to Market Forces Factor httpwwwdhgovukenManagingyourorganisationFinanceandplanningAllocationsDH_410 8515
PbR and the Market Forces Factor (MFF) in 2013-14 Page 17 of 28
Gateway Ref 18768
6 Lack of national data availability Although it is straightforward to obtain information about high level direct employment costs within the NHS there is currently limited availability of consistent detailed data on employment costs
7 Distinguishing between avoidable and unavoidable costs Where organisations incur greater than average costs it is almost impossible to distinguish between avoidable and unavoidable components of expenditure For example by dividing the MFF range into quintiles of trusts and controlling for trust type and location there is 35 variation in the number of nurses needed for the same output between quintile 1 and 5 It is unclear whether the reasons for this variation are caused by drivers of avoidable or unavoidable costs
8 Possibility of perverse incentives Using actual NHS costs any relative changes in NHS staff costs would feed directly into the MFF calculation any trust with higher relative costs would then receive a greater staff index value when the MFF is re-calculated This issue creates an incentive for trusts to raise their indirect staff costs which would increase the staff component of their MFF (assuming that not all trusts did this thereby leaving relative wage rates unchanged) resulting in greater income from the tariff
9 Reduced incentives to improve efficiency Trusts using staff more efficiently will face lower staff costs relative to those with less efficiency When the MFF is next calculated lower staff costs would be reflected in a lower MFF value and therefore a reduced (and relatively lower) tariff income Using the NHS staff costs approach the incentives to improve efficiency under PbR would be reduced
10 In light of these issues the research confirmed that the current approach using external wage comparisons to determine differences in staff costs is appropriate
Basing the MFF on external wage comparisons
11 Basing the staff index on private sector wages was the approach recommended by the University of Warwick The original argument was conceptual but supporting evidence is now available from work commissioned by DH
12 The premise of the approach is that the private sector does not implement national pay scales and as such wages offered reflect the cost of living and amenities in that area These factors are the key drivers of relative differences in pay
13 It would not be fair to simply take the actual average private sector wage in each area This is because occupational mix varies Some areas have a much higher proportion of staff working in highly paid occupations such as law and banking These differences need to be taken into account in
PbR and the Market Forces Factor (MFF) in 2013-14 Page 18 of 28
Gateway Ref 18768
the MFF in order to ensure that we are making like for like comparisons across the country Warwick do this using a statistical technique known as regression analysis It essentially works out what wages would be in an area if each area had the same mix of occupations We similarly take account of differences in the age and gender mix of the private sector workforce in different areas
14 The staff index compensates trusts for the unavoidable variation in direct staff costs and indirect employment costs arising where NHS wages do not reflect the local market rate
15 To test for evidence of indirect employment costs the Health Economics Research Unit (HERU) commissioned by DH determined the relationship between vacancy rates and the gap between NHS and private sector wages for different staff groups For nurses the evidence illustrates that vacancy rates are higher where the gap between NHS wages and private sector wages are greater
16 The Department of Health and the Department of Communities and Local Government have undertaken a number of reviews of the approach to compensating for unavoidable differences in staff costs Both Departments concluded that this approach to the MFF continues to be the best available methodology
Smoothing and Interpolation
17 Smoothing and interpolation are two approaches used to refine the staff MFF index values so that the values for each organisation better reflect the local labour markets from which they recruit
Smoothing
18 The methodology of the staff index creates the cliff edge problem whereby neighbouring PCTs receive markedly different staff cost values because of their geographical boundaries Cliff edges may lead to an inaccurate representation of staff costs faced by a provider This problem is particularly evident for providers within different PCTs but in close proximity and facing similar local labour market pressures Smoothing techniques soften cliff edges to produce a more continuous profile of staff costs across PCTs
19 HERU recommended that smoothing take into account the relative staff index of every PCT rather than just neighbouring ones as previously This approach recognises that NHS organisations draw their labour force from a variety of PCT areas Smoothing adjusts the relative level of staff index in a PCT by accounting for relative staff index in surrounding PCTs The weights of the relative costs in surrounding areas fall the further the distance from the base PCT Smoothing brings each PCTrsquos MFF more in line with those of its surrounding PCTs
PbR and the Market Forces Factor (MFF) in 2013-14 Page 19 of 28
Gateway Ref 18768
Interpolation
20 The smoothed relative costs for PCTs described above still result in cliff edges between trusts Two trusts operating near the border of neighbouring PCTs might have different relative staff costs but operate in the same labour market As a result HERU introduced a further refinement to smoothing interpolation
21 Interpolation takes account of the location within a PCT area of the trustsrsquo sites and thus the distance from other PCT areas It involves a second stage of smoothing carried out at trust level after smoothing at PCT level and further reduces the impact of cliff edges It works the same way as smoothing in that the staff index of a trust is the distance weighted average of the surrounding PCTsrsquo staff indices
22 Interpolation is carried out at trust site level Where a trust has more than one site the different indices for each site are weighted together in proportion to activity using bed numbers as a proxy on each site
Medical and Dental (MampD) London Weighting
23 The scope of the staff component of the MFF has been progressively expanded and since 2003-4 has included the whole workforce The research by HERU found no supporting evidence for the application of the staff MFF to doctors As such the coverage of the staff index was reduced in 2009-10 and a new element the Medical and Dental London Weighting is incorporated The MampD weighting reflects the greater cost of these employees in London relative to the rest of the country
24 HERU determined that pay setting mechanisms between medical and non-medical staff differ negating the need to apply the staff index to medical staff Although there is no national variation in medical staff costs there is a significant difference in the costs of doctors in London relative to the rest of the country As such a weighting for medical and dental staff is applied to trusts in London
PbR and the Market Forces Factor (MFF) in 2013-14 Page 20 of 28
Gateway Ref 18768
Annex C ndash Worked example calculation of MFF
1 This worked example shows the calculation of the MFF for Provider A
Staff Index
2 The staff index for a hospital trust is calculated based the staff index values for individual trusts There are two sites to Provider A These are in the locality of PCT Y and PCT Z
Sites PCT area Staff Index Activity 1 Y 10385 89 2 Z 10101 11
3 Staff MFF for Provider A is thus
(08910385) + (01100101) = 10354
Medical and dental (MampD) London weighting
4 This index is calculated as the ratio of the average hospital paybill of these staff groups in 2008-09 including London weighting to the average paybill excluding the London weighting
5 Provider A has no sites located within London and therefore receives a weighting of 100
Buildings Index
6 The Buildings Index is calculated in the same way as the Staff Index
Sites PCT area Building Index Activity 1 Y 09497 89 2 Z 09693 11
7 The calculation is thus
(08909497) + (01109693) = 09519
Land Index
8 The index value of the Provider A estate is 15374
Overall Index
9 The 4 components are combined using the breakdown of national expenditure between staff buildings land and other costs The latter is assumed not to vary across the country
PbR and the Market Forces Factor (MFF) in 2013-14 Page 21 of 28
Gateway Ref 18768
Index HCHS Expenditure Index Value Weighted Index (a) (b) (c) = (a)(b)
Staff 549 10354 05684 MampD 139 10000 01390 Buildings 27 09519 00257 Land 04 15374 00061 Other 281 10000 02810
index value is the same for all trusts
10 This gives an overall target MFF value of 05684 + 01390 + 00257 + 00061 + 02810 = 10203
11 This above value is the underlying index value for Provider A This index is centred around 1 To ensure that all trusts receive non-negative payment of the MFF the underlying index is converted to a payment index with a minimum value of 1
12 To set the minimum of the payment index to 1 the underlying index with an average of 1 is divided through by the minimum value In 2013-14 the minimum value is 09263 The final MFF value for Provider A to be used for payment is thus
102209263 = 11033
PbR and the Market Forces Factor (MFF) in 2013-14 Page 22 of 28
Gateway Ref 18768
Annex D ndash Reference Cost Index (RCI)
1 The RCI is an index of the relative cost efficiency of NHS organisations The RCI is adjusted by the MFF to ensure a fair comparison between organisations across England
2 For the RCI to be comparable year-on-year the index must have an average of 100 To ensure this the application of the MFF to reference costs must be cost neutral ie the total national value of Reference Costs submitted must be the same whether it includes or excludes the MFF To obtain cost neutrality the underlying MFF is scaled The extent of this scaling depends on the percentage difference between the quantum of Reference Costs prior to the application of MFF and after it
3 The following example shows how the MFF is used to calculate the MFF-adjusted RCI Table 1 shows how the underlying MFF is scaled so that the total quantum of Reference Costs is kept constant at pound4500 This is necessary to ensure the national average RCI is 100 The factor used to scale the underlying MFF is the percentage difference between Reference Costs prior to the application of the MFF and after its application (sum of column C divided by sum of column B)
PbR and the Market Forces Factor (MFF) in 2013-14 Page 23 of 28
Gateway Ref 18768
Table 1 Scaled MFF for RCI
A B C = B A D = A sum (C) sum (B) E = B D
Underlying MFF
Total Reference Costs Quantum (pound)
Total RC Quantum adjusted for underlying MFF (pound) Scaled MFF
Total RC Quantum adjusted for scaled MFF (pound)
Provider A 10249 1250 1220 09622 1299 Provider B 11021 1000 907 10346 967 Provider C 13349 1000 749 12532 798 Provider D 09270 1250 1348 08703 1436
4500 4225 4500
4 Table 2 shows that without the scaling of the MFF the average of RCI does not equal 100 (compare the averages of columns J and L) Having the average RCI at 100 allows easy comparison of providerrsquos relative efficiency year on year Irrespective of whether the average is 100 (and any scaling) a providerrsquos index value is always the same relative to the average For example Provider D is always 22 above average
From column L [(122 ndash 100) 100] 100 = 22 From column J [(115 ndash 94) 94] 100 = 22
PbR and the Market Forces Factor (MFF) in 2013-14 Page 24 of 28
Gateway Ref 18768
Table 2 Average RCI kept at 100
F G
H = (F G)100 I = A J = H I K = D L = H K
Actual Total Cost (pound)
Expected Total Cost (pound)
Base RCI
Underlyi ng MFF
MFF adjusted RCI (based on underlying MFF)
Scaled MFF
MFF adjusted RCI (based on scaled MFF)
Provider A
1250
1300 96 10249 94 09622 100 Provider B
1000
925 108 11021 98 10346 104 Provider C
1000
1100 91 13349 68 12532 73 Provider D
1250
1175 106 09270 115 08703 122 Average 100 94 100
(RCI figures to the nearest integer)
PbR and the Market Forces Factor (MFF) in 2013-14 Page 25 of 28
Gateway Ref 18768
Annex E ndash Tariff Calculation
1 Table 3 gives an example calculation of the tariff for an HRG The underlying MFF is rebased so that the minimum value is 1 (column D) by dividing the index through by the 2013-14 minimum value of 09263 Total costs are then divided by these MFF values (column E) The income for a provider is then the product of tariff price activity and rebased MFF (column F)
Table 3 Rebasing MFF for Tariff Calculation
A B C D = C min C
E = B D F = Tariff A D
Activity Total Costs (pound)
Underlying MFF
Rebased MFF to 1
Total Costs adjusted for rebased MFF (pound)
PbR Income (pound)
Provider A Provider
60 1250 10249 11064 1130 1528
B Provider
50 1000 11021 11898 840 1369
C Provider
20 1000 13349 14411 694 663
D 40 1250 09263 1 1250 921 Total 170 4500 3913 4483
Tariff = Total costs adjusted for MFF National activity = sum of column E sum of column A
= pound3913 170 = pound2302
PbR and the Market Forces Factor (MFF) in 2013-14 Page 26 of 28
Gateway Ref 18768
2 Table 4 shows the relative difference between providers A and B for the underlying and rebased (payment) index As is shown irrespective of the index the MFF of Provider B is always 753 greater than that of Provider A This relationship is true for all providers the relativities between providers is the same regardless of how the underlying MFF is scaled
Table 4 Relative differences between providers A amp B
X Y Z = ( Y X )-1
Provider Provider MFF Indices A B Difference Underlying (col C) 10249 11021 753 Rebased to 1 (col D) 11064 11898 753
PbR and the Market Forces Factor (MFF) in 2013-14 Page 27 of 28
Gateway Ref 18768
Annex F ndash Creating an index
1 An index is a ranking of numbers relative to the same base such that they can be directly compared
2 In the example below an index value can be attached to each of the numbers in column A An index is constructed by dividing each number by the base value of the index In common with the MFF the first index created is in column B which has an average value of 10 like the underlying MFF index This index is constructed by dividing each number by the average of the index 100
Values Index with an average of 1
Index with a minimum of 1
A B C 50 050 100 95 095 190 125 125 250 130 130 260 100 100 200
Average value 100 Minimum value 50
3 The index in column B represents a ranking relative to the average value in the list The average of the values in column a is 100 The value 50 in column A is half of the average so as a relative value 50 can be expressed as 05
4 Column C represents the transformation of the index to have a minimum value of 1 akin to the payment index 50 is the lowest of all the values in column A and so in the index in column C it has a value of 10
5 As stated in the guidance irrespective of the version of the MFF index the relative unavoidable cost differences between organisations are maintained In the example above it can be seen that the relative difference between the values 50 and 100 of column A is the same in both columns B and C ie 05 is half of 10 and 10 is half of 20 This also holds for every other combination of values For example 50 is 04 times small than 125 In columns B and C the relative difference in the associated index values is also 04 (050 125 = 04) and (10 25 = 04)
PbR and the Market Forces Factor (MFF) in 2013-14 Page 28 of 28
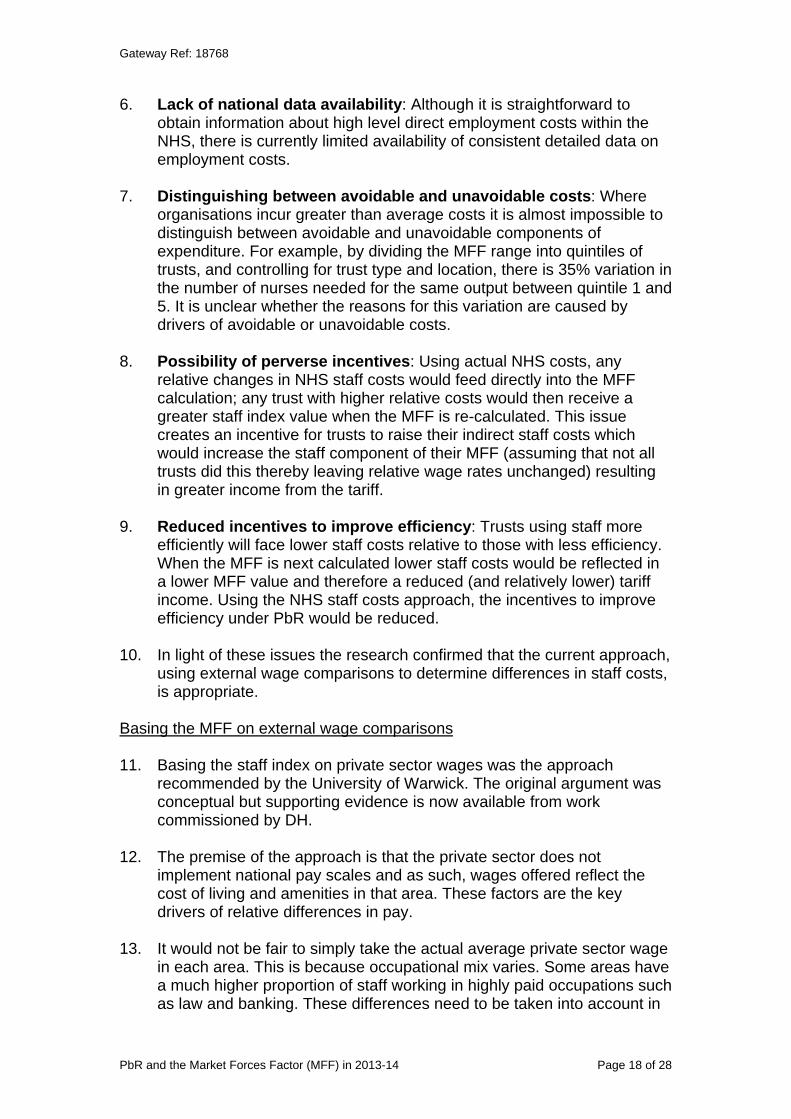
Gateway Ref 18768
the MFF in order to ensure that we are making like for like comparisons across the country Warwick do this using a statistical technique known as regression analysis It essentially works out what wages would be in an area if each area had the same mix of occupations We similarly take account of differences in the age and gender mix of the private sector workforce in different areas
14 The staff index compensates trusts for the unavoidable variation in direct staff costs and indirect employment costs arising where NHS wages do not reflect the local market rate
15 To test for evidence of indirect employment costs the Health Economics Research Unit (HERU) commissioned by DH determined the relationship between vacancy rates and the gap between NHS and private sector wages for different staff groups For nurses the evidence illustrates that vacancy rates are higher where the gap between NHS wages and private sector wages are greater
16 The Department of Health and the Department of Communities and Local Government have undertaken a number of reviews of the approach to compensating for unavoidable differences in staff costs Both Departments concluded that this approach to the MFF continues to be the best available methodology
Smoothing and Interpolation
17 Smoothing and interpolation are two approaches used to refine the staff MFF index values so that the values for each organisation better reflect the local labour markets from which they recruit
Smoothing
18 The methodology of the staff index creates the cliff edge problem whereby neighbouring PCTs receive markedly different staff cost values because of their geographical boundaries Cliff edges may lead to an inaccurate representation of staff costs faced by a provider This problem is particularly evident for providers within different PCTs but in close proximity and facing similar local labour market pressures Smoothing techniques soften cliff edges to produce a more continuous profile of staff costs across PCTs
19 HERU recommended that smoothing take into account the relative staff index of every PCT rather than just neighbouring ones as previously This approach recognises that NHS organisations draw their labour force from a variety of PCT areas Smoothing adjusts the relative level of staff index in a PCT by accounting for relative staff index in surrounding PCTs The weights of the relative costs in surrounding areas fall the further the distance from the base PCT Smoothing brings each PCTrsquos MFF more in line with those of its surrounding PCTs
PbR and the Market Forces Factor (MFF) in 2013-14 Page 19 of 28
Gateway Ref 18768
Interpolation
20 The smoothed relative costs for PCTs described above still result in cliff edges between trusts Two trusts operating near the border of neighbouring PCTs might have different relative staff costs but operate in the same labour market As a result HERU introduced a further refinement to smoothing interpolation
21 Interpolation takes account of the location within a PCT area of the trustsrsquo sites and thus the distance from other PCT areas It involves a second stage of smoothing carried out at trust level after smoothing at PCT level and further reduces the impact of cliff edges It works the same way as smoothing in that the staff index of a trust is the distance weighted average of the surrounding PCTsrsquo staff indices
22 Interpolation is carried out at trust site level Where a trust has more than one site the different indices for each site are weighted together in proportion to activity using bed numbers as a proxy on each site
Medical and Dental (MampD) London Weighting
23 The scope of the staff component of the MFF has been progressively expanded and since 2003-4 has included the whole workforce The research by HERU found no supporting evidence for the application of the staff MFF to doctors As such the coverage of the staff index was reduced in 2009-10 and a new element the Medical and Dental London Weighting is incorporated The MampD weighting reflects the greater cost of these employees in London relative to the rest of the country
24 HERU determined that pay setting mechanisms between medical and non-medical staff differ negating the need to apply the staff index to medical staff Although there is no national variation in medical staff costs there is a significant difference in the costs of doctors in London relative to the rest of the country As such a weighting for medical and dental staff is applied to trusts in London
PbR and the Market Forces Factor (MFF) in 2013-14 Page 20 of 28
Gateway Ref 18768
Annex C ndash Worked example calculation of MFF
1 This worked example shows the calculation of the MFF for Provider A
Staff Index
2 The staff index for a hospital trust is calculated based the staff index values for individual trusts There are two sites to Provider A These are in the locality of PCT Y and PCT Z
Sites PCT area Staff Index Activity 1 Y 10385 89 2 Z 10101 11
3 Staff MFF for Provider A is thus
(08910385) + (01100101) = 10354
Medical and dental (MampD) London weighting
4 This index is calculated as the ratio of the average hospital paybill of these staff groups in 2008-09 including London weighting to the average paybill excluding the London weighting
5 Provider A has no sites located within London and therefore receives a weighting of 100
Buildings Index
6 The Buildings Index is calculated in the same way as the Staff Index
Sites PCT area Building Index Activity 1 Y 09497 89 2 Z 09693 11
7 The calculation is thus
(08909497) + (01109693) = 09519
Land Index
8 The index value of the Provider A estate is 15374
Overall Index
9 The 4 components are combined using the breakdown of national expenditure between staff buildings land and other costs The latter is assumed not to vary across the country
PbR and the Market Forces Factor (MFF) in 2013-14 Page 21 of 28
Gateway Ref 18768
Index HCHS Expenditure Index Value Weighted Index (a) (b) (c) = (a)(b)
Staff 549 10354 05684 MampD 139 10000 01390 Buildings 27 09519 00257 Land 04 15374 00061 Other 281 10000 02810
index value is the same for all trusts
10 This gives an overall target MFF value of 05684 + 01390 + 00257 + 00061 + 02810 = 10203
11 This above value is the underlying index value for Provider A This index is centred around 1 To ensure that all trusts receive non-negative payment of the MFF the underlying index is converted to a payment index with a minimum value of 1
12 To set the minimum of the payment index to 1 the underlying index with an average of 1 is divided through by the minimum value In 2013-14 the minimum value is 09263 The final MFF value for Provider A to be used for payment is thus
102209263 = 11033
PbR and the Market Forces Factor (MFF) in 2013-14 Page 22 of 28
Gateway Ref 18768
Annex D ndash Reference Cost Index (RCI)
1 The RCI is an index of the relative cost efficiency of NHS organisations The RCI is adjusted by the MFF to ensure a fair comparison between organisations across England
2 For the RCI to be comparable year-on-year the index must have an average of 100 To ensure this the application of the MFF to reference costs must be cost neutral ie the total national value of Reference Costs submitted must be the same whether it includes or excludes the MFF To obtain cost neutrality the underlying MFF is scaled The extent of this scaling depends on the percentage difference between the quantum of Reference Costs prior to the application of MFF and after it
3 The following example shows how the MFF is used to calculate the MFF-adjusted RCI Table 1 shows how the underlying MFF is scaled so that the total quantum of Reference Costs is kept constant at pound4500 This is necessary to ensure the national average RCI is 100 The factor used to scale the underlying MFF is the percentage difference between Reference Costs prior to the application of the MFF and after its application (sum of column C divided by sum of column B)
PbR and the Market Forces Factor (MFF) in 2013-14 Page 23 of 28
Gateway Ref 18768
Table 1 Scaled MFF for RCI
A B C = B A D = A sum (C) sum (B) E = B D
Underlying MFF
Total Reference Costs Quantum (pound)
Total RC Quantum adjusted for underlying MFF (pound) Scaled MFF
Total RC Quantum adjusted for scaled MFF (pound)
Provider A 10249 1250 1220 09622 1299 Provider B 11021 1000 907 10346 967 Provider C 13349 1000 749 12532 798 Provider D 09270 1250 1348 08703 1436
4500 4225 4500
4 Table 2 shows that without the scaling of the MFF the average of RCI does not equal 100 (compare the averages of columns J and L) Having the average RCI at 100 allows easy comparison of providerrsquos relative efficiency year on year Irrespective of whether the average is 100 (and any scaling) a providerrsquos index value is always the same relative to the average For example Provider D is always 22 above average
From column L [(122 ndash 100) 100] 100 = 22 From column J [(115 ndash 94) 94] 100 = 22
PbR and the Market Forces Factor (MFF) in 2013-14 Page 24 of 28
Gateway Ref 18768
Table 2 Average RCI kept at 100
F G
H = (F G)100 I = A J = H I K = D L = H K
Actual Total Cost (pound)
Expected Total Cost (pound)
Base RCI
Underlyi ng MFF
MFF adjusted RCI (based on underlying MFF)
Scaled MFF
MFF adjusted RCI (based on scaled MFF)
Provider A
1250
1300 96 10249 94 09622 100 Provider B
1000
925 108 11021 98 10346 104 Provider C
1000
1100 91 13349 68 12532 73 Provider D
1250
1175 106 09270 115 08703 122 Average 100 94 100
(RCI figures to the nearest integer)
PbR and the Market Forces Factor (MFF) in 2013-14 Page 25 of 28
Gateway Ref 18768
Annex E ndash Tariff Calculation
1 Table 3 gives an example calculation of the tariff for an HRG The underlying MFF is rebased so that the minimum value is 1 (column D) by dividing the index through by the 2013-14 minimum value of 09263 Total costs are then divided by these MFF values (column E) The income for a provider is then the product of tariff price activity and rebased MFF (column F)
Table 3 Rebasing MFF for Tariff Calculation
A B C D = C min C
E = B D F = Tariff A D
Activity Total Costs (pound)
Underlying MFF
Rebased MFF to 1
Total Costs adjusted for rebased MFF (pound)
PbR Income (pound)
Provider A Provider
60 1250 10249 11064 1130 1528
B Provider
50 1000 11021 11898 840 1369
C Provider
20 1000 13349 14411 694 663
D 40 1250 09263 1 1250 921 Total 170 4500 3913 4483
Tariff = Total costs adjusted for MFF National activity = sum of column E sum of column A
= pound3913 170 = pound2302
PbR and the Market Forces Factor (MFF) in 2013-14 Page 26 of 28
Gateway Ref 18768
2 Table 4 shows the relative difference between providers A and B for the underlying and rebased (payment) index As is shown irrespective of the index the MFF of Provider B is always 753 greater than that of Provider A This relationship is true for all providers the relativities between providers is the same regardless of how the underlying MFF is scaled
Table 4 Relative differences between providers A amp B
X Y Z = ( Y X )-1
Provider Provider MFF Indices A B Difference Underlying (col C) 10249 11021 753 Rebased to 1 (col D) 11064 11898 753
PbR and the Market Forces Factor (MFF) in 2013-14 Page 27 of 28
Gateway Ref 18768
Annex F ndash Creating an index
1 An index is a ranking of numbers relative to the same base such that they can be directly compared
2 In the example below an index value can be attached to each of the numbers in column A An index is constructed by dividing each number by the base value of the index In common with the MFF the first index created is in column B which has an average value of 10 like the underlying MFF index This index is constructed by dividing each number by the average of the index 100
Values Index with an average of 1
Index with a minimum of 1
A B C 50 050 100 95 095 190 125 125 250 130 130 260 100 100 200
Average value 100 Minimum value 50
3 The index in column B represents a ranking relative to the average value in the list The average of the values in column a is 100 The value 50 in column A is half of the average so as a relative value 50 can be expressed as 05
4 Column C represents the transformation of the index to have a minimum value of 1 akin to the payment index 50 is the lowest of all the values in column A and so in the index in column C it has a value of 10
5 As stated in the guidance irrespective of the version of the MFF index the relative unavoidable cost differences between organisations are maintained In the example above it can be seen that the relative difference between the values 50 and 100 of column A is the same in both columns B and C ie 05 is half of 10 and 10 is half of 20 This also holds for every other combination of values For example 50 is 04 times small than 125 In columns B and C the relative difference in the associated index values is also 04 (050 125 = 04) and (10 25 = 04)
PbR and the Market Forces Factor (MFF) in 2013-14 Page 28 of 28
Gateway Ref 18768
Interpolation
20 The smoothed relative costs for PCTs described above still result in cliff edges between trusts Two trusts operating near the border of neighbouring PCTs might have different relative staff costs but operate in the same labour market As a result HERU introduced a further refinement to smoothing interpolation
21 Interpolation takes account of the location within a PCT area of the trustsrsquo sites and thus the distance from other PCT areas It involves a second stage of smoothing carried out at trust level after smoothing at PCT level and further reduces the impact of cliff edges It works the same way as smoothing in that the staff index of a trust is the distance weighted average of the surrounding PCTsrsquo staff indices
22 Interpolation is carried out at trust site level Where a trust has more than one site the different indices for each site are weighted together in proportion to activity using bed numbers as a proxy on each site
Medical and Dental (MampD) London Weighting
23 The scope of the staff component of the MFF has been progressively expanded and since 2003-4 has included the whole workforce The research by HERU found no supporting evidence for the application of the staff MFF to doctors As such the coverage of the staff index was reduced in 2009-10 and a new element the Medical and Dental London Weighting is incorporated The MampD weighting reflects the greater cost of these employees in London relative to the rest of the country
24 HERU determined that pay setting mechanisms between medical and non-medical staff differ negating the need to apply the staff index to medical staff Although there is no national variation in medical staff costs there is a significant difference in the costs of doctors in London relative to the rest of the country As such a weighting for medical and dental staff is applied to trusts in London
PbR and the Market Forces Factor (MFF) in 2013-14 Page 20 of 28
Gateway Ref 18768
Annex C ndash Worked example calculation of MFF
1 This worked example shows the calculation of the MFF for Provider A
Staff Index
2 The staff index for a hospital trust is calculated based the staff index values for individual trusts There are two sites to Provider A These are in the locality of PCT Y and PCT Z
Sites PCT area Staff Index Activity 1 Y 10385 89 2 Z 10101 11
3 Staff MFF for Provider A is thus
(08910385) + (01100101) = 10354
Medical and dental (MampD) London weighting
4 This index is calculated as the ratio of the average hospital paybill of these staff groups in 2008-09 including London weighting to the average paybill excluding the London weighting
5 Provider A has no sites located within London and therefore receives a weighting of 100
Buildings Index
6 The Buildings Index is calculated in the same way as the Staff Index
Sites PCT area Building Index Activity 1 Y 09497 89 2 Z 09693 11
7 The calculation is thus
(08909497) + (01109693) = 09519
Land Index
8 The index value of the Provider A estate is 15374
Overall Index
9 The 4 components are combined using the breakdown of national expenditure between staff buildings land and other costs The latter is assumed not to vary across the country
PbR and the Market Forces Factor (MFF) in 2013-14 Page 21 of 28
Gateway Ref 18768
Index HCHS Expenditure Index Value Weighted Index (a) (b) (c) = (a)(b)
Staff 549 10354 05684 MampD 139 10000 01390 Buildings 27 09519 00257 Land 04 15374 00061 Other 281 10000 02810
index value is the same for all trusts
10 This gives an overall target MFF value of 05684 + 01390 + 00257 + 00061 + 02810 = 10203
11 This above value is the underlying index value for Provider A This index is centred around 1 To ensure that all trusts receive non-negative payment of the MFF the underlying index is converted to a payment index with a minimum value of 1
12 To set the minimum of the payment index to 1 the underlying index with an average of 1 is divided through by the minimum value In 2013-14 the minimum value is 09263 The final MFF value for Provider A to be used for payment is thus
102209263 = 11033
PbR and the Market Forces Factor (MFF) in 2013-14 Page 22 of 28
Gateway Ref 18768
Annex D ndash Reference Cost Index (RCI)
1 The RCI is an index of the relative cost efficiency of NHS organisations The RCI is adjusted by the MFF to ensure a fair comparison between organisations across England
2 For the RCI to be comparable year-on-year the index must have an average of 100 To ensure this the application of the MFF to reference costs must be cost neutral ie the total national value of Reference Costs submitted must be the same whether it includes or excludes the MFF To obtain cost neutrality the underlying MFF is scaled The extent of this scaling depends on the percentage difference between the quantum of Reference Costs prior to the application of MFF and after it
3 The following example shows how the MFF is used to calculate the MFF-adjusted RCI Table 1 shows how the underlying MFF is scaled so that the total quantum of Reference Costs is kept constant at pound4500 This is necessary to ensure the national average RCI is 100 The factor used to scale the underlying MFF is the percentage difference between Reference Costs prior to the application of the MFF and after its application (sum of column C divided by sum of column B)
PbR and the Market Forces Factor (MFF) in 2013-14 Page 23 of 28
Gateway Ref 18768
Table 1 Scaled MFF for RCI
A B C = B A D = A sum (C) sum (B) E = B D
Underlying MFF
Total Reference Costs Quantum (pound)
Total RC Quantum adjusted for underlying MFF (pound) Scaled MFF
Total RC Quantum adjusted for scaled MFF (pound)
Provider A 10249 1250 1220 09622 1299 Provider B 11021 1000 907 10346 967 Provider C 13349 1000 749 12532 798 Provider D 09270 1250 1348 08703 1436
4500 4225 4500
4 Table 2 shows that without the scaling of the MFF the average of RCI does not equal 100 (compare the averages of columns J and L) Having the average RCI at 100 allows easy comparison of providerrsquos relative efficiency year on year Irrespective of whether the average is 100 (and any scaling) a providerrsquos index value is always the same relative to the average For example Provider D is always 22 above average
From column L [(122 ndash 100) 100] 100 = 22 From column J [(115 ndash 94) 94] 100 = 22
PbR and the Market Forces Factor (MFF) in 2013-14 Page 24 of 28
Gateway Ref 18768
Table 2 Average RCI kept at 100
F G
H = (F G)100 I = A J = H I K = D L = H K
Actual Total Cost (pound)
Expected Total Cost (pound)
Base RCI
Underlyi ng MFF
MFF adjusted RCI (based on underlying MFF)
Scaled MFF
MFF adjusted RCI (based on scaled MFF)
Provider A
1250
1300 96 10249 94 09622 100 Provider B
1000
925 108 11021 98 10346 104 Provider C
1000
1100 91 13349 68 12532 73 Provider D
1250
1175 106 09270 115 08703 122 Average 100 94 100
(RCI figures to the nearest integer)
PbR and the Market Forces Factor (MFF) in 2013-14 Page 25 of 28
Gateway Ref 18768
Annex E ndash Tariff Calculation
1 Table 3 gives an example calculation of the tariff for an HRG The underlying MFF is rebased so that the minimum value is 1 (column D) by dividing the index through by the 2013-14 minimum value of 09263 Total costs are then divided by these MFF values (column E) The income for a provider is then the product of tariff price activity and rebased MFF (column F)
Table 3 Rebasing MFF for Tariff Calculation
A B C D = C min C
E = B D F = Tariff A D
Activity Total Costs (pound)
Underlying MFF
Rebased MFF to 1
Total Costs adjusted for rebased MFF (pound)
PbR Income (pound)
Provider A Provider
60 1250 10249 11064 1130 1528
B Provider
50 1000 11021 11898 840 1369
C Provider
20 1000 13349 14411 694 663
D 40 1250 09263 1 1250 921 Total 170 4500 3913 4483
Tariff = Total costs adjusted for MFF National activity = sum of column E sum of column A
= pound3913 170 = pound2302
PbR and the Market Forces Factor (MFF) in 2013-14 Page 26 of 28
Gateway Ref 18768
2 Table 4 shows the relative difference between providers A and B for the underlying and rebased (payment) index As is shown irrespective of the index the MFF of Provider B is always 753 greater than that of Provider A This relationship is true for all providers the relativities between providers is the same regardless of how the underlying MFF is scaled
Table 4 Relative differences between providers A amp B
X Y Z = ( Y X )-1
Provider Provider MFF Indices A B Difference Underlying (col C) 10249 11021 753 Rebased to 1 (col D) 11064 11898 753
PbR and the Market Forces Factor (MFF) in 2013-14 Page 27 of 28
Gateway Ref 18768
Annex F ndash Creating an index
1 An index is a ranking of numbers relative to the same base such that they can be directly compared
2 In the example below an index value can be attached to each of the numbers in column A An index is constructed by dividing each number by the base value of the index In common with the MFF the first index created is in column B which has an average value of 10 like the underlying MFF index This index is constructed by dividing each number by the average of the index 100
Values Index with an average of 1
Index with a minimum of 1
A B C 50 050 100 95 095 190 125 125 250 130 130 260 100 100 200
Average value 100 Minimum value 50
3 The index in column B represents a ranking relative to the average value in the list The average of the values in column a is 100 The value 50 in column A is half of the average so as a relative value 50 can be expressed as 05
4 Column C represents the transformation of the index to have a minimum value of 1 akin to the payment index 50 is the lowest of all the values in column A and so in the index in column C it has a value of 10
5 As stated in the guidance irrespective of the version of the MFF index the relative unavoidable cost differences between organisations are maintained In the example above it can be seen that the relative difference between the values 50 and 100 of column A is the same in both columns B and C ie 05 is half of 10 and 10 is half of 20 This also holds for every other combination of values For example 50 is 04 times small than 125 In columns B and C the relative difference in the associated index values is also 04 (050 125 = 04) and (10 25 = 04)
PbR and the Market Forces Factor (MFF) in 2013-14 Page 28 of 28
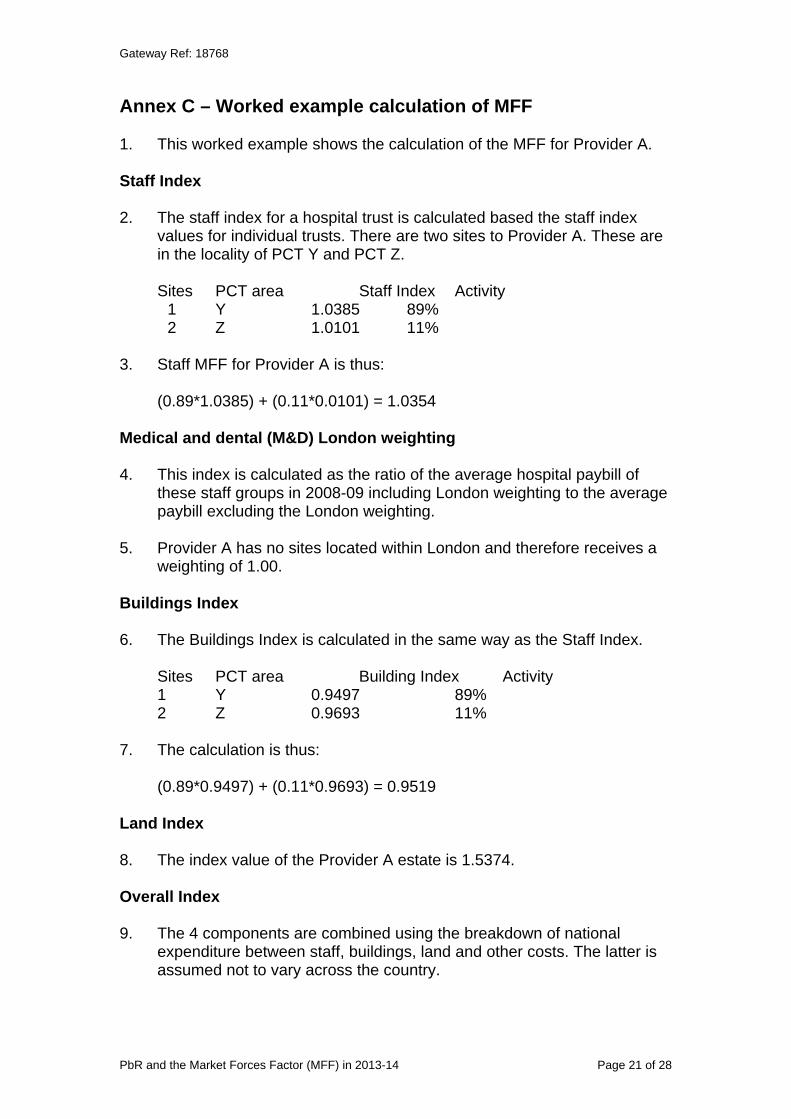
Gateway Ref 18768
Annex C ndash Worked example calculation of MFF
1 This worked example shows the calculation of the MFF for Provider A
Staff Index
2 The staff index for a hospital trust is calculated based the staff index values for individual trusts There are two sites to Provider A These are in the locality of PCT Y and PCT Z
Sites PCT area Staff Index Activity 1 Y 10385 89 2 Z 10101 11
3 Staff MFF for Provider A is thus
(08910385) + (01100101) = 10354
Medical and dental (MampD) London weighting
4 This index is calculated as the ratio of the average hospital paybill of these staff groups in 2008-09 including London weighting to the average paybill excluding the London weighting
5 Provider A has no sites located within London and therefore receives a weighting of 100
Buildings Index
6 The Buildings Index is calculated in the same way as the Staff Index
Sites PCT area Building Index Activity 1 Y 09497 89 2 Z 09693 11
7 The calculation is thus
(08909497) + (01109693) = 09519
Land Index
8 The index value of the Provider A estate is 15374
Overall Index
9 The 4 components are combined using the breakdown of national expenditure between staff buildings land and other costs The latter is assumed not to vary across the country
PbR and the Market Forces Factor (MFF) in 2013-14 Page 21 of 28
Gateway Ref 18768
Index HCHS Expenditure Index Value Weighted Index (a) (b) (c) = (a)(b)
Staff 549 10354 05684 MampD 139 10000 01390 Buildings 27 09519 00257 Land 04 15374 00061 Other 281 10000 02810
index value is the same for all trusts
10 This gives an overall target MFF value of 05684 + 01390 + 00257 + 00061 + 02810 = 10203
11 This above value is the underlying index value for Provider A This index is centred around 1 To ensure that all trusts receive non-negative payment of the MFF the underlying index is converted to a payment index with a minimum value of 1
12 To set the minimum of the payment index to 1 the underlying index with an average of 1 is divided through by the minimum value In 2013-14 the minimum value is 09263 The final MFF value for Provider A to be used for payment is thus
102209263 = 11033
PbR and the Market Forces Factor (MFF) in 2013-14 Page 22 of 28
Gateway Ref 18768
Annex D ndash Reference Cost Index (RCI)
1 The RCI is an index of the relative cost efficiency of NHS organisations The RCI is adjusted by the MFF to ensure a fair comparison between organisations across England
2 For the RCI to be comparable year-on-year the index must have an average of 100 To ensure this the application of the MFF to reference costs must be cost neutral ie the total national value of Reference Costs submitted must be the same whether it includes or excludes the MFF To obtain cost neutrality the underlying MFF is scaled The extent of this scaling depends on the percentage difference between the quantum of Reference Costs prior to the application of MFF and after it
3 The following example shows how the MFF is used to calculate the MFF-adjusted RCI Table 1 shows how the underlying MFF is scaled so that the total quantum of Reference Costs is kept constant at pound4500 This is necessary to ensure the national average RCI is 100 The factor used to scale the underlying MFF is the percentage difference between Reference Costs prior to the application of the MFF and after its application (sum of column C divided by sum of column B)
PbR and the Market Forces Factor (MFF) in 2013-14 Page 23 of 28
Gateway Ref 18768
Table 1 Scaled MFF for RCI
A B C = B A D = A sum (C) sum (B) E = B D
Underlying MFF
Total Reference Costs Quantum (pound)
Total RC Quantum adjusted for underlying MFF (pound) Scaled MFF
Total RC Quantum adjusted for scaled MFF (pound)
Provider A 10249 1250 1220 09622 1299 Provider B 11021 1000 907 10346 967 Provider C 13349 1000 749 12532 798 Provider D 09270 1250 1348 08703 1436
4500 4225 4500
4 Table 2 shows that without the scaling of the MFF the average of RCI does not equal 100 (compare the averages of columns J and L) Having the average RCI at 100 allows easy comparison of providerrsquos relative efficiency year on year Irrespective of whether the average is 100 (and any scaling) a providerrsquos index value is always the same relative to the average For example Provider D is always 22 above average
From column L [(122 ndash 100) 100] 100 = 22 From column J [(115 ndash 94) 94] 100 = 22
PbR and the Market Forces Factor (MFF) in 2013-14 Page 24 of 28
Gateway Ref 18768
Table 2 Average RCI kept at 100
F G
H = (F G)100 I = A J = H I K = D L = H K
Actual Total Cost (pound)
Expected Total Cost (pound)
Base RCI
Underlyi ng MFF
MFF adjusted RCI (based on underlying MFF)
Scaled MFF
MFF adjusted RCI (based on scaled MFF)
Provider A
1250
1300 96 10249 94 09622 100 Provider B
1000
925 108 11021 98 10346 104 Provider C
1000
1100 91 13349 68 12532 73 Provider D
1250
1175 106 09270 115 08703 122 Average 100 94 100
(RCI figures to the nearest integer)
PbR and the Market Forces Factor (MFF) in 2013-14 Page 25 of 28
Gateway Ref 18768
Annex E ndash Tariff Calculation
1 Table 3 gives an example calculation of the tariff for an HRG The underlying MFF is rebased so that the minimum value is 1 (column D) by dividing the index through by the 2013-14 minimum value of 09263 Total costs are then divided by these MFF values (column E) The income for a provider is then the product of tariff price activity and rebased MFF (column F)
Table 3 Rebasing MFF for Tariff Calculation
A B C D = C min C
E = B D F = Tariff A D
Activity Total Costs (pound)
Underlying MFF
Rebased MFF to 1
Total Costs adjusted for rebased MFF (pound)
PbR Income (pound)
Provider A Provider
60 1250 10249 11064 1130 1528
B Provider
50 1000 11021 11898 840 1369
C Provider
20 1000 13349 14411 694 663
D 40 1250 09263 1 1250 921 Total 170 4500 3913 4483
Tariff = Total costs adjusted for MFF National activity = sum of column E sum of column A
= pound3913 170 = pound2302
PbR and the Market Forces Factor (MFF) in 2013-14 Page 26 of 28
Gateway Ref 18768
2 Table 4 shows the relative difference between providers A and B for the underlying and rebased (payment) index As is shown irrespective of the index the MFF of Provider B is always 753 greater than that of Provider A This relationship is true for all providers the relativities between providers is the same regardless of how the underlying MFF is scaled
Table 4 Relative differences between providers A amp B
X Y Z = ( Y X )-1
Provider Provider MFF Indices A B Difference Underlying (col C) 10249 11021 753 Rebased to 1 (col D) 11064 11898 753
PbR and the Market Forces Factor (MFF) in 2013-14 Page 27 of 28
Gateway Ref 18768
Annex F ndash Creating an index
1 An index is a ranking of numbers relative to the same base such that they can be directly compared
2 In the example below an index value can be attached to each of the numbers in column A An index is constructed by dividing each number by the base value of the index In common with the MFF the first index created is in column B which has an average value of 10 like the underlying MFF index This index is constructed by dividing each number by the average of the index 100
Values Index with an average of 1
Index with a minimum of 1
A B C 50 050 100 95 095 190 125 125 250 130 130 260 100 100 200
Average value 100 Minimum value 50
3 The index in column B represents a ranking relative to the average value in the list The average of the values in column a is 100 The value 50 in column A is half of the average so as a relative value 50 can be expressed as 05
4 Column C represents the transformation of the index to have a minimum value of 1 akin to the payment index 50 is the lowest of all the values in column A and so in the index in column C it has a value of 10
5 As stated in the guidance irrespective of the version of the MFF index the relative unavoidable cost differences between organisations are maintained In the example above it can be seen that the relative difference between the values 50 and 100 of column A is the same in both columns B and C ie 05 is half of 10 and 10 is half of 20 This also holds for every other combination of values For example 50 is 04 times small than 125 In columns B and C the relative difference in the associated index values is also 04 (050 125 = 04) and (10 25 = 04)
PbR and the Market Forces Factor (MFF) in 2013-14 Page 28 of 28
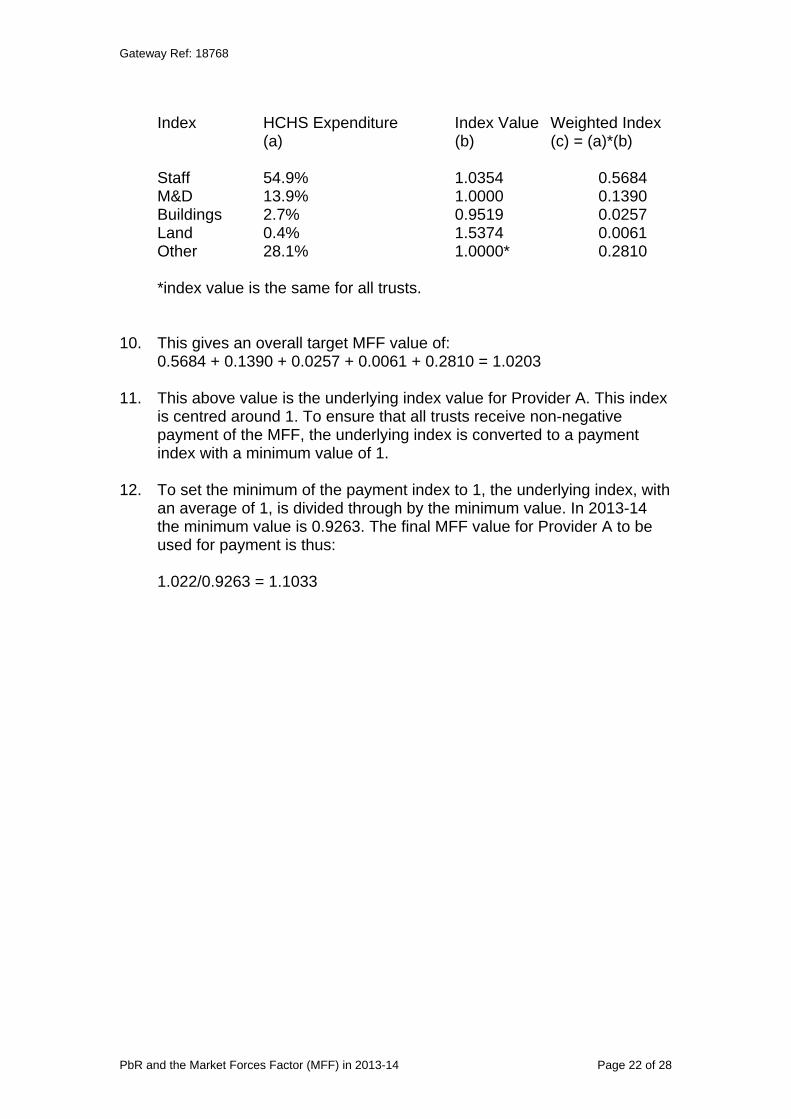
Gateway Ref 18768
Index HCHS Expenditure Index Value Weighted Index (a) (b) (c) = (a)(b)
Staff 549 10354 05684 MampD 139 10000 01390 Buildings 27 09519 00257 Land 04 15374 00061 Other 281 10000 02810
index value is the same for all trusts
10 This gives an overall target MFF value of 05684 + 01390 + 00257 + 00061 + 02810 = 10203
11 This above value is the underlying index value for Provider A This index is centred around 1 To ensure that all trusts receive non-negative payment of the MFF the underlying index is converted to a payment index with a minimum value of 1
12 To set the minimum of the payment index to 1 the underlying index with an average of 1 is divided through by the minimum value In 2013-14 the minimum value is 09263 The final MFF value for Provider A to be used for payment is thus
102209263 = 11033
PbR and the Market Forces Factor (MFF) in 2013-14 Page 22 of 28
Gateway Ref 18768
Annex D ndash Reference Cost Index (RCI)
1 The RCI is an index of the relative cost efficiency of NHS organisations The RCI is adjusted by the MFF to ensure a fair comparison between organisations across England
2 For the RCI to be comparable year-on-year the index must have an average of 100 To ensure this the application of the MFF to reference costs must be cost neutral ie the total national value of Reference Costs submitted must be the same whether it includes or excludes the MFF To obtain cost neutrality the underlying MFF is scaled The extent of this scaling depends on the percentage difference between the quantum of Reference Costs prior to the application of MFF and after it
3 The following example shows how the MFF is used to calculate the MFF-adjusted RCI Table 1 shows how the underlying MFF is scaled so that the total quantum of Reference Costs is kept constant at pound4500 This is necessary to ensure the national average RCI is 100 The factor used to scale the underlying MFF is the percentage difference between Reference Costs prior to the application of the MFF and after its application (sum of column C divided by sum of column B)
PbR and the Market Forces Factor (MFF) in 2013-14 Page 23 of 28
Gateway Ref 18768
Table 1 Scaled MFF for RCI
A B C = B A D = A sum (C) sum (B) E = B D
Underlying MFF
Total Reference Costs Quantum (pound)
Total RC Quantum adjusted for underlying MFF (pound) Scaled MFF
Total RC Quantum adjusted for scaled MFF (pound)
Provider A 10249 1250 1220 09622 1299 Provider B 11021 1000 907 10346 967 Provider C 13349 1000 749 12532 798 Provider D 09270 1250 1348 08703 1436
4500 4225 4500
4 Table 2 shows that without the scaling of the MFF the average of RCI does not equal 100 (compare the averages of columns J and L) Having the average RCI at 100 allows easy comparison of providerrsquos relative efficiency year on year Irrespective of whether the average is 100 (and any scaling) a providerrsquos index value is always the same relative to the average For example Provider D is always 22 above average
From column L [(122 ndash 100) 100] 100 = 22 From column J [(115 ndash 94) 94] 100 = 22
PbR and the Market Forces Factor (MFF) in 2013-14 Page 24 of 28
Gateway Ref 18768
Table 2 Average RCI kept at 100
F G
H = (F G)100 I = A J = H I K = D L = H K
Actual Total Cost (pound)
Expected Total Cost (pound)
Base RCI
Underlyi ng MFF
MFF adjusted RCI (based on underlying MFF)
Scaled MFF
MFF adjusted RCI (based on scaled MFF)
Provider A
1250
1300 96 10249 94 09622 100 Provider B
1000
925 108 11021 98 10346 104 Provider C
1000
1100 91 13349 68 12532 73 Provider D
1250
1175 106 09270 115 08703 122 Average 100 94 100
(RCI figures to the nearest integer)
PbR and the Market Forces Factor (MFF) in 2013-14 Page 25 of 28
Gateway Ref 18768
Annex E ndash Tariff Calculation
1 Table 3 gives an example calculation of the tariff for an HRG The underlying MFF is rebased so that the minimum value is 1 (column D) by dividing the index through by the 2013-14 minimum value of 09263 Total costs are then divided by these MFF values (column E) The income for a provider is then the product of tariff price activity and rebased MFF (column F)
Table 3 Rebasing MFF for Tariff Calculation
A B C D = C min C
E = B D F = Tariff A D
Activity Total Costs (pound)
Underlying MFF
Rebased MFF to 1
Total Costs adjusted for rebased MFF (pound)
PbR Income (pound)
Provider A Provider
60 1250 10249 11064 1130 1528
B Provider
50 1000 11021 11898 840 1369
C Provider
20 1000 13349 14411 694 663
D 40 1250 09263 1 1250 921 Total 170 4500 3913 4483
Tariff = Total costs adjusted for MFF National activity = sum of column E sum of column A
= pound3913 170 = pound2302
PbR and the Market Forces Factor (MFF) in 2013-14 Page 26 of 28
Gateway Ref 18768
2 Table 4 shows the relative difference between providers A and B for the underlying and rebased (payment) index As is shown irrespective of the index the MFF of Provider B is always 753 greater than that of Provider A This relationship is true for all providers the relativities between providers is the same regardless of how the underlying MFF is scaled
Table 4 Relative differences between providers A amp B
X Y Z = ( Y X )-1
Provider Provider MFF Indices A B Difference Underlying (col C) 10249 11021 753 Rebased to 1 (col D) 11064 11898 753
PbR and the Market Forces Factor (MFF) in 2013-14 Page 27 of 28
Gateway Ref 18768
Annex F ndash Creating an index
1 An index is a ranking of numbers relative to the same base such that they can be directly compared
2 In the example below an index value can be attached to each of the numbers in column A An index is constructed by dividing each number by the base value of the index In common with the MFF the first index created is in column B which has an average value of 10 like the underlying MFF index This index is constructed by dividing each number by the average of the index 100
Values Index with an average of 1
Index with a minimum of 1
A B C 50 050 100 95 095 190 125 125 250 130 130 260 100 100 200
Average value 100 Minimum value 50
3 The index in column B represents a ranking relative to the average value in the list The average of the values in column a is 100 The value 50 in column A is half of the average so as a relative value 50 can be expressed as 05
4 Column C represents the transformation of the index to have a minimum value of 1 akin to the payment index 50 is the lowest of all the values in column A and so in the index in column C it has a value of 10
5 As stated in the guidance irrespective of the version of the MFF index the relative unavoidable cost differences between organisations are maintained In the example above it can be seen that the relative difference between the values 50 and 100 of column A is the same in both columns B and C ie 05 is half of 10 and 10 is half of 20 This also holds for every other combination of values For example 50 is 04 times small than 125 In columns B and C the relative difference in the associated index values is also 04 (050 125 = 04) and (10 25 = 04)
PbR and the Market Forces Factor (MFF) in 2013-14 Page 28 of 28
Gateway Ref 18768
Annex D ndash Reference Cost Index (RCI)
1 The RCI is an index of the relative cost efficiency of NHS organisations The RCI is adjusted by the MFF to ensure a fair comparison between organisations across England
2 For the RCI to be comparable year-on-year the index must have an average of 100 To ensure this the application of the MFF to reference costs must be cost neutral ie the total national value of Reference Costs submitted must be the same whether it includes or excludes the MFF To obtain cost neutrality the underlying MFF is scaled The extent of this scaling depends on the percentage difference between the quantum of Reference Costs prior to the application of MFF and after it
3 The following example shows how the MFF is used to calculate the MFF-adjusted RCI Table 1 shows how the underlying MFF is scaled so that the total quantum of Reference Costs is kept constant at pound4500 This is necessary to ensure the national average RCI is 100 The factor used to scale the underlying MFF is the percentage difference between Reference Costs prior to the application of the MFF and after its application (sum of column C divided by sum of column B)
PbR and the Market Forces Factor (MFF) in 2013-14 Page 23 of 28
Gateway Ref 18768
Table 1 Scaled MFF for RCI
A B C = B A D = A sum (C) sum (B) E = B D
Underlying MFF
Total Reference Costs Quantum (pound)
Total RC Quantum adjusted for underlying MFF (pound) Scaled MFF
Total RC Quantum adjusted for scaled MFF (pound)
Provider A 10249 1250 1220 09622 1299 Provider B 11021 1000 907 10346 967 Provider C 13349 1000 749 12532 798 Provider D 09270 1250 1348 08703 1436
4500 4225 4500
4 Table 2 shows that without the scaling of the MFF the average of RCI does not equal 100 (compare the averages of columns J and L) Having the average RCI at 100 allows easy comparison of providerrsquos relative efficiency year on year Irrespective of whether the average is 100 (and any scaling) a providerrsquos index value is always the same relative to the average For example Provider D is always 22 above average
From column L [(122 ndash 100) 100] 100 = 22 From column J [(115 ndash 94) 94] 100 = 22
PbR and the Market Forces Factor (MFF) in 2013-14 Page 24 of 28
Gateway Ref 18768
Table 2 Average RCI kept at 100
F G
H = (F G)100 I = A J = H I K = D L = H K
Actual Total Cost (pound)
Expected Total Cost (pound)
Base RCI
Underlyi ng MFF
MFF adjusted RCI (based on underlying MFF)
Scaled MFF
MFF adjusted RCI (based on scaled MFF)
Provider A
1250
1300 96 10249 94 09622 100 Provider B
1000
925 108 11021 98 10346 104 Provider C
1000
1100 91 13349 68 12532 73 Provider D
1250
1175 106 09270 115 08703 122 Average 100 94 100
(RCI figures to the nearest integer)
PbR and the Market Forces Factor (MFF) in 2013-14 Page 25 of 28
Gateway Ref 18768
Annex E ndash Tariff Calculation
1 Table 3 gives an example calculation of the tariff for an HRG The underlying MFF is rebased so that the minimum value is 1 (column D) by dividing the index through by the 2013-14 minimum value of 09263 Total costs are then divided by these MFF values (column E) The income for a provider is then the product of tariff price activity and rebased MFF (column F)
Table 3 Rebasing MFF for Tariff Calculation
A B C D = C min C
E = B D F = Tariff A D
Activity Total Costs (pound)
Underlying MFF
Rebased MFF to 1
Total Costs adjusted for rebased MFF (pound)
PbR Income (pound)
Provider A Provider
60 1250 10249 11064 1130 1528
B Provider
50 1000 11021 11898 840 1369
C Provider
20 1000 13349 14411 694 663
D 40 1250 09263 1 1250 921 Total 170 4500 3913 4483
Tariff = Total costs adjusted for MFF National activity = sum of column E sum of column A
= pound3913 170 = pound2302
PbR and the Market Forces Factor (MFF) in 2013-14 Page 26 of 28
Gateway Ref 18768
2 Table 4 shows the relative difference between providers A and B for the underlying and rebased (payment) index As is shown irrespective of the index the MFF of Provider B is always 753 greater than that of Provider A This relationship is true for all providers the relativities between providers is the same regardless of how the underlying MFF is scaled
Table 4 Relative differences between providers A amp B
X Y Z = ( Y X )-1
Provider Provider MFF Indices A B Difference Underlying (col C) 10249 11021 753 Rebased to 1 (col D) 11064 11898 753
PbR and the Market Forces Factor (MFF) in 2013-14 Page 27 of 28
Gateway Ref 18768
Annex F ndash Creating an index
1 An index is a ranking of numbers relative to the same base such that they can be directly compared
2 In the example below an index value can be attached to each of the numbers in column A An index is constructed by dividing each number by the base value of the index In common with the MFF the first index created is in column B which has an average value of 10 like the underlying MFF index This index is constructed by dividing each number by the average of the index 100
Values Index with an average of 1
Index with a minimum of 1
A B C 50 050 100 95 095 190 125 125 250 130 130 260 100 100 200
Average value 100 Minimum value 50
3 The index in column B represents a ranking relative to the average value in the list The average of the values in column a is 100 The value 50 in column A is half of the average so as a relative value 50 can be expressed as 05
4 Column C represents the transformation of the index to have a minimum value of 1 akin to the payment index 50 is the lowest of all the values in column A and so in the index in column C it has a value of 10
5 As stated in the guidance irrespective of the version of the MFF index the relative unavoidable cost differences between organisations are maintained In the example above it can be seen that the relative difference between the values 50 and 100 of column A is the same in both columns B and C ie 05 is half of 10 and 10 is half of 20 This also holds for every other combination of values For example 50 is 04 times small than 125 In columns B and C the relative difference in the associated index values is also 04 (050 125 = 04) and (10 25 = 04)
PbR and the Market Forces Factor (MFF) in 2013-14 Page 28 of 28
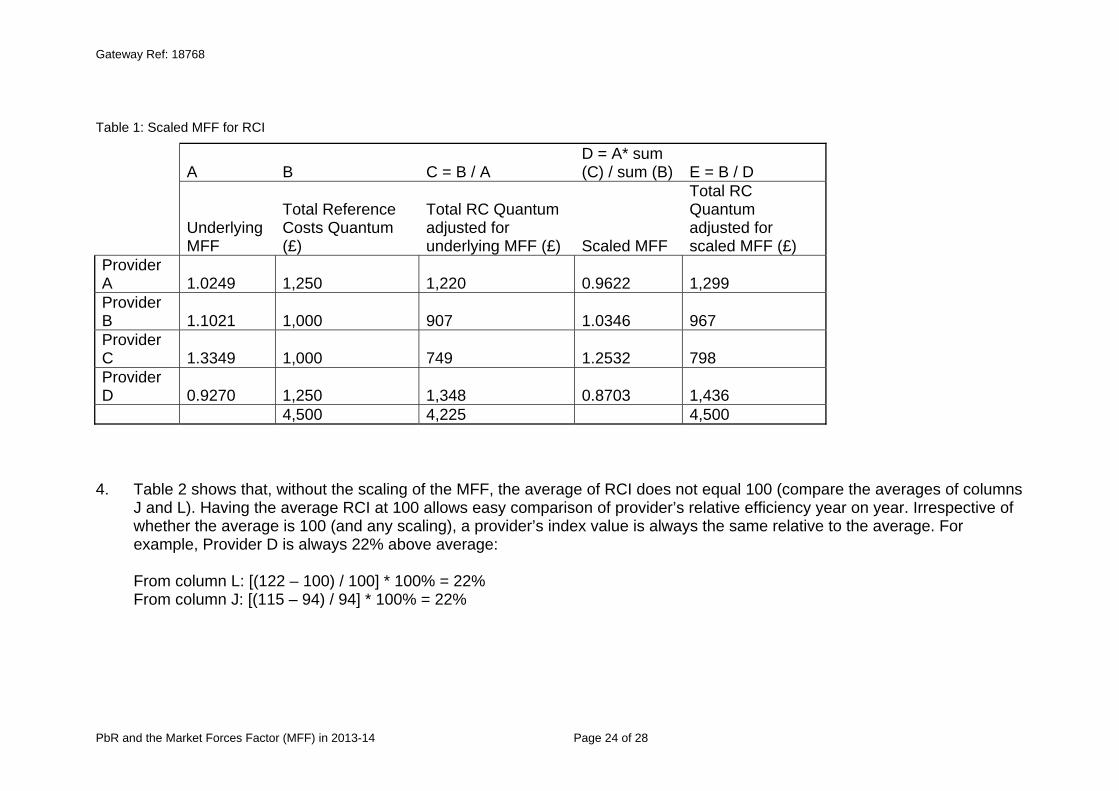
Gateway Ref 18768
Table 1 Scaled MFF for RCI
A B C = B A D = A sum (C) sum (B) E = B D
Underlying MFF
Total Reference Costs Quantum (pound)
Total RC Quantum adjusted for underlying MFF (pound) Scaled MFF
Total RC Quantum adjusted for scaled MFF (pound)
Provider A 10249 1250 1220 09622 1299 Provider B 11021 1000 907 10346 967 Provider C 13349 1000 749 12532 798 Provider D 09270 1250 1348 08703 1436
4500 4225 4500
4 Table 2 shows that without the scaling of the MFF the average of RCI does not equal 100 (compare the averages of columns J and L) Having the average RCI at 100 allows easy comparison of providerrsquos relative efficiency year on year Irrespective of whether the average is 100 (and any scaling) a providerrsquos index value is always the same relative to the average For example Provider D is always 22 above average
From column L [(122 ndash 100) 100] 100 = 22 From column J [(115 ndash 94) 94] 100 = 22
PbR and the Market Forces Factor (MFF) in 2013-14 Page 24 of 28
Gateway Ref 18768
Table 2 Average RCI kept at 100
F G
H = (F G)100 I = A J = H I K = D L = H K
Actual Total Cost (pound)
Expected Total Cost (pound)
Base RCI
Underlyi ng MFF
MFF adjusted RCI (based on underlying MFF)
Scaled MFF
MFF adjusted RCI (based on scaled MFF)
Provider A
1250
1300 96 10249 94 09622 100 Provider B
1000
925 108 11021 98 10346 104 Provider C
1000
1100 91 13349 68 12532 73 Provider D
1250
1175 106 09270 115 08703 122 Average 100 94 100
(RCI figures to the nearest integer)
PbR and the Market Forces Factor (MFF) in 2013-14 Page 25 of 28
Gateway Ref 18768
Annex E ndash Tariff Calculation
1 Table 3 gives an example calculation of the tariff for an HRG The underlying MFF is rebased so that the minimum value is 1 (column D) by dividing the index through by the 2013-14 minimum value of 09263 Total costs are then divided by these MFF values (column E) The income for a provider is then the product of tariff price activity and rebased MFF (column F)
Table 3 Rebasing MFF for Tariff Calculation
A B C D = C min C
E = B D F = Tariff A D
Activity Total Costs (pound)
Underlying MFF
Rebased MFF to 1
Total Costs adjusted for rebased MFF (pound)
PbR Income (pound)
Provider A Provider
60 1250 10249 11064 1130 1528
B Provider
50 1000 11021 11898 840 1369
C Provider
20 1000 13349 14411 694 663
D 40 1250 09263 1 1250 921 Total 170 4500 3913 4483
Tariff = Total costs adjusted for MFF National activity = sum of column E sum of column A
= pound3913 170 = pound2302
PbR and the Market Forces Factor (MFF) in 2013-14 Page 26 of 28
Gateway Ref 18768
2 Table 4 shows the relative difference between providers A and B for the underlying and rebased (payment) index As is shown irrespective of the index the MFF of Provider B is always 753 greater than that of Provider A This relationship is true for all providers the relativities between providers is the same regardless of how the underlying MFF is scaled
Table 4 Relative differences between providers A amp B
X Y Z = ( Y X )-1
Provider Provider MFF Indices A B Difference Underlying (col C) 10249 11021 753 Rebased to 1 (col D) 11064 11898 753
PbR and the Market Forces Factor (MFF) in 2013-14 Page 27 of 28
Gateway Ref 18768
Annex F ndash Creating an index
1 An index is a ranking of numbers relative to the same base such that they can be directly compared
2 In the example below an index value can be attached to each of the numbers in column A An index is constructed by dividing each number by the base value of the index In common with the MFF the first index created is in column B which has an average value of 10 like the underlying MFF index This index is constructed by dividing each number by the average of the index 100
Values Index with an average of 1
Index with a minimum of 1
A B C 50 050 100 95 095 190 125 125 250 130 130 260 100 100 200
Average value 100 Minimum value 50
3 The index in column B represents a ranking relative to the average value in the list The average of the values in column a is 100 The value 50 in column A is half of the average so as a relative value 50 can be expressed as 05
4 Column C represents the transformation of the index to have a minimum value of 1 akin to the payment index 50 is the lowest of all the values in column A and so in the index in column C it has a value of 10
5 As stated in the guidance irrespective of the version of the MFF index the relative unavoidable cost differences between organisations are maintained In the example above it can be seen that the relative difference between the values 50 and 100 of column A is the same in both columns B and C ie 05 is half of 10 and 10 is half of 20 This also holds for every other combination of values For example 50 is 04 times small than 125 In columns B and C the relative difference in the associated index values is also 04 (050 125 = 04) and (10 25 = 04)
PbR and the Market Forces Factor (MFF) in 2013-14 Page 28 of 28
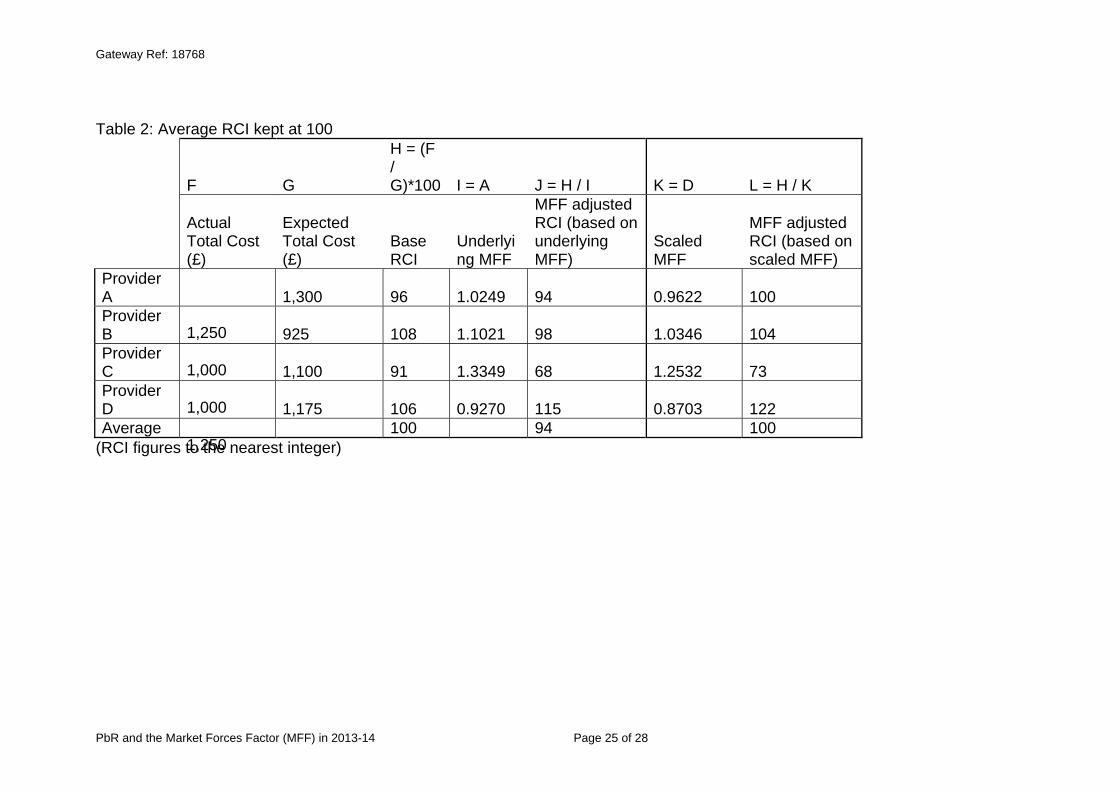
Gateway Ref 18768
Table 2 Average RCI kept at 100
F G
H = (F G)100 I = A J = H I K = D L = H K
Actual Total Cost (pound)
Expected Total Cost (pound)
Base RCI
Underlyi ng MFF
MFF adjusted RCI (based on underlying MFF)
Scaled MFF
MFF adjusted RCI (based on scaled MFF)
Provider A
1250
1300 96 10249 94 09622 100 Provider B
1000
925 108 11021 98 10346 104 Provider C
1000
1100 91 13349 68 12532 73 Provider D
1250
1175 106 09270 115 08703 122 Average 100 94 100
(RCI figures to the nearest integer)
PbR and the Market Forces Factor (MFF) in 2013-14 Page 25 of 28
Gateway Ref 18768
Annex E ndash Tariff Calculation
1 Table 3 gives an example calculation of the tariff for an HRG The underlying MFF is rebased so that the minimum value is 1 (column D) by dividing the index through by the 2013-14 minimum value of 09263 Total costs are then divided by these MFF values (column E) The income for a provider is then the product of tariff price activity and rebased MFF (column F)
Table 3 Rebasing MFF for Tariff Calculation
A B C D = C min C
E = B D F = Tariff A D
Activity Total Costs (pound)
Underlying MFF
Rebased MFF to 1
Total Costs adjusted for rebased MFF (pound)
PbR Income (pound)
Provider A Provider
60 1250 10249 11064 1130 1528
B Provider
50 1000 11021 11898 840 1369
C Provider
20 1000 13349 14411 694 663
D 40 1250 09263 1 1250 921 Total 170 4500 3913 4483
Tariff = Total costs adjusted for MFF National activity = sum of column E sum of column A
= pound3913 170 = pound2302
PbR and the Market Forces Factor (MFF) in 2013-14 Page 26 of 28
Gateway Ref 18768
2 Table 4 shows the relative difference between providers A and B for the underlying and rebased (payment) index As is shown irrespective of the index the MFF of Provider B is always 753 greater than that of Provider A This relationship is true for all providers the relativities between providers is the same regardless of how the underlying MFF is scaled
Table 4 Relative differences between providers A amp B
X Y Z = ( Y X )-1
Provider Provider MFF Indices A B Difference Underlying (col C) 10249 11021 753 Rebased to 1 (col D) 11064 11898 753
PbR and the Market Forces Factor (MFF) in 2013-14 Page 27 of 28
Gateway Ref 18768
Annex F ndash Creating an index
1 An index is a ranking of numbers relative to the same base such that they can be directly compared
2 In the example below an index value can be attached to each of the numbers in column A An index is constructed by dividing each number by the base value of the index In common with the MFF the first index created is in column B which has an average value of 10 like the underlying MFF index This index is constructed by dividing each number by the average of the index 100
Values Index with an average of 1
Index with a minimum of 1
A B C 50 050 100 95 095 190 125 125 250 130 130 260 100 100 200
Average value 100 Minimum value 50
3 The index in column B represents a ranking relative to the average value in the list The average of the values in column a is 100 The value 50 in column A is half of the average so as a relative value 50 can be expressed as 05
4 Column C represents the transformation of the index to have a minimum value of 1 akin to the payment index 50 is the lowest of all the values in column A and so in the index in column C it has a value of 10
5 As stated in the guidance irrespective of the version of the MFF index the relative unavoidable cost differences between organisations are maintained In the example above it can be seen that the relative difference between the values 50 and 100 of column A is the same in both columns B and C ie 05 is half of 10 and 10 is half of 20 This also holds for every other combination of values For example 50 is 04 times small than 125 In columns B and C the relative difference in the associated index values is also 04 (050 125 = 04) and (10 25 = 04)
PbR and the Market Forces Factor (MFF) in 2013-14 Page 28 of 28
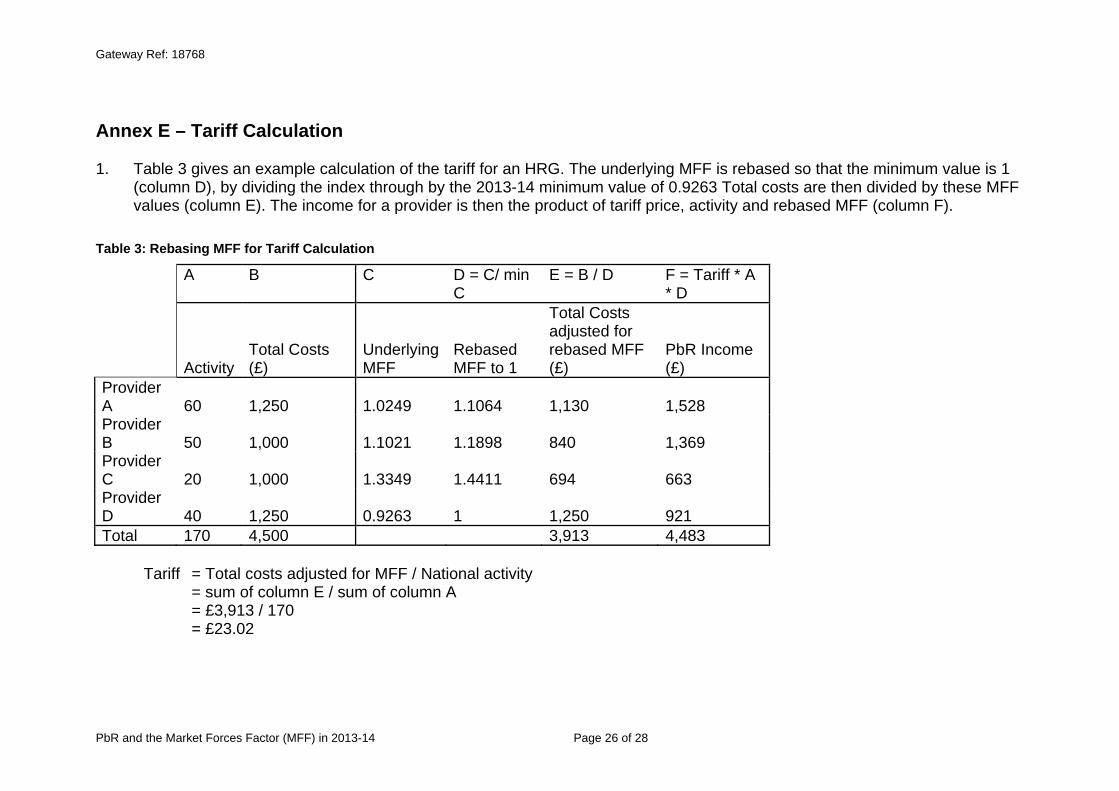
Gateway Ref 18768
Annex E ndash Tariff Calculation
1 Table 3 gives an example calculation of the tariff for an HRG The underlying MFF is rebased so that the minimum value is 1 (column D) by dividing the index through by the 2013-14 minimum value of 09263 Total costs are then divided by these MFF values (column E) The income for a provider is then the product of tariff price activity and rebased MFF (column F)
Table 3 Rebasing MFF for Tariff Calculation
A B C D = C min C
E = B D F = Tariff A D
Activity Total Costs (pound)
Underlying MFF
Rebased MFF to 1
Total Costs adjusted for rebased MFF (pound)
PbR Income (pound)
Provider A Provider
60 1250 10249 11064 1130 1528
B Provider
50 1000 11021 11898 840 1369
C Provider
20 1000 13349 14411 694 663
D 40 1250 09263 1 1250 921 Total 170 4500 3913 4483
Tariff = Total costs adjusted for MFF National activity = sum of column E sum of column A
= pound3913 170 = pound2302
PbR and the Market Forces Factor (MFF) in 2013-14 Page 26 of 28
Gateway Ref 18768
2 Table 4 shows the relative difference between providers A and B for the underlying and rebased (payment) index As is shown irrespective of the index the MFF of Provider B is always 753 greater than that of Provider A This relationship is true for all providers the relativities between providers is the same regardless of how the underlying MFF is scaled
Table 4 Relative differences between providers A amp B
X Y Z = ( Y X )-1
Provider Provider MFF Indices A B Difference Underlying (col C) 10249 11021 753 Rebased to 1 (col D) 11064 11898 753
PbR and the Market Forces Factor (MFF) in 2013-14 Page 27 of 28
Gateway Ref 18768
Annex F ndash Creating an index
1 An index is a ranking of numbers relative to the same base such that they can be directly compared
2 In the example below an index value can be attached to each of the numbers in column A An index is constructed by dividing each number by the base value of the index In common with the MFF the first index created is in column B which has an average value of 10 like the underlying MFF index This index is constructed by dividing each number by the average of the index 100
Values Index with an average of 1
Index with a minimum of 1
A B C 50 050 100 95 095 190 125 125 250 130 130 260 100 100 200
Average value 100 Minimum value 50
3 The index in column B represents a ranking relative to the average value in the list The average of the values in column a is 100 The value 50 in column A is half of the average so as a relative value 50 can be expressed as 05
4 Column C represents the transformation of the index to have a minimum value of 1 akin to the payment index 50 is the lowest of all the values in column A and so in the index in column C it has a value of 10
5 As stated in the guidance irrespective of the version of the MFF index the relative unavoidable cost differences between organisations are maintained In the example above it can be seen that the relative difference between the values 50 and 100 of column A is the same in both columns B and C ie 05 is half of 10 and 10 is half of 20 This also holds for every other combination of values For example 50 is 04 times small than 125 In columns B and C the relative difference in the associated index values is also 04 (050 125 = 04) and (10 25 = 04)
PbR and the Market Forces Factor (MFF) in 2013-14 Page 28 of 28
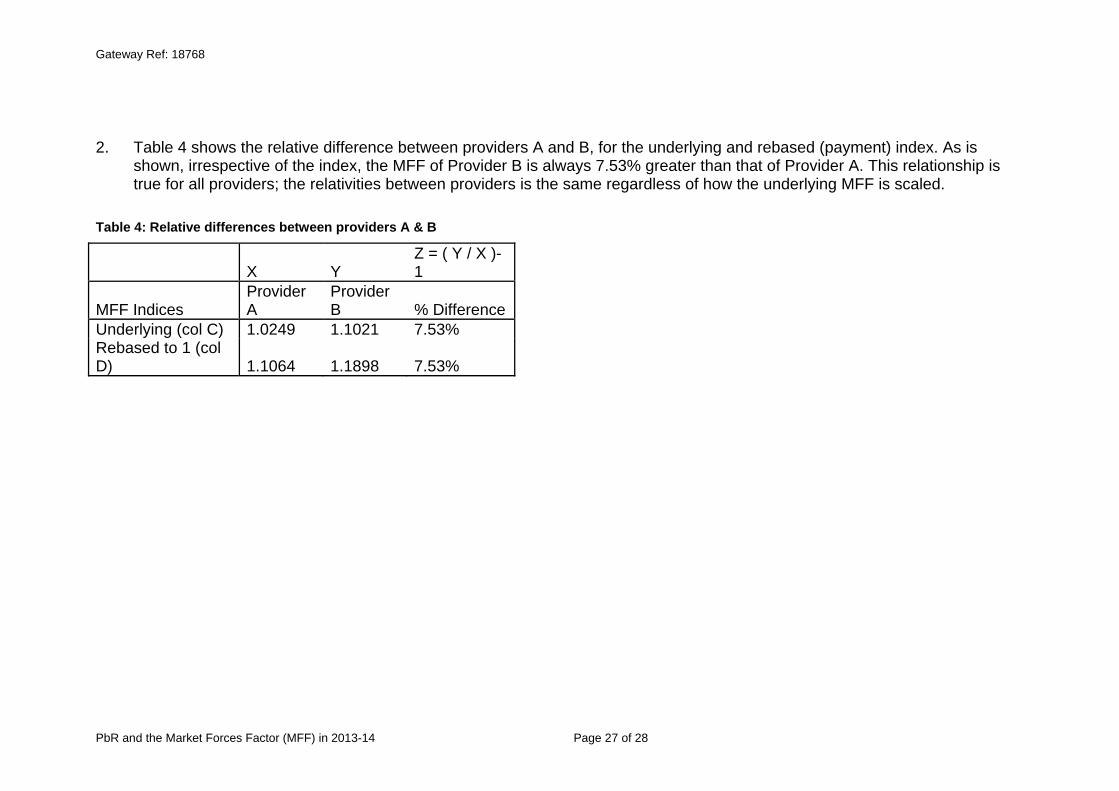
Gateway Ref 18768
2 Table 4 shows the relative difference between providers A and B for the underlying and rebased (payment) index As is shown irrespective of the index the MFF of Provider B is always 753 greater than that of Provider A This relationship is true for all providers the relativities between providers is the same regardless of how the underlying MFF is scaled
Table 4 Relative differences between providers A amp B
X Y Z = ( Y X )-1
Provider Provider MFF Indices A B Difference Underlying (col C) 10249 11021 753 Rebased to 1 (col D) 11064 11898 753
PbR and the Market Forces Factor (MFF) in 2013-14 Page 27 of 28
Gateway Ref 18768
Annex F ndash Creating an index
1 An index is a ranking of numbers relative to the same base such that they can be directly compared
2 In the example below an index value can be attached to each of the numbers in column A An index is constructed by dividing each number by the base value of the index In common with the MFF the first index created is in column B which has an average value of 10 like the underlying MFF index This index is constructed by dividing each number by the average of the index 100
Values Index with an average of 1
Index with a minimum of 1
A B C 50 050 100 95 095 190 125 125 250 130 130 260 100 100 200
Average value 100 Minimum value 50
3 The index in column B represents a ranking relative to the average value in the list The average of the values in column a is 100 The value 50 in column A is half of the average so as a relative value 50 can be expressed as 05
4 Column C represents the transformation of the index to have a minimum value of 1 akin to the payment index 50 is the lowest of all the values in column A and so in the index in column C it has a value of 10
5 As stated in the guidance irrespective of the version of the MFF index the relative unavoidable cost differences between organisations are maintained In the example above it can be seen that the relative difference between the values 50 and 100 of column A is the same in both columns B and C ie 05 is half of 10 and 10 is half of 20 This also holds for every other combination of values For example 50 is 04 times small than 125 In columns B and C the relative difference in the associated index values is also 04 (050 125 = 04) and (10 25 = 04)
PbR and the Market Forces Factor (MFF) in 2013-14 Page 28 of 28
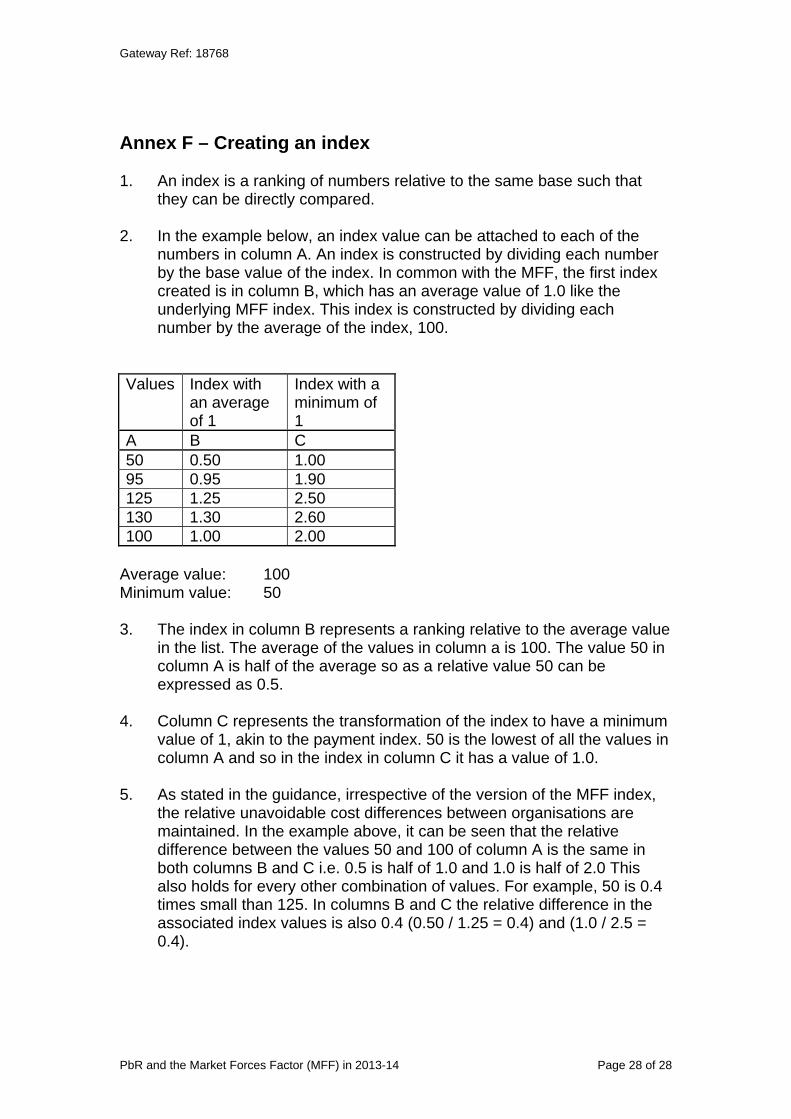
Gateway Ref 18768
Annex F ndash Creating an index
1 An index is a ranking of numbers relative to the same base such that they can be directly compared
2 In the example below an index value can be attached to each of the numbers in column A An index is constructed by dividing each number by the base value of the index In common with the MFF the first index created is in column B which has an average value of 10 like the underlying MFF index This index is constructed by dividing each number by the average of the index 100
Values Index with an average of 1
Index with a minimum of 1
A B C 50 050 100 95 095 190 125 125 250 130 130 260 100 100 200
Average value 100 Minimum value 50
3 The index in column B represents a ranking relative to the average value in the list The average of the values in column a is 100 The value 50 in column A is half of the average so as a relative value 50 can be expressed as 05
4 Column C represents the transformation of the index to have a minimum value of 1 akin to the payment index 50 is the lowest of all the values in column A and so in the index in column C it has a value of 10
5 As stated in the guidance irrespective of the version of the MFF index the relative unavoidable cost differences between organisations are maintained In the example above it can be seen that the relative difference between the values 50 and 100 of column A is the same in both columns B and C ie 05 is half of 10 and 10 is half of 20 This also holds for every other combination of values For example 50 is 04 times small than 125 In columns B and C the relative difference in the associated index values is also 04 (050 125 = 04) and (10 25 = 04)
PbR and the Market Forces Factor (MFF) in 2013-14 Page 28 of 28


![Class4 mff[1]](https://img.pdfslide.net/doc/110x75/547a859ab4af9fa0158b4b65/class4-mff1.jpg)