Embed Size (px)
Citation preview

reporting stations were actually located at
sea level. Adjustment of air pressure readings
to a common elevation (sea level) removes
the influences of the earth's relief
(topography) on air pressure readings. This
adjustment allows comparisons of horizontal
pressure differences that can lead to the
recognition of weather patterns.
Horizontal air pressure patterns on a weather
map are revealed by drawing lines joining
points of equal pressure, or representing equal
pressure, on the map. These lines are called
isobars because every point on a given line
has the same air pressure value. Each isobar
separates stations reporting pressure values
higher than that of a particular isobar's value Materials from stations reporting pressure values lower
than that isobar.Pencil
Station Pressure Plotting and IntroductionAnalysis on Weather Maps
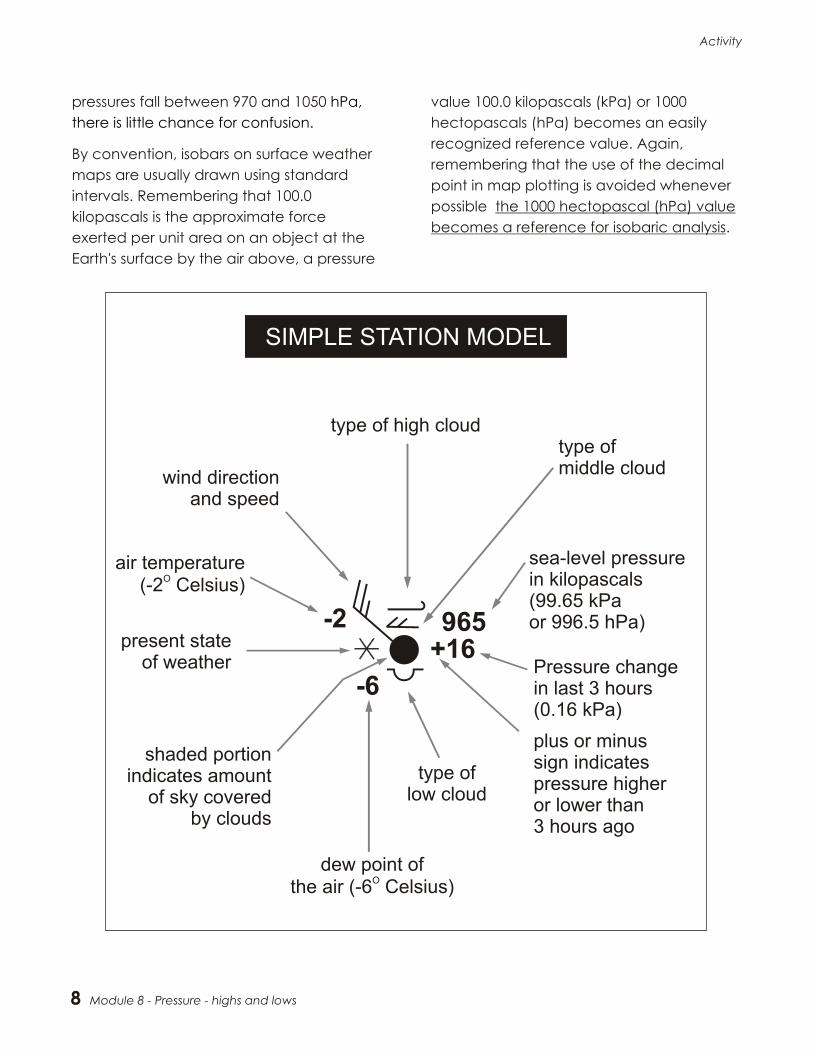
Air pressure is determined by the weight of
the overlying air, and it varies from place to The standard unit of atmospheric pressure at place and over time. Surface air pressure is the surface of the earth is the kilopascal the force exerted per unit area on an object (kPa). Today's barometers read the station at the Earth's surface by the air above, pressure accurately to the second decimal approximately 100,000 newtons per square point; for example, 101.25 kPa. metre or 100 kilopascals.
In the plotting of weather maps, it is common Pressure variations bring about atmospheric practice to drop the decimal points from the motions that set the stage for much of the map to facilitate legibility and to avoid weather we experience. Knowing the confusion with station symbols. The plot on a patterns of pressure is basic to understanding weather map thus shows the station pressure what the weather is and what it is likely to be of 101.25 kPa simply as "125" (or the last three where you live. digits of the pressure value) as depicted in
the station plot model shown below.Air pressures routinely reported on surface
weather maps are values "corrected" to sea The initial 10, or 9 in the case if pressures level. That is, air pressure readings are below 100 kPa is also dropped for conve-adjusted to what they would be if the nience on most maps. Since most sea-level
!
Activity
ACTIVITY
7Module 8 - Pressure - highs and lows
Surface Air Pressure Patterns
Upon completing this activity, you should
be able to:
! Draw lines of equal pressure (isobars)
to show the pattern of surface air
pressures on a weather map.
! Locate regions of relatively high and
low air pressure on a surface weather
map.
! Locate regions on a surface weather
map exhibiting relatively large air
pressure changes over short
horizontal distances and broad areas
with gradually varying air pressure.
pressures fall between 970 and 1050 value 100.0 kilopascals (kPa) or 1000
hectopascals (hPa) becomes an easily
recognized reference value. Again, By convention, isobars on surface weather
remembering that the use of the decimal maps are usually drawn using standard
point in map plotting is avoided whenever intervals. Remembering that 100.0
possible the 1000 hectopascal (hPa) value kilopascals is the approximate force
becomes a reference for isobaric analysis.exerted per unit area on an object at the
Earth's surface by the air above, a pressure
hPa,
there is little chance for confusion.
8 Module 8 - Pressure - highs and lows
Activity
SIMPLE STATION MODEL
-6
+16965-2
type of high cloudtype of middle cloud
type oflow cloud
Pressure change in last 3 hours(0.16 kPa)
sea-level pressure in kilopascals(99.65 kPa or 996.5 hPa)
plus or minus sign indicates pressure higher or lower than 3 hours ago
wind direction and speed
air temperatureO
(-2 Celsius)
present state of weather
shaded portion indicates amount
of sky coveredby clouds
dew point ofO
the air (-6 Celsius)

isobar to the next) as that used on this Activity 1map. That isobar interval is _______ hPa.
Figure 1 represents a surface map plot which The isobar interval is selected so as to
shows air pressure in hectopascals (hPa) at provide the most useful depiction of the
various locations. (The example uses whole field of data; too small an interval will
numbers and not the traditional station plot clutter the map with too many lines, and
format for the purpose of this exercise only) too great an interval gives too few lines to
Each pressure measurement is placed on the adequately define the pattern.
location it represents. A 1012-hPa isobar, 2. Isobars that are drawn on surface
which encircles one station on this map has weather maps follow a sequence of
been drawn. Complete the 1008-hPa isobar values that can be found by adding or
that has already been started. Finally draw subtracting 4 from 1000, then adding or
the 1004-hPa isobar. Label each isobar by subtracting another 4 from the resulting
writing the appropriate pressure value at its numbers, and so on until the full range of
end point.values plotted on the map have been
accounted for. Cross out the numbers in
the following set which do not fit such a
sequence of isobaric values: 992, 994,
996, 1000, 1002, 1004, 1008, 1009, 1010,
1012.
3. The letters "H" and "L" mark the centres of
closed isobars and signify centres of
maximum high and minimum low
pressure, respectively, compared to
pressure readings in the surrounding area.
On the completed surface pressure
analysis of Figure 1, the pressure inside the
1012-hPa isobar is higher than the isobar
value. Place an "H" inside the closed
isobar.
Tips for drawing isobars:
Investigations a. Always draw an isobar so that air pressure
readings greater than the isobar's value Referring to the completed surface pressure
are consistently on one side of the isobar analysis of Figure 1:
and lower values are on the other side.
1. By convention, isobars on surface b. When positioning isobars, assume a
weather maps are usually drawn using steady pressure change with distance
the same interval (the difference between neighbouring stations. For
between air pressure values from one example, a 1012-hPa isobar would be
9Module 8 - Pressure - highs and lows
Activity
1001
1002
1006
1009
101010101011
1007
1006
1003
1007
1014
1012
1008
Figure 1 - Sample plot of surface pressure values in hectopascals (hPa)
at various stations. (This example uses whole numbers and
not the traditional station plot format for the purpose of this
exercise only)

10 Module 8 - Pressure - highs and lows
Activity
drawn between the observations of 1013 Activity 3hPa and 1010 hPa about one-third the
Go to the Environment Canada Web Site to way from the 1013 hPa reading.
view the latest surface weather map c. Adjacent isobars tend to follow a similar
analyses (surface weather charts):pattern. The isobar that you are drawing
will generally parallel the curves of its http://weatheroffice.ec.gc.ca
neighbours because horizontal changes in Navigate to the Weather Maps page. Select
air pressure from place to place are Analysis Charts
usually gradual.
Under Surface Analysis: MSLP (Mean Sea d. Continue drawing an isobar until it
Level Pressure), a variety of surface weather reaches the boundary of the plotted data
map analyses for 00z, 06z, 12z and 18z are or "closes" to form a loop by making its
available. For viewing purposes, the smaller way back to its starting point.
Canadian coverage analyses may be the
e. Isobars never stop or end within a data preferred option.
field, and they never fork, touch or cross Examine the various surface map analyses
one another.available on the web site. Select one for
f. Isobars cannot be skipped if their values further evaluation. The map selected should
fall within the range of air pressure have both "closed" Highs and Lows and some
reported on the map. Isobars must always variation in the degree of horizontal pressure
appear in sequence, for example, there changes depicted.
must always be a 1000-hPa isobar Either by printing a hard copy of the Surface
between a 996-hPa and 1004-hPa isobar.Analysis or through online display, examine
g. Always label isobars. the surface analysis and the isobars drawn on
the weather map from the perspective of:
Activity 2a) Applying the tips for drawing isobars.
Figure 2 represents a surface map showing b) Locating regions of relatively high and low air pressure in hectopascals (hPa) at various air pressure on a surface weather map.locations. As in Figure 1, this example uses
c) Locating regions on a surface weather whole numbers and not the traditional station map exhibiting relatively large air pressure plot format for the purpose of this exercise changes over short horizontal distances only, and each pressure measurement is and broad areas with gradually varying placed on the location it represents. The 996-, air pressure.1000- and 1004-hPa isobars have already
been drawn. Draw all other isobars in the Note: If internet access to a surface map
sequence that spans the range of pressure analysis is not readily available, Activity
values appearing on the map. (An isobar 3 can be completed using the surface
may appear more than once on the map if map analyses provided in figures 3
the pattern of values requires it.)and 4.

Activity
11Module 8 - Pressure - highs and lows
Figure 2 - surface map showing air pressure in hectopascals (hPa) at various locations across Canada and the United States. (This example uses whole numbers and not the traditional station plot format for the purpose of this exercise only)

12 Module 8 - Pressure - highs and lows
Activity
Ra
in
Sh
ow
ers
Sn
ow
Ice
Cry
sta
ls
Fre
ezi
ng
Ra
in
Th
un
de
rsh
ow
ers
Blo
win
g S
no
w
Tu
rbu
len
ce
Figure 3 - An example of a regional surface map analysis showing isobars, highs, lows, fronts, clouds, and precipitation.
(This chart can be used for Activity 3 on Surface Air Pressure Patterns)
Su
rfa
ce A
na
lysi
sva
lid 1
8Z
Th
u.J
eu
19
99
/12
/16
(c)1
99
9

13Module 8 - Pressure - highs and lows
Activity
Figure 4 - An example of a computerized national surface map analysis showing isobars, highs and lows.
(This chart can be used for Activity 3 on Surface Air Pressure Patterns)
EN
VIR
ON
NE
ME
NT
CA
NA
DA
CM
C E
NV
IRO
NM
EN
T C
AN
AD
A
AN
AL S
UR
FA
CE
12
Z T
HU
- J
EU
03
AU
G-A
OU
00
G3
PL
JAC
_1
2 J
AC

and (2) the impacts of these motions on
weather at locations under the influence of
Highs and Lows.
Materials
! Pencil
Procedure: Construction of a
Model High Pressure System
1. Using a copy of the map of North
America found in Figure 5, place an H
over Edmonton representing the centre of
a broad high pressure area. Lightly draw
a circle on the map about 3 cm in
diameter around the "H."Introduction
2. Place the map flat on your desk. If
possible, stand up. (This exercise works Weather can be fair or stormy. Generally, fair better standing up.) Bring the thumb and weather is associated with high surface air fingertips of your left hand (if you are pressure while stormy weather is associated right-handed) or your right hand (if your with low surface air pressure. Broad-scale are left-handed) close together and areas of high and low surface pressure place them on the circle you drew.dominate weather in middle latitudes and
are simply called Highs and Lows.3. Rotate your hand slowly clockwise, as
seen from above, and gradually spread Highs and Lows are regions where air out your thumb and fingertips as your pressures are higher or lower compared to hand turns. Do not rotate the map. the surrounding areas and are typically Practice this until you achieve as full a hundreds, or even thousands, of kilometres twist as you can comfortably.across. On a weather map, a large "High" or
H symbolizes the location of highest pressure 4. Place your thumb and fingertips back in
in a High whereas a large "Low" or L your starting position on the circle. Mark
symbolizes the position of lowest pressure in a and label the positions of your thumb and
Low. Highs and Lows generally travel from fingertips 1, 2, 3, 4, and 5, respectively.
west to east while exhibiting at least some
motion toward the north or south. As they 5. Slowly rotate your hand clockwise while travel, they bring changes in the weather to gradually spreading your thumb and the places along their paths. fingertips. Go through about a quarter of
your twisting motion. Stop, mark, and This activity investigates (1) the horizontal
label the positions of your thumb and and vertical air motions in Highs and Lows,
fingertips on the map. Follow the same
14 Module 8 - Pressure - highs and lows
Activity
ACTIVITY Air Motion — The High and Low of It
Upon completing this activity, you should
be able to:
! Describe the general air motions and
weather conditions associated with a
high pressure system, or High.
! Describe the general air motions and
weather conditions associated with a
low pressure system, or Low.
! Based upon the locations of the
centres of Highs and Lows, as shown
on a weather map, predict general
wind directions and weather
conditions for different locations.

15Module 8 - Pressure - highs and lows
Activity
procedure in quarter steps until you the twist until your thumb and fingertips
complete your full twist. are on the circle.
6. Connect the successive dots for each 6. Connect the successive dots for each
finger and your thumb using a smooth finger and your thumb using a smooth
curved line. Place arrowheads on the curved line. Place arrowheads on the
lines to show the directions your thumb lines to show the directions your thumb
and fingertips moved. and fingertips moved.
7. The spirals represent the general flow of 7. The spirals represent the general flow of
surface air that occurs in a typical high surface air that occurs in a typical low
pressure system (or High) pressure system (or Low).
Procedure: Construction of a Investigations: Characteristics
Model Low Pressure System of High & Low Pressure Systems
1. Using another copy of the map of North Directions: Refer to the Activity Introduction
America found in Figure 5, place an "L" and the Model Highs and Lows you
over Des Moines representing the centre constructed to complete the following
of a broad low pressure area. Lightly draw questions.
on the map a circle about 3 cm in 1. Moving in the direction towards the diameter around the "L".
centre of a High, the surface atmospheric 2. Again, if possible, stand up. Place your pressure (increases) (decreases). When
non-writing hand flat on the map with moving towards the centre of a Low, the your palm covering the circle and your surface atmospheric pressure (increases) fingers and thumb spread out. (decreases).
3. Practice rotating your hand counter- 2. Which of the following best describes the clockwise as seen from above while surface wind circulation around the gradually pulling in your thumb and center of a High-pressure system (as seen fingertips as your hand turns until they from above)?touch the circle. Do not rotate the map. a) Counter-clockwise and spiralling outward Practice until you achieve a maximum b) Counter-clockwise and spiralling inward twist with ease. c) Clockwise and spiralling outward
d) Clockwise and spiralling inward4. Place your hand back in the spread
position on the map. Mark and label the 3. Which of the following best describes the positions of your thumb and fingertips 1, 2, surface wind circulation around the 3, 4, and 5, respectively. centre of a Low-pressure system (as seen
from above)?5. Slowly rotate your hand counter-
a) Counter-clockwise and spiralling outward clockwise while gradually drawing in your b) Counter-clockwise and spiralling inward thumb and fingertips. Stopping after c) Clockwise and spiralling outward quarter turns, mark and label the positions d) Clockwise and spiralling inwardof your thumb and fingertips. Continue

4. On your desk, repeat the hand twists for coming out of a tire valve cools as it
the High and Low pressure system expands while rushing from the higher
models. Note the vertical motions of the pressures in the tire into the lower pressure
palm of your hand. For the High, the of the atmosphere.) In the open
atmosphere, air pressure decreases with palm of your hand (rises) (falls) during the
increasing altitude. Consequently, air rotating motion, whereas for the Low, the
expands and cools when (ascending) palm of your hand (rises) (falls) during the
rotating motion. (descending). Air is compressed and
warms when (ascending) (descending).5. The motions of your palms during these
rotations represent the directions of 9. In a Low, air generally exhibits ascending vertical air motions in Highs and Lows. motion. The rising air experiences
Vertical motions in a High are (upward) (increasing) (decreasing) atmospheric
(downward) while vertical motions in a pressure. The ascending air (expands) (is
Low are (upward) (downward). Note that compressed) and its temperature horizontal surface winds in a High and (increases) (decreases).Low are considerably stronger than
10. In a High, air displays descending motion. vertical air motions.The sinking air experiences (increasing)
6. In a High pressure system, air flows (decreasing) atmospheric pressure. a) Downward and outward in a Consequently, the descending air
clockwise spiral (expands) (is compressed) and its b) Downward and inward in a counter-
temperature (increases) (decreases).clockwise spiral
c) Upward and outward in a clockwise spiral 11. Most clouds form by the cooling of air. Air, d) Upward and inward in a counter-
if sufficiently cooled, will become clockwise spiral
saturated with water vapour. Continued
cooling will result in condensation, cloud 7. In a Low pressure system, air flowsformation, and possible precipitation. The a) Downward and outward in a vertical motion in a (High, Low) often clockwise spiral.
b) Downward and inward in a counter- leads to cloud formation.clockwise spiral
12. Warming causes clouds to evaporate. c) Upward and outward in a clockwise spiralCloudy air is saturated with water vapour. d) Upward and inward in a counter-
With sufficient warming, it will become clockwise spiral
unsaturated and existing cloud particles 8. The weather associated with a Low can (water droplets or ice crystals) will
be significantly different than that of a evaporate. The vertical motions in a High. Different vertical motions account (High, Low) produce warming, promote for some of these differences. Vertical cloud dissipation, and lead to clear skies.motions lead to temperature changes in
the rising or sinking air. The temperature 13. Descending air in a High leads to
changes occur because air warms when (fair)(stormy) weather and ascending air
it is compressed and cools when it in a Low tends to make weather expands. (That is why a bicycle pump (fair)(stormy).heats up as it compresses air and why air
Activity
16 Module 8 - Pressure - highs and lows

14. The broad horizontal expanses of Highs 18. The centre of the High is forecast to be
and Lows cover large geographical areas near Regina tomorrow. The weather at
such that their circulations transport Edmonton tomorrow will probably be
colder air from higher latitudes and most like the weather in (Regina, Prince
warmer air from lower latitudes. George, Helena) today.
Consequently, in a High, air to the east of 19. Turn to your map with the Low marked on the system's centre is generally (colder)
it. Examine the model Low that you (warmer) than air to the west.constructed on the map. The hand-twist
model of a Low indicates that the sky is 15. In a Low, air to the east of the system's
probably (clear) (cloudy) at Des Moines.centre is generally (colder) (warmer) than
air to the west.20. Surface winds at Cheyenne are probably
from the general direction of (north) 16. Turn to your map with the High marked on
it. Examine the model High you (south), and temperatures are (higher)
constructed on the map. The hand-twist (lower) than those in Toronto.
model of a High indicates the sky is 21. In the table below, describe the typical probably (clear) (cloudy) at Edmonton.
characteristics of Highs and Lows. Within
17. Surface winds at Prince George are each box, the related question number is
probably from the general direction of listed for easy reference.
(north) (south) and temperatures are
(higher) (lower) than those in Saskatoon.
Activity
17Module 8 - Pressure - highs and lows
Pressure Change Towards Center
HIGH
1
2
2
5
10
12
13
1
3
3
5
9
11
13
LOW
(increase, decrease)
Surface Winds Around Center
(clockwise, counter-clockwise)
Surface Winds Around Center
(inward, outward)
Vertical Motion
(up, down)
Change in Temperature of Vertically Moving Air
(increases, decreases)
State of the Sky Around Center
(clear, cloudy)
General Weather
(fair, stormy)

Activity
18 Module 8 - Pressure - highs and lows
Figure 5 - Reference map of North America for Activity - Air motion - the high and low of it
North America
Kilometers500 5000 1000