Embed Size (px)
Citation preview
CONDITIONS AFFECTING NEUROCOGNITIVE
DEVELOPMENT AND LEARNING IN EARLY
CHILDHOOD
Cynthia R. Rovnaghi, MS Research Specialist & Manager, Pain Neurobiology Laboratory
University of Tennessee Health Science Center, Memphis.
K. J. S. “Sunny” Anand, MBBS, D.Phil. Professor of Pediatrics, Anesthesiology, Anatomy & Neurobiology
University of Tennessee Health Science Center, Memphis.
http://www.candlestudy.org http://www.theurbanchildinstitute.org http://www.uthsc.edu/
With regard to this presentation, Ms. Rovnaghi and Dr. Anand
have no Financial Relationships to disclose or Conflicts of Interest to resolve.
Amsterdam, The Netherlands
September 23-25, 2013
http://www.candlestudy.org http://www.theurbanchildinstitute.org http://www.uthsc.edu/
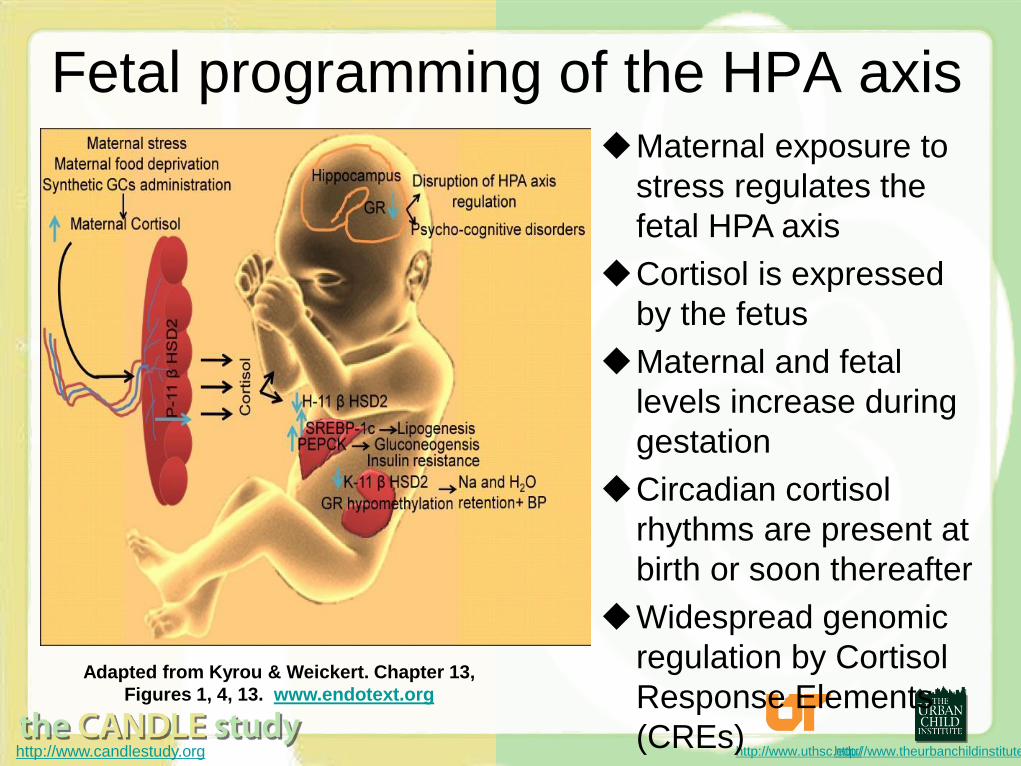
Fetal programming of the HPA axis
Adapted from Kyrou & Weickert. Chapter 13,
Figures 1, 4, 13. www.endotext.org
Maternal exposure to
stress regulates the
fetal HPA axis
Cortisol is expressed
by the fetus
Maternal and fetal
levels increase during
gestation
Circadian cortisol
rhythms are present at
birth or soon thereafter
Widespread genomic
regulation by Cortisol
Response Elements
(CREs)
http://www.candlestudy.org http://www.theurbanchildinstitute.org http://www.uthsc.edu/
Cortisol Imposed Changes in Brain
Development? • Prenatal and postnatal connectivity exceeds that of
adults (Stiles & Jernigan 2010; Stiles 2008)
• Activity-dependent pruning of developing synapses (Gogtay et al 2004; Sowell et al 2004; Ostby et al 2009; Stoneham et al 2010)
• Enriched environments enhance synaptogenesis (Kolb & Gibb 1991; Moncek et al 2004; Champagne et al 2007)
• Increased cortisol exposure reduces limbic system
brain volume linked to later cognitive/behavioral
disorders (Lupien et al. 1998; Wiedenmayer et al. 2006; Jorge et al. 2007;
Schechter et al. 2012; Moser et al. 2013)
• Anxiety, attention deficit, internalizing and
externalizing behaviors by 3 years (Kryski et al 2013)
http://www.candlestudy.org http://www.theurbanchildinstitute.org http://www.uthsc.edu/
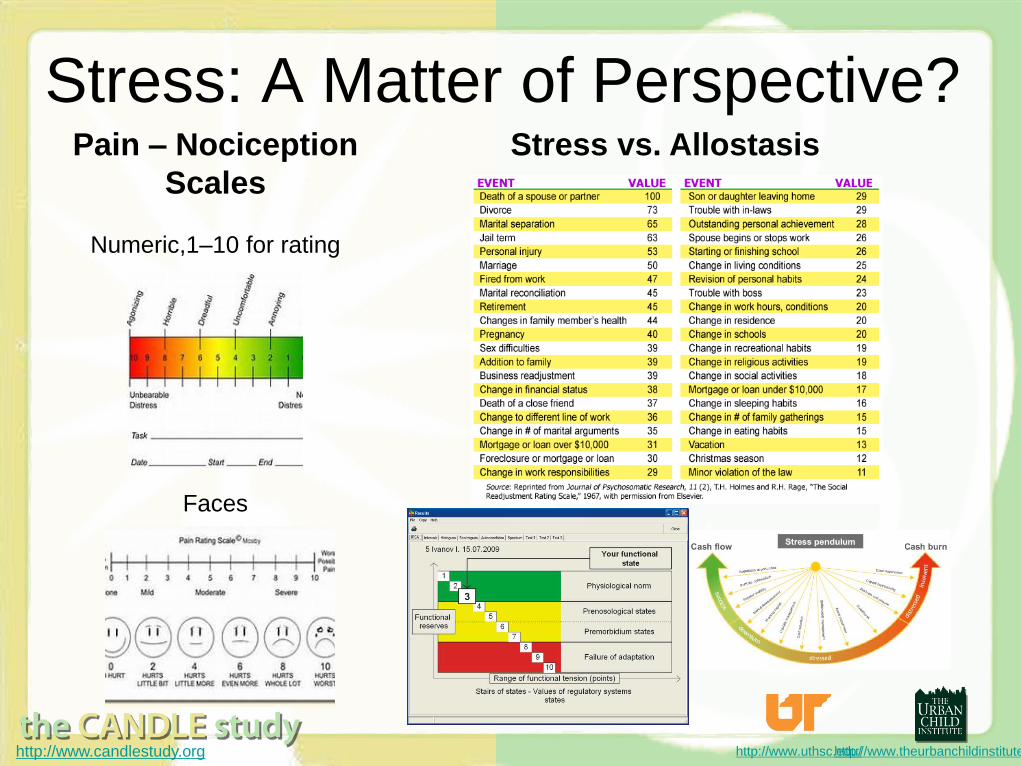
Stress: A Matter of Perspective? Pain – Nociception
Scales
Numeric,1–10 for rating
Faces
Stress vs. Allostasis
http://www.candlestudy.org http://www.theurbanchildinstitute.org http://www.uthsc.edu/
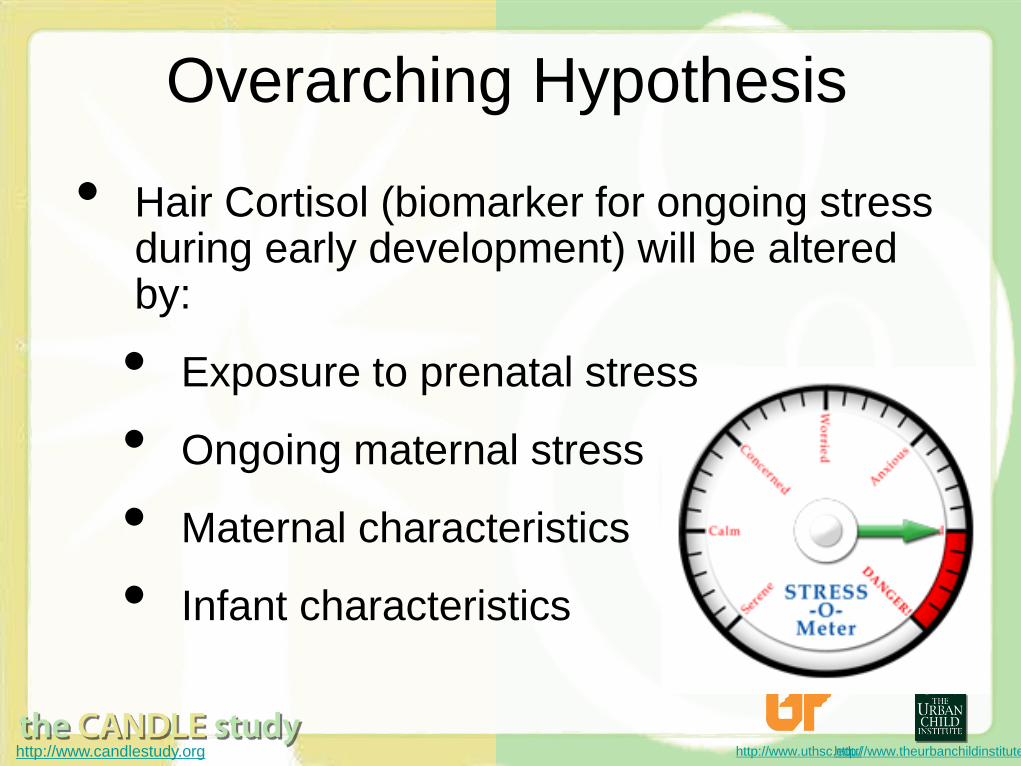
Overarching Hypothesis
• Hair Cortisol (biomarker for ongoing stress during early development) will be altered by:
• Exposure to prenatal stress
• Ongoing maternal stress
• Maternal characteristics
• Infant characteristics
http://www.candlestudy.org http://www.theurbanchildinstitute.org http://www.uthsc.edu/
CANDLE Study: Hair Cortisol
• Cross sectional analysis of hair samples (3-50 mg)
obtained at Clinic Visits: CV1 (N=374), CV2 (N=
308), CV3 (N=190)
• Hair taped at distal end, 1-3 cm sample is cut close
to the scalp
• Clean, free of oils, waxes, any other hair products
• Analyzed after multiple protein extractions
ELISA-based assay system (ALPCO Diagnostics, Inc.)
• Intra-assay coefficients of variation: <5%
• Inter-assay coefficients of variation: <8%

http://www.candlestudy.org http://www.theurbanchildinstitute.org http://www.uthsc.edu/
Potential predictors • Outcome – Ln-Cortisol ng/mg
Demographics Child characteristics Maternal Race (Black vs. White)
Child's gender (female vs. male)
Maternal Education (< High
school vs. >High school CV1,
CV2, or CV3)
Maternal Marital Status M1
(Married or with Partner vs.
Single)
Insurance M1 (Medicaid vs. Other
or None)
Maternal Age M1
Child's age (months) CV1, CV2,
CV3
Birth: Gestational Age and Birth Weight-
for-Length %tile
At CV1, CV2, CV3
o Weight-for-length %tile CV1, CV2,
CV3
o Possible SE Problem (CV1, CV2)
(Yes vs. No)
o Total SE Problem CV1, CV2, CV3
o Cognitive Risk CV1
(competent vs. emerging or risk)
o Cognitive Class at CV2, CV3
(average and above vs. below
average)
http://www.candlestudy.org http://www.theurbanchildinstitute.org http://www.uthsc.edu/
Potential Predictors (cont’d)
Maternal characteristics TLEQ, M2
BSI, M2, CV1, CV2, CV3:
Anxiety, Depression, Global
Severity Index (GSI) T-scores
EPDS score (depression)CV1
Maternal BMI, M1
Temperament, M1:
Dysthymic, Cyclothymic,
Hyperthymic, and Irritable
Temperament Scores
WASI (intelligence) Total
Score
PSI, CV1, CV2, CV3
o Defensive Response;
Parental Distress; Parent-
Child Dysfunctional
Interaction; Difficult Child
%tiles; Total PSI %tile
CAPI, CV1, CV2, CV3
o Abuse, Distress, Rigidity,
Unhappiness, Problems
with Child and Self,
Problems with Family,
Problems with Others
scores
http://www.candlestudy.org http://www.theurbanchildinstitute.org http://www.uthsc.edu/
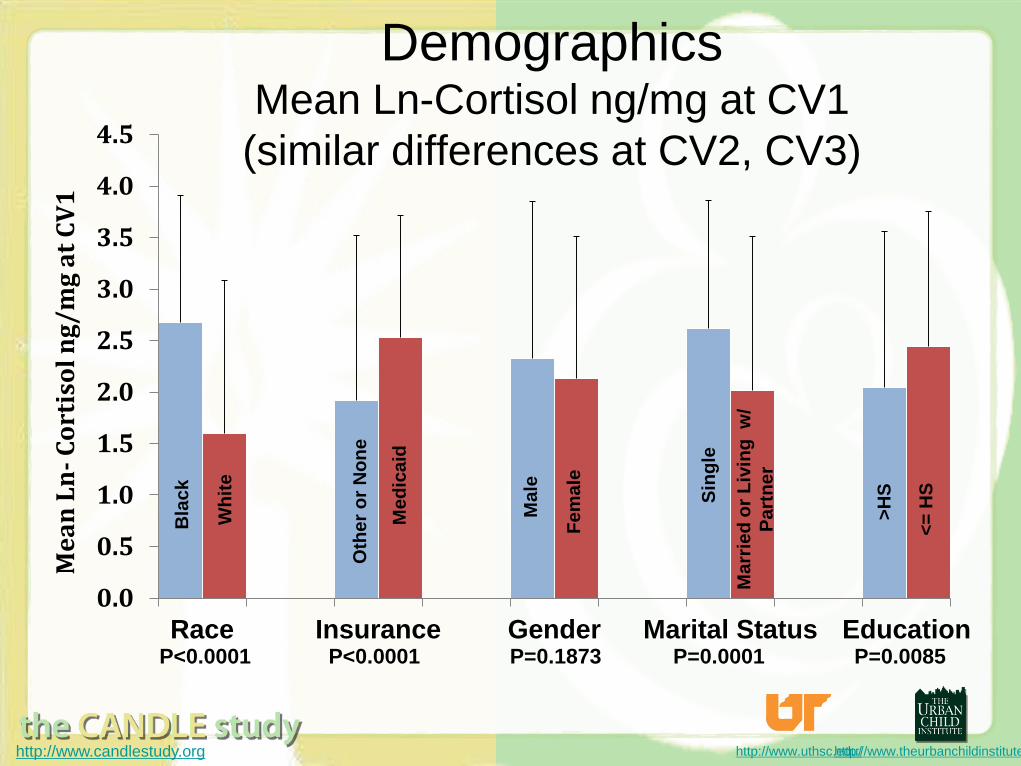
Demographics Mean Ln-Cortisol ng/mg at CV1
(similar differences at CV2, CV3)
0.0
0.5
1.0
1.5
2.0
2.5
3.0
3.5
4.0
4.5
Race Insurance Gender Marital Status Education
Me
an
Ln
- C
ort
iso
l n
g/
mg
at
CV
1
Bla
ck
Wh
ite
Oth
er
or
No
ne
Me
dic
aid
Male
Fe
ma
le
Sin
gle
Ma
rrie
d o
r L
ivin
g w
/
Pa
rtn
er
>H
S
<=
HS
P<0.0001 P<0.0001 P=0.1873 P=0.0001 P=0.0085
http://www.candlestudy.org http://www.theurbanchildinstitute.org http://www.uthsc.edu/
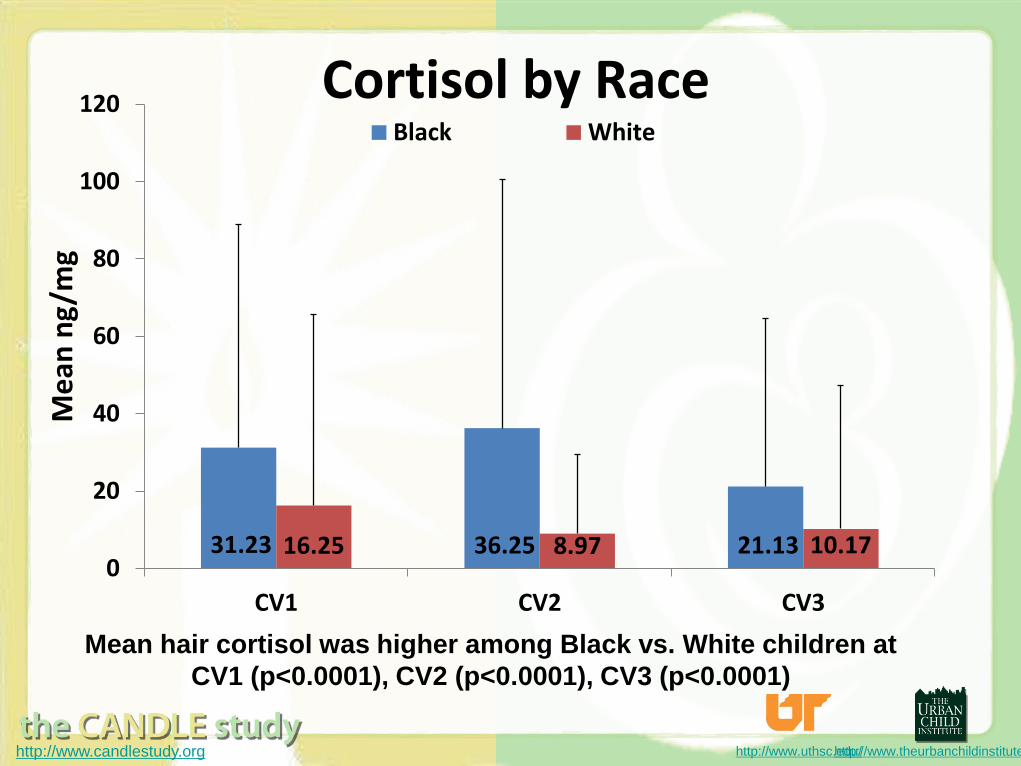
31.23 36.25 21.13 16.25 8.97 10.17 0
20
40
60
80
100
120
CV1 CV2 CV3
Me
an n
g/m
g Cortisol by Race
Black White
Mean hair cortisol was higher among Black vs. White children at
CV1 (p<0.0001), CV2 (p<0.0001), CV3 (p<0.0001)
http://www.candlestudy.org http://www.theurbanchildinstitute.org http://www.uthsc.edu/
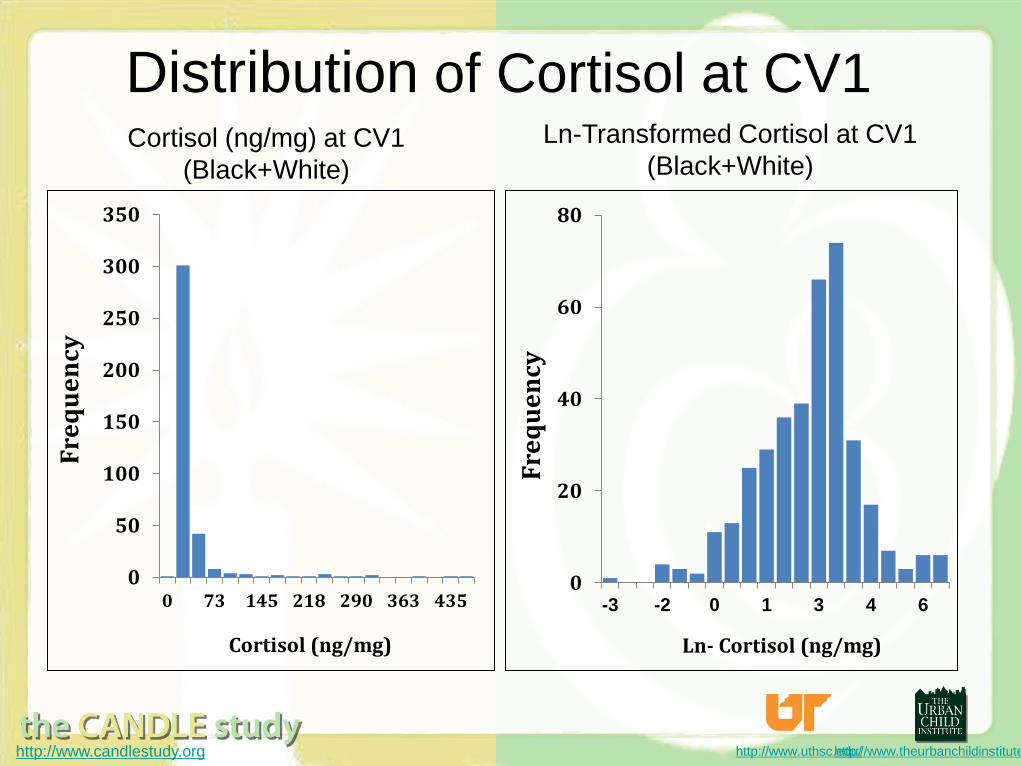
Distribution of Cortisol at CV1 Cortisol (ng/mg) at CV1
(Black+White)
Ln-Transformed Cortisol at CV1
(Black+White)
0
50
100
150
200
250
300
350
0 73 145 218 290 363 435
Fre
qu
en
cy
Cortisol (ng/mg)
0
20
40
60
80
-3 -2 0 1 3 4 6
Fre
qu
en
cy
Ln- Cortisol (ng/mg)
http://www.candlestudy.org http://www.theurbanchildinstitute.org http://www.uthsc.edu/
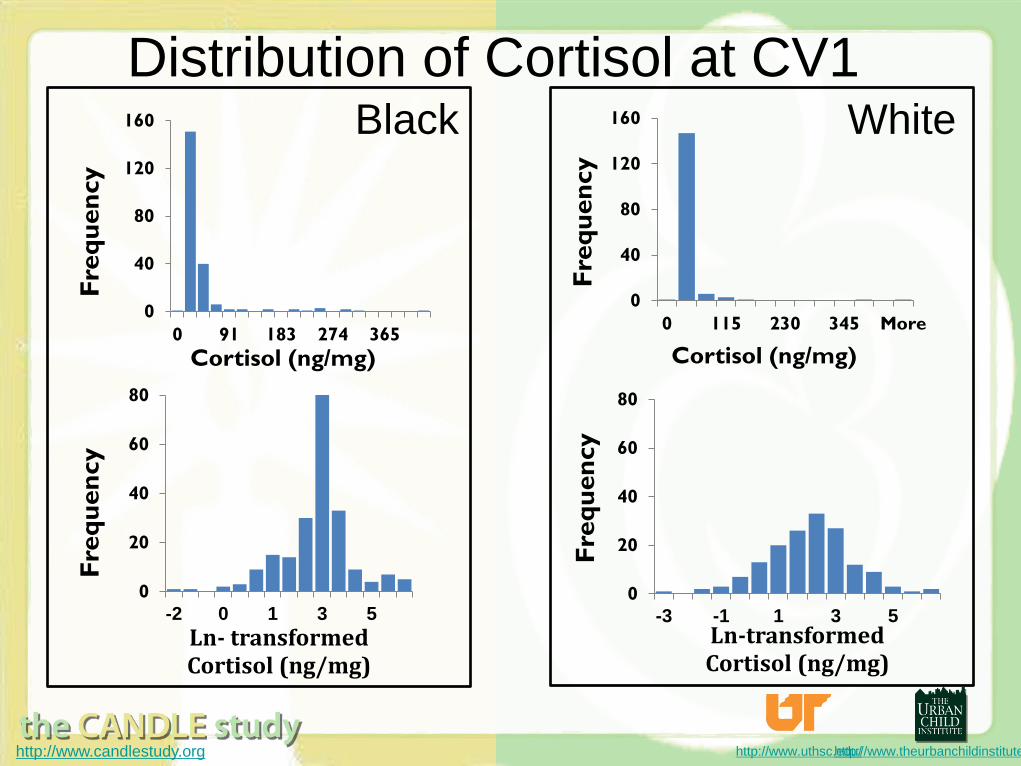
Distribution of Cortisol at CV1
0
40
80
120
160
0 91 183 274 365
Fre
qu
en
cy
Cortisol (ng/mg)
0
20
40
60
80
-2 0 1 3 5
Fre
qu
en
cy
Ln- transformed Cortisol (ng/mg)
Black
0
40
80
120
160
0 115 230 345 More
Fre
qu
en
cy
Cortisol (ng/mg)
0
20
40
60
80
-3 -1 1 3 5
Fre
qu
en
cy
Ln-transformed Cortisol (ng/mg)
White
http://www.candlestudy.org http://www.theurbanchildinstitute.org http://www.uthsc.edu/
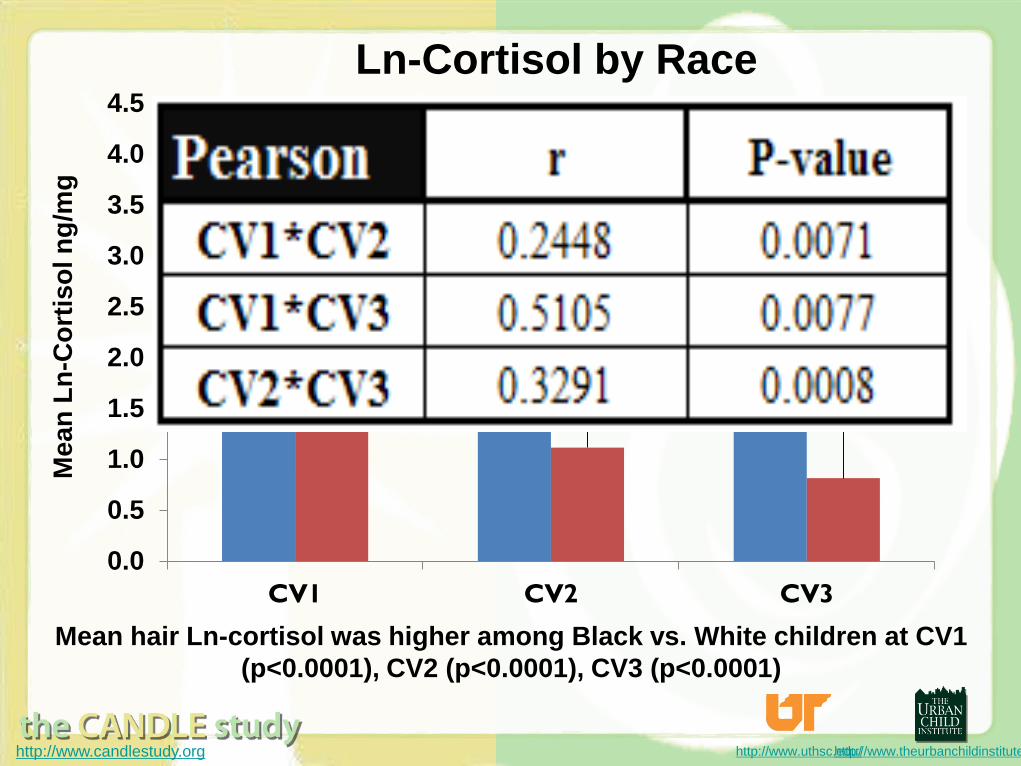
0.0
0.5
1.0
1.5
2.0
2.5
3.0
3.5
4.0
4.5
CV1 CV2 CV3
Mean
Ln
-Co
rtis
ol n
g/m
g
Ln-Cortisol by Race
Black White
Mean hair Ln-cortisol was higher among Black vs. White children at CV1
(p<0.0001), CV2 (p<0.0001), CV3 (p<0.0001)
http://www.candlestudy.org http://www.theurbanchildinstitute.org http://www.uthsc.edu/
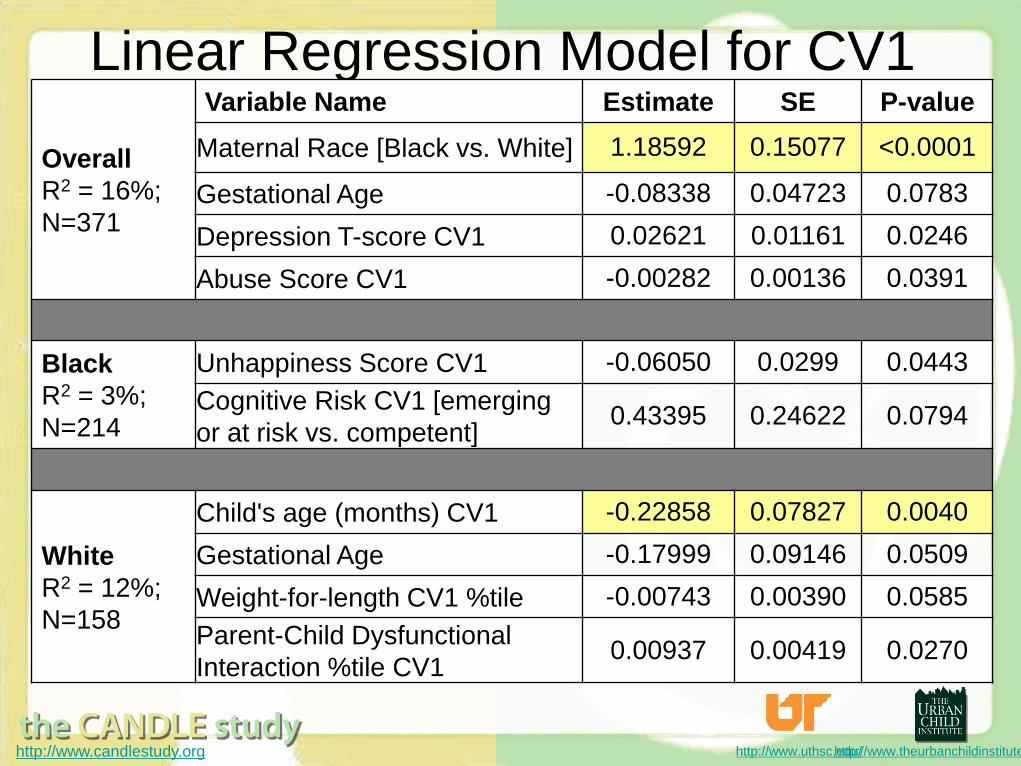
Linear Regression Model for CV1
Overall
R2 = 16%;
N=371
Variable Name Estimate SE P-value
Maternal Race [Black vs. White] 1.18592 0.15077 <0.0001
Gestational Age -0.08338 0.04723 0.0783
Depression T-score CV1 0.02621 0.01161 0.0246
Abuse Score CV1 -0.00282 0.00136 0.0391
Black
R2 = 3%;
N=214
Unhappiness Score CV1 -0.06050 0.0299 0.0443
Cognitive Risk CV1 [emerging
or at risk vs. competent] 0.43395 0.24622 0.0794
White
R2 = 12%;
N=158
Child's age (months) CV1 -0.22858 0.07827 0.0040
Gestational Age -0.17999 0.09146 0.0509
Weight-for-length CV1 %tile -0.00743 0.00390 0.0585
Parent-Child Dysfunctional
Interaction %tile CV1 0.00937 0.00419 0.0270
http://www.candlestudy.org http://www.theurbanchildinstitute.org http://www.uthsc.edu/
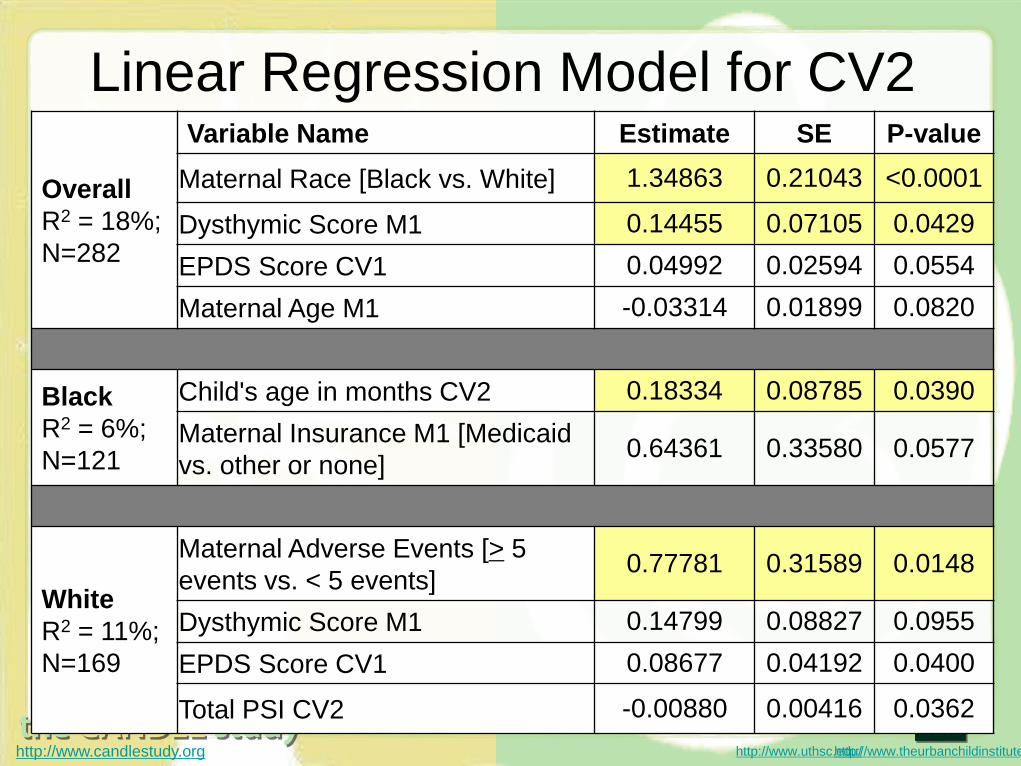
Linear Regression Model for CV2
Overall
R2 = 18%;
N=282
Variable Name Estimate SE P-value
Maternal Race [Black vs. White] 1.34863 0.21043 <0.0001
Dysthymic Score M1 0.14455 0.07105 0.0429
EPDS Score CV1 0.04992 0.02594 0.0554
Maternal Age M1 -0.03314 0.01899 0.0820
Black
R2 = 6%;
N=121
Child's age in months CV2 0.18334 0.08785 0.0390
Maternal Insurance M1 [Medicaid
vs. other or none] 0.64361 0.33580 0.0577
White
R2 = 11%;
N=169
Maternal Adverse Events [> 5
events vs. < 5 events] 0.77781 0.31589 0.0148
Dysthymic Score M1 0.14799 0.08827 0.0955
EPDS Score CV1 0.08677 0.04192 0.0400
Total PSI CV2 -0.00880 0.00416 0.0362

http://www.candlestudy.org http://www.theurbanchildinstitute.org http://www.uthsc.edu/
Linear Regression Model for CV3
Overall
R2 = 26%;
N=174
Variable Name Estimate SE P-value
Maternal Race [Black vs. White] 1.49429 0.20860 <0.0001
Birth weight-for-length %tile 0.00898 0.00390 0.0227
Anxiety T-score CV3 -0.02450 0.01220 0.0462
Black
R2 = 17%;
N=76
Maternal Adverse Child Events [Yes
vs. No] 0.60020 0.29057 0.0425
Depression T-score M2 -0.03430 0.01690 0.0461
Birth weight-for-length %tile 0.01300 0.00507 0.0125
White
R2 = 12%;
N=95
Total Parenting Stress %tile CV3 0.00849 0.00491 0.0873
Anxiety Tscore CV3 -0.06224 0.01766 0.0007
http://www.candlestudy.org http://www.theurbanchildinstitute.org http://www.uthsc.edu/
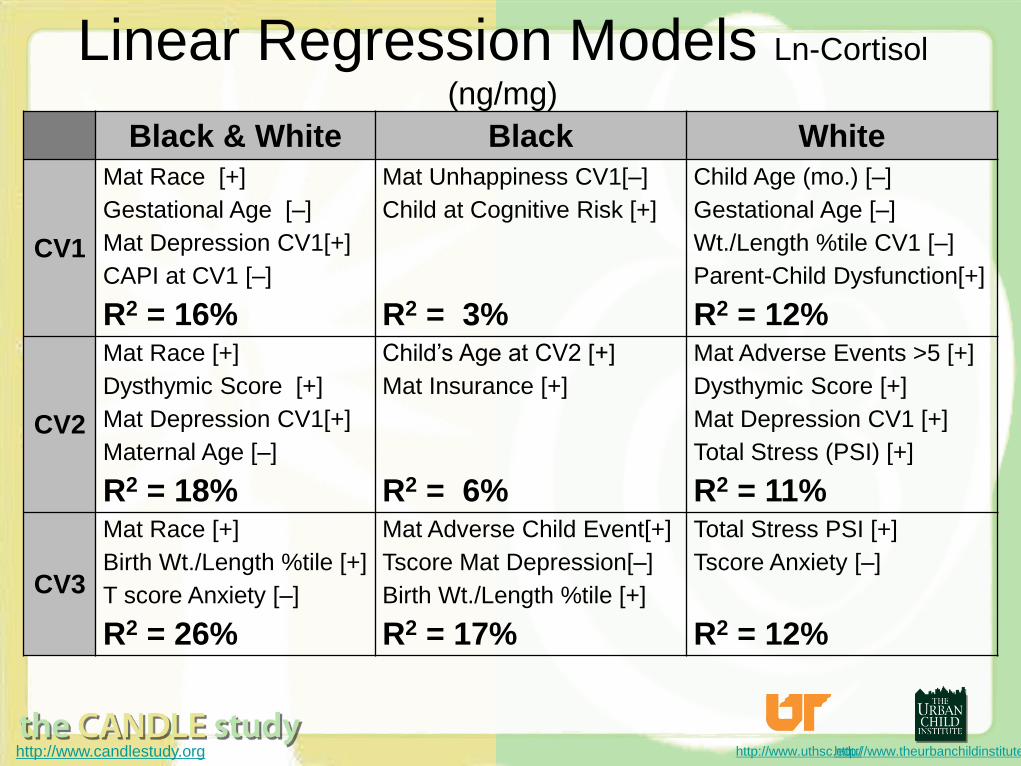
Linear Regression Models Ln-Cortisol
(ng/mg)
Black & White Black White
CV1
Mat Race [+]
Gestational Age [–]
Mat Depression CV1[+]
CAPI at CV1 [–]
R2 = 16%
Mat Unhappiness CV1[–]
Child at Cognitive Risk [+]
R2 = 3%
Child Age (mo.) [–]
Gestational Age [–]
Wt./Length %tile CV1 [–]
Parent-Child Dysfunction[+]
R2 = 12%
CV2
Mat Race [+]
Dysthymic Score [+]
Mat Depression CV1[+]
Maternal Age [–]
R2 = 18%
Child’s Age at CV2 [+]
Mat Insurance [+]
R2 = 6%
Mat Adverse Events >5 [+]
Dysthymic Score [+]
Mat Depression CV1 [+]
Total Stress (PSI) [+]
R2 = 11%
CV3
Mat Race [+]
Birth Wt./Length %tile [+]
T score Anxiety [–]
R2 = 26%
Mat Adverse Child Event[+]
Tscore Mat Depression[–]
Birth Wt./Length %tile [+]
R2 = 17%
Total Stress PSI [+]
Tscore Anxiety [–]
R2 = 12%
http://www.candlestudy.org http://www.theurbanchildinstitute.org http://www.uthsc.edu/
Conclusions The CANDLE birth cohort examines the impact of
early adversity on neurocognitive outcomes
Hair cortisol levels were significantly higher in Black
vs. White children suggesting dysregulation of the
HPA axis
Children having HPA axis dysregulation may be at
greater risk for poorer psychosocial, cognitive, and
clinical outcomes
Ongoing data collection and analyses will further
define the factors associated with toxic stress in
early life
Future research will include longitudinal analyses
when the CANDLE dataset is complete
http://www.candlestudy.org http://www.theurbanchildinstitute.org http://www.uthsc.edu/
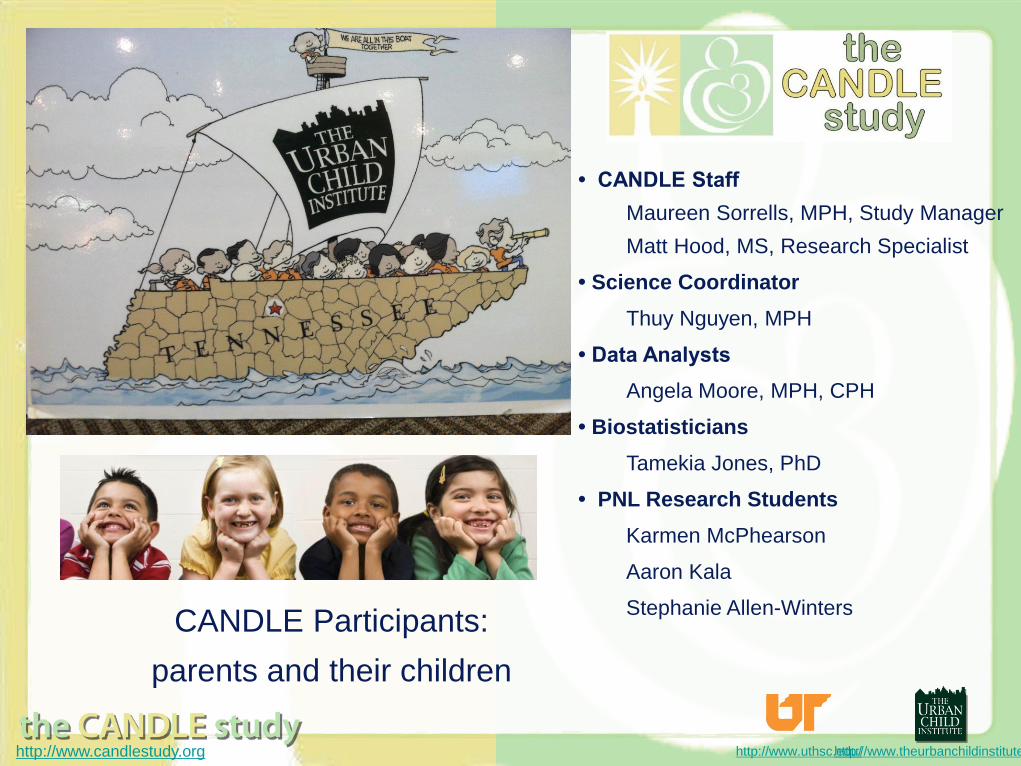
• CANDLE Staff
Maureen Sorrells, MPH, Study Manager
Matt Hood, MS, Research Specialist
• Science Coordinator
Thuy Nguyen, MPH
• Data Analysts
Angela Moore, MPH, CPH
• Biostatisticians
Tamekia Jones, PhD
• PNL Research Students
Karmen McPhearson
Aaron Kala
Stephanie Allen-Winters CANDLE Participants:
parents and their children

http://www.candlestudy.org http://www.theurbanchildinstitute.org http://www.uthsc.edu/
To describe my mother would be to write about a hurricane in its perfect
power. Maya Angelou
Mother love is the fuel that enables a normal human being to do the
impossible. Marion C. Garretty
When you feel neglected, think of the female salmon, who lays 3,000,000
eggs but no one remembers her on Mother's Day. Sam Ewing
Stress is nothing more than a socially acceptable form of mental illness.
Richard Carlson
If you ask what is the single most important key to longevity, I would have
to say it is avoiding worry, stress and tension. And if you didn’t ask me,
I’d still have to say it. George F. Burns
Poets, Humorists, Athletes, and
Celebrities: Stress Perspective
http://www.candlestudy.org http://www.theurbanchildinstitute.org http://www.uthsc.edu/
APPENDIX SLIDES
The following slides are for reference and additional information.
http://www.candlestudy.org http://www.theurbanchildinstitute.org http://www.uthsc.edu/
Statistical Approach
• Model selection
• Stepwise regression
• Results for outcome Ln Hair Cortisol
• CV1: Overall, Black, White
• CV2: Overall, Black, White
• CV3: Overall, Black, White

http://www.candlestudy.org http://www.theurbanchildinstitute.org http://www.uthsc.edu/
Limitations
• Single platform for our measurements of cortisol
• Alpo detection
• No normative data exists for cortisol levels

http://www.candlestudy.org http://www.theurbanchildinstitute.org http://www.uthsc.edu/
Assay Specificity (Cross-Reactivity)
Steroid
% Cross
Reactivity
State
Presence
in Hair
Protein
Cortisol 100 Adrenal produced steroid hormone Yes
Prednisolone 13.6 Prescription drug, synthetic
glucocorticoid
?
Corticosterone 7.6 Adrenal precursor to aldosterone ?
Deoxycorticosterone 7.2 Adrenal precursor to aldosterone ?
Progesterone 7.2 Adrenal produced steroid hormone ?
Cortisone 6.2 Adrenal produced steroid hormone Yes
Deoxycortisol 5.6 Steroid that can be oxygenated to
cortisol
?
Pednisone 5.6 Prescription drug, synthetic
glucocorticoid
?
Dexamethasone 1.6 Prescription drug, synthetic
glucocorticoid
?

http://www.candlestudy.org http://www.theurbanchildinstitute.org http://www.uthsc.edu/
Physiological Functions of Cortisol
• Blood pressure maintenance
• Calcium absorption and bone formation
• Anti-inflammatory activity
• Increasing gluconeogenesis (generation of
blood sugar)
• Aiding in fat, protein and carbohydrate
metabolism
• Increases under stress; therefore is a
biomarker of changes in the HPA axis
http://www.candlestudy.org http://www.theurbanchildinstitute.org http://www.uthsc.edu/
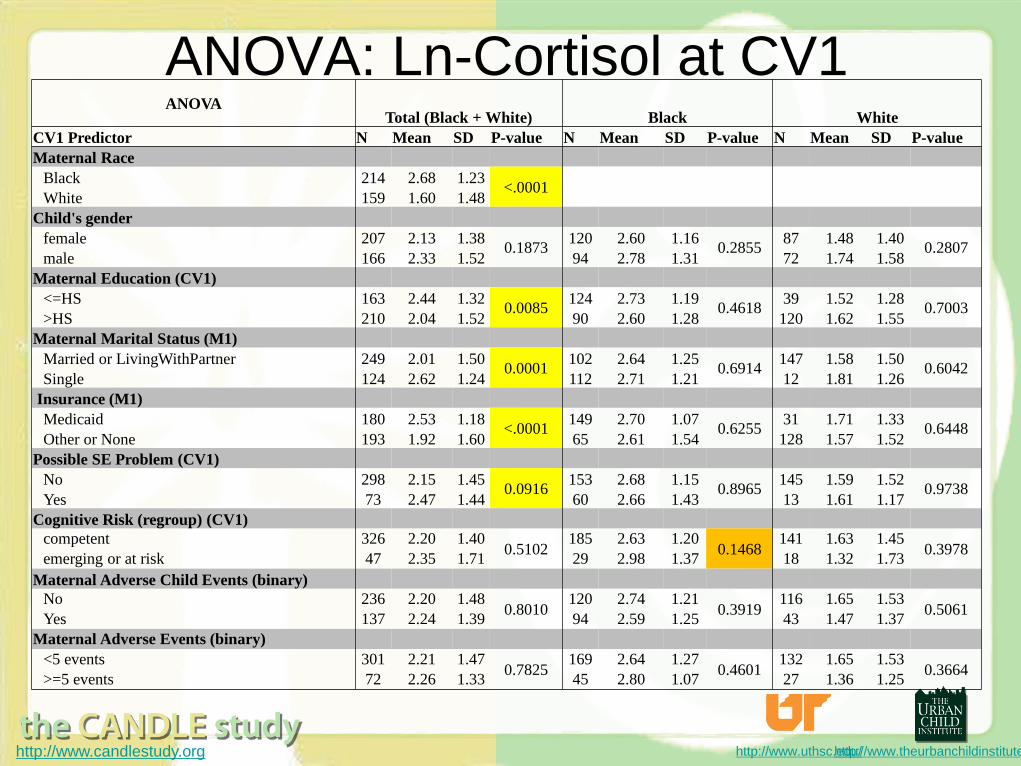
ANOVA Total (Black + White) Black White
CV1 Predictor N Mean SD P-value N Mean SD P-value N Mean SD P-value
Maternal Race
Black 214 2.68 1.23 <.0001
White 159 1.60 1.48
Child's gender
female 207 2.13 1.38 0.1873
120 2.60 1.16 0.2855
87 1.48 1.40 0.2807
male 166 2.33 1.52 94 2.78 1.31 72 1.74 1.58
Maternal Education (CV1)
<=HS 163 2.44 1.32 0.0085
124 2.73 1.19 0.4618
39 1.52 1.28 0.7003
>HS 210 2.04 1.52 90 2.60 1.28 120 1.62 1.55
Maternal Marital Status (M1)
Married or LivingWithPartner 249 2.01 1.50 0.0001
102 2.64 1.25 0.6914
147 1.58 1.50 0.6042
Single 124 2.62 1.24 112 2.71 1.21 12 1.81 1.26
Insurance (M1)
Medicaid 180 2.53 1.18 <.0001
149 2.70 1.07 0.6255
31 1.71 1.33 0.6448
Other or None 193 1.92 1.60 65 2.61 1.54 128 1.57 1.52
Possible SE Problem (CV1)
No 298 2.15 1.45 0.0916
153 2.68 1.15 0.8965
145 1.59 1.52 0.9738
Yes 73 2.47 1.44 60 2.66 1.43 13 1.61 1.17
Cognitive Risk (regroup) (CV1)
competent 326 2.20 1.40 0.5102
185 2.63 1.20 0.1468
141 1.63 1.45 0.3978
emerging or at risk 47 2.35 1.71 29 2.98 1.37 18 1.32 1.73
Maternal Adverse Child Events (binary)
No 236 2.20 1.48 0.8010
120 2.74 1.21 0.3919
116 1.65 1.53 0.5061
Yes 137 2.24 1.39 94 2.59 1.25 43 1.47 1.37
Maternal Adverse Events (binary)
<5 events 301 2.21 1.47 0.7825
169 2.64 1.27 0.4601
132 1.65 1.53 0.3664
>=5 events 72 2.26 1.33 45 2.80 1.07 27 1.36 1.25
ANOVA: Ln-Cortisol at CV1
http://www.candlestudy.org http://www.theurbanchildinstitute.org http://www.uthsc.edu/
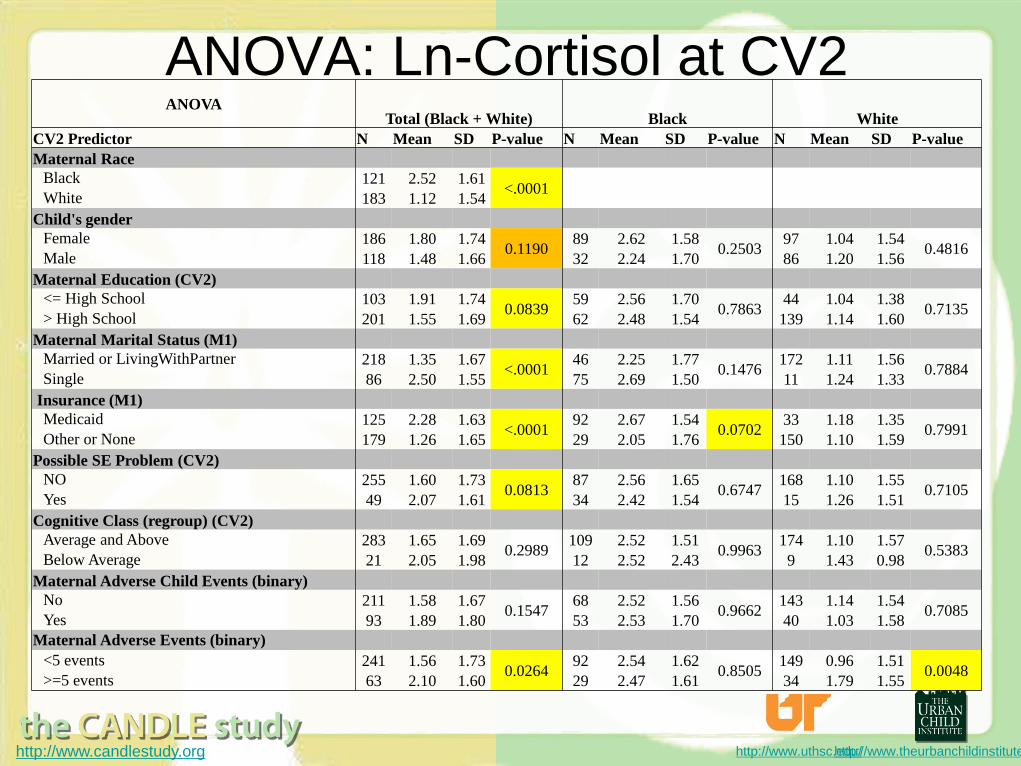
ANOVA: Ln-Cortisol at CV2 ANOVA
Total (Black + White) Black White
CV2 Predictor N Mean SD P-value N Mean SD P-value N Mean SD P-value
Maternal Race
Black 121 2.52 1.61 <.0001
White 183 1.12 1.54
Child's gender
Female 186 1.80 1.74 0.1190
89 2.62 1.58 0.2503
97 1.04 1.54 0.4816
Male 118 1.48 1.66 32 2.24 1.70 86 1.20 1.56
Maternal Education (CV2)
<= High School 103 1.91 1.74 0.0839
59 2.56 1.70 0.7863
44 1.04 1.38 0.7135
> High School 201 1.55 1.69 62 2.48 1.54 139 1.14 1.60
Maternal Marital Status (M1)
Married or LivingWithPartner 218 1.35 1.67 <.0001
46 2.25 1.77 0.1476
172 1.11 1.56 0.7884
Single 86 2.50 1.55 75 2.69 1.50 11 1.24 1.33
Insurance (M1)
Medicaid 125 2.28 1.63 <.0001
92 2.67 1.54 0.0702
33 1.18 1.35 0.7991
Other or None 179 1.26 1.65 29 2.05 1.76 150 1.10 1.59
Possible SE Problem (CV2)
NO 255 1.60 1.73 0.0813
87 2.56 1.65 0.6747
168 1.10 1.55 0.7105
Yes 49 2.07 1.61 34 2.42 1.54 15 1.26 1.51
Cognitive Class (regroup) (CV2)
Average and Above 283 1.65 1.69 0.2989
109 2.52 1.51 0.9963
174 1.10 1.57 0.5383
Below Average 21 2.05 1.98 12 2.52 2.43 9 1.43 0.98
Maternal Adverse Child Events (binary)
No 211 1.58 1.67 0.1547
68 2.52 1.56 0.9662
143 1.14 1.54 0.7085
Yes 93 1.89 1.80 53 2.53 1.70 40 1.03 1.58
Maternal Adverse Events (binary)
<5 events 241 1.56 1.73 0.0264
92 2.54 1.62 0.8505
149 0.96 1.51 0.0048
>=5 events 63 2.10 1.60 29 2.47 1.61 34 1.79 1.55
http://www.candlestudy.org http://www.theurbanchildinstitute.org http://www.uthsc.edu/
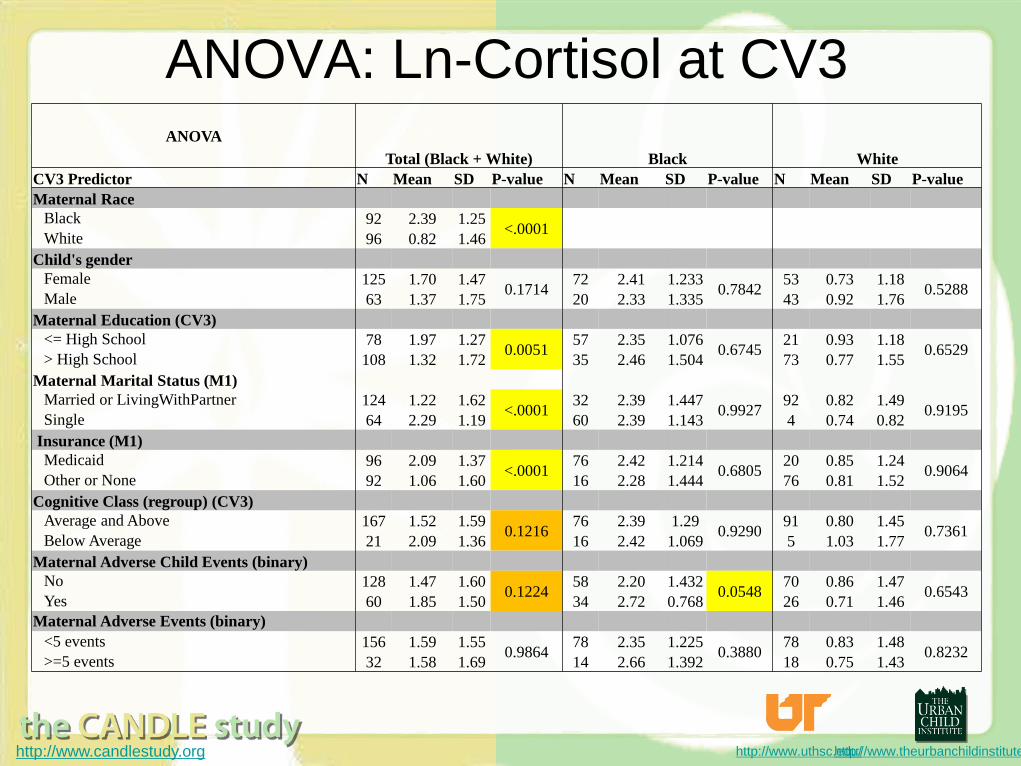
ANOVA: Ln-Cortisol at CV3 ANOVA
Total (Black + White) Black White
CV3 Predictor N Mean SD P-value N Mean SD P-value N Mean SD P-value
Maternal Race
Black 92 2.39 1.25 <.0001
White 96 0.82 1.46
Child's gender
Female 125 1.70 1.47 0.1714
72 2.41 1.233 0.7842
53 0.73 1.18 0.5288
Male 63 1.37 1.75 20 2.33 1.335 43 0.92 1.76
Maternal Education (CV3)
<= High School 78 1.97 1.27 0.0051
57 2.35 1.076 0.6745
21 0.93 1.18 0.6529
> High School 108 1.32 1.72 35 2.46 1.504 73 0.77 1.55
Maternal Marital Status (M1)
Married or LivingWithPartner 124 1.22 1.62 <.0001
32 2.39 1.447 0.9927
92 0.82 1.49 0.9195
Single 64 2.29 1.19 60 2.39 1.143 4 0.74 0.82
Insurance (M1)
Medicaid 96 2.09 1.37 <.0001
76 2.42 1.214 0.6805
20 0.85 1.24 0.9064
Other or None 92 1.06 1.60 16 2.28 1.444 76 0.81 1.52
Cognitive Class (regroup) (CV3)
Average and Above 167 1.52 1.59 0.1216
76 2.39 1.29 0.9290
91 0.80 1.45 0.7361
Below Average 21 2.09 1.36 16 2.42 1.069 5 1.03 1.77
Maternal Adverse Child Events (binary)
No 128 1.47 1.60 0.1224
58 2.20 1.432 0.0548
70 0.86 1.47 0.6543
Yes 60 1.85 1.50 34 2.72 0.768 26 0.71 1.46
Maternal Adverse Events (binary)
<5 events 156 1.59 1.55 0.9864
78 2.35 1.225 0.3880
78 0.83 1.48 0.8232
>=5 events 32 1.58 1.69 14 2.66 1.392 18 0.75 1.43


![Spectrex Brochure.pdf · 2006-07-27 · cei n a i an a ^ [b[l] Z a hrh aZ ^ j| x[n k \ ] \ c l h Z] l Zebjc3Z [c l"c deZ `a"h]bjX3^ a • ^ c~"T e` i kjSa ^ 8 _X a\ Z i a "h c3\ hr](https://img.pdfslide.net/doc/110x75/5f0deba17e708231d43cbc12/brochurepdf-2006-07-27-cei-n-a-i-an-a-bl-z-a-hrh-az-j-xn-k-c.jpg)