Embed Size (px)
Citation preview
MOLECULAR PROBES FOR STUDYING HEME TOXICITY AND
TOLERANCE IN GRAM POSITIVE PATHOGENS
By
Laura Anzaldi Mike
Dissertation
Submitted to the Faculty of the
Graduate School of Vanderbilt University
in partial fulfillment of the requirements
for the degree of
DOCTOR OF PHILOSOPHY
in
Microbiology and Immunology
December, 2013
Nashville, Tennessee
Approved: Date:
__Eric P. Skaar____________________________________ __08/29/13__________
__D. Borden Lacy_____________________________________ __08/29/13__________
__Timothy L. Cover___________________________________ __08/29/13__________
__David W. Wright____________________________________ __08/29/13__________
__Gary A. Sulikowski__________________________________ __08/29/13__________

ii
To Chris,
my beloved husband and best friend

iii
ACKNOWLEDGMENTS
More than anything, I would like to first acknowledge my mentor, Dr. Eric Skaar. He is
an example of what a mentor should be. He has taught me how to think and write and work as a
scientist. He has been exceptionally encouraging and supportive of my ideas and endeavors both
in and out of the lab, as well as a source of great advice. He provides a contagious source of
energy and enthusiasm to the laboratory, which has produced a fun and exciting training
environment.
Next, I would like to thank each of the members of the Skaar lab, past and present, who
have mentored me, made school a joy, and been great friends. This includes: Dr. Devin Stauff,
Dr. Michelle Reniere, Amanda McCoy, Sheg Aranmolate, Dr. Indriati Hood, Keith Adams, Dr.
Ahmed Attia, Susan Dickey, Dr. Thomas Kehl-Fie, Kathryn Haley, Dr. Neal Hammer, Amanda
Hirsch, Lorenzo Olive, Dr. Allison Farrand, Dr. Catherine Wakeman, Kyle Becker, Jessica
Moore Hooten, Ben Gu, Dr. Jim Cassat, Dr. Brittany Mortensen, Julie Lemen, Matt Surdel, Dr.
Mike Noto, Shawn Albert, Lillian Johnson, and Lisa Lojek. Devin (DLS), Sheg (OA), Thomas
(TKF), Lorenzo (LQO), and Jessica (JMH) have all contributed to work presented here and I have
acknowledged their contributions throughout my thesis with their initials. I would like to thank
Amanda McCoy for generating the Skaar lab transposon library. I would also like to thank
Kathryn Haley, who generously shared purified IsdG for use as a protein standard. I would also
like to thank a former rotation student, Shawn Barton, for his work transducing SaeRS-regulated
genes into S. aureus strain Newman. I would like to thank Jim Cassat who has also worked on the
‘882 project, although none of our work together made it into my dissertation. Finally I would
like to thank my running buddy Brittany for being a consistent source of joy and consolation.
I would be amiss not to recognize the indelible mark Devin has made on my training and
research. Devin’s hard work and diligence during his graduate work formed the foundation for
what I have described here. Beyond that, Devin patiently taught me many of my bench skills.

iv
Most people who know Devin recognize that he is not only intelligent, but also an excellent
teacher and mentor. That is exemplified by the fact that as a professor at Grove City College, his
own undergraduate trainees have directly contributed to work described here. Devin and two of
his students, Jacob Choby (JC) and Paul Brinkman (PB), have been critical to the success of the
B. anthracis project.
Working in the field of chemical biology is a highly interdisciplinary field and as such I
have had the good fortune to have great collaborators. Dr. Friedrich Götz shared his hemB::ermC
strain. Daniel Dorset and the Vanderiblt HTS facility guided our high-throughput screening
efforts. Xenogen shared the pXen-1 plasmid with us. Dr. Carrie Jones and her lab assisted with
the formulation of our compounds for use in mice. Dr. Brian Hachey and M. Lisa Manier in the
Mass Spectrometry Resource Core assisted with the HPLC-MS quantitation. Nicholas Vitko
(NPV) and Dr. Anthony Richardson from UNC-Chapel Hill contributed to our studies on central
metabolism. Sarah Sullivan (SS) and Dr. Jennifer DuBois performed direct quantification of
heme by MS. Dr. Chia Lee kindly shared S. aureus strain Newman ΔsaeRS and saeS::P18L. Dr.
Taeok ‘Ted’ Bae shared anti-SaeQ antibodies. I would like to thank Dr. Maria Hadjifrangiskou
for sharing purified QseB and Dr. Suzanne Walker for sharing targocil. Finally, I would like to
thank Dr. Paul Dunman for his help with S. aureus microarrays.
Dr. Gary Sulikowski and two of his lab members, Brendan Dutter (BFD) and Dr. Paul
Reid deserve special recognition. I have collaborated very closely with Dr. Sulikowski and first
Paul, then Brendan. Without their help this thesis would have never come to fruition. They have
developed all of the synthetic chemistry involved in this project as well as contributed
intellectually to the project. I have benefited greatly from having Dr. Sulikowski as a mentor and
a member of my committee.
Other professors who have been kind enough to serve on my committee include my chair,
Dr. Borden Lacy, Dr. Timothy Cover, Dr. David Wright and Dr. Eric Skaar. I thank each of them
for the time they have taken to provide guidance and advice. From the former Microbiology &

v
Immunology department I would like to thank our former chair Dr. Jacek Hawiger for his
dedication to training young scientists, our former education coordinator Jean Teadwell, and
Mark Hughes for his help surrounding travel. From the new Department of Pathology,
Microbiology & Immunology I would like to thank our chair Dr. Sam Santoro for his support,
Matt Bruckse for his assistance regarding meeting attendance, and the graduate education office,
especially Lorie Franklin and Audrey Patrick. My graduate education has also been enriched by
training opportunities through the Vanderbilt Institute for Chemical Biology (VICB). I would like
to specifically thank Dr. Michelle Sulikowski and Amanda Renick for their support. I would also
like to thank the Biomedical Research Education & Training (BRET) office for their assistance,
especially Dr. Lindsay Meyers, Dr. Michelle Grundy, Dr. Jim Patton, and Dr. Roger Chalkley.
I was supported by the Immunobiology of Blood and Vascular Systems training grant
from the NIAID, NIH grant T32 HL069765. This work was supported by the Searle Scholars
Program, NIH grant U54 AI057157-06 from Southeastern Regional Center of Excellence for
Emerging Infections and Biodefense, the Burroughs Wellcome Fund, and NIH AI069233 and
AI073843. The HTS was supported by a pilot grant from the VICB.
To my friends in Nashville and elsewhere, who have encouraged me and shown me love
– thank you. Most of all, I want to thank my family for supporting me throughout all of my
education. My parents have always done their best to encourage my academic pursuits and I
would not be here today without their love and support. I thank my husband Chris for patiently
standing by my side for these five years. Thank you for all the sacrifices you have made to help
me get my degree. I am blessed to have you as my husband.

vi
TABLE OF CONTENTS
Page
DEDICATION ................................................................................................................................. ii
ACKNOWLEDGMENTS .............................................................................................................. iii
LIST OF TABLES ........................................................................................................................ viii
LIST OF FIGURES ........................................................................................................................ ix
LIST OF ABBREVIATIONS ......................................................................................................... xi
Chapter
I. INTRODUCTION ........................................................................................................................ 1
Staphylococcus aureus and Bacillus anthracis are important human pathogens ...................................................................................................................... 1 Iron is an essential nutrient for pathogens .................................................................... 2 Heme is both an iron source and a toxic liability to bacteria ....................................... 2 S. aureus and B. anthracis sense heme to alleviate its toxicity .................................... 3 Heme sensing is conserved across Gram positive pathogens ....................................... 4 The ability to resist heme toxicity is important in pathogenesis .................................. 7 A chemical genetics approach for studying bacterial signal transduction .................... 7
II. MECHANISM OF HssRS ACTIVATION BY SMALL MOLECULE VU0038882 ................ 9
Introduction .................................................................................................................. 9 Methods ...................................................................................................................... 12 Results ........................................................................................................................ 17 A high-throughput screen identifies activators of HssRS ..................................... 17 ‘882 stimulates heme biosynthesis to activate HssRS ........................................... 18 ‘882 diminishes fermentative activity of S. aureus ............................................... 22 The metabolic state of the cell impacts heme biosynthesis ................................... 28 Discussion .................................................................................................................. 28
III. THERAPEUTIC POTENTIAL OF ‘882 FOR THE TREATMENT OF PERSISTENT INFECTIONS .................................................................................................. 33
Introduction ................................................................................................................ 33 Methods ...................................................................................................................... 35 Results ........................................................................................................................ 38 ‘882 is bacteriostatic to fermenting S. aureus ....................................................... 38 ‘882 prevents the evolution of antibiotic resistance .............................................. 39 ‘882 enhances innate immune function ................................................................. 42 A derivative of ‘882 reduces S. aureus pathogenesis in vivo ................................ 42 Discussion .................................................................................................................. 47
vii
IV. A CHEMICAL GENETICS APPROACH FOR DISSECTING THE MECHANISM OF ‘882-MEDIATED ANTIMICROBIAL ACTIVITY ......................................................... 49
Introduction ................................................................................................................ 49 Methods ...................................................................................................................... 50 Results ........................................................................................................................ 54 ‘882-resistant colonies are isolated under anaerobiosis ........................................ 54 ‘882-resistance isolates have genetic lesions in the sae operon ............................ 56 SaePQRS is functionally inactivated in ‘882-resistant mutants ............................ 58 Newman SaeS is necessary for ‘882 toxicity ........................................................ 58 ‘882 and oxygen impact SaeQ abundance ............................................................. 62 Genes differentially regulated by SaePQRS under anaerobiosis ........................... 64 Discussion .................................................................................................................. 70
V. PROBING A BACILLUS ANTHRACIS SIGNALING NETWORK WITH VU0120205 ........ 73
Introduction ................................................................................................................ 73 Methods ...................................................................................................................... 75 Results ........................................................................................................................ 80 Compound VU0120205 (‘205) activates the phrt direct repeat independent of HssR ............................................................................................. 80 Compound ‘205 activation of p14 and phrt is mediated through BAS1816-17 .... 82 The direct repeat determines the response of each promoter region ..................... 85 Cross-talk at the response regulator-direct repeat level is limited ......................... 87 BAS1816-17 is a two-component system that cross-phosphorylates with HssRS .................................................................................................................... 88 The hierarchy of HssS and BAS1817 phosphotransfer to each response regulator ................................................................................................................ 92 Selective cross-talk at the histidine kinase-response regulator level in vivo ......... 92 The identification of BAS1816-17 activators ........................................................ 96 Discussion .................................................................................................................. 99
VI. SUMMARY ........................................................................................................................... 104
Conclusions .............................................................................................................. 104 Future directions ....................................................................................................... 109 Elaborate the mechanisms by which heme homeostasis and energy metabolism are coordinated ................................................................................. 109 Identify the source of ‘882 toxicity ..................................................................... 110 Define the native function of BAS1816-17 ......................................................... 111
APPENDIX .................................................................................................................................. 113 List of Publications ................................................................................................................ 113
REFERENCES ............................................................................................................................ 114
viii
LIST OF TABLES
Table Page
1. Transposon mutants less sensitive to ‘882 ............................................................................. 25 2. Transcripts regulated by SaeRS under anaerobiosis and ‘882 treatment ............................... 66

ix
LIST OF FIGURES
Figure Page
1. The HssRS two-component signaling system .......................................................................... 5 2. A schematic of central metabolism in S. aureus .................................................................... 11 3. A high-throughput screen identifies small molecule activators of HssRS ............................. 19 4. HssRS activation by ‘882 requires HssS residues for heme sensing and endogenous heme biosynthesis .................................................................................................................. 20 5. ‘882 treatment stimulates endogenous heme biosynthesis ..................................................... 23 6. ‘882 pre-adapts other Gram positive bacteria for heme toxicity ............................................ 24 7. ‘882 diminishes fermentative activity .................................................................................... 27 8. Glycolytic activity regulates heme biosynthesis .................................................................... 29 9. ‘882 inhibits fermenting S. aureus ......................................................................................... 40 10. Co-treatment of S. aureus with ‘882 and gentamicin prevents the outgrowth of antibiotic resistant isolates ..................................................................................................... 41 11. ‘882 enhances S. aureus susceptibility to neutrophil killing mechanisms ............................. 43 12. ‘373 exhibits effects similar to ‘882 ...................................................................................... 44 13. ‘373 reduces S. aureus pathogenesis in vivo .......................................................................... 46 14. ‘882-resistance is heritable and stable ................................................................................... 55 15. Genetic lesions present in ‘882-resistant isolates .................................................................. 57 16. ‘882-resistant isolates have a loss in SaePQRS activity ........................................................ 59 17. Newman SaeS is necessary for ‘882 toxicity ......................................................................... 61 18. Oxygen and ‘882 impact SaeQ abundance ............................................................................ 63

x
19. ‘205 activates the B. anthracis hrt promoter through two pathways that depend on the direct repeat ...................................................................................................................... 81 20. BAS1816-17 activates both the BAS1814 and hrt promoters while HssRS activates just the hrt promoter ............................................................................................................... 84 21. The direct repeat in each promoter determines specificity in vivo ......................................... 86 22. Cross-signaling at the response regulator-direct repeat level ................................................ 89 23. BAS1816-17 and HssRS are two-component systems that cross-phosphorylate .................. 91 24. Each histidine kinase preferentially phosphorylates its cognate response regulator in vitro .................................................................................................................................... 93 25. Cross-signaling at the histidine kinase-response regulator level ........................................... 95 26. Five novel activators of BAS1816-17 .................................................................................... 98 27. A summary of cross-talk observed between HssRS and BAS1816-17 in B. anthracis ....... 100

xi
LIST OF ABBREVIATIONS
ATP ........................... adenosine triphosphate
CF............................................ cystic fibrosis
CFU ................................colony forming unit
DR .............................................. direct repeat
heme .......................... ferriprotoporphyrin IX
HK ........................................ histidine kinase
Hrt ....................... heme regulated transporter
Hss .................................heme sensor system
HTS .......................... high-throughput screen
IP ............................................ intraperitoneal
Isd........... iron-regulated surface determinant
KCN ................................. potassium cyanide
MK ........................................... menaquinone
MS .................................... mass spectrometry
NARSA ............... Network on Antimicrobial Resistance in S. aureus
NFDM ................................. non-fat dry milk
OD600 ..................... optical density at 600 nm
PBS....................... phosphate buffered saline
pmf .................................proton motive force
PMN ............. polymorphonuclear leukocytes
PPIX ................................. protoporphyrin IX
RR .................................... response regulator
SAR ................ structure-activity relationship
SCV ............................... small colony variant
SNP ............ single nucleotide polymorphism
TBS ................................. tris buffered saline
TCS .......................... two-component system
VANTAGE ............ Vanderbilt Technologies for Advanced Genomics
VICB ........................ Vanderbilt Institute for Chemical Biology
WT .................................................. wildtype

1
CHAPTER I
INTRODUCTION
Staphylococcus aureus and Bacillus anthracis are important human pathogens.
Staphylococcus aureus is a Gram positive commensal organism that inhabits the anterior
nares of 30% of the population (27). While colonization of the nares is relatively harmless, once
S. aureus crosses the host epithelium it is capable of infecting nearly any host tissue. The
morbidity and mortality associated with S. aureus infections are high and treatment is often
challenging as S. aureus is constantly developing resistance to antibiotics. The ubiquitous
presence of S. aureus in the human population, its ability to infect nearly any human tissue, and
the increasing incidence of hospital-acquired and community-acquired multi-drug resistant S.
aureus (MRSA) infections are reasons for alarm and highlight the necessity for identifying novel
therapeutic targets to combat this pathogen.
Bacillus anthracis and S. aureus both belong to the Bacillales order of the Firmicutes.
Among many differences from S. aureus, B. anthracis forms spores and primarily causes disease
in livestock. Infection of humans with B. anthracis spores by either ingestion or inhalation is
often associated with septicemia. Once the spores enter the blood, they germinate to vegetative
cells which divide rapidly and at the time of death may account for 30% of a human’s blood
weight (21). The resiliency of and the mortality associated with B. anthracis spores makes the
bacterium a potential bioweapon, as evidenced by the 2001 attacks sent through the US postal
service. As such, a great deal of biodefense research has focused on anthrax pathogenesis, which
is important for developing vaccines and treatments to protect humans from this biological threat.
B. anthracis and S. aureus are both pathogens that pose a significant threat to public
health. Infections by either of these bacteria consist of a significant blood-component suggesting
that they have intimate interactions with host leukocytes and erythrocytes. Defining how these

2
pathogens adapt to the host environment, particularly the blood, is imperative for advancing the
methods by which we treat these aggressive infections.
Iron is an essential nutrient for pathogens.
Iron is a transition element with a high redox potential. This makes it a valuable cofactor
for enzymes involved in protecting bacteria from host defenses, DNA replication, and respiration.
Since iron is intimately involved in basic physiological processes, almost all pathogens require
iron to successfully infect their hosts (96). At physiological pH, however, ferric iron is highly
insoluble. Coordinating iron within a tetrapyrrole ring as ferriprotoporphyrin IX (heme)
solubilizes iron and enhances its catalytic ability by 5 to 10 orders of magnitude (9). This
catalytic activity is harnessed by hemoproteins involved in oxygenation reactions, oxidative stress
responses, electron transport, oxygen transport, oxygen sensing, and oxygen storage. Both S.
aureus and B. anthracis have the machinery to synthesize endogenous heme from glutamyl-
tRNAGlu (57). While endogenous heme biosynthesis allows pathogens to solubilize, store, and
augment the utility of iron, exogenous iron is still required for heme biosynthesis. In the
vertebrate host, a major source of iron is in the form of heme bound to host hemoglobin in
erythrocytes in the blood, a site accessed by both S. aureus and B. anthracis. Little is known
about the dynamics between endogenously synthesized and exogenously acquired heme during
bacterial pathogenesis. Data presented in Chapter II increase our understanding of the
mechanisms by which S. aureus regulates endogenous heme biosynthesis.
Heme is both an iron source and a toxic liability to bacteria.
Since heme is the most abundant iron source in the vertebrate host and a valuable
nutrient, bacterial pathogens have many systems for acquiring host heme. Both S. aureus and B.
anthracis utilize the iron-regulated surface determinant (Isd) system to acquire heme-iron during
infection (67). Once heme enters the cytoplasm it is degraded by IsdG family heme oxygenases to

3
staphylobilin and free iron (68). In iron-replete conditions, however, heme is no longer degraded.
Instead, it is trafficked to the cell membrane where it is most likely used as a cofactor in proteins
involved in respiration (77). S. aureus and B. anthracis both dedicate significant efforts to
acquiring heme however too much heme is toxic to the bacteria (48, 83). While much is known
about the mechanisms of heme toxicity in eukaryotes, most are not applicable to bacteria (1). The
mechanisms by which heme is toxic to bacteria seem to be distinct from those in humans, yet they
remain ill-defined (1). Currently there exist two ideas for the mechanism of bacterial heme
toxicity. One suggests that DNA damage by heme is a source of toxicity to the cell, while the
other proposes that heme-menaquinone interactions generate a superoxide generating cycle that is
detrimental to S. aureus (44, 93). While identifying the source of heme toxicity is of great
interest, studies presented here focus primarily on the mechanisms by which S. aureus and B.
anthracis sense and alleviate heme toxicity.
S. aureus and B. anthracis sense heme to alleviate its toxicity.
Previous work revealed that pre-treating either S. aureus or B. anthracis with a sub-toxic
concentration of heme protects both bacteria from heme toxicity (90). This protection is mediated
by the two-component signaling (TCS) system, heme sensor system (HssRS) (Figure 1). In the
presence of heme the HssS histidine kinase (HK) is auto-phosphorylated at a conserved histidine
residue (Figure 1A) (83, 85). HssS then transfers this phosphate to an aspartic acid on its cognate
response regulator (RR) HssR (Figure 1B). This activates HssR and allows it to bind to a
conserved direct repeat (DR) in the promoter region upstream of the heme regulated transporter
(hrtAB) to initiate transcription (Figures 1C-D). HrtAB is an ABC transporter that alleviates heme
toxicity by a yet-to-be determined mechanism, most likely heme efflux (Figure 1E) (42). While
the signaling pathway responsible for protecting S. aureus and B. anthracis from heme toxicity
has been well-characterized, the ligand of HssS remains elusive. This is not uncommon for a

4
TCS, as less than 20 ligand-sensor pairs have been assigned for the over 20,000 predicted TCSs
(40).
Heme sensing is conserved across Gram positive pathogens.
Heme sensing systems are found in many bacteria and the hss/hrt system is evolutionarily
conserved across many Gram positive bacteria. This includes several pathogens such as
Staphylococcus epidermidis, Bacillus cereus, Listeria monocytogenes, Listeria inocua, and
Enterococcus faecalis (12, 84). The hss/hrt systems are generally found in either pathogenic or
saprophytic Gram positive bacteria. For example, hss/hrt systems are found in B. anthracis, B.
cereus, and B. thuringiensis, but not B. subtilis and B. licheniformis (83). In fact, B. subtilis and
B. licheniformis are both more sensitive to heme toxicity than any of the Bacilli that encode an
hss/hrt system. These observations suggest that the hss/hrt system is maintained by bacteria that
come in contact with host blood and that it might be used to signal to the bacteria that they have
entered their host.
Aside from the initial identification and characterization of HssRS and HrtAB in S.
aureus and B. anthracis, orthologous HrtAB systems have been most thoroughly described in
Lactococcus lactis and Streptococcus agalactiae (18, 42, 61, 82, 83, 85, 90). Neither of these
species synthesize their own heme and as such require exogenous heme to activate respiration
(17, 98). Although the function of HrtAB in each of these species is analogous to HrtAB in S.
aureus and B. anthracis, each species has its unique strategy for maintaining heme homeostasis.

5
Figure 1. The HssRS two-component signaling system. A. In the presence of heme the HssS histidine kinase autophosphorylates at a conserved histidine residue located on the intracellular domain. B. The phosphate is transferred from HssS to a conserved aspartic acid on its cognate response regulator HssR. C. HssR is activated and binds to a conserved direct repeat DNA sequence in the promoter region of hrtAB. D. This increases expression of the heme-regulated transporter HrtAB. E. HrtAB alleviates heme toxicity by a yet-to-be-determined mechanism.

6
S. agalactiae encodes orthologous HssRS and HrtAB systems (18). S. agalactiae HssRS
is stimulated by heme and results in high expression of hrtAB in the concentration range of 1 to
10 μM heme (18). Distinct from S. aureus and B. anthracis, S. agalactiae also encodes two other
dual heme and protoporphyrin IX (PPIX) efflux pumps, pefAB and pefCD (18). These two efflux
pumps are repressed by the MarR-superfamily repressor, PefR, at concentrations of less than 0.3
μM heme and 1 μM PPIX (18). The observation that pefAB and pefCD are activated at low heme
and PPIX concentrations, while hrtAB is activated at higher heme concentrations suggests that the
pef transporters are utilized to fine tune intracellular heme and PPIX levels while hrtAB is
employed to protect S. agalactiae from heme toxicity in heme-rich environments (18). The
differential activity of two heme-regulated transport systems highlights the delicate lifestyle S.
agalactiae strives to maintain in order to cope with the heme paradox (1).
L. lactis also encodes an orthologous hrtBA (ygfBA) that, when mutated, results in
increased sensitivity to heme toxicity (61). However, a corresponding HssRS TCS has not been
identified in this species. Instead, L. lactis encodes a unique TetR-family transcriptional regulator,
hrtR (ygfC), adjacent to hrtBA (42). HrtR binds heme, which alleviates HrtR repression of the
hrtRBA operon promoter and increases expression of HrtR and HrtAB at heme concentrations
ranging from 1 to 5 μM (42). Notably HrtR is also responsive to GaPPIX, but not most other
metalloporphyrins (42). In L. lactis ∆hrtRBA, over-expression of hrtBA results in reduced
accumulation of heme, suggesting that HrtAB is a heme efflux pump in L. lactis (42). Currently,
these results have not been confirmed in any other hrtAB encoding bacterial species.
These studies of heme homeostasis in other Gram positive bacteria highlight the unique
strategies bacteria employ in order to balance the energetic benefits of heme with its toxicity. This
underscores the importance of maintaining appropriate intracellular levels of heme in diverse
environments.
7
The ability to resist heme toxicity is important in pathogenesis.
TCSs are the primary way that bacteria adapt to environmental changes. Since heme is a
host molecule it is likely that HssRS is activated during infection. This hypothesis is supported by
the observation that the hrt promoter is transcriptionally active during B. anthracis infection (83).
Furthermore the importance of HssRS heme sensing during bacterial pathogenesis is highlighted
by the observation that BALB/c mice infected with S. aureus ∆hssR have significantly increased
bacterial burdens in the livers (90). Taken together, these results support that HssRS mediated
protection against heme toxicity during infection maintains the bacteria in a less virulent state. As
such, small molecule activators of HssRS may be viable therapeutics for treating patients with
aggressive S. aureus or B. anthracis infections.
A chemical genetics approach for studying bacterial signal transduction.
TCS signaling in response to host stresses is a critical aspect of bacterial adaptation to the
host and other environmental changes. Years of probing TCS activity and function using classical
genetic and biochemical techniques have provided insights into their biology. The scientific
community has now identified a small fraction of the ligand-sensor pairs and come to understand
some mechanisms by which TCS signaling purity is maintained; yet there are hints that bacterial
signaling transduction may be more complex than previously thought. In order to further the
field’s understanding of bacterial signaling networks, new strategies need to be employed. A
chemical genetics approach has been applied to HssRS and TCS biology here.
Chemical genetics is similar to classical genetics, but instead of using molecular
techniques to study gene function, small molecules are used instead. To illustrate this more
clearly, consider the example of identifying the genes required for protein secretion in S. aureus.
In forward genetics, a genome would be randomly mutagenized to create a library of mutants and
then that library would be screened for loss of protein secretion. Identifying the mutagenized gene
that results in that loss of protein secretion ascribes a role of that gene in the production of protein

8
secretion. However, what if the genes required for protein secretion are essential? Or, what if
multiple genes need to be disrupted to affect protein secretion? When combined with chemical
genetics, some of these limitations may be overcome. Continuing with the example from above,
the chemical genetics approach would screen a library of small molecules for effecting loss of
protein secretion in bacteria. By characterizing the activity of the small molecules at a cellular
level, other aspects of protein secretion may be elucidated.
A chemical genetics approach was undertaken to expand the current understanding of
heme homeostasis and signaling networks in S. aureus and B. anthracis and to complement
previous studies probing bacterial heme sensing by more classical approaches. The work
described here has developed two small molecule activators of HssRS into tools for studying
bacterial physiology and signal transduction and defines their potential use in perturbing bacterial
pathogenesis.

9
CHAPTER II
MECHANISM OF HssRS ACTIVATION BY SMALL MOLECULE VU0038882
Introduction
Staphylococcus aureus is a commensal organism that primarily colonizes the anterior
nares, as well as the skin (30). Upon breaching the epithelium of its host, S. aureus has the
potential to infect virtually any tissue. This adaptability reflects the capacity of S. aureus to sense
a variety of environmental signals and integrate them into its metabolic program enabling growth
in diverse host niches.
Upon entering the iron-poor environment of the vertebrate host, the cellular program to
import ferriprotoporphyrin IX (heme) from host hemoglobin into the cell is activated in order to
satisfy cellular iron and heme requirements (51). S. aureus may also synthesize heme
endogenously through the coordinated effort of enzymes encoded by the hemAXCDBL, hemEHY,
and hemN operons, although this process requires that iron and other building blocks be available
to the bacteria (33). The ability to exogenously acquire and endogenously synthesize heme allows
S. aureus to satisfy cellular iron and heme requirements in diverse environments. This strategy is
typical for most bacterial pathogens and reflects the integral role of heme in metabolism and
physiology; however, the distinct contributions of endogenous and exogenous heme to the
cellular physiology of bacteria are unknown.
Heme is a co-factor required for respiration. Furthermore, S. aureus respiration requires
that the bacteria either synthesize or assimilate the electron carrier menaquinone (MK) and that a
terminal electron acceptor be available. During respiration, reducing equivalents derived from the
oxidation of carbon sources are donated to MK. The shuttling of electrons by MK through the
electron transport chain generates a proton motive force (pmf) across the cytoplasmic membrane.
10
The energy stored in the pmf powers ATP synthesis and nutrient import. When heme, MK, or
terminal electron acceptors are absent, S. aureus captures energy through fermentation.
Fermentation employs substrate-level phosphorylation, which produces acid end products, to
generate ATP and maintain the redox balance of the cell. Figure 2 outlines central metabolism in
S. aureus.
Without heme, central metabolic pathways and enzymes cannot function; however,
excess heme is toxic due to its redox cycling properties (93). Prior exposure of S. aureus to
subinhibitory concentrations of heme increases heme tolerance (90). This adaptation is due to the
heme-induced increase in expression of HrtAB, an efflux pump that protects the bacteria from
heme toxicity. The increased expression of hrtAB is mediated by the heme sensor system (Hss)
two-component system (TCS). While the signaling pathway of HssRS has been previously
described, the mechanism of activation remains to be determined. Defining the mechanisms by
which HssRS is activated would reveal the signals that alert S. aureus to adapt to its host and
inform the rational design of new therapeutic strategies that could subvert S. aureus energy
homeostasis during infection.
In this study, the mechanism of HssS stimulation was probed by identifying small
molecule activators of HssS. The most potent compound, VU0038882 (‘882), activates HssRS by
inducing endogenous heme biosynthesis in S. aureus and leads to increased intracellular heme
levels. A transposon screen for ‘882-insensitive mutants revealed that perturbations in central
metabolism influence heme homeostasis. These studies have provided new insights into heme
homeostasis and HssRS activation in S. aureus and highlight the utility of ‘882 as a powerful
probe of bacterial physiology.

11
Figure 2. A schematic of central metabolism in S. aureus. Carbon sources such as glucose are brought into the cell and converted to pyruvate. During fermentation pyruvate is metabolized to acid end products such as lactate, ethanol, and acetate. The conversion of pyruvate to acid end products produces ATP and maintains the redox balance of the cell by regenerating NAD+. During respiration, pyruvate is shuttled into the TCA cycle. The conversion of pyruvate in the TCA cycle produces some ATP and many reducing equivalents in the form of NADH. The electrons from NADH are abstracted and shuttled through the electron transport chain by the electron carrier menaquinone. This transfer of electrons extrudes protons and generates a proton motive force (pmf). The pmf is harnessed by ATP synthase to produce more ATP for the cell. The cytochromes involved in electron transport require heme and menaquinone in order to successful shuttle electrons. Without heme or menaquinone, respiration does not occur.

12
Methods
Bacterial strains and growth conditions - Staphylococcus aureus strains Newman, ∆hssR, ∆hssS,
∆hssRS, ∆menB and ∆isdG have been described previously (16, 51, 83, 90, 93). S. aureus
hemB::ermC (∆hemB) has been described previously and was transduced into Newman using
bacteriophage Φ-85 (51, 92). The ∆pfkA deletion construct (pBT2-∆pfkA) was made by cloning
the flanking regions of the S. aureus pfkA gene (primers: pfkA-5.1A, pfkA-5.1B, pfkA-3.1A,
pfkA-3.1B) into the S. aureus/E. coli shuttle vector pBT2ts (53). This construct was then used to
make an in-frame deletion of the pfkA gene in the wildtype S. aureus Newman background as
previously described using TSB media without dextrose supplemented with 1% sodium pyruvate
(23). Corynebacterium diphtheriae strain HCL2 and Staphylococcus haemolyticus strain NRS9
were used.
All S. aureus strains were grown on tryptic soy agar (TSA) containing 10 µg/ml
chloramphenicol when appropriate and grown at 37°C for 20-30 h. All overnights were grown in
5 ml of tryptic soy broth (TSB) at 37°C with shaking at 180 rpm unless otherwise noted. Unless
stated otherwise, vehicle treatment refers to a volume of DMSO comparable to the volume added
containing the described compound (‘882).
Small molecule library screen with luciferase reporter - An overnight of Newman phrt.lux was
sub-cultured into 500 ml in a 1.5 L flask. The cells were grown for 1.5 h to an OD600 between
0.60–0.65. Seventy-five μl of culture were transferred into each well of a 384 well, flat-bottom
plate containing synthetic compounds that resulted in a final concentration of 6.7 μM. DMSO and
heme were used as negative and positive controls, respectively. The plates were incubated for 3 h.
Luminescence values were measured either using a Synergy HT Multi-Mode Microplate Reader
(Biotek, Inc.) or TopCount NXT™ Microplate Scintillation and Luminescence Counter
(PerkinElmer, Inc.). A compound was considered a hit if the raw luminescence value exceeded
the luminescence of cells grown in the presence of 81.25 nM heme.

13
XylE reporter assays - XylE assays were performed as described previously with modifications in
growth conditions (90). For the ΔhemB experiments, overnights were sub-cultured 1:50 into 0.5
ml of media for 4 h. For all other reporter assays, the bacteria were grown for 9 h and diluted
1:100 into 0.5 ml of media for 15 h.
Chemical libraries - The synthetic compounds were obtained from the Vanderbilt Institute of
Chemical Biology (VICB) collection, which is a high-diversity, synthetic small-molecule library
consisting of approximately 160,000 compounds. Select compounds were repurchased from
either ChemBridge or ChemDiv.
Growth curve analyses - Overnight cultures of Newman were diluted 1:100 into 100 μl of media.
Bacterial cells were incubated and the OD600 was measured at the specified time points. For all
staphylococcal adaptations, cultures were inoculated in 0.5 ml of TSB for 1 h at 37°C, 180 rpm
and sub-cultured 1:100 in 100 ul of media containing the indicated additive. Cultures were pre-
adapted overnight and analyzed as described above for a typical growth curve.
C. diphtheriae was inoculated into TSB containing vehicle, 5 µM heme, or 50 µM ‘882
and grown for 22-24 h. Cultures were diluted 1:50 into 5 ml of media containing 15 µM heme
and grown with shaking at 180 rpm and 37°C. CFUs were enumerated on TSA.
Transposon library generation and screen - A transposon library was generated using Tn917 (8).
The pTV1 transposition vector was transformed into S. aureus Newman and selected for on TSA
containing erythromycin (10 μg/ml) and chloramphenicol (10 μg/ml). Tn917 transposition was
induced on TSA-erythromycin (10 μg/ml) at 43°C for 24 h and mutants were screened for
chloramphenicol sensitivity and erythromycin resistance in TSB at 37°C. Transposon mutants
were arrayed in 96 well plates and stored at -80°C.
Mutants were revived in 150 μl of TSB and grown for 7 h before being sub-cultured 1 μl
into 100 μl of 40 μM ‘882 in TSB and incubated overnight. Cultures were diluted 1:100 into 100
μl of TSB containing 20 μM heme. Bacterial cells were incubated and the OD600 was measured at
5 h and 7 h. Mutants with an OD600 more than 2 standard deviations below the plate average were

14
isolated for single colonies on TSA-erythromycin (10 μg/ml) and confirmed in a second
adaptation in triplicate.
Transposon integration site identification - Transposon mutants were isolated on TSA-
erythromycin (10 µg/ml) and grown overnight in TSB-erythromycin (10 µg/ml). Genomic DNA
was isolated from 4 ml of the overnight using a Wizard Genomic purification kit (Promega).
Genomic DNA (2 µg) was digested with DraI at 37°C overnight. DraI was heat inactivated and
200 µg of the digested DNA ligated at room temperature for 2 h. Ligated DNA (20 ng) was PCR
amplified using DLS479 and DLS480 (53). PCR products were treated with exonuclease I (NEB)
and SAP (Promega) according to the manufacturer’s instructions. PCR-amplified DNA was
column purified using a PCR Purification Kit (Qiagen) and sequenced using DLS493 or DLS494
(53). The sequence flanking the tn917 inverted repeat was used to interrogate the S. aureus
Newman genome sequence to determine the tn917 integration site. Some integration sites were
identified using previously published methods (2).
Metabolite detection - An overnight of Newman was diluted 1:100 in 125 ml of TSB containing
either vehicle or 40 µM ‘882. Each hour, 5 ml of culture were sampled and pelleted by
centrifugation at 3,200 x g. The pH of the supernatant was measured using a SevenEasy pH meter
(Mettler Toledo). Glucose and lactate concentrations were quantified according to the manual (r-
Biopharm) with the assays scaled to a final volume of 300 µl.
For the characterization of ΔpfkA, cultures were grown overnight at 37°C, in TSB+P (1%
sodium pyruvate), with shaking at 250 rpm. Cultures were diluted to an OD660 of 0.05 in 8 ml of
TSB+P and incubated at 37°C with shaking at 250 rpm (18x150 mm culture tube). Each hour,
350 µl of culture were sampled and analyzed for absorbance (OD660). Two-hundred µl were
pelleted at 16,000 x g for 1 min and the supernatants frozen at -20°C. Samples were thawed on
ice. The pH was measured using Sigma pH Tests Strips (P-3536) and glucose levels were
quantified using the R-Biopharm D-Glucose Kit (10 716 251 035).

15
Pyridine hemochromogen heme quantification assay - Bacteria were grown for 8 h. The cultures
were diluted 1:100 and grown aerobically for 15-17 h. Pellets were washed in 0.5 ml of 20 mM
K2HPO4/KH2PO4 (pH 7.6) and resuspended in 0.5 ml of 20 mM K2HPO4/KH2PO4 (pH 7.6)
containing 30 µg of lysostaphin and incubated at 37°C for 20 min. Each sample was lysed by
sonication and the protein concentration determined using a Pierce BCA Protein Assay Kit
according to the manual (Thermo Scientific). Heme was extracted by adding an equal volume of
0.4 M NaOH and 40% pyridine and quantified as previously described using an extinction
coefficient of 324 mM-1cm-1 (71).
Heme quantification by LC-MS - S. aureus was grown in 5 ml of TSB for 8 h and sub-cultured
1:250 into 300 ml of TSB containing DMSO or 40 μM ‘882. Cells were grown at 37°C, 200 rpm
for 15 h and CFUs were enumerated. Cells were pelleted at 10,500 x g for 15 min and the pellets
were washed in 30 ml of 20 mM potassium phosphate (pH 7.6). Cells were pelleted at 3,200 x g
for 20 min and the pellets were resuspended in 40 ml of TSM (100 mM Tris-HCl pH 7, 500 mM
sucrose, 10 mM MgCl2) containing 25 μg/ml lysostaphin. Cells walls were digested at 37°C for
20 min and the samples were pelleted at 10,500xg for 15 min. The protoplast pellets were flash
frozen in liquid N2, and maintained at -80°C. Protoplast pellets were weighed and thawed in 7 ml
of 0.1 M potassium phosphate buffer, pH 7. WT and ‘882-treated protoplast samples were
sonicated (3 s on, 2 s rest, 50% amplitude, Branson 4c-15) on ice: four 5 min rounds, 5 min rest.
The samples were then centrifuged for 50 min at 6,400 x g. The cleared lysates were syringe
filtered (0.45 m, Millipore) and diluted as needed to allow the measured extracted ion
chromatogram (EIC) peak area to fit on the standard curve.
Porphyrin standards were purchased from Frontier Scientific Inc. (Logan, UT).
Methanol, water, acetonitrile, DMSO, and formic acid solvents were all HPLC or Trace Metal
grade and were purchased from Fisher Scientific. Samples were stored in Supelco slit top 2 mL
vials prior to and during analysis (Fisher Scientific). These were stored at -20 ºC when not in use
and kept at 5 ºC while in the autosampler tray immediately prior to analysis.

16
uHPLC separations were carried out on a Dionex Ultimate 3000 uHPLC system using a
BDS Hypersil C18 column (150 x 2.1 mm) with a 2.4 μM particle size (Thermo-Scientific; cat #
28102-152130). Separations were performed at 2-4 kPa. Mass detection and analyte
quantification were carried out using a microTOF-Q11 electrospray ionization time-of-flight
quadrupole mass spectrometer equipped with a heated-electrospray ion source (Bruker).
Separations were achieved by linear gradient elution transitioning from 100% Solvent A
(aqueous) to 100% Solvent B (organic) over 20 min, followed by a 3 min run of 100% Solvent B
and then a return to 100% Solvent A in a final 3 min washing. A flow rate of 0.4 ml/min with a
column temperature of 50 °C was determined to be optimal for separation using the above
method. Solvent A: ultrapure water with 0.1 % formic acid; Solvent B: MeOH with 0.1 % formic
acid. UV spectra were measured over 390-420 nm using the HyStar software package.
The uHPLC was coupled to an electrospray mass analyzer operating in positive ion
mode. The spectrometer used a capillary voltage of 4,500 V and capillary temperature of 180°C.
The nebulizing gas was set at 6.0 L/min. The software used for data analysis was Bruker
Compass Data Analysis. The microTOF-Q11 instrument is capable of resolving ±0.001 amu mass
differences. Due to the use of such high resolution, metabolites can be monitored via detection of
their exact mass (heme parent ion mass: 616.1794 amu). The amounts of metabolites are
quantified via integration of the corresponding extracted ion chromatogram (EIC) peak and
comparison of the peak area to standard curves generated for known concentrations of pure hemin
and internal standard (0.1 – 7 μM) measured at the same time as the analytes. Standard curves
were generated in both potassium phosphate buffer. An internal standard (2-vinyl-4-
hydroxymethyl-deuteroporphyrin IX) was added to each sample to a final concentration of 0.05
M in order to compensate for run to run variability and instrument drift, neither of which proved
to perturb the data substantially.
Intracellular heme quantification assay using IsdG - S. aureus ∆isdG and ∆hemB bearing a
plasmid constitutively expressing IsdG (plgt.isdG) were grown overnight (66). Based on

17
stationary phase culture density, ∆isdG and ∆hemB pellets were resuspended with 500 μl and 50
μl of lysostaphin in TSM buffer (6 μg/ml lysostaphin), respectively. Samples were incubated at
37°C for 25 min and pelleted by centrifugation at 16,300 x g. ∆isdG and ∆hemB were
resuspended in 250 μl and 200 μl, respectively, of 100 μM PMSF in SoluLyse (Genlantis).
Samples were lysed by sonication, normalized by BCA (ThermoScientific), and IsdG quantities
were assessed as described previously (66). Band density was quantified using the Odyssey
System software (LI-COR) and arbitrary units were converted to protein concentration based on
an IsdG standard.
Statistical analysis - Where indicated, Student’s t-tests were calculated using either Excel 2007 or
GraphPad Prism 5. Tests of skewness, kurtosis, and D’Agostino and Pearson omnibus normality
test were calculated using GraphPad Prism 5. When sample sizes were too small to apply
standard tests for normality, samples were considered to be normally distributed if their skewness
and kurtosis fell approximately within ±1 and ±3, respectively. Results were considered
significant if the p-value was less than or equal to 0.05.
Results
A high-throughput screen identifies activators of HssRS. In order to identify small molecule
activators of HssRS, a high-throughput screen (HTS) using luminescence as a reporter of HssRS
activity was performed. The hrtAB promoter was cloned into the pXen-1 vector, which contains a
luxABCDE operon that produces blue-green light when expressed (Figure 3A). This construct
was transformed into wildtype S. aureus and the resulting strain was used to screen
approximately 160,000 small molecules in the Vanderbilt Institute for Chemical Biology’s
compound library. This primary screen resulted in the identification of 250 positive hits. Based on
luminescence values, the top 110 hits were subjected to a secondary screen using a xylE reporter
assay to eliminate compounds that generate non-specific luminescence (90). Hits that passed this
secondary screen were further tested in a tertiary screen for their ability to adapt S. aureus to

18
heme toxicity by growth curve analyses (90). Of all the compounds screened, ‘882 was the most
potent activator of hrtAB expression. ‘882 activates the hrtAB promoter in a dose-responsive
manner requiring HssRS and pre-adapts S. aureus for heme toxicity (Figure 3B and C). These
properties were observed for both commercially purchased and independently synthesized
preparations of ‘882 (Figure 3D). These results establish ‘882 as a small molecule activator of the
HssRS-dependent heme stress response.
‘882 stimulates heme biosynthesis to activate HssRS. To determine the mechanism by which
‘882 activates HssRS, the residues required for HssS activation by ‘882 were compared to the
residues required for HssS heme sensing. It was previously determined that residues R94A,
T125A, and F165A reduce HssS heme sensing to different degrees. The impact of these
mutations on HssS activation by ‘882 mirrored that observed upon heme exposure (Fig. 4A). This
result indicates that heme and ‘882 trigger HssS signaling through similar residues despite being
structurally distinct.
This observation suggests that ‘882 stimulates HssRS through a mechanism similar to
that of heme. A potential explanation is that ‘882 is a small molecule activator of endogenous
heme synthesis. To test this model, the phrt.xylE reporter plasmid was transformed into the heme
auxotroph hemB::ermC (∆hemB) and HssRS activation was evaluated upon ‘882 exposure (92).
In contrast to wildtype S. aureus, ‘882 does not activate HssRS in ∆hemB (Figure 4B). The loss
of ‘882-mediated activation of HssRS in ∆hemB is not due to the slower growth rate of this strain
as XylE activity from a constitutively expressed xylE (plgt.xylE) is only modestly decreased
(Figure 4B). Furthermore, exogenous heme activates HssRS in ∆hemB, indicating that ∆hemB
HssRS is still able to sense heme (Figure 4C).

19
Figure 3. A high-throughput screen identifies small molecule activators of HssRS. A. 160,000 compounds from the Vanderbilt Institute for Chemical Biology small molecule library were screened using a luxABCDE reporter gene fused to the hrtAB promoter (phrt.lux). Luminescence of S. aureus wildtype (WT) and ∆hssR carrying either promoterless luxABCDE (pXen1) or phrt.lux. B. A secondary screen consisting of a XylE reporter assay verified the activity of the top 110 hits from the primary screen, including ‘882. Triplicate cultures of S. aureus WT and ∆hssR transformed with the hrtAB promoter-xylE fusion-containing plasmid (phrt.xylE) were grown in the presence of the indicated additive and XylE activity was measured. C. ‘882 was confirmed as the top hit in a tertiary screen that measured the ability of the compound to pre-adapt S. aureus for growth in 20 μM heme. Triplicate cultures of WT S. aureus were grown overnight in medium containing the indicated additive and sub-cultured into medium containing 20 μM heme. Growth was monitored by measuring the optical density at 600 nm (OD600) over time. D. The structure of lead compound VU0038882 (‘882). (B and C) Error bars represent one standard deviation from the mean. The high-throughput screen was performed by DLS and OA.

20
Figure 4. HssRS activation by ‘882 requires HssS residues required for heme sensing and endogenous heme biosynthesis. A. S. aureus ∆hssS was transformed with plasmids containing the xylE reporter gene fused to the hrtAB promoter and encoding Myc-tagged wildtype HssS (HssS-Myc) or HssS-Myc mutated at the indicated extracytoplasmic domain residue (R94A, T125A, or F165A). The resulting strains were grown in the presence of the indicated concentration of heme (left) or ‘882 (right) and XylE activity was quantified. Triplicate experiments were performed and averaged. B. S. aureus wildtype (WT, black lines) and the heme auxotroph hemB::ermC (∆hemB, gray lines) were transformed with plasmids constitutively expressing XylE (plgt.xylE, dashed lines) or with xylE under the control of the hrtAB promoter (phrt.xylE, solid lines). Triplicate cultures of these strains were grown in the presence of ‘882 and XylE activity was measured. C. Triplicate cultures of ∆hemB carrying phrt.xylE were grown in medium containing the indicated concentration of heme and XylE reporter activity was measured. (B and C) Error bars correspond to one standard deviation from the mean. Experiments in A and B were performed by DLS.

21
These observations are consistent with a model whereby ‘882 exposure leads to an
increase in intracellular heme and subsequent HssS activation. In support of this model,
intracellular heme levels increase in a dose-responsive manner in bacteria treated with ‘882
(Figures 5A and B). Moreover, ‘882 exposure leads to a darkening of S. aureus pellets indicative
of massive heme accumulation in these cells (Figure 5A, inset). The activation of HssS by ‘882 is
not due to enzymatic degradation of heme as ‘882 still activates HssS in a strain of S. aureus
lacking all heme oxygenases (Figure 5C) (66).
To determine if the endogenous heme produced as a result of ‘882 exposure is available
for use in cellular processes, cytoplasmic heme availability was measured by quantifying
intracellular levels of the cytoplasmic heme oxygenase IsdG. In the absence of exogenous heme,
IsdG is rapidly degraded; however, heme binding stabilizes IsdG and reduces its proteolytic
degradation (66). Therefore, the abundance of IsdG reflects the cytoplasmic levels of heme.
Following ‘882 treatment, the intracellular abundance of IsdG increased in a dose-dependent
manner (Figures 5D and E). IsdG is not stabilized when S. aureus ∆hemB is grown in the
presence of ‘882, demonstrating that stabilization of IsdG requires endogenous heme (Figures 5D
and E). Moreover, IsdG abundance increases in ∆hemB exposed to exogenous heme, indicating
that heme-dependent stabilization of IsdG is not generally disrupted in this strain (Figures 5D and
E). Taken together, these experiments reveal that ‘882 exposure increases cytoplasmic heme
availability.
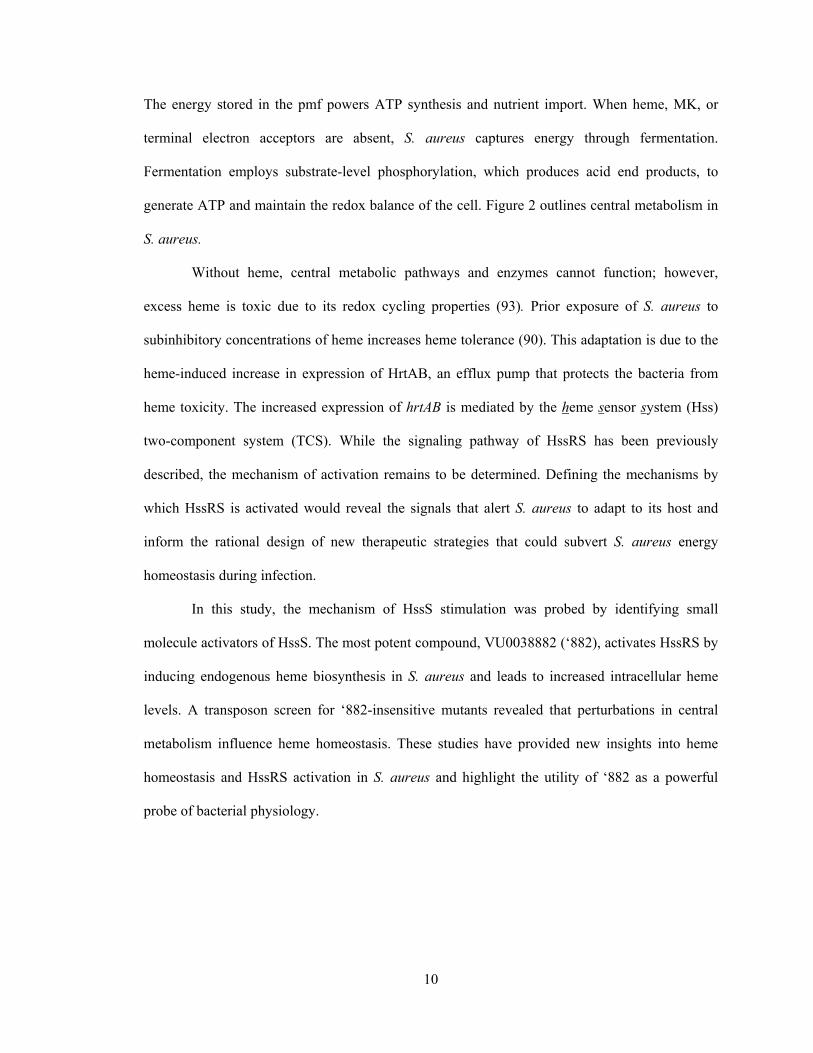
To test whether other bacterial heme sensing proteins monitor endogenous heme, the
ability of the Corynebacterium diphtheriae ChrAS and Staphylococcus haemolyticus HssRS
TCSs to sense ‘882 by adaptation growth curve was examined (73, 85, 90). Due to the slow
growth and low optical density achieved by C. diphtheriae, enumerating CFUs, a more sensitive
measure of growth, was used to assess the adaptation of this pathogen. Pre-treatment of both
species with either heme or ‘882 improved survival in heme as compared to non-adapted cultures
(Figures 6A and B). These data suggest that ‘882 may stimulate heme biosynthesis in multiple

22
Gram positive bacteria and support the hypothesis that the ability to respond to both endogenous
and exogenous heme is a conserved function of bacterial heme sensor systems.
‘882 diminishes fermentative activity of S. aureus. To define the mechanism by which ‘882
manipulates heme biosynthesis, a S. aureus transposon library was screened for mutants unable to
sense ‘882 or heme by growth curve adaptation (90, 99). Of the approximately 7,000 mutants
screened, only one strain was completely unable to be pre-adapted for heme toxicity by ‘882; this
strain contained a transposon in the hemL gene involved in heme biosynthesis. Forty-four
additional mutants were found to have a defect in ‘882 sensing and of those, 17 were also
deficient in heme sensing (Table 1). A number of genes required for sensing heme and/or ‘882
are involved in central metabolic pathways including a predicted α-D-1,4-glucosidase (malA), the
catabolite control protein (ccpA), respiratory response TCS (srrAB), branched-chain amino acid
amino transferase (ilvE), bifunctional pyrimidine regulator/uracil phosphoribosyltransferase
(pryR), and pyridoxal 5'-phosphate synthase glutamine amidotransferase subunit (pdxT) (19, 52,
80). Consistent with these observations, bacteria treated with ‘882 had reduced glycolytic activity
as indicated by slower acidification of the medium that correlated with delayed consumption of
D-glucose and reduced production of L- and D-lactate (Figure 7). These observations suggest that
as ‘882 induces endogenous heme biosynthesis, it also reduces the glycolytic or fermentative
capacity of S. aureus. These results support a model whereby the metabolic state of S. aureus and
heme homeostasis are functionally interconnected.

23
Figure 5. ‘882 treatment stimulates endogenous heme biosynthesis. A. Heme levels in triplicate cultures of S. aureus treated with the indicated additive were quantified using the pyridine hemochromogen assay and normalized to the concentration of protein in the whole cell lysates. Inset: Pellets from a culture grown with 40 µM ‘882 are red-brown when compared to vehicle treated S. aureus. B. Exact-mass mass spectrometric analysis was used in conjunction with UPLC to detect and quantify heme in protoplasts from cells treated with 40 µM ‘882 or vehicle grown in triplicate. Measured heme molecules were referenced to estimated CFUs per pellet, factoring in dilutions. Dead or lysed cells would also contribute to the measurement. Hence the measured numbers are considered upper estimates. Samples measured in duplicate or triplicate injections had typical errors of <5% between analytical replicates. Significance was calculated using a two-tailed Student’s t-test. C. Triplicate cultures of ΔisdGΔisdI S. aureus were grown overnight in medium containing the indicated additive and sub-cultured into medium containing 10 μM heme. Growth was monitored by measuring the optical density at 600 nm (OD600) over time. Error bars represent one standard deviation from the mean. D. IsdG stabilization was used as a reporter for intracellular heme levels. S. aureus ∆isdG (black bars) and ∆hemB (gray bars) were transformed with plasmids that constitutively express IsdG (plgt.isdG). These strains were grown in the presence of the indicated additive. Whole cell lysates, along with an IsdG standard, were blotted with anti-IsdG polyclonal antisera. Intracellular levels of IsdG were quantified using densitometry. Shown is the average of at least four replicates. Statistics were calculated using a two-tailed, Student’s t-test. E. Representative blots of the ∆isdG (top) and ∆hemB (bottom) data shown in D. In all instances error bars represent one standard deviation from the mean. Data in B was generated by SS.
24
Figure 6. ‘882 pre-adapts other Gram positive bacteria for heme toxicity. A. Adaptation by heme and ‘882 in Corynebacterium diphtheriae was tested by growth analyses. Triplicate cultures were grown overnight in medium containing vehicle, 5 µM heme or 50 µM ‘882 and subcultured into medium containing 15 μM heme. The CFUs were enumerated 2.5 h after inoculation and normalized to cultures unexposed to heme. Shown is the average of five replicates; error bars represent standard error of the mean and significance was determined by a two-tailed Student’s t-test. B. Adaptation by heme and ‘882 in Staphylococcus haemolyticus was tested by growth analyses. Triplicate cultures were grown overnight in medium containing the indicated additive and subcultured into medium containing 30 μM heme. Growth was monitored by measuring the optical density at 600 nm (OD600) over time. Error bars represent one standard deviation from the mean.

25
Table 1: Transposon mutants less sensitive to ‘882
Tranposon ID Integration site Newman Gene name Gene description
Co-factors
11e11*,1 555437-8 NWMN_0482 pdxT pyridoxal 5’-phosphate biosynthesis
21D1 1728844-5 NWMN_1561 hemL glutamate-1-semialdehyde aminotransferase
Carbohydrates
6E11 755114-5 NWMN_0672 aldo/keto reductase family protein
33F2, (66E5, 68B5, 68E8)2,
67E11
1583073-4, 1584195-6, 1584189-90
NWMN_1414 malA α-D-1,4-glucosidase
Cell wall
52A8 1443696-7 NWMN_1310 alr2 alanine racemase 2
51C3 1444887-8 NWMN_1311 lysA diaminopimelate decarboxylase
50 G5 1513348-9 NWMN_1349 ald alanine dehydrogenase
Amino acids & proteins
(24B2, 27D3, 24H6)*
595672-3 NWMN_0516 ilvE branched-chain-amino-acid aminotransferase
75D6 1610144-5 NWMN_1439 gcvPB glycine cleavage system P protein, subunit 2
6F8 1678876-7 NWMN_1513 peptidase U32 family protein
DNA & RNA
8D8 1614867-8 NWMN_1446
competence protein ComGC-like protein
6H6 1659859-60 NWMN_1490
DNA internalization-related competence protein ComEC/Rec2
4E5, 5B10, 14D7, 18G5, 51G4*
1628735-36, 1629189-90,1629015-6,
1629152-3, 1628880-1NWMN_1461
ATP dependent RNA helicase DEAD/DEAH box family protein
76C11 1660941-2 NWMN_1491
competence protein ComEB required for DNA binding and uptake
17B7* 1681514-5 NWMN_1517
conserved hypothetical protein
2F2* 2296289-90 NWMN_rRNA15 23S rRNA
Transporters
11B6, 12F8* 982508-9, 982803-4 NWMN_0886
Hypothetical protein; transporter; next to murGE
(66C5, 69D11) 1670973-4 NWMN_1505 hypothetical protein contains NRAMP domain

26
Table 1 cont’d: Transposon mutants less sensitive to ‘882
Tranposon ID Integration site Newman Gene name Gene description
Regulators
63C6 736803-4 NWMN_0655 MarR family protein
48F5* 756768-9 NWMN_0674 saeS S. aureus accessory element histidine kinase
44C2* 1213708-9 NWMN_1109 pryR pyrimidine operon regulatory protein,
10D6* 1569662-3 NWMN_1399 srrB staph respiratory response histidine kinase
32G6* 1461723-4 NWMN_1328 response regulator
31H6* 1813162-3 NWMN_1629 ccpA catabolite control protein A
Phage
33G8 1124401-2 NWMN_1026 conserved hypothetical protein; identical to ORF040 of Bacteriophage 53
66F2 1990835-6 NWMN_1776 conserved hypothetical protein
Hypothetical and intergenic
69E5 780077-8 NWMN_0695/0696 intergenic Hypothetical protein (similar to MDR transporter) and di-/tripeptide ABC transporter
9F8* 846026-7 NWMN_0751 promoter hypothetical protein
49G8 1060937-8 NWMN_0955/0956 intergenic conserved hypothetical proteins
50F8 1624756-7 NWMN_1457/sodA intergenic
Zn specific metalloregulatory protein and superoxide dismutase Mn/Fe family protein
8G6 1668046-7 NWMN_1502/1503 intergenic hypothetical protein and enterotoxin family protein
77D12 1670682-3 NWMN_1504 promoter hypothetical protein
46B9 1690951-2 NWMN_1524 aminotransferase, class V
52F2 1755385-6 NWMN_1584 promoter hypothetical protein
2F9 1931846-7 NWMN_1732 hypothetical protein
52B8 2137622-3 NWMN_1930 hypothetical protein
52G4 2270169-70 NWMN_2051/ 52 intergenic lytic regulatory protein and truncated resolvase
32C7* 2384526-7 NWMN_2161
conserved hypothetical protein
1An asterisk denotes mutants that are less sensitive to both heme and ‘882. 2Mutants grouped in parentheses reflect identical integration sites.

27
Figure 7. ‘882 diminishes fermentative activity. S. aureus was grown in triplicate under aerobic conditions in the presence of vehicle (black lines) or 40 µM ‘882 (gray lines). At the indicated time intervals, culture supernatants were sampled and the A. pH, B. D-glucose, and C. D- and L-lactate were quantified. Error bars represent one standard deviation from the mean.

28
The metabolic state of the cell impacts heme biosynthesis. To test whether heme biosynthesis
interfaces with central metabolism, the effect of 2-deoxyglucose (2dG) on heme biosynthesis was
assessed. The glucose analogue 2dG primarily inhibits the phosphoglucoisomerase reaction, the
second step in glycolysis (97). Treatment of S. aureus with 2dG reduces endogenous heme levels
and antagonizes ‘882 activity (Figure 8A). Deletion of 6-phosphofructokinase (pfkA), the third
enzyme in glycolysis, results in a loss of glucose uptake and decreased acid end product secretion
in S. aureus (Figures 8B and C). In agreement with the effect of 2dG on heme biosynthesis, both
basal and ‘882-induced heme biosynthesis are suppressed in ΔpfkA (Figure 8D). These data
implicate a product of glycolysis in coordinating heme biosynthesis, strengthening the observed
link between the regulation of heme biosynthesis and central metabolism.
Discussion
Here, we describe an HTS that identified small molecule activators of the S. aureus heme
sensor system HssRS. The most potent hit, ‘882, increases endogenous heme levels and activates
HssRS through the heme biosynthesis pathway. This effect appears to be due to a perturbation of
the metabolic state of S. aureus as transposon insertions targeting genes involved in metabolism
contribute to the ability of the bacteria to sense ‘882. This hypothesis is supported by the
observations that ‘882 reduces fermentative processes and that inhibiting upper glycolysis
suppresses endogenous heme biosynthesis. Finally, we have shown that ‘882 activates heme
sensing systems in other Gram positive pathogens as it pre-adapts C. diphtheriae and S.
haemolyticus for heme toxicity.
Employing ‘882 as a probe has revealed that HssRS responds to both exogenous and
endogenous heme accumulation. It was previously thought that HssS was stimulated by heme in
the extracellular environment. Data presented here reverses this model as increased levels of
endogenous heme activate HssS. This indicates that the ligand sensing domain of HssS is most
likely intracellular or membrane localized.

29
Figure 8. Glycolytic activity regulates heme biosynthesis. S. aureus was grown in triplicate in the presence of vehicle or 10 µM ‘882. Heme levels were quantified using the pyridine hemochromogen assay and normalized to the concentration of protein in the whole cell lysates. A. Cultures were treated with the indicated dose of 2-deoxyglucose (2dG). (B-C). Wildtype (WT) and ΔpfkA Newman cultures were sampled during growth and the absorbance at 660 nm measured. B. Glucose levels in supernatants were quantified and used to calculate the rate of glucose import [∆glucose (mM/hr)/∆absorbance (OD660/hr)]. C. The pH of the supernatants was measured. (B and C) Data collected in three independent experiments are shown. Error bars represent twice the standard error of the mean (n = 3). D. Wildtype (WT) and ΔpfkA Newman were cultured in TSB+1% pyruvate. # indicates the signal was below the limit of detection. (A and D) Error bars represent the standard error of the mean from three independent experiments. Statistical significance was determined using an unpaired Student’s t-test. * = p≤0.05, ** = p≤0.001, *** = p≤0.0001 Results shown in B and C were performed by NPV.

30
The discovery that S. aureus monitors intracellular heme status through HssRS suggests
that other bacterial heme sensing systems may also sense intracellular heme. Already HrtR, which
functions alone as a transcriptional repressor of hrtRBA in L. lactis, has been shown to monitor
intracellular levels of heme, but no other TCS HK has been proposed to monitor intracellular
heme (42). Since ‘882 also adapts C. diphtheriae and S. haemolyticus for heme toxicity and both
of these species have heme-responsive TCSs, these data suggest that ‘882 also stimulates heme
biosynthesis in these bacteria and is sensed by their corresponding HKs (73). Furthermore, the
fact that ‘882 is sensed by C. diphtheriae and S. haemolyticus indicates that the target of ‘882 is
present in multiple pathogens, establishing this molecule as a powerful probe for studying
intracellular heme metabolism.
The utility of ‘882 as a probe is further supported by the observation that IsdG binds
endogenously synthesized heme following stimulation with ‘882. There are two families of heme-
degrading oxygenases, the Isd-family and the HO-family which, in addition to liberating iron
from the protoporphyrin ring of heme, also produce staphylobilin and biliverdin, respectively.
The HO-family heme oxygenase hemO from P. aeruginosa has previously been shown to bind
endogenous heme (3). Thus, with data presented here, both families of heme-degrading
oxygenases have now been shown to target endogenous heme (3). These data implicate a
potential role for bacterial heme oxygenases in endogenous heme turnover, a result that is likely
generalizable to all bacterial heme oxygenases (3). In bacteria, heme oxygenases are currently
thought to primarily function as a mechanism by which exogenous heme may be used as an iron
source, although a couple of heme oxygenases, specifically, B. anthracis IsdG and Neisseria
gonorrhoeae HemO, have also been implicated in alleviating heme toxicity (75, 100).
The turnover of endogenous heme by bacterial heme oxygenases highlights several
intriguing hypotheses. To begin with, it points to the possibility that endogenous heme and iron
homeostasis may be regulated by bacterial heme oxygenases (51, 66). Furthermore, it begs the
question of whether there is a physiological function of the heme degradation products

31
staphylobilin and biliverdin. The synthesis of heme requires energy, cellular building blocks and
reducing equivalents; degrading heme simply to release iron and maintain heme homeostasis
seems to be energetically inefficient. The functions of the heme oxygenase products (biliverdin
and staphylobilin) in bacteria remain unclear. In cyanobacteria, algae, and plants, the heme
degradation product biliverdin is a precursor for light-harvesting phytobilin pigments (20). A
reaction specific to mammals is the conversion of biliverdin to the potent antioxidant bilirubin
(47, 88). It is possible that bacterial biliverdin and staphylobilin are excreted as waste products or
further metabolized to be used as a carbon and nitrogen sources. The energetically economical
nature of bacteria, however, suggests that it is unlikely that biliverdin and staphylobilin are
simply refuse. In the context of iron and heme homeostasis, it is possible that biliverdin and
staphylobilin might function as signaling molecules or somehow provide protection from heme
toxicity. In order to study these exciting ideas, ‘882 may be used as a probe to dissect the impact
of endogenous heme metabolism by bacterial heme oxygenases on the regulation of heme uptake
and biosynthesis, which may reveal a physiological function of heme degradation products.
Heme biosynthesis is typically regulated by cellular iron or heme levels, although there is
some evidence that it is tied to central metabolism (14, 22). The perturbation of heme
homeostasis and central metabolism by ‘882 suggests that the two cellular processes are
coordinated in S. aureus. Strengthening this hypothesis, both chemical and genetic inhibition of
the upper steps in glycolysis result in suppressed basal and ‘882-induced heme levels. These data
suggest that an intact glycolytic pathway is required for ‘882-dependent activation of heme
biosynthesis, further supporting a functional interconnection between central metabolism and
heme biosynthesis in S. aureus. Since inhibiting upper glycolysis suppresses endogenous heme
biosynthesis and repressing fermentation stimulates endogenous heme biosynthesis, this suggests
that a metabolic signal between upper glycolysis and fermentation coordinates heme biosynthesis.
The opposing effects on heme homeostasis observed upon targeting upper glycolysis and
fermentation suggest that when upper glycolysis is inhibited, a metabolic signal is depleted versus

32
when fermentation is repressed, a metabolic signal accumulates. In this way heme biosynthesis
could be functionally tied to the energetic flux of the cell. An integration of heme homeostasis
with central metabolism is consistent with the fact that heme and iron are critical co-factors for
many enzymes involved in energy homeostasis. Further studies employing ‘882 could dissect the
interplay between heme and central metabolism in both S. aureus and other pathogens.
In summary, we have identified a small molecule that diminishes fermentative processes
in S. aureus, stimulates endogenous heme biosynthesis and activates HssRS. This molecule has
proven to be valuable as a probe of bacterial heme homeostasis. Tools for stimulating endogenous
heme biosynthesis are limited and these probes, which stimulate heme biosynthesis across genera,
will provide insight into conserved mechanisms of heme regulation. The effect of ‘882 on
suppressing fermentative processes does suggest that ‘882 may have therapeutic efficacy in
environments where S. aureus is forced to rely on fermentation. The potential utility of ‘882 as a
new therapeutic strategy is addressed in the next chapter.

33
CHAPTER III
THERAPEUTIC POTENTIAL OF ‘882 FOR THE TREATMENT OF
PERSISTENT INFECTIONS
Introduction
Small colony variants (SCVs) of S. aureus are spontaneous, slow-growing mutants
associated with persistent and recurrent S. aureus infections that are recalcitrant to antibiotic
therapy (63). Their slow growth is often due to lesions that eliminate respiration, such as
inactivation of MK or heme biosynthesis. SCVs are not exclusive to S. aureus as they have been
isolated in other pathogens, including Escherichia coli, Neisseria gonorrhoeae, Pseudomonas
aeruginosa, and Salmonella enterica serovar Typhimurium (6, 63).
The two prototypical disease states associated with S. aureus SCVs are cystic fibrosis
(CF) and osteomyelitis. Both diseases typically involve prolonged infection and antibiotic
treatment. In CF, S. aureus is usually isolated from complex microbial infections that primarily
include P. aeruginosa. P. aeruginosa secretes several antibacterial compounds including
pyocyanin, which inhibit bacterial respiration. Since SCVs do not have a functional respiration
branch for energy production, they can resist assaults from P. aeruginosa, the host immune
response, and antibiotic treatment. One study analyzed the sputa from 72 CF patients and found
that 70% are chronically colonized with S. aureus and, of those samples, 46% contained SCVs
(35). The deep-tissue infections associated with S. aureus osteomyelitis require prolonged
antibiotic treatment as the blood flow is restricted to the site of infection. Therefore, analogous to
CF, osteomyelitis tends to select for SCV persister populations. This is evidenced by the
identification of S. aureus SCVs in approximately 29% of patients with S. aureus osteomyelitis
(91). In this study, S. aureus SCVs were only isolated from the patients who had previously

34
received gentamicin bead therapy at the site of infection; these patients were prone to recurrent
osteomyelitis.
SCVs are intrinsically resistant to antibiotics and host defenses primarily because their
respiratory branch is inactive. The loss of respiration results in a low ∆ψ across the membrane
(39). Both aminoglycosides, such as kanamycin and gentamicin, as well as antibacterial cationic
peptides require ∆ψ to cross the bacterial envelope. Therefore SCVs are intrinsically resistant to
aminoglycosides and some host defense peptides. Furthermore, the slow growth of SCVs also
results in reduced cell wall production, which makes the bacteria less susceptible to cell wall
targeting antibiotics such as β-lactams (64).
The host-pathogen interaction is complex and it is likely the metabolic flexibility of S.
aureus which enables this microbe to be a successful pathogen. Abscesses, which are purulent
lesions containing bacteria and neutrophils surrounded by a pseudocapsule, are a hallmark of S.
aureus infections (11). Upon encountering S. aureus, the neutrophil releases a toxic milieu of
chemicals to kill the invading pathogen. One component of this toxic milieu is nitric oxide (NO·),
which inactivates iron-containing proteins critical for respiration (69). When S. aureus relies on
fermentation, NO· no longer has a negative effect on growth (69). Therefore it is likely that
fermentation is critical to staphylococcal pathogenesis since abscesses are thought to be anaerobic
environments and S. aureus can persist in that niche (59).
In Chapter II it was determined that ‘882 suppresses fermentative processes such as
glucose uptake and acid end product excretion. This suggests that ‘882 may be toxic to
fermenting S. aureus, including clinically relevant SCVs. In the following chapter this hypothesis
is tested and the potential utility of a small molecule inhibitor of fermentative growth is
elaborated.

35
Methods
Bacterial strains and growth conditions- Staphylococcus aureus strains Newman, ∆hssRS,
∆menB, and ∆isdG have been described previously (16, 51, 83, 90, 93). S. aureus hemB::ermC
(∆hemB) has been described previously and was transduced into Newman using bacteriophage Φ-
85 (51, 92). Corynebacterium diphtheriae strain HCL2 was used.
All S. aureus strains were grown on tryptic soy agar (TSA) containing 10 µg/ml
chloramphenicol when appropriate and grown at 37°C for 20-30 h. All overnights were grown in
5 ml of tryptic soy broth (TSB) at 37°C with shaking at 180 rpm unless otherwise noted. All
aerobic growth conditions were at 37°C with shaking at 180 rpm in TSB unless otherwise stated.
Anaerobic growth was obtained by growing cultures in 5 ml of TSB in aeration tubes at
37°C with shaking at 180 rpm for 15 h. Cultures were diluted to a theoretical OD600 of 0.0001 and
200 µl were added to 5 µl of additive in a 96 well plate. Cultures were placed in an anaerobic jar
and incubated at 37°C for 18 h.
Unless stated otherwise, vehicle treatment refers to a volume of DMSO comparable to the
volume added containing the described compound (‘882 or ‘373).
XylE reporter assays - XylE assays were performed as described previously with modifications in
growth conditions (90). The bacteria were grown for 9 h and diluted 1:100 into 0.5 ml of media
for 15 h.
Growth curve analyses - Overnight cultures of Newman were diluted 1:100 into 100 μl of media.
Bacterial cells were incubated and the OD600 was measured at the specified time points. For all
staphylococcal adaptations, cultures were inoculated in 0.5 ml of TSB for 1 h at 37°C, 180 rpm
and sub-cultured 1:100 in 100 ul of media containing the indicated additive. Cultures were pre-
adapted overnight and analyzed as described above for a typical growth curve.
Gentamicin resistance assay - An overnight of Newman grown on a Cel-Gro Tissue Culture
Rotator (Lab-Line) was sub-cultured 1:100 into 5 ml of TSB containing the indicated additive

36
(gentamicin, 10 μg/ml; ‘882, 20 μM) and growth on the rotator was continued for 24 h. CFUs
were enumerated on TSA and TSA containing 5 μg/ml gentamicin.
Neutrophil killing assay - All mice were maintained in compliance with Vanderbilt’s Institutional
Animal Care and Use Committee regulations. Polymorphonuclear leukocytes (PMNs) were
elicited using casein and harvested from 13-16 week old male C57BL/6 mice (Jackson Labs) as
previously described (36). Bacteria were prepared and assayed as previously described with
modifications (36). An overnight of Newman grown on a Cel-Gro Tissue Culture Rotator (Lab-
Line) was sub-cultured 1:100 and grown in the rotator to mid-log. Following growth, the bacteria
were resuspended to an OD600 of 0.4 in phosphate buffered saline (PBS) and 1 ml of culture was
pelleted. The pellet was incubated in 50% normal mouse serum, 50% RPMI/H (10 mM HEPES in
RPMI), 10 μM MnCl2 and either vehicle or 40 μM ‘882 for 30 min. The pellet was resuspended
in 1 ml RPMI/H with 20 μM MnCl2 and 2X vehicle or ‘882.
NO· growth curve - 1 ml of an overnight of Newman grown at 37°C, 250 rpm was washed with
PNG (PN media with 0.5% glucose) (60). The cultures were diluted to an OD660 of 0.01 in PNG
and 200 µl were aliquoted into a 96 well plate. The plate was incubated at 37°C with shaking (14
min 30 sec 1 mm Orbital, 30 sec 1 mm Linear) on a Tecan Infinite F200Pro. When the cultures
reached an OD660 of 0.15, NO· was added with a final concentration of 10 mM NOC-12 and 1
mM DEANO.
C. diphtheriae growth curve - C. diphtheriae was grown aerobically in brain heart infusion (BHI)
medium for 20 h at 37°C, 180 rpm. The cultures were back-diluted in BHI to a theoretical OD600
of 0.0001 and 150 µl of bacterial culture were added to 5 µl of ‘882 stock. Cultures were grown
at 37°C, 180 rpm for 18 h and the OD600 measured.
Systemic murine model of infection - All mice were maintained in compliance with Vanderbilt’s
Institutional Animal Care and Use Committee regulations. Seven week old BALB/c (Jackson
Laboratory) female mice were infected retro-orbitally with 2x10⁷ CFU of Newman as described
previously (77). ‘373 was prepared in 10% Tween 80 and brought to a neutral pH with 0.1 M

37
sodium hydroxide. Intraperitoneal (IP) treatments were given 2 h before infection and every
subsequent 24 h until the mice were euthanized with CO2 96 h post-infection. Liver abscesses and
CFUs were enumerated.
Imaging MALDI-MS/MS - Livers from mice infected and treated as described above were
harvested 24 h post infection (1 h after the 2nd treatment) and flash frozen on hexane and dry ice.
Ten μm sections were prepared using a cryostat and thaw-mounted directly to a gold-coated
stainless steel MALDI target plate (Applied Biosystems). 30 mg/ml of 2,5-dihydroxybenzoic acid
(DHB) was prepared in 1:1 acetonitrile:water with 0.1% trifluoroacetic acid. Matrix was applied
using a thin layer chromatography glass reagent sprayer (Kontes Glass Company).
Mass spectra were acquired in positive-ion MS/MS mode using a MALDI LTQ XL linear
ion trap mass spectrometer (Thermo Scientific) equipped with 337-nm nitrogen laser operating at
60 Hz. Two in-line neutral density filters were used. Protonated ‘373 molecules (m/z 255.2) were
isolated and fragmented with Helium gas serving as the trapping and collisional gas. Ion density
images were extracted from the raw data using ImageQuest version 1.0.1 (ThermoScientific).
‘373 Quantitation via HPLC - Levels of ‘373 in liver tissue analyzed via Imaging MALDI-
MS/MS (IMS) were quantified using HPLC-MS/MS. Tissues were homogenized in 1:1
acetonitrile:methanol manually using a pestle and a Model 100 Sonic Dismembrator (Fisher
Scientific). Homogenate was diluted to a final concentration of 20 mg/ml, and cellular debris was
removed by centrifugation at 3,000 rpm for 5 min. Infected, untreated control liver was
homogenized to serve as a blank and to prepare calibration standards.
Deferasirox (AK Scientific, INC.) was used as an internal standard and was spiked at a
concentration of 100 pg/ml into the supernatant solution of all samples analyzed. A calibration
series of ‘373 was spiked into control tissue supernatant at concentrations of 0, 7, 50, 100, 150,
and 200 ng/mL.
Separations were performed on a 1260 Infinity HPLC system (Agilent Technologies)
with a 6430 Triple Quadrupole Mass Spectrometer (Agilent Technologies) using a ZORBAX

38
Rapid Resolution High Definition SB-C18 column (2.1mm id × 50 mm, 1.8μm). Analytes were
eluted over 15 min using the following gradient: initial flow 50% Solvent A (0.1% formic acid in
water) and 50% Solvent B (0.1% formic acid in 1:1 acetonitrile:methanol) for 30 seconds, ramped
to 80% Solvent B over 10 min, held for an additional min, ramped back to 50% Solvent B over 3
min, and held for an additional min.
Optimal parameters for transitions were determined using Mass Hunter optimizer version
B.04.01 (B4114). Four transitions were monitored for both the target of interest and the internal
standard. For ‘373, a precursor [M+H]+ of 255 was monitored at a retention time of 4.7 min for
transitions to 122 for quantitation and 65, 102, and 190 as qualifiers. For Deferasirox, a precursor
[M+H]+ of 374 was monitored at a retention time of 5.0 min for transitions to 120 for
quantitation and 65, 108, and 182 as qualifiers. Data were analyzed using Mass Hunter
workstation software Quantitative Analysis version B.04.00/build 4.0.225.19. Calibration curves
were generated as response ratios of ‘373 relative to the internal standard and had an R2 value of
0.996.
Statistical analysis - Where indicated, Student’s t-tests were calculated using either Excel 2007 or
GraphPad Prism 5. Tests of skewness, kurtosis, and D’Agostino and Pearson omnibus normality
test were calculated using GraphPad Prism 5. When sample sizes were too small to apply
standard tests for normality, samples were considered to be normally distributed if their skewness
and kurtosis fell approximately within ±1 and ±3, respectively. Results were considered
significant if the p-value was less than or equal to 0.05.
Results
‘882 is bacteriostatic to fermenting S. aureus. The ‘882-dependent suppression of substrate
level phosphorylation in aerobic cultures suggests that the compound may inhibit fermentative
growth. Indeed, when S. aureus was grown anaerobically in the presence of ‘882, growth was
dramatically reduced (Figure 9A). In addition, a strain bearing a lesion in the MK biosynthesis

39
gene menB (∆menB), which cannot respire and solely ferments to produce energy, is more
susceptible to ‘882 toxicity than wildtype (Figure 9A). ‘882 is bacteriostatic to ∆menB both
aerobically and anaerobically (Figure 9B). Moreover, when ‘882 is combined with the respiratory
poison potassium cyanide (KCN), S. aureus growth is inhibited, even under aerobic conditions
(Figure 9C). Taken together, these data indicate that ‘882 inhibits S. aureus fermentative growth
and that respiration is protective against ‘882 toxicity. Notably, ‘882 inhibits the growth of C.
diphtheriae, supporting the conserved activity of ‘882 in heme sensing organisms (Figure 9D).
Furthermore, ∆hemB, an SCV deficient in heme biosynthesis, is also sensitive to ‘882, indicating
that heme accumulation is not the source of toxicity, but rather a result of ‘882 perturbing S.
aureus metabolism (Figure 9A).
‘882 prevents the evolution of antibiotic resistance. S. aureus SCVs are obligate fermenters
that emerge in response to aminoglycoside treatment (63). The sensitivity of fermenting S. aureus
to ‘882 lead to the hypothesis that this compound could prevent the outgrowth of antibiotic
resistant SCVs in the presence of aminoglycosides. To test this, S. aureus was grown in the
presence of vehicle, gentamicin, ‘882, or a combination of gentamicin and ‘882, and the evolution
of gentamicin resistance was monitored. Bacteria treated with gentamicin alone became resistant
to gentamicin, whereas ‘882 treatment alone did not affect the number of viable or gentamicin-
resistant bacteria (Figure 8). Combining ‘882 with gentamicin resulted in a 5-log reduction in
bacterial viability and eliminated all detectable gentamicin-resistant colonies (Figure 10). This
suggests that targeting fermentation can be used as an adjunctive therapy with antibiotics that are
active against respiring S. aureus to improve antibacterial action and reduce the emergence of
antibiotic resistance.

40
Figure 9. ‘882 inhibits fermenting S. aureus. A. S. aureus wildtype (WT, dashed lines), the menaquinone auxotroph (∆menB, dotted lines), and the heme auxotroph hemB::ermC (∆hemB, solid lines) were grown in triplicate under aerobic (aer, black lines) and anaerobic (ana, gray lines) conditions in the presence of the indicated log of the concentration of ‘882 (µM). After 18 h the absorbance at 600 nm (OD600) was measured and normalized to vehicle (DMSO) treated bacteria. Curves were fit by nonlinear regression analysis and absolute logIC50 values were calculated in Prism with the top set at 1.0 and the bottom set at 0.15. LogIC50 values are indicated in parentheses in the figure key +/- standard error of the mean. All logIC50 values were statistically different from WT aerobic logIC50 when analyzed by one-way ANOVA with a Dunnett post test (p<0.001). Error bars represent the standard error of the mean. B. CFUs from A were enumerated at the beginning and end of the time course for bacteria treated with vehicle and 40 µM ‘882. The fold increase over the input of bacteria was determined. C. Triplicate cultures of S. aureus were grown in the presence of vehicle (DMSO), 1 mM potassium cyanide (KCN), 40 µM ‘882, or a combination of 1 mM KCN and 40 µM ‘882. Growth was monitored by measuring the OD600 at the indicated time points. D. Triplicate cultures of C. diphtheriae were grown in the presence of the indicated concentration of ‘882. Growth was measured by OD600 at 18 h. Shown is the average of three independent experiments. Error bars in panels B-D represent one standard deviation from the mean.

41
Figure 10. Co-treatment of S. aureus with ‘882 and gentamicin prevents the outgrowth of antibiotic resistant isolates. Triplicate cultures of S. aureus were grown in the presence of the indicated additive. After 24 h, CFUs were enumerated on TSA containing 5 μg/ml gentamicin and plain TSA with a limit of detection of 100 CFUs/ml (minimum y-value); # indicates colonies were not identified above the limit of detection. Shown is the average of three independent experiments. Error bars represent one standard deviation from the mean.

42
‘882 enhances innate immune function. Neutrophils are the first immune cells to respond to the
site of a S. aureus infection (13). As part of the innate defense program, they secrete noxious
chemicals to kill invading pathogens; this includes NO·, which inactivates respiration (13, 69). In
agreement with the observation that ‘882 is particularly toxic to fermenting S. aureus,
simultaneous exposure of S. aureus to ‘882 and NO· is more antibacterial than treatment with
either molecule alone (Figure 11A). Additionally, ‘882 improves neutrophil-dependent killing of
S. aureus but does not overtly affect neutrophil viability (Figure 11B). These results support the
notion that ‘882 may have therapeutic efficacy against bacterial invaders by augmenting the
killing activity of neutrophils.
A derivative of ‘882 reduces S. aureus pathogenesis in vivo. Abscesses are a hallmark of S.
aureus infections (11). It is likely that fermentation is critical to staphylococcal pathogenesis
since abscesses are thought to be anaerobic environments (59). Testing this hypothesis is
challenging as S. aureus fermentation is branched and is accomplished by multiple parallel-acting
enzymes, so genetic inactivation of fermentation is impractical. The toxic effect of ‘882 toward
fermenting S. aureus provides an opportunity to gain initial insights into the role of fermentation
in pathogenesis. However, ‘882 has a metabolically labile furan group which may form protein
adducts and deplete glutathione in vivo (7). Thus, the furan was replaced with a 2-fluorophenyl
group to create a more biologically stable derivative, VU0420373 (‘373) (Figure 12A). ‘373
activates HssRS as evidenced by its ability to increase the expression of the xylE reporter gene
and pre-adapt S. aureus for heme toxicity (Figures 12B and C). In addition, ‘373 inhibits the
growth of S. aureus ∆menB, although to a lesser extent than ‘882 (Figure 12D).

43
Figure 11. ‘882 enhances S. aureus susceptibility to neutrophil killing mechanisms. A. S. aureus was grown in the presence or absence of 10 µM ‘882. When the cultures reached an optical density at 660 nm (OD660) of 0.15, nitric oxide (NO·) was added to the indicated cultures with a final concentration of 10 mM NOC-12 and 1 mM DEANO. B. S. aureus was grown in the presence of vehicle (DMSO) or 40 µM ‘882 and coated in serum. Murine PMNs were elicited with casein and harvested from the peritoneum. The ability of neutrophils to kill S. aureus in the presence of ‘882 was assessed by comparing CFUs recovered from neutrophil-exposed S. aureus to those recovered from identical conditions lacking neutrophils. The mean of at least six independent experiments performed in triplicate are represented by the data; error bars represent standard error of the mean and significance was determined by a two-tailed Student’s t-test. Data presented in A were performed by NPV and in B were performed with the assistance of TKF.

44
Figure 12. ‘373 exhibits effects similar to ‘882. A. Shown is the structure of derivative VU0420373 (‘373). B. Triplicate cultures of S. aureus wildtype (WT) and ∆hssRS transformed with a plasmid containing the xylE reporter gene fused to the hrtAB promoter (phrt.xylE) were grown in medium containing the indicated additive. Following growth to stationary phase, XylE activity was measured and normalized to lysate protein concentrations. An asterisk denotes the value was below the limit of detection. C. Triplicate cultures of S. aureus were grown overnight in medium containing the indicated additive. Cultures were back-diluted into medium containing 20 μM heme. The absorbance at 600 nm (OD600) was taken at the indicated times after inoculation. D. S. aureus WT and the menaquinone auxotroph (∆menB) were grown in triplicate under aerobic and anaerobic conditions in the presence of vehicle (DMSO) or 40 µM ‘373. CFUs were enumerated at the beginning and end of the time course. Based on these values, the fold increase over the input of bacteria was determined. (B-D) Error bars represent one standard deviation from the mean. ‘882 SAR and ‘373 synthesis was performed by BFD.

45
Intraperitoneal administration of ‘373 to mice intravenously infected with S. aureus
resulted in a significant 1-log decrease in CFUs recovered from the livers of ‘373-treated animals
as compared to vehicle (Figure 13A). Notably, ‘373-treatment reduced tissue pathology
associated with infection as demonstrated by a significant reduction in the number of liver
abscesses (Figure 13B). This liver-specific reduction in bacterial burden and inflammation
correlates with an accumulation of ‘373 in the livers of treated animals as shown by Imaging
Mass Spectrometry (IMS) (Figures 13C-F) (49). To quantify the tissue level of ‘373, portions of
the livers were excised and '373 concentrations were determined by HPLC-MS (Figure 13E). A
linear relationship between tissue level and dose of ‘373 administered was observed. Average
spectral intensity extrapolated from IMS data of '373 reflected a dose-response relationship
similar to that observed by HPLC-MS, confirming the suitability of IMS for monitoring tissue
levels of '373 (Figure 13F). Both the HPLC-MS and IMS data support the notion that the
therapeutic effect of ‘373 is due to the interaction of the compound with S. aureus as it is found at
the site where bacterial growth is restricted. Although the therapeutic benefits of ‘373 could be
due to alternative activities of this molecule, these results provide evidence that targeting
fermentation in a facultative anaerobe may be a viable therapeutic strategy.

46
Figure 13. ‘373 reduces S. aureus pathogenesis in vivo. Mice infected retroorbitally with S. aureus were treated intraperitoneally with vehicle (10% Tween 80) or ‘373. After 96 h mice were sacrificed and A. CFUs and B. surface abscesses were enumerated from the livers. Each marker represents an individual mouse. Data were collected from three independent experiments resulting in n = 13 for vehicle and n = 12 for ‘373-treated mice once the highest and lowest values were removed from each group. The horizontal line indicates the mean and the error bars represent the standard error of the mean. Statistical significance was determined by a two-tailed Student’s t-test. C. Livers from mice treated with the indicated dose of ‘373 were harvested 24 h post-infection (1 h after the 2nd treatment), sectioned, and mounted on MALDI target plates. D. Tissue sections were imaged by MALDI-MS/MS for accumulation of a fragment of ‘373 by MALDI-MS/MS (m/z 255.2134). Spectra were acquired at 10 microscans per step. 5 laser shots were acquired per pixel and pixels were obtained every 100 µm. E. Quantitative data from liver extract showing an increase in ng of ‘373 per mg liver tissue commensurate to dose. F. Average spectral intensity extrapolated from MALDI IMS data (D) for each liver showing a similar dose-response relationship as observed by HPLC-MS in E. Data presented in panels C-F were collected by JMH.

47
Discussion
The observation that ‘882 suppresses fermentation suggested that ‘882 would be toxic to
fermenting S. aureus. This proved true as ‘882 is bacteriostatic to fermenting staphylococci and
C. diphtheriae. The potential therapeutic utility of targeting fermenting S. aureus was verified as
‘882 treatment augments innate immune function and prevents outgrowth of antibiotic resistant
colonies in vitro, and ‘373 treatment reduces S. aureus liver colonization and associated
inflammation in vivo.
The activity of ‘882 against fermenting bacteria has broad therapeutic potential. ‘882 is
bacteriostatic to SCVs, which often emerge during recurrent and persistent S. aureus infections
(63). This may be generalizable across other infectious diseases such as N. gonorrhoeae, E. coli,
P. aeruginosa, and S. Typhimurium which can also spawn SCVs (6, 63). In addition to being
used as a treatment for persistent infections, derivatives of ‘882 could have utility in
combinatorial-therapy with antibiotics that target respiring bacteria. As a proof of principle, co-
treating S. aureus with gentamicin and ‘882 in vitro reduces bacterial viability and the outgrowth
of antibiotic resistant populations. If gentamicin is used to treat S. aureus infections, it is typically
used in combination with other primary antibiotic agents or conjugated to beads and used as the
primary antibiotic agent at the site of osteomyelitis infections. SCVs often arise during the
prolonged antibiotic regimen required for treatment of osteomyelitis. Therefore, it is possible that
an ‘882-gentamicin dual therapy could be used to improve therapy for osteomyelitis by
preventing the generation of SCVs during infection. If ‘882 proves synergistic with other primary
anti-staphylococcal agents such as β-lactams and vancomycin, it is possible that ‘882 could be
used more broadly as an adjuvant to expand the antibiotic armamentarium that is effective against
S. aureus infections.
The majority of bacterial pathogens use some combination of fermentation and
respiration to produce ATP, suggesting that both are important for colonization and persistence
(34). Resisting neutrophil assaults requires S. aureus to rely on fermentation. Adding ‘882 to ex

48
vivo neutrophil-S. aureus mixtures resulted in improved neutrophil killing, suggesting that ‘882
could augment host defense. In vivo, the importance of S. aureus fermentative pathways during
infection is demonstrated by the fact that ‘373 reduces abscess formation and S. aureus growth in
the livers of systemically infected mice. The observed effects of ‘373 on S. aureus pathogenesis
support the notion that the abscess is an anaerobic environment and that bacterial fermentation is
required for efficient colonization (59). Furthermore, the modest effect ‘373 has on S. aureus
pathogenesis in vivo, despite its diminished bacteriostatic activity in vitro, highlights the promise
of more potent, biologically compatible derivatives of ‘882 as novel therapeutics.
In summary, a small molecule has been identified that diminishes fermentative processes,
stimulates endogenous heme biosynthesis and activates the HssRS heme sensor. This molecule
has two-fold utility as both a probe of bacterial physiology and an unconventional therapeutic.
The utility of targeting fermenting bacteria is exemplified by the fact that this compound prevents
the emergence of antibiotic resistance, enhances phagocyte killing, and reduces S. aureus
pathogenesis. Compound ‘882 is a powerful tool not only for studying bacterial heme
biosynthesis and central metabolism but also establishes targeting of fermentation as a viable
antibacterial strategy. Further studies confirming the mechanisms by which ‘882-derived
compounds reduce S. aureus pathogenesis and associated inflammation in vivo will lay the
groundwork for improved strategies for treating recalcitrant infections.

49
CHAPTER IV
A CHEMICAL GENETICS APPROACH FOR DISSECTING THE MECHANISM OF
‘882-MEDIATED ANTIMICROBIAL ACTIVITY
Introduction
Compound ‘882 is toxic to fermenting S. aureus. This has therapeutic utility in either
mono- or dual-therapy regimens. Understanding the source of ‘882 toxicity in fermenting S.
aureus will not only elucidate basic mechanisms of S. aureus energy homeostasis, but may also
identify a cellular target that is sufficient for ablating fermentative growth. Identifying the cellular
target of ‘882 will enable the activity of ‘882 to be more rapidly improved through structure-
activity relationship (SAR) studies. It may also serve as a platform that would support the
identification of alternative strategies for targeting fermenting S. aureus.
While there are several approaches to target identification, chemical genetics approaches
undertaken by other groups have successfully identified small molecule targets by isolating
suppressor mutants (29, 94). If spontaneously ‘882-resistant strains can be identified then their
genomes can be sequenced to identify genetic lesions that support ‘882 resistance.
Here, strains spontaneously resistant to ‘882 toxicity were isolated and characterized. All
suppressor mutants were found to have deficits in SaeRS function. SaeRS is one of the 16 known
TCSs in S. aureus. SaeRS is activated by iron and human neutrophil peptides, suppressed by
heme, and regulates the secretion of exoproteins and other virulence factors (24, 72). The sae
operon consists of saeP, saeQ, saeR, and saeS. SaeRS functions as a prototypical TCS and SaeP
and SaeQ enhance SaeS phosphatase activity toward SaeR (32). SaeRS is constitutively
expressed from the P3 promoter but the P1 promoter drives the expression of all 4 sae ORFs;
SaeR recognizes P1, therefore SaeRS is autoregulatory (24). S. aureus strain Newman SaeS

50
carries an L18P mutation that increases basal SaeS activation and results in hyperactivity of
SaeRS in strain Newman compared to other S. aureus isolates (24, 70). It is this hyperactive SaeS
that is required for ‘882 toxicity in S. aureus. Transcriptional studies of genes regulated by SaeRS
have provided potential leads to the cellular target of ‘882. These studies employing ‘882
suppressor mutants have revealed that the SaeRS TCS is required for ‘882 toxicity. Identifying
the regulatory targets of SaeRS that are the source of ‘882 toxicity will reveal genes essential for
fermentation, provide guidance for SAR studies, and potentially reveal how energy metabolism
and heme homeostasis are coordinated.
Methods
Bacterial strains and growth conditions- Staphylococcus aureus strains Newman wildtype,
∆saeRS, and saeSP18L have been described previously (16, 46). The USA300 type S. aureus
clinical isolate LAC cured of erythromycin-resistance (AH1263) was described previously (5).
All S. aureus strains were grown on tryptic soy agar (TSA) at 37°C for 20-30 h. All
overnights were grown in 5 ml of tryptic soy broth (TSB) in aerobic tubes at 37°C with shaking at
180 rpm unless otherwise noted. Anaerobic growth was obtained by growing cultures in 5 ml of
TSB in aeration tubes at 37°C with shaking at 180 rpm for 15 h. Cultures were diluted to a
theoretical OD600 of 0.0001 and 200 µl were added to 5 µl of additive in a 96 well plate. Cultures
were placed in an anaerobic jar and incubated at 37°C for 18 h.
Unless stated otherwise, vehicle treatment refers to a volume of DMSO comparable to the
volume added containing the described compound (‘882).
Isolation of ‘882 suppressor strains – Triplicate cultures of S. aureus strain Newman were grown
for 15 h at 37°C, 180 rpm in 5 ml of TSB in aeration tubes. The OD600 of the cultures was
measured and then the cultures were back-diluted in TSB to a theoretical OD600 of 0.0001. 100 ul
of the dilute cultures were inoculated onto TSA containing 20 and 40 μM ‘882 and grown under
anaerobic conditions for 36 h. Each suppressor colony was isolated on TSA and confirmed to be

51
resistant to ‘882 on TSA plates under anaerobic conditions. Each isolate was also tested for
catalase activity using H2O2 and Gram-stained. All isolates were catalase positive, Gram positive
cocci.
Whole genome sequencing of ‘882 suppressor strains – Genomic DNA from Newman wildtype
and the five ‘882 suppressor strains 20A, 40A, 20-1, 20-6, and 20-11 was purified and
resuspended to a final concentration of 5 µg in 30 µl of sterile dH2O. It was submitted to the
Vanderbilt Technologies for Advanced Genomics (VANTAGE) core. Shotgun sequencing was
performed on an Illumina MiSeq and genomes were assembled using S. aureus Mu50 as a
reference strain and single nucleotide polymorphisms (SNPs) were reported by VANTAGE. The
validity of each SNP was determined by comparing the suppressor genomes to the assembled
Newman genome using the Integrative Genomics Viewer available from the Broad Institute.
All SNPs were confirmed by Sanger sequencing. Overlapping regions of approximately
1,000 bp were amplified by PCR from the genomes of the suppressor strains using the high-
fidelity DNA polymerase Pfu Turbo (Stratagene). PCR products were checked for amplification
on an agarose gel and column purified using the Qiagen PCR purification kit. DNA was
sequenced by GenHunter and SNPs confirmed using DNASTAR LaserGene8 SeqBuilder and
MegAlign programs.
Hemolysis profiles – Hemolytic profiles of each of the suppressor strains were assessed by
patching each of the suppressor isolates from TSA to a sheep blood agar plate (BAP). BAP were
incubated at 37°C for 24-48 h and inspected for zones of clearing.
Exoprotein profile – Each strain was inoculated from TSA into 15 ml of TSB in a 50 ml conical
tube and grown for 16 h. Cultures were pelleted at 5,900 x g for 5 min and the supernatants were
transferred to a clean tube to be stored at -80°C. Samples were later thawed at room temperature
and syringe filtered through a 0.45 µm membrane. Supernatants were concentrated over a 3 kDa
column for 60 min at 3,200 x g. Samples were mixed 1:1 with 2X SDS-PAGE loading dye and

52
boiled. 25 µl of each sample was resolved on a 15% SDS-PAGE gel. Proteins were visualized
using a Coomassie stain.
anti-SaeQ western blots – Each strain was grown in 5ml of TSB for 15 h under either aerobic or
anaerobic conditions at 37°C. Anaerobic cultures were sub-cultured 1:50 into 10 ml of TSB
containing 4 µM ‘882 or an equivalent volume of DMSO and maintained under anaerobiosis.
Aerobic cultures were sub-cultured 1:100 into 5 ml of TSB containing 40 µM ‘882 or an
equivalent volume of DMSO and maintained under aerobiosis. All sub-cultures were grown at
37°C for 8 h and then pelleted at 3,200 x g for 10 min. The supernatants were removed and the
pellets preserved at -80°C.
Pellets were subsequently thawed at room temperature and then maintained on ice. Each
pellet was resuspended in TSM (100 mM Tris-HCl pH 7, 500 mM sucrose, 10 mM MgCl2) with 3
µl/ml lysostaphin. To compensate for differences in cell density, the aerobic samples were
resuspended in 500 µl and the anaerobic samples were resuspended in 175 µl. The cell walls were
removed by incubating all samples at 37°C for 25 min and then centrifugation at 16,100 x g for
10 min at 4°C. The supernatants were removed and the pellets resuspended in 250 μl of SoluLyse
Reagent for Bacteria (Genlantis) supplemented with 100 µM phenylmethanesulfonylfluoride
(PMSF). Each sample was sonicated at 100% for 10 s using a Branson 4c-15 sonicator and
normalized based on total protein concentration as determined by BCA assay (Pierce). Samples
were diluted to a final concentration of 3 µg/µl in SDS-PAGE loading buffer, boiled, and 20 µl
were resolved on a 15% SDS-PAGE gel. Gels were transferred to nitrocellulose membrane for 1
h at 1000 mA and then blocked overnight at 4°C in 10% non-fat dry milk (NFDM) in tris
buffered saline (TBS: 50 mM Tris-HCl pH 7.5 and 150 mM NaCl).
Membranes were probed with 1:2,500 anti-SaeQ antibody for 1 h at room temperature in
10% NFDM in TBS-T (TBS containing vol/vol 0.01% Tween-20). Membranes were then washed
3 times in TBS-T. An Alexa fluor 660 goat anti-rabbit IgG (Life technologies) was diluted
1:6,000 in TBS-T and used as a secondary antibody. Membranes were probed with the secondary
53
antibody for 1 h and then washed 3 times in TBS-T. Western blots were scanned on an Odyssey
Infrared imaging system (LI-COR).
RNA preparation and microarray analysis – Strains were cultured anaerobically overnight in 5
ml TSB at 37°C. Samples were sub-cultured 1:100 into 10 ml of TSB and maintained at 37°C
under anaerobiosis. At mid-log (5 h after sub-culture), either 10 µl of DMSO or 25 mM ‘882
(final concentration 25 µM) was spiked into the cultures. Cultures were incubated 10 min at 37°C
and then mixed with an equal volume of ice cold 1:1 acetone:ethanol and stored at -80°C. All
samples ranged within 2-6x10⁸ CFU/ml. Replicates were collected on separate days.
Samples were thawed on ice and then pelleted at 10,000 x g for 10 min at 4°C. The
pellets were dried on ice and then resuspended in 500 µl of TE (10 mM Tris-HCl, 1 mM EDTA,
pH 7.6). Samples were transferred to an RNase/DNase free tube containing Lysing Matrix B
(MP). Cells were lysed on a FastPrep-24 bead beater for 20 s at setting 5.0, iced for 5 min, and
then disrupted again for 40 s at setting 4.5. Samples were centrifuged at 16,100 x g for 15 min at
4°C. The upper phase was transferred to a clean 1.5 ml tube and mixed with 350 µl of RLT for
every 100 µl of sample resulting in a final volume of approximately 1.5 ml. Samples were
centrifuged for 15 s at 8,000 x g and the supernatant transferred to a clean tube. 250 µl of ethanol
was added for every 100 µl of sample.
RNA was bound to a Qiagen RNeasy mini column by centrifugation for 15 s at 8,000 x g.
Each column was washed with 350 µl of RW1 buffer and the flow-through discarded. DNA was
removed by adding 10 µl DNase I to 70 µl RDD buffer (Qiagen) and incubated on the column for
20 min at 37°C. Each column was incubated with 350 µl RW1 for 5 min, centrifuged and the
flow-through discarded. 500 µl of RPE was added to each column then the samples were
centrifuged and the flow-through discarded; this was performed twice. The column was
transferred to a clean 1.5 ml tube and the RNA eluted with 40 µl of RNase-free water.
Transcriptional changes were analyzed by microarray analysis in the Dunman laboratory
at the University of Rochester as described previously (4). Two replicates were prepared

54
independently for each condition. Genes with at least a 2-fold change expression, a P-value ≤
0.05 as determined by a Student’s t test, and levels detectable above background based on
Affymetrix algorithms were considered to be differentially regulated.
Results
‘882-resistant colonies are isolated under anaerobiosis. One strategy employed to identify the
cellular target that mediates ‘882 toxicity was the isolation of strains spontaneously resistant to
‘882. If spontaneously ‘882-resistant strains could be isolated, their genomes could be sequenced
to identify genetic lesions that support ‘882 resistance. To select for ‘882-resistant isolates S.
aureus strain Newman was grown on TSA plates containing 20 and 40 μM ‘882. The plates were
grown under anaerobiosis for 36 hours and 15 colonies were identified. Each colony was isolated
on plain TSA grown aerobically and then patched on plain TSA, 10 and 20 μM ‘882
anaerobically. Nine of the 15 colonies remained resistant to ‘882 on solid agar under
anaerobiosis. All nine isolates are catalase positive and appear to be S. aureus by Gram stain.
These data reveal that S. aureus generates resistance to ‘882 in anaerobic conditions with a
frequency of approximately 1 in 10-7 CFUs.
The genetic stability and heritability of the ‘882 resistance was tested by sequentially
passing each strain four times at 37°C. After passaging, the nine strains were assessed for ‘882
resistance in liquid media under anaerobiosis. All passaged strains were resistant to ‘882 (Figure
14).

55
Figure 14. ‘882-resistance is heritable and stable. Wildtype S. aureus Newman (NM) and 9 strains isolated on toxic concentrations of ‘882. The first two digits of each name indicate the μM concentration of ‘882 from which the colony was isolated. All strains were grown in triplicate, aerobically overnight, and back-diluted to a theoretical optical density at 600 nm (OD600) of 0.0001 in TSB. In a 96 well plate, 200 μl of each diluted culture was added to a stock of ‘882, so that the final concentration was 40 μM, or an equivalent volume of DMSO (vehicle). The plate was grown in an anaerobic jar and the OD600 was recorded after 18 h of growth. Growth was analyzed relative to cultures grown with vehicle alone. Shown are data representative of three independent experiments. Error bars represent one standard deviation from the mean.

56
‘882-resistant isolates have genetic lesions in the sae operon. Since the ‘882 resistance of all
nine isolates is heritable and stable, the identities of the genetic mutations that provide‘882
resistance were pursued. The genomes of five isolates (20A, 40A, 20-1, 20-6, and 20-11) along
with the parental Newman strain were sequenced at the VANTAGE core. Shotgun sequencing
was performed on an Illumina MiSeq and genomes were assembled using S. aureus Mu50 as a
reference strain. Each strain only had non-synonymous mutations in the sae operon (Figure 15).
The obsevation that mutations were only found in the sae operon suggested that the four
remaining unsequenced strains (20-3, 20-4, 20-7, and 20-8) may also have lesions in the sae
operon. To test this hypothesis, the sae locus of each strain was amplified by PCR and analyzed
by Sanger sequencing. Mutations in the sae locus were also identified in 20-3 and 20-8 (Figure
15). In total, six unique lesions in the sae operon were identified. Isolates 20A and 40A both had
a point mutation 15 base pairs (bp) 5’ to the saeR translation start site. This could either affect
saeR expression or mutate SaeQ (G146D). Isolate 20-3 also had a single point mutation, which
occurs in the TATA box of promoter 1 (P1). Only one isolate, 20-8, had a nucleotide duplication.
In this strain, 15 bp in the receiver domain of SaeR was duplicated. The three remaining isolates
20-1, 20-6 and 20-11 all had deletions. Two deletions occurred in the receiver domain of SaeR as
isolates 20-1 and 20-6 each have unique 9 and 15 bp deletions, respectively. Strain 20-11 has 198
bp of the DNA binding domain of SaeR deleted. Intriguingly, all mutations either maintained the
same number of bp in the sae operon or affected the size by a multiple of three. That is, no frame
shift mutations occurred. The significance of this observation remains to be understood.
Nonetheless, the clustering of mutations in one regulatory locus of S. aureus Newman suggests
that the activity of SaePQRS is altered in ‘882-resistant strains and impacts ‘882 susceptibility.

57
Figure 15. Genetic lesions present in ‘882-resistant isolates. The sae locus of nine spontaneously ‘882-resistant isolates were sequenced by Sanger sequencing to confirm and identify any mutations in the locus. A schematic of the sae locus is depicted above with the two promoters (P1 and P3) marked with a bent arrow and the two terminators marked with a hairpin. Three isolates: 20-3, 20A, and 40A (orange) had a point mutation. Three isolates: 20-1, 20-6, and 20-11 (red) had deletions. And one isolate, 20-8, had a 15 base pair duplication. The number following the colon denotes the base pair location in the Newman genome affected by the mutation.

58
SaePQRS is functionally inactivated in ‘882-resistant mutants. SaePQRS was first identified
as a S. aureus TCS that regulates the secretion of exoproteins and toxins (25, 26). To examine the
activity of SaePQRS in ‘882-resistance the hemolytic activity and exoprotein profiles of each
isolate were visualized (Figures 16A and B). All ‘882-resistant isolates, including those strains
which have no identifiable genetic lesions in the sae operon, had decreased hemolysis and visibly
reduced exoprotein abundance. These data suggest that SaePQRS is inactivated in all ‘882-
resistant strains.
Since SaePQRS is an autoregulated TCS, inactivating any component of the TCS should
result in reduced protein abundance of all components of the TCS. In order to determine if SaeRS
is active in the ‘882-resistant strains, the abundance of SaeQ in each isolate was determined by
western blot. SaeQ was completely absent in all ‘882-resistant isolates, indicating that each strain
had a loss of SaePQRS function (Figure 16C). The loss of SaePQRS activity in ‘882-resistant
strains suggests that an active SaePQRS is required for ‘882 toxicity.
Newman SaeS is necessary for ‘882 toxicity. The observation that all spontaneous ‘882-
resistant strains phenocopied the isogenic saeRS deletion strain (∆saeRS) pointed to the
hypothesis that a functionally active SaePQRS signaling system is required for ‘882 to be toxic
under anaerobic growth conditions. To test this hypothesis, the sensitivity of an isogenic saeRS
deletion strain (∆saeRS) to ‘882 was assessed by anaerobic growth analyses and in fact ∆saeRS is
resistant to ‘882 (Figure 17). The necessity of SaeRS signaling for ‘882-induced heme
accumulation and HssRS activation was also assessed. ‘882 still induces heme accumulation and
HssRS activation even in the absence of SaeRS (data not shown). These data agree with the
observation that ‘882 is toxic even in the heme biosynthesis deletion strain hemB::ermC and
strengthen the model that heme is not the cause of ‘882-induced anaerobic growth inhibition.

59
Figure 16. ‘882-resistant isolates have a loss in SaePQRS activity. S. aureus strain Newman, Newman ∆saeRS, and 9 isogenic strains resistant to anaerobic ‘882 toxicity were screened for SaePQRS function. A. Each strain was spotted onto a sheep blood agar plate and incubated at 37°C for 24 h. B. All strains were grown overnight in TSB and their supernatants concentrated over a 3 kD spin column. Concentrated supernatants were separated on a 15% SDS-PAGE gel and visualized using Coomassie dye. C. Whole cell lysates from aerobic cultures were blotted with anti-SaeQ antisera.

60
While determining the toxicity of ‘882 toward other staphylococcal species it was noted
that ‘882 is not toxic to the prevalent community acquired, methicillin-resistant S. aureus (CA-
MRSA) strain USA300 LAC (Figure 17). Newman SaeS has a single nucleotide point (SNP)
mutation that switches the amino acid residue at position 18. In most strains, including USA300,
residue 18 is leucine but in Newman it is proline (24). This mutation results in a hyperactive
SaeS. Noting that ‘882 is not toxic to USA300 and USA300 does not have the SaeS mutation
guided the hypothesis that the hyperactive SaeS activity in Newman is necessary for ‘882
toxicity. To test this hypothesis, Newman SaeS was isogenically converted from proline at
residue 18 to a leucine (46). This SaeS-repaired strain is not sensitive to ‘882 toxicity under
anaerobiosis (Figure 17). Together, these data indicate that a hyperactive SaeS is required for
anaerobic ‘882 toxicity.

61
Figure 17. Newman SaeS is necessary for ‘882 toxicity. Newman (NM) wildtype, ∆saeRS, and SaeS P18L (CYL111481), along with USA300 were analyzed for sensitivity to ‘882. Each strain was analyzed in triplicate. Overnights were diluted to a theoretical optical density at 600 nm (OD600) of 0.0001. Each culture was grown in the presence of vehicle (an equal volume of DMSO) and 10 μM ‘882. Cultures were grown at 37°C in an anaerobic jar for 18 h. At the end of the time course the cultures were resuspended and OD600 was recorded. Each ‘882 treated culture was normalized to the vehicle controls. Error bars correspond to one standard deviation from the mean.

62
‘882 and oxygen impact SaeQ abundance. The necessity of Newman SaeS for ‘882 toxicity
points to the hypothesis that the source of ‘882 toxicity is either SaePQRS or an Sae-regulated
target. If ‘882 is targeting an Sae-regulated product specifically under anaerobiosis, this suggests
that oxygen may impact Sae activity. To determine the effect of ‘882 and oxygen on SaePQRS
activity, SaeQ levels were probed by western blot in both Newman and USA300.
In the presence of vehicle alone, growth in an anaerobic environment reduced SaeQ
abundance in both Newman and USA300. In USA300, however, SaeQ was undetectable, while
Newman retained a low level of SaeQ (Figure 18). This is in agreement with the report that
Newman SaePQRS is hyperactive. What is particularly intriguing is that ‘882 treatment increases
SaeQ abundance under both aerobic and anaerobic conditions in Newman, but suppresses SaeQ
levels aerobically and does not affect the already absent SaeQ anaerobically in USA300 (Figure
18). These data suggest that aberrant activation of SaePQRS under anaerobiosis by ‘882 is toxic
to the bacteria. This leads to two primary hypotheses for the cause of ‘882 toxicity. First,
SaePQRS over-expression alone under anaerobiosis is stressful to S. aureus. Or second, the effect
of ‘882 treatment on an Sae-regulated target is the source of toxicity. The latter hypothesis is
supported by several observations. First, SaeRS regulates many cellular target including genes
involved in energy homeostasis. Second, SaeRS is a TCS specific to staphylococci, yet ‘882 is
toxic to non-staphylococcal species (Figure 7). And finally, SaeQ is modestly expressed at basal
levels in Newman without overt detriment to anaerobic growth suggesting that SaeRS expression
under anaerobiosis alone is not sufficient to inhibit anaerobic growth.

63
Figure 18. Oxygen and ‘882 impact SaeQ abundance. A. Newman and B. USA300 LAC were grown under aerobic and anaerobic conditions for 8 h. Media was supplemented with either vehicle (DMSO) or ‘882 (4 μM-anaerobic and 40 μM-aerobic). Whole cell lysates were normalized to protein content and resolved on a 15% SDS-PAGE gel. Proteins were transferred to a nitrocellulose membrane and probed with anti-SaeQ antibody.

64
Genes differentially regulated by SaePQRS under anaerobiosis. As it seems most likely that
an Sae-regulated target contributes to anaerobic ‘882 toxicity, identifying the genes differentially
regulated by SaePQRS under anaerobiosis could reveal the source of ‘882 toxicity. To detect
genes regulated by SaePQRS S. aureus Newman wildtype and ∆saeRS were grown anaerobically
to mid-log phase. The samples were pulsed with either vehicle (DMSO) or 10 μM ‘882 for 10
min. The RNA from these samples was isolated and differential gene expression was analyzed by
microarray.
SaeRS is a major regulatory system in S. aureus so it is not surprising that many genes
were differentially regulated in the saeRS mutant. The positive regulation of many virulence
factors, exoproteins and proteases by SaeRS has been well described and were reproduced in our
microarray (Table 2) (43). The most striking gene clusters regulated by SaeRS were those
involved in amino acid metabolism (Table 2). Operons involved in cysteine, methionine,
aspartate, lysine, leucine, isoleucine, valine, glutamate, and histidine metabolism are all positively
regulated by SaeRS. Transporters of oligopeptides and amino acids are also positively regulated
by SaeRS. Gene clusters involved in protein synthesis, mevalonate and THF synthesis are
repressed by SaeRS activity. It is also interesting to note that SaeRS function impacts several
genes involved in energy homeostasis including two fermentation products: acetoin and lactate.
By microarray analysis a total of 81 transcripts were observed to be positively regulated
by SaeRS. Of these transcripts, 70 are annotated as coding transcripts and 64 are available in the
Network on Antimicrobial Resistance in S. aureus (NARSA) defined transposon library. Many
positively regulated gene targets are in shared operons and therefore of the 64 transposon mutants
available in the NARSA library, 35 are in independent operons. Furthermore, 30 transcripts are
negatively regulated by SaeRS and 25 of these are annotated to coding transcripts. Of these 25
genes, 13 are available in the NARSA library and 11 are independent operons. If the exotoxins,
proteases and other virulence factors are assumed to not be the source of ‘882 toxicity, then there

65
are 36 operons already disrupted in the NARSA defined mutant library that may be the source of
‘882 toxicity.
To begin to dissect the factors regulated by SaeRS that may be the source of ‘882
toxicity, transposon insertion mutants in these 36 operons of interest will be transduced from the
NARSA library (USA300 background) into S. aureus strain Newman. Each transductant will then
be assessed for sensitivity to ‘882 under anaerobiosis. If anaerobic toxicity is due to ‘882
interacting with a gene positively regulated by SaeRS then the deletion of the target would be
predicted to result in ‘882-resistance. Alternatively, if ‘882 is causing toxicity through a gene
repressed by SaeRS then the deletion would be expected to be unable to grow under anaerobic
conditions.
In order to begin investigating the potential role of each operon in ‘882 toxicity, seven of
these operons have been transduced into S. aureus strain Newman, these include ilvD, oppB, hom,
asd, NWMN_2616, pknB, and budA1. As a negative control the toxin hlgC was also transduced
into Newman. Each gene was confirmed to be disrupted by sequencing and then the sensitivity of
each strain to ‘882 under anaerobic conditions was assessed. None of these eight operons affect
anaerobic sensitivity to ‘882; although pknB has a modest growth defect under anaerobiosis. It is
possible that this serine/threonine kinase may contribute to S. aureus sensitivity to ‘882 or
anaerobic growth in general. The data collected on these eight transposon mutants rule out
acetoin synthesis, oligopeptide transport, branched chain amino acids, aspartate and lysine
metabolism as the source of ‘882 toxicity. The involvement of the remaining 29 operons remains
to be assessed.
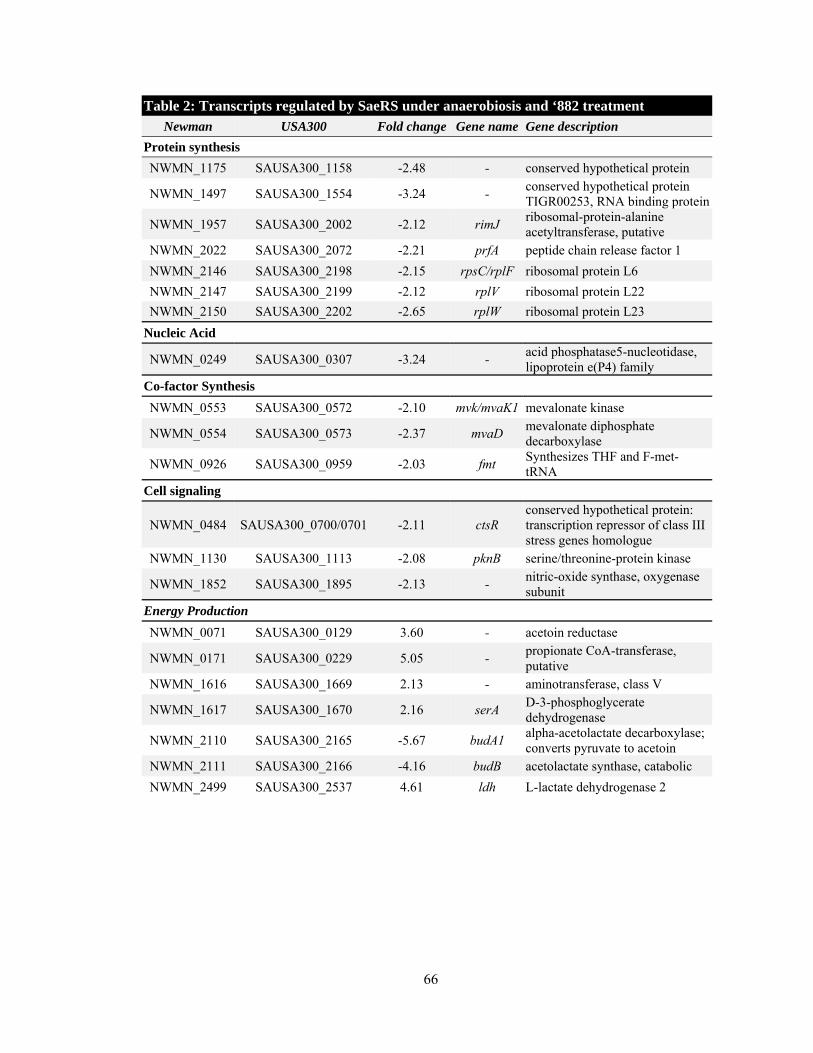
66
Table 2: Transcripts regulated by SaeRS under anaerobiosis and ‘882 treatment Newman USA300 Fold change Gene name Gene description
Protein synthesis
NWMN_1175 SAUSA300_1158 -2.48 - conserved hypothetical protein
NWMN_1497 SAUSA300_1554 -3.24 - conserved hypothetical protein TIGR00253, RNA binding protein
NWMN_1957 SAUSA300_2002 -2.12 rimJ ribosomal-protein-alanine acetyltransferase, putative
NWMN_2022 SAUSA300_2072 -2.21 prfA peptide chain release factor 1
NWMN_2146 SAUSA300_2198 -2.15 rpsC/rplF ribosomal protein L6
NWMN_2147 SAUSA300_2199 -2.12 rplV ribosomal protein L22
NWMN_2150 SAUSA300_2202 -2.65 rplW ribosomal protein L23
Nucleic Acid
NWMN_0249 SAUSA300_0307 -3.24 - acid phosphatase5-nucleotidase, lipoprotein e(P4) family
Co-factor Synthesis
NWMN_0553 SAUSA300_0572 -2.10 mvk/mvaK1 mevalonate kinase
NWMN_0554 SAUSA300_0573 -2.37 mvaD mevalonate diphosphate decarboxylase
NWMN_0926 SAUSA300_0959 -2.03 fmt Synthesizes THF and F-met-tRNA
Cell signaling
NWMN_0484 SAUSA300_0700/0701 -2.11 ctsR conserved hypothetical protein: transcription repressor of class III stress genes homologue
NWMN_1130 SAUSA300_1113 -2.08 pknB serine/threonine-protein kinase
NWMN_1852 SAUSA300_1895 -2.13 - nitric-oxide synthase, oxygenase subunit
Energy Production
NWMN_0071 SAUSA300_0129 3.60 - acetoin reductase
NWMN_0171 SAUSA300_0229 5.05 - propionate CoA-transferase, putative
NWMN_1616 SAUSA300_1669 2.13 - aminotransferase, class V
NWMN_1617 SAUSA300_1670 2.16 serA D-3-phosphoglycerate dehydrogenase
NWMN_2110 SAUSA300_2165 -5.67 budA1 alpha-acetolactate decarboxylase; converts pyruvate to acetoin
NWMN_2111 SAUSA300_2166 -4.16 budB acetolactate synthase, catabolic
NWMN_2499 SAUSA300_2537 4.61 ldh L-lactate dehydrogenase 2

67
Table 2 cont’d: Transcripts regulated by SaeRS under anaerobiosis and ‘882 treatment Newman USA300 Fold change Gene name Gene description
Amino acid metabolism
Cys/Met
NWMN_0011 SAUSA300_0012 2.60 - homoserine O-acetyltransferase, putative
NWMN_0348 SAUSA300_0357 2.82 metE
5-methyl-tetrahydropteroyltriglutamate-homocysteine methyltransferase (metE)
NWMN_0351 SAUSA300_0360 2.08 - trans-sulfuration enzyme family protein
NWMN_0426 SAUSA300_0435 3.28 - ABC transporter, ATP-binding protein; predicted to transport methionine
NWMN_0427 SAUSA300_0436 3.19 - ABC transporter, permease protein
NWMN_0428 SAUSA300_0437 3.04 - ABC transporter, substrate-binding protein
NWMN_2021 SAUSA300_2071 -2.13 - SAM-dependent modification methylase, HemK family
Asp
NWMN_1239 SAUSA300_1224 2.05 thrA aspartate kinase
NWMN_1241 SAUSA300_1226 2.39 hom homoserine dehydrogenase
NWMN_1242 SAUSA300_1227 2.71 thrC threonine synthase
NWMN_1243 SAUSA300_1228 2.89 thrB homoserine kinase
Lys
NWMN_1305 SAUSA300_1286 2.18 asd aspartate-semialdehyde dehydrogenase
NWMN_1306 SAUSA300_1287 2.39 dapA dihydrodipicolinate synthase
NWMN_1307 SAUSA300_1288 2.65 dapB dihydrodipicolinate reductase
NWMN_1308 SAUSA300_1289 2.74 dapD 2,3,4,5-tetrahydropyridine-2,6-dicarboxylate N-succinyltransferase
Val, Leu, Ile
NWMN_1960 SAUSA300_2005 4.45 ilvD dihydroxy-acid dehydratase
NWMN_1961 SAUSA300_2006 4.48 ilvB acetolactate synthase, large subunit, biosynthetic type
NWMN_1963 SAUSA300_2008 4.94 ilvC ketol-acid reductoisomerase
NWMN_1964 SAUSA300_2009 4.64 leuA 2-isopropylmalate synthase
NWMN_1965 SAUSA300_2010 4.85 leuB 3-isopropylmalate dehydrogenase
NWMN_1966 SAUSA300_2011 4.27 leuC 3-isopropylmalate dehydratase, large subunit
NWMN_1967 SAUSA300_2012 3.97 leuD 3-isopropylmalate dehydratase, small subunit
NWMN_1968 SAUSA300_2013 2.56 ilvA2 threonine dehydratase

68
Table 2 cont’d: Transcripts regulated by SaeRS under anaerobiosis and ‘882 treatment Newman USA300 Fold change Gene name Gene description
Glu
NWMN_0145 SAUSA300_0202 2.33 - peptide ABC transporter, permease protein
NWMN_0147 SAUSA300_0204 2.29 ggt gamma-glutamyltranspeptidase; releases cysteine from glutathione
NWMN_0436 SAUSA300_0445 2.42 gltB glutamate synthase, large subunit
NWMN_0437 SAUSA300_0446 2.72 gltD glutamate synthase, small subunit
His
NWMN_0692 SAUSA300_0708 2.68 hisC histidinol-phosphate aminotransferase
Cell Envelope
NWMN_0193 SAUSA300_0253 -2.59 scdA cell wall synthesis
NWMN_1145 SAUSA300_1128 -2.01 - cell division protein FtsY, putative; FtsY recognizes signal peptide for secretion
NWMN_1342 SAUSA300_1324 -2.92 - membrane protein, putative
NWMN_1309 SAUSA300_1291 2.95 hipO peptidase, M20/M25/M40 family
NWMN_1310 SAUSA300_1292 3.09 alr2 alanine racemase family protein, pyridoxal 5'phosphate dependent
Transport
NWMN_0856 SAUSA300_0887 2.43 oppB oligopeptide ABC transporter, permease protein
NWMN_0857 SAUSA300_0888 2.27 oppC oligopeptide ABC transporter, permease protein
NWMN_0858 SAUSA300_0889 2.47 oppD oligopeptide ABC transporter, ATP-binding protein
NWMN_0859 SAUSA300_0890 2.86 oppF oligopeptide ABC transporter, ATP-binding protein
NWMN_0860 SAUSA300_0891 2.69 oppA oligopeptide ABC transporter, oligopeptide-binding protein
NWMN_2303 SAUSA300_2349 -2.27 - formate/nitrite transporter family protein
NWMN_2500 SAUSA300_2538 2.32 - amino acid permease
NWMN_2581 SAUSA300_2616 2.75 - cobalt transport family protein
NWMN_2582 SAUSA300_2617 3.67 - ABC transporter, ATP-binding protein
NWMN_2584 SAUSA300_2619 3.61 - conserved hypothetical protein

69
Table 2 cont’d: Transcripts regulated by SaeRS under anaerobiosis and ‘882 treatment Newman USA300 Fold change Gene name Gene description
Virulence factors and exoproteins
NWMN_0362 SAUSA300_0370 68.74 - staphylococcal enterotoxin, putative
NWMN_0388 SAUSA300_0395 12.85 ssl1nm exotoxin 3, putative
NWMN_0389 SAUSA300_0396 23.62 ssl2nm/set7 exotoxin 1, putative
NWMN_0390 SAUSA300_0397 7.81 ssl3nm exotoxin 8
NWMN_0392 SAUSA300_0399 5.48 ssl5nm exotoxin 3
NWMN_0393 SAUSA300_0400 5.81 ssl6nm exotoxin
NWMN_0395 SAUSA300_0402 21.35 ssl8nm exotoxin 12
NWMN_0396 SAUSA300_0403 29.33 ssl9nm exotoxin 5, putative
NWMN_0397 SAUSA300_0404 14.54 ssl10 exotoxin 4, putative
NWMN_0758 SAUSA300_0774 53.71 empbp/ssp secretory extracellular matrix and plasma binding protein
NWMN_1067 SAUSA300_1053 60.29 - hypothetical protein, formyl peptide receptor-like 1 inhibitory protein
NWMN_1246 SAUSA300_1232 2.25 katA Catalase
NWMN_1075 SAUSA300_1059 14.62 - exotoxin 1, putative
NWMN_1076 SAUSA300_1060 22.31 - exotoxin 4, putative
NWMN_1077 SAUSA300_1061 69.11 - exotoxin 3, putative
NWMN_1872 SAUSA300_1917 137.5 map map protein, authentic frameshift
NWMN_1926 SAUSA300_1973 64.33 hlb phospholipase C
NWMN_2318 SAUSA300_2365 94.07 hlgA gamma-hemolysin, component A
NWMN_2320 SAUSA300_2367 135.74 hlgC gamma hemolysin, component C
NWMN_2321 SAUSA300_2368 47.03 hlgB gamma hemolysin, component B
Hypothetical
NWMN_0150 SAUSA300_0207 2.45 - M23/M37 peptidase domain protein
NWMN_0206 SAUSA300_0266 -2.5 - hypothetical protein
NWMN_0402 SAUSA300_0409 114.43 - hypothetical protein
NWMN_0896 SAUSA300_0929 2.1 - hypothetical protein
NWMN_2370 SAUSA300_2417 2.39 - transporter, putative
NWMN_2579 SAUSA300_2614 2.06 - hypothetical protein
NWMN_2608 SAUSA300_2642 -2.71 - conserved hypothetical protein

70
Discussion
This chemical genetics approach to understanding the mechanism of ‘882 toxicity has
begun to reveal a source of anaerobic toxicity for S. aureus. The successful isolation of nine ‘882-
resistant strains, each strain null for SaeRS activity, has led to the conclusion that the SaeRS TCS
is required for ‘882-induced anaerobic toxicity, but not heme biosynthesis and HssRS activation.
Furthermore, it was noted that USA300 LAC was resistant to ‘882 toxicity, while Newman was
sensitive. Converting Newman SaeS proline 18 to leucine, which is present in USA300 LAC
SaeS, provided resistance to ‘882 indicating that the hyperactivity of Newman SaeS is required
for ‘882 toxicity. Finally, it was determined that ‘882 activates SaeRS expression in Newman and
represses SaeRS expression in USA300 LAC. It is likely that the up-regulation of SaeRS in
Newman by ‘882 is a source of stress during anaerobic growth.
The toxicity of ‘882 toward other bacterial species that do not encode SaeRS points to the
hypothesis that a cellular factor impacted by SaeRS activity is the target of ‘882. To identify
genes differentially regulated by SaeRS, microarray analysis was performed to identify
transcriptional changes in Newman and Newman ∆saeRS under anaerobiosis. In total, 95 coding
transcripts, which comprise 74 unique operons, were differentially regulated by SaeRS. The next
step is to identify if any of these genes are involved in ‘882 toxicity. To begin to assess the
contribution of each transcriptional target in anaerobic ‘882-toxicity, the 36 genes that are not
predicted to be toxins but are available in the NARSA transposon library are being transduced
into Newman to determine if they contribute to sensitivity to ‘882 toxicity or anaerobic growth.
The first seven genes tested do not contribute to ‘882 toxicity. The remaining genes will be
analyzed in the future.
It is possible that the target of ‘882 is an essential gene and is therefore not present in the
NARSA transposon library. In fact, it is quite likely, as suppressor mutations have only been
identified in the saePQRS locus. It is possible that the loss of saePQRS titrates the target of ‘882
to levels that still allow growth but prevent ‘882-induced toxicity. If this is the case, a strain of

71
Newman will be generated that contains two copies of the saePQRS operon. This strain can then
be used to select for ‘882 suppressor strains. Isolating ‘882 resistance in this strain would require
two mutations in two independent sae operons in order for the bacteria to become resistant to
‘882, which would have a much lower frequency of occurence. This may allow other suppressor
mutants to be isolated that have mutations distinct from the saePQRS locus.
The requirement of Newman SaeRS for ‘882 toxicity is intriguing. The SaeRS TCS
positively regulates hemolysins and has been reported to be repressed upon heme exposure and
activated upon iron limitation, thus implicating SaeRS in contributing to iron and heme
homeostasis; these observations were made in an S. aureus strain encoding SaeS Leu18 (72).
Despite increasing intracellular levels of heme, ‘882 actually increases Newman SaeRS activity.
As expected, ‘882 does repress SaeRS activity in USA300, which encodes SaeS Leu18. It is
possible that the hyperactivity of the SaeS Pro18 encoded by Newman may override heme-
induced repression of SaeRS signaling. It could be this inappropriate regulation of SaeRS in
response to endogenous heme levels that results in ‘882 toxicity. Nonetheless, the inappropriate
response of SaeRS to endogenous heme levels is unlikely to be the source of ‘882 toxicity as
heme biosynthesis is not required for ‘882 toxicity (Figure 4B). That is, ‘882 is still toxic to
anaerobic S. aureus without activating endogenous heme biosynthesis. These data suggest that it
is neither heme nor the regulation of SaeRS by heme that is the source of ‘882 toxicity.
Nonetheless, HssRS and SaeRS are two heme responsive TCSs in S. aureus. HssRS
seems to solely sense heme while SaeRS activity is also impacted by human neutrophil peptides,
oxygen, and iron. It is possible that SaeRS and HssRS may have a complex signaling network
that integrates information on the nutrient status of the cell and the external environment to
coordinate the metabolic and virulence programs of the bacteria with these signals. Perhaps ‘882
twitches a thread in this complex web of energy homeostasis to exert its effects on heme
biosynthesis and anaerobic growth.

72
Further work towards identifying the source of ‘882-induced anaerobic toxicity is critical.
To further confirm that it is the hyperactivity of SaeS Pro18 that generates ‘882 toxicity, the
Newman SaeRS has been cloned into the ∆saePQRS USA300 genome (5). This strain provides
the opportunity to investigate the sufficiency of the Newman SaePQRS in conferring ‘882
sensitivity to USA300 LAC. Pinpointing the source of ‘882 toxicity in S. aureus may identify
pathways that, when manipulated appropriately, limit S. aureus fermentative growth. Specifically
targeting fermentative growth does have utility as there are circumstances in which S. aureus
relies on fermentation to resist host defenses, antibiotics and successfully colonize its host
(Chapter III). Therefore, identifying this ‘Achilles heel’ of S. aureus fermentation will allow for
future work to improve ‘882 activity and develop new methods for targeting anaerobic growth.

73
CHAPTER V
PROBING A BACILLUS ANTHRACIS SIGNALING NETWORK WITH VU0120205
Introduction
Two-component signaling systems (TCSs) are the primary way bacteria sense and adapt
to changes in their environment. TCSs are present in nearly all sequenced bacterial genomes;
most species encode 20-30 TCSs, while others carry upwards of 200-300 putative TCSs (78). The
classic bacterial TCS system is thought to function in a linear fashion, in that each HK has a
defined input and that results in a specific output from the RR. The appreciation that interactions,
both beneficial and detrimental, occur between TCSs has become more prevalent. This ‘cross-
talk’ has been previously defined as the “communication between two pathways that, if
eliminated, would leave intact two distinct, functioning pathways” (41). When cross-talk between
two signaling systems benefits an organism this is referred to as ‘cross-regulation’ (41).
Bacillus anthracis is predicted to encode approximately 45 TCSs. In B. anthracis, all
HKs and RRs share at least 20% identity with other encoded HKs and RRs. This conservation is
manifested primarily in the domains involved in the phosphotransfer event of the signaling
pathway. It is the input domains of HKs and the output domains of RRs that are more variable.
This allows TCSs to sense a variety of environmental signals to enact an array of outputs, while
the fundamental mechanisms of HK autophosphorylation and phosphotransfer to the RR remain
central to the function of the system. The mechanisms by which a single HK maintains fidelity to
its cognate RR in a bacterial cell expressing 20-300 other HK-RR pairs is a major question in
TCS research.
The current understanding of how HK-RR signaling purity is maintained implicates
molecular recognition, HK phosphatase activity, and substrate competition as the primary
mechanisms for ensuring specificity (62). That is to say molecular recognition dictates that each

74
HK-RR pair has co-evolved amino acid residues that drive a strong preference for
phosphotransfer from the HK to its cognate RR. This phenomenon is observable in vitro as most
HKs have a strong kinetic preference for their cognate RR over other RRs encoded in the same
genome (79). Furthermore, if a HK is a bi-functional kinase/phosphatase, its phosphatase activity
is specific for its cognate RR (28). This buffers against non-specific phosphorylation of the
cognate RR and limits the activation of the pathway (62). Specificity is further maintained by a
high ratio of RR:HK, which would essentially allow the cognate RR to outcompete other RRs for
binding to its cognate HK (8, 62). Specificity may also be influenced by the temporal expression
and spatial localization of TCSs (41).
Much focus has been on the maintenance of specificity at the HK-RR level and the
general conclusions have been that cross-talk between non-cognate HK-RR pairs is possible, but
atypical. It may be more likely for cross-talk to occur at other points in the signal transduction
pathway. At the transcriptional level, multiple RRs may influence overlapping sets of genes (41).
Alternatively, a protein product regulated by a RR may itself be a transcriptional regulator or
phosphatase that impinges on the regulatory outputs of other TCSs (41). Essentially it has become
clear that bacterial signaling networks are not purely insulated linear systems that have a singular
response to a particular input. Rather the complex interactions of TCSs at both the HK-RR and
post-RR regulatory levels allow bacteria to integrate multiple signals to generate the appropriate
biological response.
Bacillus anthracis is an environmental pathogen that inhabits various environments
ranging from the soil to a myriad of mammalians hosts. To survive and persist in adverse
environments, B. anthracis also possesses the ability to sporulate. Sporulation is a complex
process regulated by a complex TCS-like phosphorelay system. During B. subtilis sporulation, at
least five different HKs impinge upon a single response regulator (86). The complex
phosphorelay pathways employed by the Bacilli during sporulation hint at the possibility that this

75
genus may be particularly adept at integrating environmental signals to initiate an appropriate
response as well as insulating against unwanted cross-talk between signaling systems.
To further study the activation of the HssRS TCS, the activity of the S. aureus HssRS
activators were screened for activation of the hrt promoter (phrt) in B. anthracis. Since B.
anthracis is closely related to S. aureus, it was hypothesized that small molecule activators of S.
aureus HssRS may also activate B. anthracis HssRS. The top 14 hits from the HTS were assessed
for XylE activity in B. anthracis, and some were found to increase phrt activity. Compound
VU0120205 (‘205) became of particular interest as it activates phrt independent of HssRS. This
resulted in the identification of a second TCS that cross-talks with HssRS. The new HK is called
BAS1817 and its cognate RR is BAS1816. Data presented in this chapter characterize BAS1816-
17 as a TCS and dissect the bi-directional mechanisms by which HssRS and BAS1816-17
influence each other. Finally, in an effort to understand the native function of BAS1816-17 other
small molecule activators of this TCS are identified. In summary, this chapter uses chemical
biology to probe a new B. anthracis signal transduction network to understand the integration of
heme homeostasis with other environmental signals.
Methods
Bacterial strains and growth conditions – B. anthracis strain Sterne was used for all experiments
(87). It was grown in BHI or LB. All plasmid construction was performed in E. coli DH5α or
TOP10. To move plasmids from E. coli to B. anthracis they were first transformed into E. coli
K1077 (37). Proteins were expressed in E. coli BL21DE3 pREL. Antibiotic concentrations used
were ampicillin 100 μg/ml in E. coli (pET15b constructs), chloramphenicol 10 μg/ml in B.
anthracis (XylE reporter assays) and 34 μg/ml in E. coli (protein expression) and kanamycin 20
μg/ml in B. anthracis and 40 μg/ml in E. coli (knockout generation).
Preparation of heme and other compound stocks – 10 mM heme stocks (Fluka) were prepared
daily in 0.1 M NaOH. A 50 mM stock of ‘205 was prepared in DMSO and stored at -20°C. A 20

76
mM stock of NDGA was prepared in ethanol and stored at -20°C. Stocks of 250 μM vancomycin
and 100 mM chlorpromazine were prepared in water and stored at -20°C. A 1 M stock of sodium
phosphate monobasic was prepared in water, brought to a pH of 7, and stored at room
temperature. A stock of 20 mg/ml of targocil was prepared in DMSO and stored in the dark at
4°C.
Genetic manipulation of B. anthracis – Electroporations and mutant generation were performed
as previously described (83). Electroporations were also performed with the following
modifications. DNA purified for K1077 E. coli was eluted in 10 mM Tris-HCl, pH 8.5 and this
solution was used for electroporations. After the B. anthracis competent cells were prepared, the
optical density at 600 nm (OD600) was determined in phosphate buffered saline (PBS, 137 mM
NaCl, 2.7 mM KCl, Na2HPO4 10 mM, KH2PO4 1.8 mM, pH 7.4). Cells were flash frozen in
liquid nitrogen and thawed on ice for electroporations. For electroporation the competent cells
were diluted in SMG (0.5 M D-sorbitol, 0.5 M D-mannitol, 10% glycerol) to a final OD600 of 8.0.
To 50 μl of cells 0.5 – 5 μl of DNA was added (approximately 3 μg total). Cells were incubated
with DNA in a pre-chilled 1 mM cuvette for 1 minute on ice and then electroporated using the
conditions described previously (83). Cells were recovered in 1 ml BHI + 0.5 M D-sorbitol for 3
h at 30°C, 200 rpm in aeration tubes. All knockouts were generated without an antibiotic cassette.
Instead, 1,000 bp (including 100 bp of the target gene) from the 5’ and 3’ flanking regions of the
gene targeted for deletion were cloned into the pLM4 knockout vector to generate clean
knockouts.
Generation of xylE reporter plasmids – The BAS1814 promoter xylE reporter construct was
generated in a pOS1 background (74). The BAS1814 promoter-xylE fusions was generated by
PCR-SOE (31) . This resulted in a seemless fusion between the BAS1814 promoter and the xylE
reporter gene. PCR-SOE DNA was digested with BamHI and EcoRI and ligated into pOS1.
Mutagenesis of the BAS1814 DR was carried out by inverse PCR-based mutagenesis. The
selected mutations were incorporated on one primer and a second non-overlapping, non-

77
mutagenic primer was designed to amplify in the opposite direction. The primers were 5’
phosphorylated by T4 polynucleotide kinase (NEB) and the parental plasmid amplified using the
high-fidely DNA polymerase Pfu Turbo. The amplified DNA was blunt end ligated and
transformed into E. coli. Mutagenized constructs were verified by DNA sequencing.
XylE assays – XylE assays were performed as described previously with the following exceptions
(83). All cultures were grown overnight in 5 ml LB/chloramphenicol at 30°C, 180 rpm. Bacteria
were sub-cultured into 4 ml LB/chloramphenicol and grown as indicated: either 1:100 sub-culture
and growth for 6 h at 37°C, 180 rpm or 1:1,000 sub-culture and growth for 24 h at 37°C, 180
rpm.
Generation of protein purification constructs – BAS1816 was amplified from genomic DNA by
Pfu Turbo using the 3rd ATG as the start site. Inverse PCR was used to insert a SacII site in the
multiple cloning site (MCS). Briefly, two complementary, overlapping primers that amplify in the
opposite direction were designed, which included the addition of the SacII site after the BamHI
restriction. The PCR product was transformed into E. coli and successful incorporation of the
SacII site was confirmed by sequencing. This inverse PCR generated pLOLA (pET15b.SacII) and
resulted in the MCS changing from: CATATGCTCGAGGATCCGGCTGCT to
CATATGCTCGAGGATCCGGCCGCGGCTGCT. The BAS1816 PCR product was digested
with SacII and BamHI-HF (NEB) and ligated into pLOLA. The intracellular domain (ICD) (bp
221 to the end) of BAS1817 was amplified using Pfu Turbo and digested with SmaI. The vector
pET15b was digested with XhoI and purified using the Qiagen gel purification kit. Blunt ends
were generated on pET15b by treating the cut vector with DNA Polymerase I, Klenow fragment
(NEB). The Klenow fragment was inactivated, the vector was column purified and blunt-end
ligated to the digested BAS1817 ICD. The mutation of BAS1816 D56N and BAS1817 ICD
H137A were generated by inverse PCR as described above. All constructs result in the generation
of N-terminal hexahistidine-tagged proteins and were transformed into BL21 DE3 pREL.

78
Protein purification – Protein purifications were carried out as described previously with the
following modifications (82). All proteins were induced in 0.5 mM IPTG, cells were lysed for 5
min on an EmulsiFlex C3 (Avestin) at a peak PSI of 20,000 and the lysates were centrifuged at
20,000 x g for 1 h at 4°C. BAS1817 ICD and HssR ICD and their corresponding mutants were
purified in TSB containing 10 mM imidazole and eluted in 75 mM imidazole in TBS. BAS1816
and HssR and their corresponding mutants were purified in TSB containing 1 mM EDTA, 10%
glycerol, and 10 mM imidazole and eluted in 50 mM imidazole in TBS. BAS1816 was induced
after 2 h of growth at 16°C in 0.5 mM IPTG and a second time 5 h later with an equal volume of
IPTG to bring the final concentration to 1 mM.
Autophosphorylation and phosphotransfer assays – Autophosphorylation assays were performed
as described previously with the following modifications (83). Ten μl autophosphorylation
reactions were assembled with HssS and BAS1817 ICDs and their corresponding mutatnts were
used at a final concentration of 5 μM (640 μg/ml). For HssS 10 μCi of [γ-32P]-ATP was used and
due to the high autophosphorylation of BAS1817, 5 μCi of [γ-32P]-ATP was used. All reactions
were incubated at 37°C for 30 min. To analyze the phosphotransfer of each HK to each RR, the
HKs were autophosphorylated as described above in a 30 μl reaction volume. After the HKs
autophosphorylated for 30 min, 10 μl were sampled into 2X SDS-PAGE loading buffer. To the
remaining 20 μl, 3 μl of 100 μM RR was added for a final concentration of approximately 10 μM.
HK-RR mixtures were incubated for 5 min and then 10 μl was sampled into 2X SDS-PAGE
loading buffer. Samples were analyzed as described previously (83). To examine the preferential
phosphotransfer of each HK for each RR, a 220 μl autophosphorylation reaction was run for each
HK. Serial dilutions of each RR were prepared so that when 2 μl of the RR stock was added to
9.5 μl of phosphorylated HK, the final RR concentration was 20, 10, 5, 2.5, 1.25, 0.625, 0.31,
0.16, 0.08, and 0.04 μM. Each RR concentration was incubated with each phosphorylated HK for
30 sec, after which 10 μl of 2X SDS-PAGE buffer was added. The samples were stored on ice
and analyzed as described previously (83).

79
Biolog Phenotypic Microarray Screen – Phenotypic Microarray plates (PM 1-20) and IF-0a
GN/GP (1.2X) were purchased from Biolog. Preparation of PM inoculating fluids was adapted
from the manufacturer’s recommendations for B. subtilis. The following solutions were prepared:
PM-A = 800 mM tricarballylic acid, pH 7.1; PM-B = 240 mM MgCl2 and 120 mM CaCl2; PM-C
= 3 mM L-arginine and 6 mM L-glutamic acid; PM-D = 0.5 mM L-cystine pH 8.5 and 1 mM 5’-
UMP; PM-E = 0.6% yeast extract; PM-F = 0.6% tween-80; PM-G = 300 mM D-glucose and 600
mM pyruvate. In all instances pH was adjusted with NaOH and all solutions were filter sterilized
and stored at 4°C. 12X PM additive for PM-1,2 = 5 ml each of PM-B, PM-C, PM-E, PM-F, and
15 ml each of PM-D and sterile water. 12X PM additive for PM-3,6,7 = 5 ml each of PM-B, PM-
E, PM-F, PM-G and 15 ml each of PM-A and PM-D. 12X PM additive for PM-4 = 5 ml each of
PM-B, PM-C, PM-E, PM-F, PM-G and 15 ml of PM-A and 10 ml of sterile water. 12X PM
additive for PM-5 = 5 ml each of PM-B and PM-G and 15 ml of PM-A and 25 ml of sterile water.
12X PM additive for PM-9-20 = 5 ml each of PM-B, PM-E, PM-F, PM-G and 30 ml of sterile
water. The inoculating solution for each plate consisted of 20 ml of IF-0A GN/GP (1.2X), 2 ml of
12X PM additive (specific for each plate, described above), and 20 μl of 10 mg/ml
chloramphenicol. B. anthracis p14.xylE was grown overnight on solid media and the colonies
were inoculated into the inoculating solution to a final OD600 of approximately 0.6. The
inoculating solution with the bacterial suspension was aliquoted 100 μl into each well of a 96 well
PM plate. A single well was also inoculated with 1.67 μl of 50 mM ‘205 as a positive control; the
well was selected based on chemical redundancy with other wells on the same plate to avoid
masking a potential hit. Plates were covered with a Kim wipe to allow oxygen exchange and
incubated at 37°C, 180 rpm. At 3 h and 5 h, wells with significant liquid loss were supplemented
with 50 μl of sterile water. After 6-7 h, each PM plate was centrifuged at 3,200 x g for 10 min.
The supernatant was removed by pipetting and the plate frozen at -80°C. To analyze the XylE
activity, the PM plates were thawed and cells were lysed by the addition of 50 μl of 2 mg/ml
lysozyme in 100 mM potassium phosphate buffer (pH 8.0), 10% (v/v) acetone. Cells were

80
incubated at 37°C for 30 min. To each well 25 μl of 100 mM potassium phosphate (pH 8.0), 0.2
mM pyrocatechol was added immediately before assaying XylE activity (85). Each PM plate was
screened twice, using a different well for a ‘205 positive control each time.
Results
Compound VU0120205 (‘205) activates the phrt direct repeat independent of HssR.
Compound ‘205 was evaluated for HssRS activation in B. anthracis by quantifying the activation
of the hrt promoter fused to the xylE reporter gene (phrt.xylE). This compound has negligible
activation of phrt in wildtype B. anthracis; although, some activation could be masked by the
high basal phrt expression in B. anthracis (Figure 19A and B) (83). What is most notable about
this compound is that the phrt promoter was still activated upon ‘205 exposure by nearly 100-
fold, while all activation of phrt by heme was absent in ΔhssR (Figure 19A). The activation of
phrt by ‘205 was ablated when the four nucleotides required for HssR recognition in the direct
repeat (DR) of the hrt promoter were mutated (Figure 19). These data suggest that there is at least
one other regulator in B. anthracis that stimulates hrt expression through the hrt DR and that this
regulator is activated by ‘205. This hypothesis is supported by the observation that there is a
second DR in B. anthracis that is closely related to the DR in phrt (12).

81
Figure 19. ‘205 activates the B. anthracis hrt promoter through two pathways that depend on the direct repeat. A. Wildtype (wt) and ΔhssR B. anthracis Sterne were transformed with the hrt promoter fused to the xylE reporter gene (phrt.xylE). The direct repeat (DR) of the hrt promoter-xylE fusion was mutated (phrtDR.xylE) and transformed into wt. Each strain was grown in triplicate in the presence of either vehicle (DMSO), 1 µM heme, or 50 µM ‘205 for 24 h. XylE activity in cell lysates was quantified. Shown are data representative of at least three replicates. Error bars represent one standard deviation from the mean. B. Structure of VU0120205 C. Genomic locus (top) and DR (bottom) of BAS1814-17. In the inset is an alignment of the direct repeats found in the hrt promoter (phrt) regions of S. aureus and B. anthracis and the BAS1814 promoter (p14) region in B. anthracis. Highlighted in bold are nucleotides previously shown to be required for HssR recognition of the phrt DR (83). Underlined in red are nucleotides that differ between p14 and phrt. Superscript numbers indicate the nucleotide distance from the start site. Each DR remains 18 base pairs from the predicted ribosome binding site.

82
This alternative DR retains the four nucleotides required for HssR binding, but differs
from phrt by four other nucleotides (Figure 19C) (83). This previously uncharacterized DR is
located in the promoter region (p14) of the BAS1814-17 operon. BAS1814 and BAS1815 are
conserved in the Bacilli genus and are predicted to function together as an ABC transporter.
BAS1816 and BAS1817 are a putative TCS in B. anthracis where BAS1817 is the histidine
kinase (HK) and BAS1816 is the response regulator (RR) that is predicted to regulate p14 (12).
Furthermore, protein BLAST analysis of BAS1816 in B. anthracis identifies HssR as the most
similar RR in B. anthracis with 87% coverage and 52.5% identity. A similar analysis of
BAS1817 identifies HssS as the most similar HK in B. anthracis with 81.8% coverage and 40.7%
identity. It is intriguing that HssRS is most closely related to the BAS1816-17 TCS in B.
anthracis and that they share a very similar DR. These observations lead to the hypothesis that
BAS1816-17 is a functional TCS that responds to ‘205 and regulates both p14 and phrt.
Compound ‘205 activation of p14 and phrt is mediated through BAS1816-17. To determine if
BAS1816 and BAS1817 auto-regulate the BAS1814-17 operon in response to ‘205 treatment, the
BAS1814 promoter was fused to the xylE reporter gene (p14.xylE) and transformed in wildtype,
ΔhssRS, ΔBAS1816-17, and ΔhssRS/BAS1816-17. These strains were grown in the presence of
vehicle (DMSO) or 50 µM ‘205 and then XylE activity was quantified. The BAS1814 promoter
(p14) is activated in the presence of ‘205 in a manner that requires BAS1816-17, not HssRS
(Figure 20A). The four nucleotides in the p14 DR, which are shown in bold in Figure 19C and
were previously determined to be required for HssR activation of the hrt promoter were mutated
on the p14.xylE reporter plasmid and transformed into wildtype B. anthracis. Mutation of these
four nucleotides ablated ‘205 activation of p14 (Figure 20A). Together these data reveal that ‘205
activates BAS1816-17, which auto-regulates the p14 DR through four conserved nucleotides.
These experiments were repeated using 2 µM heme as the activating compound instead of ‘205.
Heme does not activate p14 at this concentration (Figure 20B).

83
In Figure 19A it was observed that ‘205 activates phrt independently of HssR but
requiring the phrt DR. To determine if this activation of the hrt promoter was due to BAS1816-17
activity, the phrt.xylE reporter plasmid was transformed into ΔBAS1816-17 and
ΔhssRS/BAS1816-17. The high basal activation of phrt masked any ‘205-induced activation of
this promoter in ΔBAS1816-17; however, the ‘205-induced activation of phrt in ΔhssRS was
ablated in the quadruple ΔhssRS/BAS1816-17 knock-out (Figure 20C). These data reveal that the
‘205-induced activation of phrt is indeed mediated through BAS1816-17.
B. anthracis HssRS has already been well-characterized to activate phrt in response to
heme treatment. To determine if BAS1816-17 responds to heme and regulates the hrt promoter,
the activation of phrt in ΔBAS1816-17 upon treatment with 1 μM heme was quantified and found
to be similar to wildtype (Figure 20D). This indicates that BAS1816-17 does not activate the hrt
promoter in response to heme.
In summary these experiments identify BAS1816-17 as a new TCS that is activated by
compound ‘205. BAS1816-17 can activate both the phrt and p14 promoters. Reciprocally, HssRS
is activated by heme and regulates phrt (83). At the concentrations used in these experiments
neither p14 nor BAS1816-17 were responsive to heme. These two TCSs present a unique
opportunity to study the mechanisms by which similar TCSs either integrate or maintain their
signaling purity and may provide insight into how bacteria adapt to diverse environmental
signals. Due to the similarity of the DRs and RRs of BAS1816-17 and HssRS, it is possible that
an activated RR may be able to act at both DRs. Alternatively, cross-signaling may occur due to
phosphorylation of a non-cognate RR by a HK. The role of RR-DR and HK-RR interactions in
maintaining signaling purity will be investigated in subsequent data sections.
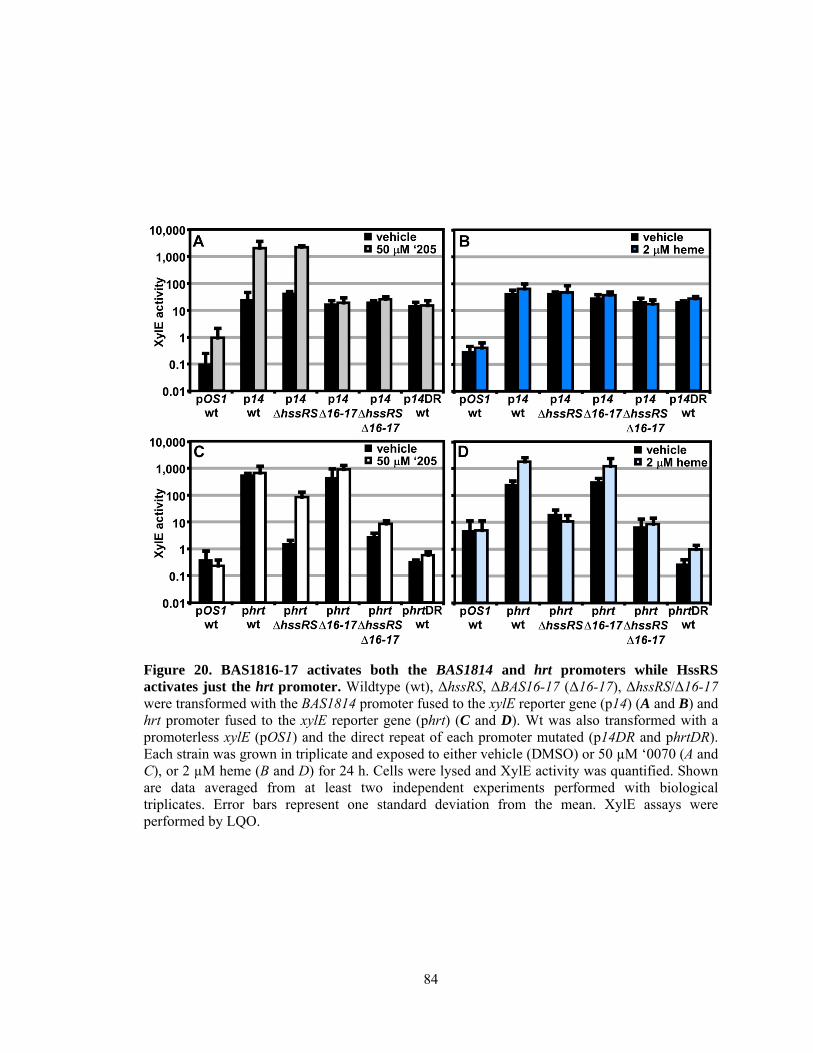
84
Figure 20. BAS1816-17 activates both the BAS1814 and hrt promoters while HssRS activates just the hrt promoter. Wildtype (wt), ΔhssRS, ΔBAS16-17 (Δ16-17), ΔhssRS/Δ16-17 were transformed with the BAS1814 promoter fused to the xylE reporter gene (p14) (A and B) and hrt promoter fused to the xylE reporter gene (phrt) (C and D). Wt was also transformed with a promoterless xylE (pOS1) and the direct repeat of each promoter mutated (p14DR and phrtDR). Each strain was grown in triplicate and exposed to either vehicle (DMSO) or 50 µM ‘0070 (A and C), or 2 µM heme (B and D) for 24 h. Cells were lysed and XylE activity was quantified. Shown are data averaged from at least two independent experiments performed with biological triplicates. Error bars represent one standard deviation from the mean. XylE assays were performed by LQO.

85
The direct repeat determines the response of each promoter region. The four nucleotides of
the phrt DR previously shown to be required for HssR-phrt DR interactions are conserved in the
p14 DR. However, four other nucleotides of the DR discriminate the phrt DR from the p14 DR.
This leads to the hypothesis that the four nucleotides unique to p14 are sufficient to differentially
regulate p14 as compared to phrt. To test this hypothesis, the four nucleotides unique to the p14
DR were incorporated into the phrt.xylE reporter construct to make phrt.14DR.xylE and the four
nucleotides unique to the phrt DR were switched into the p14.xylE reporter construct to generate
p14.hrtDR.xylE. These constructs were transformed into wildtype B. anthracis and then the
strains were exposed to either heme or ‘205. The response of each promoter to heme and ‘205
was quantified by measuring the XylE activity in each strain.
As predicted, swapping the four unique nucleotides in each DR switches the
responsiveness of each promoter to heme and ‘205 (Figure 21). Therefore these four unique
nucleotides in the p14 DR are sufficient to determine the response of the promoter to
environmental stimuli. One exception to this result is the loss of the high basal activation of phrt
when the phrt DR was placed in p14. This result, when considered in conjunction with previous
observations that the high phrt background is also lost upon hssR deletion and phrt DR mutation
(Figure 19A and 20C-D), suggests that the high basal activation of phrt is due to the interaction of
HssR with the phrt DR in the context of phrt.
It is important to note that since only wildtype B. anthracis was investigated in this
experiment, the bacteria could be treated with a higher concentration of heme (5 µM). This
concentration of heme activates p14 and phrt.14DR in wildtype B. anthracis. Since this strain has
all TCSs intact the activation of p14 by heme suggests that cross-talk from HssRS to BAS1816-
17 does occur naturally.

86
Figure 21. The direct repeat in each promoter determines specificity in vivo. Wildtype B. anthracis Sterne was transformed with the hrt promoter fused to the xylE reporter gene (phrt) and the BAS1814 promoter fused to the xylE reporter gene (p14). Furthermore, the direct repeat of each promoter was swapped into the other reporter plasmid (phrt.14DR and p14.hrtDR) and transformed into wildtype B. anthracis. Each strain was grown in triplicate and exposed to either vehicle (DMSO), 5 µM heme, or 50 µM ‘0070 for 24 h. Cells were lysed and XylE activity was quantified. Data are averaged from at least 4 independent experiments. Error bars represent one standard deviation from the mean. Plasmids were generated by DLS.

87
Cross-talk at the response regulator-direct repeat level is limited. It is remarkable that four
nucleotides allow for discrete regulation of two very similar DRs. Swapping the DRs between
promoter regions, however, does not indicate whether each RR influences its cognate DR
exclusively. To investigate if a RR impacts the recognition of its non-cognate DR, each RR was
individually mutated and then promoter activation was analyzed in the mutant strains.
First the influence of BAS1816 on the phrt DR was examined. The phrt.xylE and
p14.hrtDR.xylE reporter constructs were transformed into wildtype, ΔhssR, and ΔhssR/1816
strains. BAS1816-17 was stimulated with 50 µM ‘205 and the vehicle DMSO was used as a
negative control, see Figure 22A for a scheme of the experimental design. As expected, activation
of phrt was observed upon deletion of ΔhssR and was lost in ΔhssR/1816 (Figure 22C). The
elimination of the high basal activity of phrt in p14.hrtDR revealed low levels of phrt DR
recognition in wildtype in addition to ΔhssR; nearly all activation was lost in ΔhssR/1816 (Figure
22C). These data utilizing both reporter constructs suggest that BAS1816 can recognize the phrt
DR; however, the high basal activity of wildtype phrt may limit BAS1816 influence on its non-
cognate DR under native conditions.
Next the ability of HssR to regulate p14 was probed. Using an analogous strategy, the
p14.xylE and phrt.14DR.xylE reporter constructs were transformed into wildtype, Δ1816, and
ΔhssR/1816. HssRS was stimulated with 1 µM heme and the vehicle 0.1 M NaOH was used as a
negative control, see Figure 22B for a scheme of the experimental design. Although there is only
weak activation of the p14 in wildtype B. anthracis, more robust p14 activation has been
observed in wildtype B. anthracis treated with 5 µM heme (Figure 21 and 22D). The weak
activation of p14.xylE in wildtype is lost upon deletion of BAS1816 and unchanged in
ΔhssR/1816 (n.b. the decrease in XylE activity in this strain upon heme treatment is most likely
due to the heme sensitivity of ∆hssR) (Figure 22D). When the p14 DR is placed in the context of
phrt, clear activation of phrt.14DR is observed in ΔBAS1816 and lost in ΔhssR/1816. This
suggests that HssR may be able to recognize the p14 DR, however, it requires some other factor

88
only found on phrt. This could be either a cis-acting DNA sequence or trans-acting enhancer
element.
In summary, these studies investigating the RR-DR interactions between two closely
related TCSs suggest that BAS1816 may recognize both DRs, but other cellular factors may
insulate this cross-talk at the RR-DR level. For example BAS1816 can recognize the phrt DR
only in the absence of HssR or when the DR is placed in the context of p14 (Figure 22A). This
suggests that when the phrt DR is in the context of phrt, both the presence of HssR and the
increased activity of HssR at the phrt DR limits cross-talk from BAS1816. Conversely, p14 in
wildtype B. anthracis is activated only at higher concentrations of heme (Figure 21). At non-toxic
concentrations of heme, HssR does not seem to recognize the p14 DR unless it is in the context of
phrt (Figure 22B), suggesting that other cis- or trans-acting factors enhance HssR activity
specifically at phrt and therefore limit HssR activation of the p14 DR. These observations suggest
that activation of p14 at higher heme concentrations may be beneficial to the bacteria. It is
possible that the putative ABC transporter BAS1814-15 may contribute to heme tolerance in B.
anthracis.
BAS1816-17 is a two-component system that cross-phosphorylates with HssRS. To begin to
explore the HK-RR interactions and to demonstrate that BAS1816-17 is a novel, functional TCS,
the intracellular domain of BAS1817 and the full length BAS1816 were each N-terminally tagged
with a hexa-histidine sequence, heterologously expressed in E. coli and purified over a Ni-NTA
column. The full length BAS1816 as predicted based on the sequence annotated in the Sterne
genome is highly insoluble when expressed. Within the first 81 nucleotides there are three
predicted ATG translation start sites. When BAS1816 was aligned with homologs from other
Bacilli it became apparent that the third ATG is most likely the true transcription start site.
Expressing BAS1816 with the N-terminus beginning at the third predicted translation start site
and therefore lacking the first predicted 26 amino acids resulted in pure, soluble RR.

89
Figure 22. Cross-signaling at the response regulator-direct repeat level. A. and B. Shown are schema of the experimental design in panels C. and D., respectively. C. Wildtype (WT) B. anthracis, ΔhssR, and ΔhssR/Δ1816 were transformed with the hrt promoter fused to the xylE reporter gene (phrt.xylE) and the hrt DR swapped into the BAS1814 promoter (p14.hrtDR.xylE). The six strains were each treated with either 50 µM ‘205 or an equivalent volume of the vehicle DMSO. Cultures were grown for 24 h and harvested. Cells were lysed and XylE activity was quantified. D. Wildtype (WT) B. anthracis, Δ1816, and ΔhssR/Δ1816 were transformed with the BAS1814 promoter fused to the xylE reporter gene (p14.xylE) and the BAS1814 DR swapped into the hrt promoter (phrt.14DR.xylE). The six strains were each treated with either 1 µM heme or an equivalent volume of the vehicle 0.1 M NaOH. Cultures were grown for 24 h and harvested. Cells were lysed and XylE activity was quantified. In all instances, data are averaged from at least two independent experiments performed with biological triplicates. Error bars represent the standard error of the mean. Strains were generated by DLS.

90
The conserved residues predicted to be required for phosphorelay were identified in
BAS1816 and BAS1817 using the NCBI protein viewer. The conserved aspartate at amino acid
position 56 in the receiver domain of BAS1816 was mutated to an asparagine and the conserved
histidine at amino acid position 137 in the DHp domain of BAS1817 was mutated to an alanine
(Figure 23A and B). The analogous HssS and HssR wildtype and phosphorelay-deficient proteins
were also purified as described previously (Figure 23A and B) (83).
First the ability of each histidine kinase to autophosphorylate was determined by
incubating the purified HKs in the presence of γ-32P labeled ATP and then resolving the proteins
on an SDS-PAGE gel. Each HK was autophosphorylated in the presence of ATP and these
activities required the conserved phosphate-accepting histidines (Figure 23C).
Next the ability of each HK to transfer the phosphate to each RR was investigated. The
HKs were first autophosphorylated and then co-incubated with each RR for 5 min. The
phosphorylation state of each protein was visualized by resolving each HK-RR pair on an SDS-
PAGE gel and exposing the samples to a phosphorscreen (Figure 23D). The percent of
phosphotransfer from each HK to each RR was quantified (Figure 23E). Each HK preferentially
phosphorylates its cognate RR, although there is significant cross-phosphorylation to each non-
cognate RR. It does not seem that HssS and BAS1817 are generally capable of phosphorylating
any RR as the E. coli QseB RR is unable to be phosphorylated by either HK (data not shown).
This suggests that it may be the similarity between HssR and BAS1816 that may permit cross-
phosphorylation by the HKs.

91
Figure 23. BAS1816-17 and HssRS are two-component systems that cross-phosphorylate. Each HK (A) and RR (B) was expressed in E. coli and purified by Ni-affinity purification. The dialyzed elutions were run on an SDS-PAGE gel to assess purity. C. Autophosphorylation of the histidine kinases and the corresponding histidine mutants. Each protein was incubated with ATP [γ-32P] for 30 minutes, sampled for SDS-PAGE analysis (top) and quantified by phosphorimager analysis (bottom). Shown is the average of four replicates and the error bars represent the standard deviation. (D and E) Each histidine kinase phosphorylates each response regulator. Histidine kinases were autophosphorylated as described in C and then co-incubated with the indicated response regulator for 5 minutes, sampled for SDS-PAGE analysis in D, and quantified by phosphorimager analysis in E. Shown in E is the average of three replicates and the error bars represent one standard deviation from the mean. These experiments were performed by DLS and JC.

92
The hierarchy of HssS and BAS1817 phosphotransfer to each response regulator. To further
delineate the relative preference each HK has for each RR, the concentration of each RR was
diluted over a concentration range of 2-logs. Each RR concentration was then incubated with
auto-phosphorylated HssS or BAS1817 for 30 sec and then resolved on an SDS-PAGE gel
(Figure 24A). The percent of phosphotransfer was quantified by dividing the intensity of the
P~RR band over the intensity of the total density in each lane. Plotting the percent of
phosphotransfer against the RR concentration identifies a clear hierchary in the preference for
phosphorelay in vitro, such that the phosphotransfer of BAS1817 to BAS1816 is most efficient,
followed by HssS to HssR, then BAS1817 to HssR, and finally HssS to BAS1816 (Figure 24B).
The question now remains if any cross-phosphorylation occurs in vivo and if so, if the cross-
phosphorylation events have a biological function in the adaptation of B. anthracis to
environmental changes.
Selective cross-talk at the histidine kinase-response regulator level in vivo. Since cross-
phosphorylation between each HK to each RR is observed in vitro, the presence of HK-RR cross-
signaling in vivo was next investigated. To study the influence of BAS1817 phosphorylation on
HssR activity in vivo, an ΔhssS/Δ1816 double knock-out strain was generated to eliminate any
influence HssS or BAS1816 may have on HssR or BAS1817 (Figure 25A). This ΔhssS/Δ1816
double knock-out strain was transformed with phrt.xylE and p14.hrtDR.xylE, which has the phrt
DR inserted in p14. If phosphotransfer from BAS1817 to HssR occurs in vivo, then activation of
phrt.xylE is predicted to be observed in ΔhssS/Δ1816 upon ‘205 treatment (Figure 25A). This is
not the case (Figure 25C). When BAS1817 is stimulated by compound ‘205 phrt is not activated
in ΔhssS/Δ1816, which indicates that despite observing strong phosphotransfer from BAS1817 to
HssR in vitro, BAS1817 to HssR phosphorelay does not occur in vivo (Figure 25C). The
mechanism for maintaining this signaling purity in the absence of HssS and BAS1816 remains
unclear.

93
Figure 24. Each histidine kinase preferentially phosphorylates its cognate response regulator in vitro. A serial dilution of response regulator concentrations ranging from 20 µM to 39 nM was prepared. Each histidine kinase was autophosphorylated as described earlier and then mixed with each response regulator concentration for 30 sec. Phosphotransfer reactions were quenched with SDS-PAGE loading buffer and resolved on a gel. A representative image is shown in A. Data from at least 4 replicates were average and plotted in B. Error bars represent one standard deviation from the mean. Experiments were performed by DLS and JC.

94
Figure 25. Cross-signaling at the histidine kinase-response regulator level. A. and B. Shown are schema of the experimental design in panels C. and D., respectively. C. Wildtype (WT) B. anthracis and ΔhssS/Δ1816 were transformed with the hrt promoter fused to the xylE reporter gene (phrt.xylE) and the hrt DR swapped into the BAS1814 promoter (p14.hrtDR.xylE). The four strains were each treated with either 50 µM ‘205 or an equivalent volume of the vehicle DMSO. Cultures were grown for 24 h and harvested. Cells were lysed and XylE activity was quantified. D. Wildtype (WT) B. anthracis and ΔhssR/Δ1817 were transformed with the 14 promoter fused to the xylE reporter gene (p14.xylE) and the 14 DR swapped into the hrt promoter (phrt.14DR.xylE). The four strains were each treated with either 1 µM heme or an equivalent volume of the vehicle 0.1 M NaOH. Cultures were grown for 24 h and harvested. Cells were lysed and XylE activity was quantified. In all instance, data are averaged from at least two independent experiments performed with biological triplicates. Error bars represent the standard error of the mean.

95
The analogous phosphotransfer from HssS to BAS1816 was tested by the same strategy.
A Δ1817/ΔhssR double knock-out strain was generated and transformed with p14.xylE and
phrt.14DR.xylE, which has the p14 DR inserted in phrt. If phosphotransfer from HssS to
BAS1816 occurs in vivo, then the p14.xylE is predicted to be activated in Δ1817/ΔhssR in the
presence of heme (Figure 25B). This does indeed occur, suggesting that in vivo HssS may cross-
phosphorylate BAS1816 to stimulate activation of p14 (Figure 25B and D). These data suggest
that at low heme concentrations the signaling integrity of HssRS activation of phrt may be
maintained by the higher phosphotransfer preference of HssS to HssR (Figure 24), the enhanced
activity of HssR at phrt (Figure 21), and perhaps even phosphatase activity of BAS1817 on
BAS1816. However, at higher heme concentrations the mechanism by which heme activates p14
may occur either through cross-phosphorylation from HssS to BAS1816 (Figure 24) or activation
of p14 by HssR (Figure 22B). It is intriguing that the ‘least preferred’ cross-phosphorylation from
HssS to BAS1816 in vitro is observed in vivo, but the parallel cross-phosphorylation from
BAS1817 to HssR is not. Perhaps there is a certain threshold of HK activation that must be
achieved in order to observe cross-phosphorylation. It is possible that heme-induced activation of
HssS exceeds this threshold, but ‘205-induced stimulation of BAS1817 does not. Perhaps with
more potent BAS1817 activators cross-phosphorylation from BAS1817 to HssR may be
observed.

96
The identification of BAS1816-17 activators. Since compound ‘205 is not likely to be an
environmental signal typically encountered by B. anthracis, the native function of BAS1816-17
was interrogated. Identifying the native function of BAS1816-17 would not only inform the
potential function of the BAS1814-15 ABC transporter, but may also reveal why HssRS and
BAS1816-17 interact. To identify other signals that activate BAS1816-17 a chemical biology
approach was undertaken, this time employing the Biolog Phenotypic Microarray.
The first twenty 96 well plates (PM1-20) were purchased from Biolog’s Phenotypic
Microarray Library for Microbial Cells. Each well contains a different compound that may
differentially impact the growth and behavior of bacteria. The first ten plates interrogate different
nutrient environments (e.g. carbon sources) and the second ten plates probe different chemical
sensitivities (e.g. antibiotics). Wildtype B. anthracis transformed with p14.xylE was grown in
each of these plates and activation of p14 was monitored by XylE assay. The screen was repeated
twice and the twelve molecules that activated p14.xylE were repurchased from commercial
vendors. The specific activation of BAS1816-17 was tested by exposing both wildtype and
Δ1816-17 p14.xylE to each compound in a concentration range that spanned at least 2-logs and
did not inhibit bacterial growth. Four compounds exhibit specific activation of p14.xylE in a
manner that requires BAS1816-17.
The most potent activator identified is nordihydroguaiaretic acid (NDGA), which is even
more active than ‘205 (Figure 26A). NDGA is an antioxidant isolated from the creosote bush; the
long life of the bush is attributed to the antimutagenic effects of NDGA (45). Several other
activities have been ascribed to the molecule as well including anti-inflammatory and antiviral
activities (45).
The second best activator of BAS1816-17 identified in the phenotypic microarray is
chlorpromazine (Figure 26B). Chlorpromazine is used to treat allergies and psychoses in humans,
but it also sensitizes humans to light (15). This effect is thought to result from photoactivation of
chlorpromazine and subsequent intercalation into DNA (54). Not surprisingly, chlorpromazine is

97
mutagenic in the Ames test (55). Chlorpromazine uncouples oxidative phosphorylation and has
also been implicated in disrupting passive transport across mitochondrial membranes (65, 81). In
bacteria, most work has been focused on the chemorepellent activity of chlorpromazine to
Bacillus subtilis (56). Though one study notes that chlorpromazine inhibits cell wall biogenesis in
Bacillus megaterium (38).
Both low concentrations of vancomycin and high concentrations of sodium phosphate
(pH 7) were found to weakly activate BAS1816-17 (Figure 26D and E). The concentration range
of vancomycin is limited due to the antibiotic nature of the compound. Vancomycin is best
known for inhibiting Gram positive cell biosynthesis, but at low concentrations it has also been
shown to disrupt membrane integrity (95). The anion sodium phosphate only showed weak
activity at high concentrations, beyond which significant growth defects were observed.
The description of the biological activity of each of these compounds in the literature,
leads to the hypothesis that BAS1816-17 may be activated by cell envelope stressors. Recently, a
small molecule inhibitor of S. aureus wall techoic acid (WTA) synthesis called targocil was
identified (89). Targocil inhibits the transport of the nascent WTA from inside the membrane to
the outer surface. This not only results in a loss of cell wall integrity, but may also cause an
accumulation of negative charges near the inner leaflet due to the accumulation of poly(ribitol-
phosphate) components of WTA inside the cell (89). The activity of targocil on the Gram positive
cell envelope indicated that this small molecule may also activate BAS1816-17. To test this
hypothesis the activation of p14.xylE in wildtype and Δ1816-17 B. anthracis in response to
targocil was investigated. Targocil does specifically activate the BAS1814 promoter in a manner
that requires BAS1816-17 (Figure 26C). A microarray performed on targocil treated S.aureus
revealed the transcriptional up-regulation of hrtAB 12-fold (10). This was the second most up-
regulated operon next cwrA a small peptide of unknown function that is a reporter of cell wall
stress (10).

98
Figure 26. Five novel activators of BAS1816-17. Wildtype (WT) B. anthracis and ΔBAS1816-17 were transformed with the 14 promoter fused to the xylE reporter gene (p14.xylE). The strains were treated with either 50 µM ‘205 or a range of concentrations of the following compounds: A. nordihydroguaiaretic acid (NDGA), B. chlorpromazine, C. targocil, D. vancomycin, and E. sodium phosphate pH 7. Cultures were grown for 6 h and harvested. Cells were lysed and XylE activity was quantified. In all instances, data are averaged from at least two independent experiments performed with biological triplicates. Error bars represent the standard error of the mean. The primary Biolog screen was performed by PB.

99
In summary, five novel activators of BAS1816-17 have been identified, including one
compound, NDGA, that is more potent than ‘205. The common mechanism by which these
molecules activate BAS1816-17 remains to be determined. The current understanding of the
mode of action of each of these compounds, points to the hypothesis that BAS1816-17 may be
activated by alterations in the cell envelope, perhaps disruptions in the electrochemical potential
across the membrane. To identify common cellular events that result in BAS1816-17 activation,
RNASeq analysis of B. anthracis treated with vehicle, ‘205, NDGA, chlorpromazine and targocil
will be employed. Theoretically, there should be shared transcriptional responses to each of the
BAS1816-17 activators since they all stimulate this new TCS. Identifying common transcriptional
changes upon treatment with these compounds will provide insight to the native cellular signal
that activates BAS1816-17.
Discussion
In this chapter a small molecule activator of S. aureus HssRS was used to identify a new
TCS in B. anthracis. This TCS BAS1816-17 recognizes a DR in p14 that differs from the phrt
DR by four nucleotides. These four nucleotides are the primary source of differential regulation
between phrt and p14. It is not surprising then, in the absence of HssR, BAS1816-17 activates
expression of both p14 and phrt. Through both in vitro and in vivo experiments BAS1816-17 has
been determined to regulate phrt at the RR-DR level, while HssRS impacts expression at p14
either through HK-RR or RR-DR interactions. The interactions between HssRS and BAS1816-17
are summarized in Figure 27.

100
Figure 27. A summary of cross-talk observed between HssRS and BAS1816-17 in B. anthracis. A-C. HssRS was previously shown to be stimulated by heme to activate phrt (83). D-F. Here a second TCS BAS1816-17 has been identified to be stimulated by ‘205 to activate p14. G. and H. At the RR-DR level BAS1816 can recognize the phrt DR but HssR only recognizes the p14 DR only in the context of phrt. I. and J. At the HK-RR level HssS can cross-phosphorylate BAS1816 both in vitro and in vivo, while BAS1817 has only been observed to cross-phosphorylate HssR in vitro.

101
In addition, five new activators of BAS1816-17 were identified and will be used to
determine the native function of BAS1816-17 and the nature of BAS1816-17 cross-talk with
HssRS. Here, the impact of each of these new activators on BAS1816-17 mediated stimulation of
p14 was investigated. In order to more fully dissect the mechanisms of TCS cross-talk, the impact
of each of these small molecules on phrt activation should be determined. Such studies may
reveal how these compounds activate BAS1816-17 and further dissect the cross-talk between
BAS1816-17 and HssRS. Without this panel of non-native small molecule activators of
BAS1816-17, the studies presented here characterizing this new TCS and its mechanisms of
cross-talk with HssRS would have been impossible. Delineating the activity and function of many
TCSs is limited by a lack of known activators. The success of the Biolog Phenotypic MicroArray
for identifying activators of BAS1816-17 is applicable to any TCS and may be a powerful new
chemical biology based strategy that will improve the tools available for studying TCSs.
The known activities of the six BAS1816-17 activating compounds lead to the hypothesis
that BAS1816-17 may be activated by perturbations in the cell envelope, potentially even
alterations in the electrochemical gradient across the membrane. The lipophilic nature of the
protoporphyrin IX ring, which coordinates iron, disrupts the cell membrane of erythrocytes (1).
This causes hemolysis by a colloid-osmotic mechanism as the cells no longer maintain ion
gradients and water enters the cell. In addition, S. aureus heme-iron preferentially accumulates in
the cell membranes (77). It is possible that HssRS is activated when heme disrupts the membrane.
This model is supported by the previous observation that targocil, which prevents translocation of
WTA to the outer leaflet of the cell membrane, activates HssRS in S. aureus (10, 89). It is
possible that general membrane stress activates BAS1816-17 and is alleviated by activation of
p14. The function of the putative ABC transporter BAS1814-15 is unknown. Perhaps it transports
an osmoprotectant which could more generally protect against any membrane stress, even heme.
The coordinated expression of hrtAB and BAS1814-15 may enable B. anthracis to better cope
with heme-induced membrane stress.

102
Cross-regulation between HssRS and BAS1816-17 could exist if the activation of both
phrt and p14 help alleviate heme toxicity. In Lactococcus lactis HrtAB has been shown to efflux
heme (42). In wildtype B. anthracis p14 is activated in the presence of high concentrations of
heme; meanwhile, activation of phrt in the presence of ‘205 has not been consistently observed.
This suggests that some cross-regulation may exist from HssRS to BAS1816-17 and that
BAS1814-15 may help alleviate heme toxicity. The lack of cross- talk from BAS1816-17 to
HssRS upon ‘205 treatment suggests that HrtAB may not be needed upon BAS1816-17 activation
or that ‘205 is not a strong enough activator of BAS1816-17 to achieve cross-talk. It would be
worthwhile to investigate whether cross- talk from BAS1816-17 to HssRS occurs in the presence
of the more potent activator NDGA.
In a more general sense, the interactions between HssRS and BAS1816-17 suggest that B.
anthracis may be able to integrate multiple signals to better adapt and survive in diverse
environments. BAS1814-17 is only conserved in the Bacillus genus, it is not found in other hssRS
encoding bacteria outside this genus. Perhaps this is due to the unique coordination of a
sporulation program which the Bacilli must integrate with signals from diverse niches including
soil, water, plant surfaces, and various insect and mammalian hosts. Alternatively, the cross-
signaling between HssRS and BAS1816-17 may occur to supplement HssRS-mediated heme
tolerance. B. anthracis HssRS is more active than S. aureus HssRS and ∆hrtA B. anthracis is
more sensitive to heme toxicity than ∆hrtA S. aureus (83). These data suggest that B. anthracis
has differential sensitivities and responses to heme toxicity and it is possible that BAS1814-17
contributes to Bacilli adapting to heme stress.
BAS1816-17 and HssRS are more closely related to each other than any of the 45 other
TCSs in B. anthracis. Moreover, the DR recognized by each RR differs by only four nucleotides.
BAS1816-17 is only found in the Bacillus genus. These observations suggest that perhaps
BAS1816-17 is a paralogous HssRS system in the Bacillus genus and that the two TCSs have not

103
diverged enough to completely eliminate cross-talk. The question remains whether the cross-talk
between the TCSs is beneficial to the bacteria and therefore selectively maintained.
One of the most interesting results observed here is the re-engineering of p14 to be
strongly responsive to heme exposure. Upon deletion of HssR and BAS1817, the stimulation of
HssS with heme presumably results in the phosphotransfer from HssS to BAS1816 and
subsequent activation of p14. These results rejoin an idea proposed by Laub and Goulian who
stated that:
“...the ultimate test of whether we understand the specificity of protein-protein interactions throughout two-component pathways will be whether we can redesign or rationally engineer these systems. Can pathways, in effect, be rewired to execute novel functions (41)?”
In this chapter, the dissection of cross-talk between HssRS and BAS1816-17 has in fact allowed
us to rewire the B. anthracis response to heme toxicity. This provides an exciting foundation for
controlling B. anthracis signaling networks and potentially manipulating the bacterial response to
its environment.

104
CHAPTER VI
SUMMARY
Conclusions
S. aureus and B. anthracis are two closely related pathogens. The pathogenesis of each of
these organisms often consists of a significant blood component. While the blood is relatively
devoid of free iron, both S. aureus and B. anthracis are capable of lysing red blood cells and
acquiring heme-coordinated iron from host hemoglobin (50, 51, 58). This heme can be degraded
to release free iron or trafficked to the cell membrane, presumably for use intact as a protein co-
factor (75-77). An overabundance of heme is toxic, but these pathogens can alleviate heme
toxicity by activating the heme regulated transporter (HrtAB) through the heme sensing system
(HssRS) (85, 90). The hssRS/hrtAB systems are conserved across Gram positive pathogens as a
mechanism for overcoming the heme paradox (1, 90). Identifying the mechanisms by which
HssRS senses heme toxicity will provide insight into the mechanisms by which many Gram
positive pathogens successfully adapt to the mammalian host.
Here a chemical genetics approach was utilized for dissecting the mechanisms of HssRS
activation. An HTS for small molecule activators of S. aureus HssRS resulted in the identification
of approximately fifteen small molecules that activate HssRS. These top compounds were then
screened for activity in B. anthracis and several were also able to stimulate the hrt promoter
(phrt) in B. anthracis. This chemical genetics approach to probing TCS biology has yielded new
models for how bacteria regulate heme homeostasis, innovative strategies for targeting bacterial
energy production during infection, and a deeper understanding of how bacterial signaling
networks are integrated to enable adaptation to complex environments.
Identified in the VICB small molecule library, compound ‘882, was the most potent
activator of S. aureus HssRS. To dissect the mechanism of ‘882-induced HssRS activation, the
105
residues required for heme sensing by HssS were compared to the residues required for ‘882
sensing and found to be similar. This suggested a common mechanism of HssS activation by both
‘882 and heme. The simplest hypothesis is that ‘882 stimulates endogenous heme biosynthesis to
activate HssS. This is indeed the case as HssS is not activated by ‘882 in a strain lacking
endogenous heme biosynthesis and ‘882 treatment results in the accumulation of intracellular
heme. Since ‘882 stimulates endogenous heme this indicates that HssS actually senses
intracellular heme stress. These studies neither rule out the possibility that HssS may directly
sense heme, nor that a product of heme toxicity is the ligand of HssS.
The stimulation of endogenous heme biosynthesis by ‘882 is unprecedented and provides
an excellent probe for studying the regulation of endogenous heme biosynthesis. To study how S.
aureus regulates heme biosynthesis, genes that contribute to ‘882 sensing were identified in a
transposon screen. Many genes involved in central metabolism contributed to the activation of
HssRS by ‘882. In fact, when multiple metabolic parameters of S. aureus energy production were
monitored, it was determined that ‘882 suppresses fermentation. This suggests that heme
biosynthesis may, in part, be regulated by the metabolic state of the cell. This is intuitive as heme
is a critical co-factor for enzymes involved in energy homeostasis, most notably the cytochromes
in the electron transport chain.
The hypothesis that heme biosynthesis is integrated with energy homeostasis is bolstered
by the observation that suppressing upper glycolysis coordinately suppressed heme biosynthesis.
While it is clear that the energetic state of the bacterial cell impacts the regulation of heme
biosynthesis, the exact cellular signals and factors that form the interface between these two
cellular processes remain elusive. Further studies utilizing ‘882 and knowledge gained here may
help tease apart these fundamental aspects of S. aureus physiology.
The noted impact of ‘882 treatment on fermentative processes evoked the intriguing
possibility that ‘882 may adversely affect S. aureus under conditions where the bacteria are
generating energy solely by fermentation. This proved to be correct as growth of S. aureus in an

106
anaerobic chamber dramatically lowers the IC50 of ‘882 for wildtype S. aureus. The IC50 is further
reduced for the two lab generated SCV strains hemB::ermC and ∆menB, which rely on
fermentation to generate energy. These data, along with other data presented in Chapter III,
indicate that ‘882 is specifically toxic to fermenting S. aureus.
No known antibiotics specifically target energy production in bacteria, especially
fermentation, despite it being thought to be an important component of infection. Furthermore,
identifying fermentation inhibitors by HTS is difficult to perform due to the required outfitting of
an anaerobic chamber with HTS equipment. Thus, compound ‘882 presents a unique tool for
investigating the importance of fermentation in bacterial pathogenesis and antibiotic resistance.
In dual therapy, ‘882 prevents the outgrowth of antibiotic resistance to gentamicin,
reaffirming that fermentation is required for resistance to aminoglycosides. Furthermore,
gentamicin is not used in monotherapy to treat S. aureus infections due to the high association of
antibiotic resistance; it is sometimes used in a combination with a β-lactam or vancomycin, which
is synergistic. The prevention of resistance to gentamicin by ‘882 has exciting potential to expand
the current strategies used to treat S. aureus infections by repurposing an already approved
antibiotic. This strategy is analogous to the antibiotic coctail amoxicillin-clavulanate, which
combines a β-lactam with a β-lactamase inhibitor. This combination therapy prevents bacterial β-
lactamases from inactivating amoxicillin and successfully treats many bacterial infections.
In monotherapy, ‘882 enhances neutrophil mediated killing of S. aureus ex vivo, and in
vivo the ‘882 derivative, ‘373, reduces bacterial and abscess burdens in the liver. These exciting
observations indicate that fermentation is important in vivo. That is, at certain points during
pathogenesis S. aureus must rely on fermentation to successfully colonize the host. These
processes most likely include resisting phagocytosis and forming absecesses. Since fermentation
is a branched process, and since ‘882 seems to target fermentation in general, these data provide
an insight into the role of fermentation in pathogenesis which cannot be provided with traditional
genetic techniques.

107
Fermentation is likely to be important in pathogenesis more generally. Many pathogens
including the Clostridia and the Streptococci genera only ferment, but most pathogens are more
akin to S. aureus in that they are metabolically flexible and can generate energy through both
fermentation and respiration. Since many pathogens utilize fermentation, it is possible that
targeting this important energy generating process may be a new antibiotic strategy. This is
supported by the observation that ‘882 is also toxic to C. diphtheriae in vitro. Further work
investigating the anaerobic toxicity of ‘882 toward other pathogens or screening for other small
molecules that target fermenting bacteria may provide valuable tools to the medical community
for broadening the therapeutic strategies used to combat recalcitrant pathogens. As highlighted at
the beginning of this section, compounds that manipulate energy homeostasis may also be
powerful probes for understanding basic bacterial physiology.
The sensitivity of S. aureus to ‘882 under anaerobic conditions indicates that there are
processes absolutely critical to anaerobic growth. Identifying the source of ‘882 toxicity would
allow future studies to develop small molecules with better activity either through SAR
improvements of ‘882 or the identification of other inhibitors by HTS. In order to identify the
source of ‘882 toxicity, spontaneously ‘882-resistant strains were isolated and determined to have
genetic mutations that result in lost SaeRS activity. Studying the ‘882 sensitivity profiles of a
series of isogenic sae operon mutants revealed that it is the hyperactivity of S. aureus strain
Newman SaeS that results in anaerobic ‘882 toxicity.
Although it is possible that a detrimental cross-talk event between the SaeRS and HssRS
TCSs could be the source of toxicity, our current hypothesis is that a cellular factor impacted by
SaeRS function is the source of ‘882 toxicity. The current model is that ‘882 interacts with a
protein up-regulated by SaeRS activity to generate a toxic by-product that cannot be tolerated in
anaerobic conditions. Ablating SaeRS activity could titrate that target to low levels which may
prevent ‘882 toxicity from occurring. Identifying the source of anaerobic ‘882 toxicity will
provide insight into S. aureus physiology and point to potential antibacterial drug targets.

108
Work presented here highlights the utility of ‘882 as a probe of S. aureus cell biology and
identifies new therapeutic strategies for treating S. aureus infections. At the most basic level, ‘882
has revealed that bacterial heme sensors may generally sense intracellular heme, not only
extracellular heme as previously thought. To determine if any of the hits from the HTS may also
prove to be powerful probes of HssRS activity and provide additional insights into basic bacterial
biology in other species, the top hits from the HTS were screened for phrt activation in B.
anthracis.
Compound ‘205 was identified to activate phrt independent of HssRS. This is due to the
activation of a previously uncharacterized TCS BAS1816-17. BAS1816-17 was predicted to
regulate a DR in p14, which is similar to the phrt DR recognized by HssR (12). Using ‘205 to
stimulate BAS1816-17 enabled the dissection of a complex signaling network between
BAS1816-17 and HssRS. The four nucleotides that differentiate the phrt and p14 DRs are
sufficient to determine the response of each promoter to heme or ‘205. The exception is that the
high basal activity of the phrt promoter requires the phrt DR, but the phrt DR is not sufficient to
induce high basal activation of the p14 promoter. In all, the high basal activity of phrt requires the
phrt DR, HssR, and the approximately 200 bp that encompass phrt. This implicates other cis- or
trans-acting cellular factors in the high basal level of phrt activation. Despite the high basal
activity of phrt, it is clear that BAS1816-17 can interact with phrt at the RR-DR level.
Correspondingly, p14 is activated in high concentrations of heme and this may occur at either the
HK-RR or RR-DR level.
The activation of p14 by heme-stimulated HssRS in wildtype S. aureus indicates that
there is natural cross-talk between these systems. The function of BAS1814-15 and why it is
activated in the presence of heme remains unclear. To better understand the function of
BAS1814-15 and the natural conditions that activate BAS1816-17, Biolog Phenotypic Microarray
plates were used to identify four other activators of BAS1816-17. Although none of these
activators have a known function in B. anthracis, studies on the activity of the compounds in

109
other organisms suggest that BAS1816-17 may be activated by cell envelope stress or alterations
in the electrochemical potential across the cell membrane. This hypothesis is further supported by
the identification of a sixth BAS1816-17 activator, targocil. Targocil inhibits the transport of
WTAs to the outer leaflet of the S. aureus cell membrane, resulting in cell envelope stress and the
accumulation of WTA on the inner leaflet of the membrane (89). Since WTA is polyanionic,
targocil may not only disrupt the cell envelope but may also disrupt the electrochemical potential
across the membrane. Confirming the natural function of BAS1816-17 is essential for
understanding if the cross-talk between HssRS and BAS1816-17 is a relic of evolutionary
similarity between the TCSs or a beneficial event that enables Bacilli to adapt to multiple
environmental perturbations. If cross-regulation between HssRS and BAS1816-17 is indeed
advantageous, identifying the ligand of each HK and the substrate of each ABC transporter
(HrtAB and BAS1814-15) may clarify the mechanisms of heme toxicity and tolerance in Gram
positive pathogens.
Future directions
Elaborate the mechanisms by which heme homeostasis and energy metabolism are
coordinated. Studies presented here point to the coordination of S. aureus heme biosynthesis
with energy homeostasis. Inhibiting upper glycolysis suppresses heme biosynthesis while
repressing fermentation stimulates heme biosynthesis. These observations suggest that a
metabolic signal produced between upper glycolysis and fermentation regulates heme
biosynthesis. The model is that inhibiting upper glycolysis decreases the metabolic signal and
coordinately reduces heme biosynthesis, while inhibiting fermentation results in a build-up in the
metabolic signal, which stimulates heme biosynthesis.
In order to identify the metabolic signal that regulates heme biosynthesis, a combined
genetic and chemical biology approach may continue to provide insights. Each step in glycolysis
and fermentation may be systematically inhibited either by genetically ablating each gene or

110
chemical targeting each step. The effect of manipulating each step in glycolysis and fermentation
on heme biosynthesis may reveal the source of the metabolic signal.
Alternatively, a primarily chemistry driven strategy may be employed to delineate the
mechanisms by which central metabolism impacts heme biosynthesis. SAR studies on ‘882 have
identified chemical moieties on ‘882 that tolerate permutation. At these points, compound ‘882
may be modified to include probe-based elements. These elements can then be used to cross-link
‘882 to cellular binding partners, which may then be identified by mass spectrometry. Identifying
the true binding partners of ‘882 may help elucidate the mechanisms by which ‘882 is exerting its
effects on both heme biosynthesis and anaerobic toxicity.
Identify the source of ‘882 toxicity. The importance of identifying the source of anaerobic ‘882
toxicity hinges on extending the utility of ‘882 from a probe of basic bacterial physiology to one
that provides direction for the development of antibacterial agents. Presumably ‘882 is
manipulating S. aureus metabolism in a way that is incompatible with fermentative growth.
Understanding what S. aureus cannot tolerate under anaerobic conditions will aid in improving
‘882 activity or identifying more effective molecules that target bacterial energy production.
Current efforts to identify the source of anaerobic ‘882 toxicity are focused on
determining the role of SaeRS regulated gene targets in providing resistance to ‘882 or sensitivity
to anaerobic growth. Approximately 80% of the genes predicted to be regulated by SaeRS under
anaerobiosis are available in the NARSA S. aureus defined transposon library. Since the other
20% are not identified in the NARSA library, this suggests that they may be essential. The genes
available in the NARSA library will be transduced into S. aureus strain Newman and then
assessed for ‘882 sensitivity. If none of those genes prove to be the source of anaerobic toxicity,
this will narrow the list of potential targets to the other 20% of the SaeRS regulatory targets.
Either chemical inhibitors or siRNAs may be used to titrate levels of the remaining putative
targets and subsequently investigate their role in anaerobic growth and ‘882 toxicity.

111
Correspondingly, each remaining gene of interest could be cloned under a constitutive promoter
to assess the effect of overexpression of these putative targets on ‘882 toxicity and anaerobic
growth.
Since ‘882 suppressor strains arose at a mutation rate of 1 in 107 bacteria and all have
non-functional SaeRS TCSs, this indicates that mutation of the sae operon happens at a rate
similar to most other genes in the genome. Viable mutations in the true target of ‘882 may occur
at a much lower frequency if they affect bacterial fitness. In order to try to identify other genetic
loci involved in ‘882 resistance, the saePQRS operon will be integrated into the hlb locus of S.
aureus strain Newman (5). This will yield a merediploid strain of S. aureus carrying two copies
of the sae locus. ‘882 suppressor colonies could then be isolated in this strain. Since there will be
two copies of sae, the likelihood of isolating a strain with mutations at both sae loci will be lower
and may permit the identification of other loci involved in providing resistance to ‘882. The
mutations can be identified by whole genome sequencing. The role each mutation plays in
anaerobic growth and ‘882 toxicity could then be further assessed to determine if it affects the
cellular target of ‘882 and may serve as a suitable therapeutic target.
Define the native function of BAS1814-17. BAS1814 and BAS1815 comprise the predicted
ABC transporter regulated by the TCS BAS1816-17. The p14 promoter is activated in the
presence of ‘205 by BAS1816-17 and high heme concentrations by HssRS. The impact this cross-
talk has on B. anthracis heme toxicity and tolerance remains to be explored. Identifying the
native function of BAS1814-17 may reveal whether there is a biological benefit of
HssRS/BAS1816-17 cross-talk
Currently, six BAS1816-17 activators have been identified. Their known activity in other
systems suggests that BAS1816-17 may be sensing perturbations in the cell envelope, perhaps
changes in the electrochemical gradient. To identify common cellular events that trigger
BAS1816-17 activation, RNASeq could be employed. An RNASeq analysis comparing genes

112
altered in B. anthracis upon exposure to each BAS1816-17 activator may reveal transcriptional
changes induced by multiple compounds. Identifying common transcriptional changes that
precede BAS1816-17 activation may either confirm that cell envelope stress is indeed a likely
activator of BAS1816-17 or may generate other hypotheses about the native function of
BAS1816-17. If the activation of BAS1814-17 by heme does have a biological purpose then
understanding the native function of this new TCS and ABC transporter will provide insights into
the mechanisms by which Gram positive bacteria overcome the heme paradox during infection.

113
APPENDIX
List of Publications
1. Mike LA, Dutter BF, Stauff DL, Moore JL, Vitko NP, Aranmolate O, Kehl-Fie TE, Sullivan S, Reid PR, DuBois JL, Richardson AR, Caprioli RM, Sulikowski GA, Skaar EP. “Activation of heme biosynthesis by a small molecule that is toxic to fermenting Staphylococcus aureus.” PNAS 110 (20), (2013): 8206-11.
2. Wakeman CA, Hammer ND, Stauff DL, Attia AS, Anzaldi LL, Dikalov SI, Calcutt MW, Skaar EP. “Menaquinone biosynthesis potentiates haem toxicity to Staphylococcus aureus.” Molecular Microbiology 86, (2012):1376-92.
3. Anzaldi LL, Skaar EP. “The evolution of a superbug: How Staphylococcus aureus overcomes its unique susceptibility to polyamines.” Molecular Microbiology 82, (2011): 1-3.
4. Anzaldi LL, Skaar EP. “Overcoming the heme paradox: Heme toxicity and tolerance in bacterial pathogens.” Infection & Immunity 78, (2010): 4977-89.

114
REFERENCES
1. Anzaldi, L. L., and E. P. Skaar. 2010. Overcoming the heme paradox: heme toxicity and tolerance in bacterial pathogens. Infect. Immun. 78:4977-4989.
2. Bae, T., E. M. Glass, O. Schneewind, and D. Missiakas. 2008. Generating a collection
of insertion mutations in the Staphylococcus aureus genome using bursa aurealis. Methods Mol Biol 416:103-16.
3. Barker, K. D., K. Barkovits, and A. Wilks. 2012. Metabolic flux of extracellular heme
uptake in Pseudomonas aeruginosa is driven by the iron-regulated heme oxygenase (HemO). Journal of Biological Chemistry 287:18342-18350.
4. Beenken, K. E., P. M. Dunman, F. McAleese, D. Macapagal, E. Murphy, S. J.
Projan, J. S. Blevins, and M. S. Smeltzer. 2004. Global gene expression in Staphylococcus aureus biofilms. J Bacteriol 186:4665-84.
5. Boles, B. R., M. Thoendel, A. J. Roth, and A. R. Horswill. 2010. Identification of
genes involved in polysaccharide-independent Staphylococcus aureus biofilm formation. PLoS ONE 5:e10146.
6. Bryan, L. E., and S. Kwan. 1981. Aminoglycoside-resistant mutants of Pseudomonas
aeruginosa deficient in cytochrome d, nitrite reductase, and aerobic transport. Antimicrob Agents Chemother 19:958-64.
7. Burka, L. T., K. D. Washburn, and R. D. Irwin. 1991. Disposition of [14C]furan in the
male F344 rat. J Toxicol Environ Health 34:245-57. 8. Cai, S. J., and M. Inouye. 2002. EnvZ-OmpR interaction and osmoregulation in
Escherichia coli. J Biol Chem 277:24155-61. 9. Calvin, M. 1961. Chemical evolution. Oregon State System of Higher Education,
Eugene, OR. 10. Campbell, J., A. K. Singh, J. G. Swoboda, M. S. Gilmore, B. J. Wilkinson, and S.
Walker. 2012. An antibiotic that inhibits a late step in wall teichoic acid biosynthesis induces the cell wall stress stimulon in Staphylococcus aureus. Antimicrob Agents Chemother 56:1810-20.
11. Cheng, A. G., A. C. DeDent, O. Schneewind, and D. Missiakas. 2011. A play in four
acts: Staphylococcus aureus abscess formation. Trends Microbiol 19:225-32. 12. de Been, M., M. J. Bart, T. Abee, R. J. Siezen, and C. Francke. 2008. The
identification of response regulator-specific binding sites reveals new roles of two-component systems in Bacillus cereus and closely related low-GC Gram-positives. Environ Microbiol 10:2796-809.
13. DeLeo, F. R., B. A. Diep, and M. Otto. 2009. Host defense and pathogenesis in
Staphylococcus aureus infections. Infectious disease clinics of North America 23:17-34.

115
14. Doss, M., and W. K. Philipp-Dormston. 1973. Regulatory link between lactate dehydrogenase and biosynthesis of porphyrin and heme in microorganisms. Enzyme 16.
15. Drucker, A. M., and C. F. Rosen. 2011. Drug-induced photosensitivity. Drug Safety
34:821-837. 16. Duthie, E. S., and L. L. Lorenz. 1952. Staphylococcal coagulase: mode of action and
antigenicity. J Gen Microbiol 6:95-107. 17. Duwat, P., S. Sourice, B. Cesselin, G. Lamberet, K. Vido, P. Gaudu, Y. Le Loir, F.
Violet, P. Loubiere, and A. Gruss. 2001. Respiration capacity of the fermenting bacterium Lactococcus lactis and its positive effects on growth and survival. J Bacteriol 183:4509-16.
18. Fernandez, A., D. Lechardeur, A. Derre-Bobillot, E. Couve, P. Gaudu, and A.
Gruss. 2010. Two coregulated efflux transporters modulate intracellular heme and protoporphyrin IX availability in Streptococcus agalactiae. PLoS Pathog 6:e1000860.
19. Fitzpatrick, T. B., N. Amrhein, B. Kappes, P. Macheroux, I. Tews, and T. Raschle.
2007. Two independent routes of de novo vitamin B6 biosynthesis: not that different after all. Biochem J 407:1-13.
20. Frankenberg-Dinkel, N. 2004. Bacterial heme oxygenases. Antioxid Redox Signal
6:825-34. 21. Frazier, A. A., T. J. Franks, and J. R. Galvin. 2006. Inhalational Anthrax. Journal of
Thoracic Imaging 21:252-258 10.1097/01.rti.0000213570.71161.84. 22. Frunzke, J., C. Gatgens, M. Brocker, and M. Bott. 2011. Control of heme homeostasis
in Corynebacterium glutamicum by the two-component system HrrSA. J Bacteriol 193:1212-21.
23. Fuller, J. R., N. P. Vitko, E. F. Perkowski, E. Scott, D. Khatri, J. S. Spontak, L. R.
Thurlow, and A. R. Richardson. 2011. Identification of a lactate-quinone oxidoreductase in Staphylococcus aureus that is essential for virulence. Front Cell Infect Microbiol 1:19.
24. Geiger, T., C. Goerke, M. Mainiero, D. Kraus, and C. Wolz. 2008. The virulence
regulator Sae of Staphylococcus aureus: promoter activities and response to phagocytosis-related signals. J Bacteriol 190:3419-28.
25. Giraudo, A. T., A. L. Cheung, and R. Nagel. 1997. The sae locus of Staphylococcus
aureus controls exoprotein synthesis at the transcriptional level. Arch Microbiol 168:53-8.
26. Giraudo, A. T., C. G. Raspanti, A. Calzolari, and R. Nagel. 1994. Characterization of
a Tn551-mutant of Staphylococcus aureus defective in the production of several exoproteins. Can J Microbiol 40:677-81.

116
27. Gorwitz, R. J., D. Kruszon-Moran, S. K. McAllister, G. McQuillan, L. K. McDougal, G. E. Fosheim, B. J. Jensen, G. Killgore, F. C. Tenover, and M. J. Kuehnert. 2008. Changes in the prevalence of nasal colonization with Staphylococcus aureus in the United States, 2001-2004. Journal of Infectious Diseases 197:1226-1234.
28. Groban, E. S., E. J. Clarke, H. M. Salis, S. M. Miller, and C. A. Voigt. 2009. Kinetic
buffering of cross talk between bacterial two-component sensors. Journal of Molecular Biology 390:380-393.
29. Grzegorzewicz, A. E., H. Pham, V. A. Gundi, M. S. Scherman, E. J. North, T. Hess,
V. Jones, V. Gruppo, S. E. Born, J. Kordulakova, S. S. Chavadi, C. Morisseau, A. J. Lenaerts, R. E. Lee, M. R. McNeil, and M. Jackson. 2012. Inhibition of mycolic acid transport across the Mycobacterium tuberculosis plasma membrane. Nat Chem Biol 8:334-41.
30. The Human Microbiome Project Consortium. 2012. Structure, function and diversity
of the healthy human microbiome. Nature 486:207-214. 31. Horton, R. M., Z. L. Cai, S. N. Ho, and L. R. Pease. 1990. Gene splicing by overlap
extension: tailor-made genes using the polymerase chain reaction. Biotechniques 8:528-35.
32. Jeong, D. W., H. Cho, M. B. Jones, K. Shatzkes, F. Sun, Q. Ji, Q. Liu, S. N. Peterson,
C. He, and T. Bae. 2012. The auxiliary protein complex SaePQ activates the phosphatase activity of sensor kinase SaeS in the SaeRS two-component system of Staphylococcus aureus. Mol Microbiol 86:331-48.
33. Johansson, P., and L. Hederstedt. 1999. Organization of genes for tetrapyrrole
biosynthesis in Gram-positive bacteria. Microbiology 145:529-538. 34. Jurtshuk, P. J. 1996. Bacterial Metabolism. In S. Baron (ed.), Medical Microbiology,
4th ed. University of Texas Medical Branch at Galveston, Galveston 35. Kahl, B. C., A. Duebbers, G. Lubritz, J. Haeberle, H. G. Koch, B. Ritzerfeld, M.
Reilly, E. Harms, R. A. Proctor, M. Herrmann, and G. Peters. 2003. Population dynamics of persistent Staphylococcus aureus isolated from the airways of cystic fibrosis patients during a 6-year prospective study. J Clin Microbiol 41:4424-7.
36. Kehl-Fie, T. E., S. Chitayat, M. I. Hood, S. Damo, N. Restrepo, C. Garcia, K. A.
Munro, W. J. Chazin, and E. P. Skaar. 2011. Nutrient metal sequestration by calprotectin inhibits bacterial superoxide defense, enhancing neutrophil killing of Staphylococcus aureus. Cell Host Microbe 10:158-64.
37. Kim, H. S., D. Sherman, F. Johnson, and A. I. Aronson. 2004. Characterization of a
major Bacillus anthracis spore coat protein and its role in spore inactivation. J Bacteriol 186:2413-7.
38. Klubes, P., P. J. Fay, and I. Cerna. 1971. Effects of chlorpromazine on cell wall
biosynthesis and incorporation of orotic acid into nucleic acids in Bacillus megaterium. Biochemical Pharmacology 20:265-277.

117
39. Koo, S. P., A. S. Bayer, H. G. Sahl, R. A. Proctor, and M. R. Yeaman. 1996. Staphylocidal action of thrombin-induced platelet microbicidal protein is not solely dependent on transmembrane potential. Infect Immun 64:1070-4.
40. Krell, T., J. Lacal, A. Busch, H. Silva-Jimenez, M. E. Guazzaroni, and J. L. Ramos.
2010. Bacterial sensor kinases: diversity in the recognition of environmental signals. Annu Rev Microbiol 64:539-59.
41. Laub, M. T., and M. Goulian. 2007. Specificity in two-component signal transduction
pathways. Annu Rev Genet 41:121-45. 42. Lechardeur, D., B. Cesselin, U. Liebl, M. H. Vos, A. Fernandez, C. Brun, A. Gruss,
and P. Gaudu. 2012. Discovery of intracellular heme-binding protein HrtR, which controls heme efflux by the conserved HrtB-HrtA transporter in Lactococcus lactis. J Biol Chem 287:4752-8.
43. Liang, X., C. Yu, J. Sun, H. Liu, C. Landwehr, D. Holmes, and Y. Ji. 2006.
Inactivation of a two-component signal transduction system, SaeRS, eliminates adherence and attenuates virulence of Staphylococcus aureus. Infect Immun 74:4655-65.
44. Lin, H., and J. Everse. 1987. The cytotoxic activity of hematoheme: evidence for two different mechanisms. Anal Biochem 161:323-31.
45. Lu, J. M., J. Nurko, S. M. Weakley, J. Jiang, P. Kougias, P. H. Lin, Q. Yao, and C.
Chen. 2010. Molecular mechanisms and clinical applications of nordihydroguaiaretic acid (NDGA) and its derivatives: an update. Med Sci Monit 16:RA93-100.
46. Luong, T. T., K. Sau, C. Roux, S. Sau, P. M. Dunman, and C. Y. Lee. 2011.
Staphylococcus aureus ClpC divergently regulates capsule via sae and codY in strain Newman but activates capsule via codY in strain UAMS-1 and in strain Newman with repaired saeS. J Bacteriol 193:686-94.
47. Macias, R. I., J. J. Marin, and M. A. Serrano. 2009. Excretion of biliary compounds
during intrauterine life. World J Gastroenterol 15:817-828. 48. Malik, Z., H. Ladan, Y. Nitzan, and B. Ehrenberg. 1990. The bactericidal activity of a
deuteroporphyrin--hemin mixture on gram-positive bacteria. A microbiological and spectroscopic study. Journal of Photochemistry and Photobiology B: Biology 6:419-430.
49. Manier, M. L., M. L. Reyzer, A. Goh, V. Dartois, L. E. Via, C. E. Barry, 3rd, and R.
M. Caprioli. 2011. Reagent precoated targets for rapid in-tissue derivatization of the anti-tuberculosis drug isoniazid followed by MALDI imaging mass spectrometry. J Am Soc Mass Spectrom 22:1409-19.
50. Maresso, A. W., G. Garufi, and O. Schneewind. 2008. Bacillus anthracis secretes
proteins that mediate heme acquisition from hemoglobin. PLoS Pathog 4:e1000132. 51. Mazmanian, S. K., E. P. Skaar, A. H. Gaspar, M. Humayun, P. Gornicki, J.
Jelenska, A. Joachmiak, D. M. Missiakas, and O. Schneewind. 2003. Passage of heme-iron across the envelope of Staphylococcus aureus. Science 299:906-9.

118
52. McIllmurray, M. B., and J. Lascelles. 1970. Anaerobiosis and the activity of enzymes of pyrimidine biosynthesis of Staphylococcus aureus. J Gen Microbiol 64.
53. Mike, L. A., B. F. Dutter, D. L. Stauff, J. L. Moore, N. P. Vitko, O. Aranmolate, T.
E. Kehl-Fie, S. Sullivan, P. R. Reid, J. L. Dubois, A. R. Richardson, R. M. Caprioli, G. A. Sulikowski, and E. P. Skaar. 2013. Activation of heme biosynthesis by a small molecule that is toxic to fermenting Staphylococcus aureus. Proc Natl Acad Sci U S A 110:8206-11.
54. Ni, Y., D. Lin, and S. Kokot. 2005. Synchronous fluorescence and UV-vis spectrometric
study of the competitive interaction of chlorpromazine hydrochloride and Neutral Red with DNA using chemometrics approaches. Talanta 65:1295-1302.
55. Obaseiki-Ebor, E. E., and J. O. Akerele. 1988. The mutagenic activity of
chlorpromazine. Mutat Res 208:33-8. 56. Ordal, G. W. 1976. Recognition sites for chemotactic repellents of Bacillus subtilis. J
Bacteriol 126:72-9. 57. Panek, H., and M. R. O'Brian. 2002. A whole genome view of prokaryotic haem
biosynthesis. Microbiology 148:2273-2282. 58. Papaparaskevas, J., D. P. Houhoula, M. Papadimitriou, G. Saroglou, N. J. Legakis,
and L. Zerva. 2004. Ruling out Bacillus anthracis. Emerg Infect Dis 10:732-5. 59. Park, M. K., R. A. M. Myers, and L. Marzella. 1992. Oxygen tensions and infections:
modulation of microbial growth, activity of antimicrobial agents, and immunologic responses. Clinical Infectious Diseases 14:720-740.
60. Pattee, P. A., and D. S. Neveln. 1975. Transformation analysis of three linkage groups
in Staphylococcus aureus. J Bacteriol 124:201-11. 61. Pedersen, M. B., C. Garrigues, K. Tuphile, C. Brun, K. Vido, M. Bennedsen, H.
Mollgaard, P. Gaudu, and A. Gruss. 2008. Impact of aeration and heme-activated respiration on Lactococcus lactis gene expression: identification of a heme-responsive operon. J Bacteriol 190:4903-11.
62. Podgornaia, A. I., and M. T. Laub. 2013. Determinants of specificity in two-component
signal transduction. Curr Opin Microbiol 16:156-62. 63. Proctor, R. A., C. von Eiff, B. C. Kahl, K. Becker, P. McNamara, M. Herrmann, and
G. Peters. 2006. Small colony variants: a pathogenic form of bacteria that facilitates persistent and recurrent infections. Nat Rev Microbiol 4:295-305.
64. Proctor, R. A., and A. von Humboldt. 1998. Bacterial energetics and antimicrobial
resistance. Drug Resist Updat 1:227-35. 65. Quastel, J. H. 1965. Effects of drugs on metabolism of the brain in vitro. Br Med Bull
21:49-56.

119
66. Reniere, M. L., and E. P. Skaar. 2008. Staphylococcus aureus haem oxygenases are differentially regulated by iron and haem. Mol Microbiol 69:1304-15.
67. Reniere, M. L., V. J. Torres, and E. P. Skaar. 2007. Intracellular metalloporphyrin
metabolism in Staphylococcus aureus. Biometals 20:333-45. 68. Reniere, M. L., G. N. Ukpabi, S. R. Harry, D. F. Stec, R. Krull, D. W. Wright, B. O.
Bachmann, M. E. Murphy, and E. P. Skaar. 2010. The IsdG-family of haem oxygenases degrades haem to a novel chromophore. Mol Microbiol 75:1529-38.
69. Richardson, A. R., S. J. Libby, and F. C. Fang. 2008. A nitric oxide-inducible lactate
dehydrogenase enables Staphylococcus aureus to resist innate immunity. Science 319:1672-6.
70. Schafer, D., T. T. Lam, T. Geiger, M. Mainiero, S. Engelmann, M. Hussain, A.
Bosserhoff, M. Frosch, M. Bischoff, C. Wolz, J. Reidl, and B. Sinha. 2009. A point mutation in the sensor histidine kinase SaeS of Staphylococcus aureus strain Newman alters the response to biocide exposure. J Bacteriol 191:7306-14.
71. Schenkman, J. B., and I. Jansson. 1998. Spectral Analyses of Cytochromes P450, p.
25-34. In I. R. Phillips and E. A. Shephard (ed.), Cytochrome P450 Protocols vol. 107. Humana Press, Totowa, New Jersey.
72. Schmitt, J., I. Joost, E. P. Skaar, M. Herrmann, and M. Bischoff. 2012. Haemin
represses the haemolytic activity of Staphylococcus aureus in an Sae-dependent manner. Microbiology 158:2619-31.
73. Schmitt, M. P. 1999. Identification of a two-component signal transduction system from
Corynebacterium diphtheriae that activates gene expression in response to the presence of heme and hemoglobin. J Bacteriol 181:5330-40.
74. Schneewind, O., P. Model, and V. A. Fischetti. 1992. Sorting of protein A to the
staphylococcal cell wall. Cell 70:267-81. 75. Skaar, E. P., A. H. Gaspar, and O. Schneewind. 2006. Bacillus anthracis IsdG, a
heme-degrading monooxygenase. J Bacteriol 188:1071-80. 76. Skaar, E. P., A. H. Gaspar, and O. Schneewind. 2004. IsdG and IsdI, heme-degrading
enzymes in the cytoplasm of Staphylococcus aureus. J Biol Chem 279:436-43. 77. Skaar, E. P., M. Humayun, T. Bae, K. L. DeBord, and O. Schneewind. 2004. Iron-
source preference of Staphylococcus aureus infections. Science 305:1626-8. 78. Skerker, J. M., B. S. Perchuk, A. Siryaporn, E. A. Lubin, O. Ashenberg, M.
Goulian, and M. T. Laub. 2008. Rewiring the specificity of two-component signal transduction systems. Cell 133:1043-54.
79. Skerker, J. M., M. S. Prasol, B. S. Perchuk, E. G. Biondi, and M. T. Laub. 2005.
Two-component signal transduction pathways regulating growth and cell cycle progression in a bacterium: a system-level analysis. PLoS Biol 3:e334.

120
80. Somerville, G. A., and R. A. Proctor. 2009. At the crossroads of bacterial metabolism and virulence factor synthesis in Staphylococci. Microbiol Mol Biol Rev 73:233-48.
81. Spirites, M. A., and P. S. Guth. 1963. Effects of chlorpromazine on biological
membranes-I.: Chlorpromazine-induced changes in liver mitochondria. Biochemical Pharmacology 12:37-46.
82. Stauff, D. L., D. Bagaley, V. J. Torres, R. Joyce, K. L. Anderson, L.
Kuechenmeister, P. M. Dunman, and E. P. Skaar. 2008. Staphylococcus aureus HrtA is an ATPase required for protection against heme toxicity and prevention of a transcriptional heme stress response. J Bacteriol 190:3588-96.
83. Stauff, D. L., and E. P. Skaar. 2009. Bacillus anthracis HssRS signalling to HrtAB
regulates haem resistance during infection. Molecular Microbiology 72:763-778. 84. Stauff, D. L., and E. P. Skaar. 2009. The heme sensor system of Staphylococcus
aureus. Contrib Microbiol 16:120-135. 85. Stauff, D. L., V. J. Torres, and E. P. Skaar. 2007. Signaling and DNA-binding
activities of the Staphylococcus aureus HssR-HssS two-component system required for heme sensing. J Biol Chem 282:26111-26121.
86. Stephenson, K., and J. A. Hoch. 2002. Evolution of signalling in the sporulation
phosphorelay. Mol Microbiol 46:297-304. 87. Sterne, M. 1937. Avirulent anthrax vaccine. Onderstepoort J Vet Sci Animal Ind 21:41–
43. 88. Stocker, R., Y. Yamamoto, A. F. McDonagh, A. N. Glazer, and B. N. Ames. 1987.
Bilirubin is an antioxidant of possible physiological importance. Science 235:1043-6. 89. Swoboda, J. G., T. C. Meredith, J. Campbell, S. Brown, T. Suzuki, T. Bollenbach, A.
J. Malhowski, R. Kishony, M. S. Gilmore, and S. Walker. 2009. Discovery of a small molecule that blocks wall teichoic acid biosynthesis in Staphylococcus aureus. ACS Chem Biol 4:875-83.
90. Torres, V. J., D. L. Stauff, G. Pishchany, J. S. Bezbradica, L. E. Gordy, J. Iturregui,
K. L. Anderson, P. Dunman, S. Joyce, and E. P. Skaar. 2007. A Staphylococcus aureus regulatory system that responds to host heme and modulates virulence. Cell Host & Microbe 1:109-119.
91. von Eiff, C., D. Bettin, R. A. Proctor, B. Rolauffs, N. Lindner, W. Winkelmann, and
G. Peters. 1997. Recovery of small colony variants of Staphylococcus aureus following gentamicin bead placement for osteomyelitis. Clin Infect Dis 25:1250-1.
92. von Eiff, C., C. Heilmann, R. A. Proctor, C. Woltz, G. Peters, and F. Gotz. 1997. A
site-directed Staphylococcus aureus hemB mutant is a small-colony variant which persists intracellularly. J Bacteriol 179:4706-12.

121
93. Wakeman, C. A., N. D. Hammer, D. L. Stauff, A. S. Attia, L. L. Anzaldi, S. I. Dikalov, M. W. Calcutt, and E. P. Skaar. 2012. Menaquinone biosynthesis potentiates haem toxicity in Staphylococcus aureus. Mol Microbiol.
94. Wang, F., D. Sambandan, R. Halder, J. Wang, S. M. Batt, B. Weinrick, I. Ahmad, P.
Yang, Y. Zhang, J. Kim, M. Hassani, S. Huszar, C. Trefzer, Z. Ma, T. Kaneko, K. E. Mdluli, S. Franzblau, A. K. Chatterjee, K. Johnson, K. Mikusova, G. S. Besra, K. Futterer, W. R. Jacobs, Jr., and P. G. Schultz. 2013. Identification of a small molecule with activity against drug-resistant and persistent tuberculosis. Proc Natl Acad Sci U S A 110:E2510-7.
95. Watanakunakorn, C. 1984. Mode of action and in-vitro activity of vancomycin. J
Antimicrob Chemother 14 Suppl D:7-18. 96. Weinberg, E. D. 2009. Iron availability and infection. Biochimica et Biophysica Acta
(BBA) - General Subjects 1790:600-605. 97. Wick, A. N., D. R. Drury, H. I. Nakada, J. B. Wolfe, and with the technical
assistance of B. Britton, and R. Grabowski. 1957. Localization of the primary metabolic block produced by 2-deoxyglucose. Journal of Biological Chemistry 224:963-969.
98. Yamamoto, Y., C. Poyart, P. Trieu-Cuot, G. Lamberet, A. Gruss, and P. Gaudu.
2006. Roles of environmental heme, and menaquinone, in Streptococcus agalactiae. Biometals 19:205-10.
99. Youngman, P. J., J. B. Perkins, and R. Losick. 1983. Genetic transposition and
insertional mutagenesis in Bacillus subtilis with Streptococcus faecalis transposon Tn917. Proc Natl Acad Sci U S A 80:2305-9.
100. Zhu, W., A. Wilks, and I. Stojiljkovic. 2000. Degradation of heme in gram-negative
bacteria: the product of the hemO gene of Neisseriae is a heme oxygenase. J. Bacteriol. 182:6783-6790.