Embed Size (px)
DESCRIPTION
gdgf
Citation preview
Removal of Waterborne Particles by Electrofiltration:Pilot-Scale Testing
Ying Li,1 Ray Ehrhard,1 Pratim Biswas,1,* Pramod Kulkarni,2 Keith Carns,3
Craig Patterson,4 Radha Krishnan,5 and Rajib Sinha5
1Department of Energy, Environmental and Chemical Engineering, Washington University in St. Louis, St. Louis, Missouri.2Center for Disease Control and Prevention, National Institute for Occupational Safety and Health, Cincinnati, Ohio.
3Global Energy Partners, LLC, Oakhurst, California.4Office of Research and Development, National Risk Management Research Laboratory, U.S. Environmental
Protection Agency, Cincinnati, Ohio.5Shaw Environmental and Infrastructure, Inc., Cincinnati, Ohio.
Received: July 6, 2009 Accepted in revised form: October 20, 2009
Abstract
Theoretical analysis using a trajectory approach indicated that in the presence of an external electric field,charged waterborne particles are subject to an additional migration velocity that increases their deposition on thesurface of collectors (e.g., sand filter). Although researchers conducted bench-scale experiments to verify theeffectiveness of electrofiltration, few studies have reported on the applications of electrofiltration in larger scalefacilities. In this study, a prototype pilot-scale electrofiltration unit, consisting of an acrylic tank (0.3�0.3�1.2 m)with vertically placed stainless steel mesh electrodes embedded in a sand filter was tested at a local drinkingwater plant. Presedimentation basin water was used as the influent with a turbidity ranging from 12 to 37NTU. At an approach velocity of 0.84 mm=s, an electrode voltage at 8 and 12 V increased the particle removalcoefficient pC* [defined as �log(Cout=Cin)] to 1.79 and 1.86, respectively, compared to 1.48 when there was noelectric field. Reducing the approach velocity from 0.84 to 0.42 mm=s increased pC* from 1.48 to 1.64, when theelectrode velocity was 16 V. Repetitive experiments were conducted and the results were in agreement withthose calculated by a theoretical trajectory analysis. The electrofiltration process was demonstrated to be moreeffective for removal of smaller particles (<4 mm), the size range of many waterborne bacteria. A voltage of8–12 V was shown to be the most cost-effective range, considering both the energy cost and filtration perfor-mance. The findings from this pilot-scale study are important for full-scale applications of the electrofiltrationtechnology.
Key words: water treatment; drinking water; waterborne particles; pathogens; electrofiltration; trajectory analysis;collection efficiency
Introduction
Effective removal of waterborne particles is an es-sential issue in the drinking water treatment process. The
particle removal mechanisms can be classified as gravityseparation (sedimentation or flotation) and filtration. To en-hance the removal efficiency, chemical additives (e.g., iron oraluminum salts, polymers) are widely utilized to eliminate thenegative charges carried by particles in nature. After chargeneutralization, these particles are ready to attach to each otheror to other surfaces to form larger settleable particles, called
flocs, which settle out or are removed during the water fil-tration process (AWWA, 1997). The filtration concept is quitesimple. Influent water passes through a granular sand layer(or other filter media), particles are captured by the media,and the water exits as effluent with fewer particles. The primeremoval of small particles is obtained in the filtration process,especially for parasites and other pathogens. However, out-breaks of some waterborne pathogens, such as Cryptospor-idium parvum are well documented in the United States(Hayes et al., 1989; Fox and Lytle, 1996; Harter et al., 2000).
The chemical additives enhance particle removal efficiency;however, they also increase the volume of solids residuals thatare formed as a byproduct of drinking water treatment. Thelandfill expense of residuals disposal amounts to millions ofdollars per year for the water treatment industry. Advancedtechnologies are necessary to enhance the particle removal
*Corresponding author: Department of Energy, Environmental andChemical Engineering, Washington University in St. Louis, 1Brookings Drive, St. Louis, MO 63130. Phone: (314) 935–5548; Fax:(314) 935–5464; E-mail: [email protected]
ENVIRONMENTAL ENGINEERING SCIENCEVolume 26, Number 12, 2009ª Mary Ann Liebert, Inc.DOI: 10.1089=ees.2009.0238
1795
efficiency in the drinking water treatment process whileminimizing the dosage of chemical additives. One potentialalternative method is electrofiltration, which applies an ex-ternal electric field inside the filtration layer to enhance par-ticle removal. The application of electric field on particleremoval is widely applied in air–particle systems, such aselectrostatic precipitators (ESPs). However, in the liquid–particle system, it has received much less attention, probablybecause of the higher viscosity of water and limitation inapplying high voltage in water media.
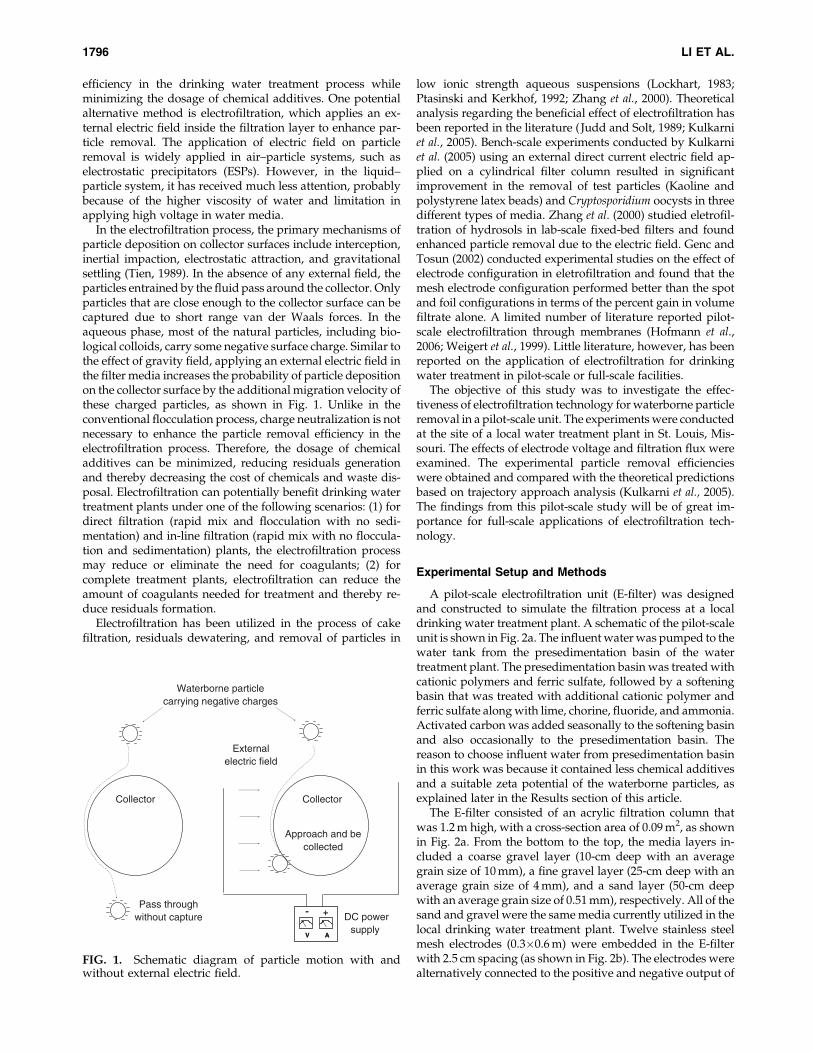
In the electrofiltration process, the primary mechanisms ofparticle deposition on collector surfaces include interception,inertial impaction, electrostatic attraction, and gravitationalsettling (Tien, 1989). In the absence of any external field, theparticles entrained by the fluid pass around the collector. Onlyparticles that are close enough to the collector surface can becaptured due to short range van der Waals forces. In theaqueous phase, most of the natural particles, including bio-logical colloids, carry some negative surface charge. Similar tothe effect of gravity field, applying an external electric field inthe filter media increases the probability of particle depositionon the collector surface by the additional migration velocity ofthese charged particles, as shown in Fig. 1. Unlike in theconventional flocculation process, charge neutralization is notnecessary to enhance the particle removal efficiency in theelectrofiltration process. Therefore, the dosage of chemicaladditives can be minimized, reducing residuals generationand thereby decreasing the cost of chemicals and waste dis-posal. Electrofiltration can potentially benefit drinking watertreatment plants under one of the following scenarios: (1) fordirect filtration (rapid mix and flocculation with no sedi-mentation) and in-line filtration (rapid mix with no floccula-tion and sedimentation) plants, the electrofiltration processmay reduce or eliminate the need for coagulants; (2) forcomplete treatment plants, electrofiltration can reduce theamount of coagulants needed for treatment and thereby re-duce residuals formation.
Electrofiltration has been utilized in the process of cakefiltration, residuals dewatering, and removal of particles in
low ionic strength aqueous suspensions (Lockhart, 1983;Ptasinski and Kerkhof, 1992; Zhang et al., 2000). Theoreticalanalysis regarding the beneficial effect of electrofiltration hasbeen reported in the literature ( Judd and Solt, 1989; Kulkarniet al., 2005). Bench-scale experiments conducted by Kulkarniet al. (2005) using an external direct current electric field ap-plied on a cylindrical filter column resulted in significantimprovement in the removal of test particles (Kaoline andpolystyrene latex beads) and Cryptosporidium oocysts in threedifferent types of media. Zhang et al. (2000) studied eletrofil-tration of hydrosols in lab-scale fixed-bed filters and foundenhanced particle removal due to the electric field. Genc andTosun (2002) conducted experimental studies on the effect ofelectrode configuration in eletrofiltration and found that themesh electrode configuration performed better than the spotand foil configurations in terms of the percent gain in volumefiltrate alone. A limited number of literature reported pilot-scale electrofiltration through membranes (Hofmann et al.,2006; Weigert et al., 1999). Little literature, however, has beenreported on the application of electrofiltration for drinkingwater treatment in pilot-scale or full-scale facilities.
The objective of this study was to investigate the effec-tiveness of electrofiltration technology for waterborne particleremoval in a pilot-scale unit. The experiments were conductedat the site of a local water treatment plant in St. Louis, Mis-souri. The effects of electrode voltage and filtration flux wereexamined. The experimental particle removal efficiencieswere obtained and compared with the theoretical predictionsbased on trajectory approach analysis (Kulkarni et al., 2005).The findings from this pilot-scale study will be of great im-portance for full-scale applications of electrofiltration tech-nology.
Experimental Setup and Methods
A pilot-scale electrofiltration unit (E-filter) was designedand constructed to simulate the filtration process at a localdrinking water treatment plant. A schematic of the pilot-scaleunit is shown in Fig. 2a. The influent water was pumped to thewater tank from the presedimentation basin of the watertreatment plant. The presedimentation basin was treated withcationic polymers and ferric sulfate, followed by a softeningbasin that was treated with additional cationic polymer andferric sulfate along with lime, chorine, fluoride, and ammonia.Activated carbon was added seasonally to the softening basinand also occasionally to the presedimentation basin. Thereason to choose influent water from presedimentation basinin this work was because it contained less chemical additivesand a suitable zeta potential of the waterborne particles, asexplained later in the Results section of this article.
The E-filter consisted of an acrylic filtration column thatwas 1.2 m high, with a cross-section area of 0.09 m2, as shownin Fig. 2a. From the bottom to the top, the media layers in-cluded a coarse gravel layer (10-cm deep with an averagegrain size of 10 mm), a fine gravel layer (25-cm deep with anaverage grain size of 4 mm), and a sand layer (50-cm deepwith an average grain size of 0.51 mm), respectively. All of thesand and gravel were the same media currently utilized in thelocal drinking water treatment plant. Twelve stainless steelmesh electrodes (0.3�0.6 m) were embedded in the E-filterwith 2.5 cm spacing (as shown in Fig. 2b). The electrodes werealternatively connected to the positive and negative output of
Collector
Waterborne particlecarrying negative charges
External electric field
DC powersupply
Collector
Pass through without capture
Approach and becollected
- +
V A
- +
V A
FIG. 1. Schematic diagram of particle motion with andwithout external electric field.
1796 LI ET AL.
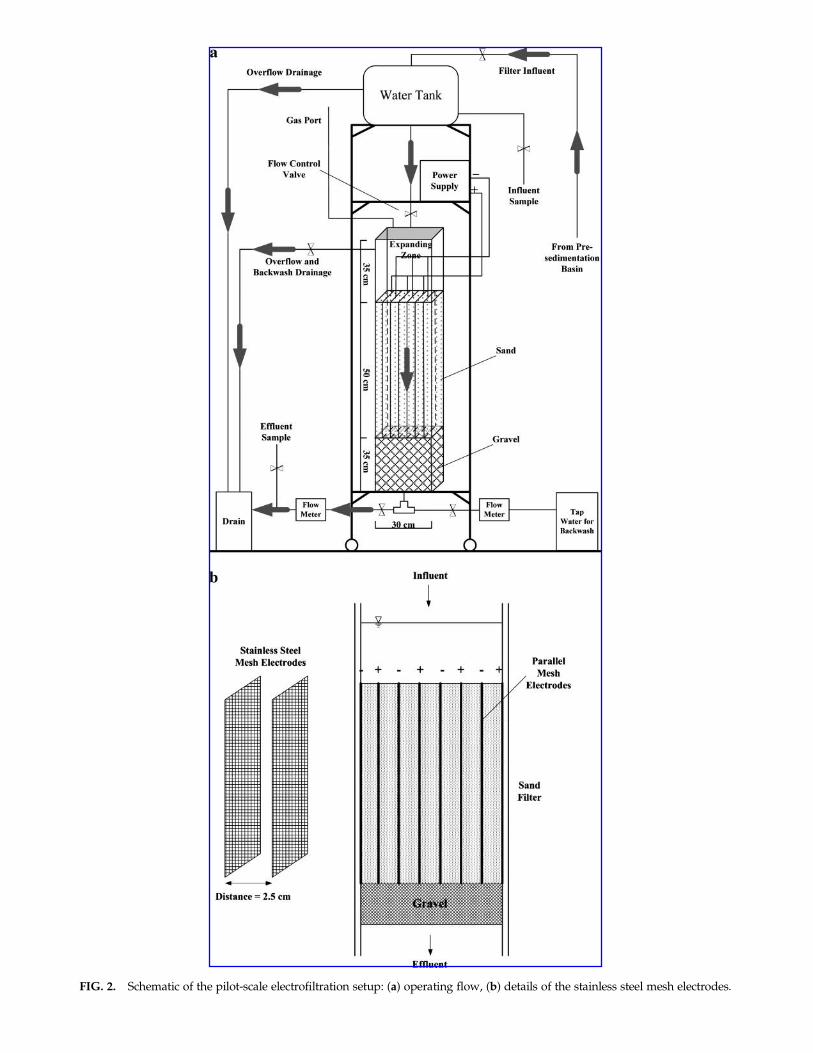
FIG. 2. Schematic of the pilot-scale electrofiltration setup: (a) operating flow, (b) details of the stainless steel mesh electrodes.
a power supply (BK Precision, Yorba Linda, CA; VSP6020). Awater tank located on the top of the frame was utilized as areservoir to maintain a constant hydraulic head, approxima-tely 0.9 m of water, above the sand filter. The influent flow ratewas controlled by a valve between the water tank and thefilter. The filtered water (E-filter effluent) passes through aflow meter, which monitored both the flow rate and the totalflow, and was then discharged to drain. During the interval ofeach run, the E-filter was backwashed for 15 min by tap waterto remove the captured particles.
The experimental plan is summarized in Table 1. Tests 1 to 3were designed to prove the concept of electrofiltration, that is,to verify that the electric field enhances particle capture in alarge-scale unit. For each of these tests, while keeping the in-fluent approach velocity constant, the power was turned onand off alternatively every 2 h so that the enhancement due tothe electric field can be determined. The hydraulic residencetime in the filter was approximately 10 and 20 min when theapproach velocity was 0.84 and 0.42 mm=s, respectively. Thetesting duration (2 h) was appropriate because it was muchlonger than the maximum hydraulic residence time (20 min).The filter was backwashed for 15 min (approach velocity wasapproximately 5 mm=s) between the switch of each poweron=off condition. Each test (i.e., the power on=off cycle) wasrepeated for three times. Test 4 investigated the effect ofapproach velocity on electrofiltration while applying a constantvoltage across the electrodes. Test 5 explored the effect ofelectrode voltage while maintaining a constant approachvelocity. For all the tests, both influent and effluent samples(sample size¼ 3) were collected and analyzed in terms of tur-bidity, zeta potential, and particle counts. The turbidity wasmeasured using a Hach 2100AN turbidimeter. The zeta po-tential was measured using a Zetasizer Nano ZS (MalvernCorp., Malvern, PA). The number of waterborne particles in thesize range of 2–100mm was measured using an optical particlecounter (Particle Measuring Systems, Boulder, CO).
Theoretical Analysis
A theoretical analysis using a trajectory approach waspreviously reported by Kulkarni et al. (2005) to calculate thecritical trajectory around a spherical collector in the presenceof an electric field from the solution of a trajectory equation.The equation combines the effects of the external electric force,the gravity force, the viscosity drag force, the electric doublelayer force, and the London–van der Waals force. In thisstudy, the theoretical approach developed by Kulkarni et al.(2005) was adopted to calculate the external electric force, theparticle migration velocity due to electric force, the singlecollector efficiency, and the overall particle collection effi-ciency of electrofiltration.
A charged colloidal particle in the presence of an electricfield experiences a force proportional to its charge and theelectric field. As the electrodes are placed vertically in thisstudy, the strength of the electric field E can be calculated fromthe electric potential, U, and the spacing of the electrodes, Ls.
Subsequently, the external electric field force that a particleexperiences is expressed as
FE¼ qE (1)
where q is the particle surface charge that can be derived fromthe measured zeta potential of the colloidal particles:
q¼ 3pdpeDf (2)
where dp is the particle size, eD is the dielectric permittivity ofwater (*80 e0), and z is zeta potential. The migration velocityof a particle due to the electric field can be calculated as
Vm¼FE
3pldp(3)
where m is the viscosity of water. The nondimensional externalelectric field force, the nondimensional gravity force, and thenondimensional van der Waals force can be calculated, re-spectively, as follows:
NEF¼Vm
Vw¼ qE
3pldpVw(4)
NG¼dp
2(qP� qw)g
18lVw(5)
NLO¼4H
9pldp2Vw
(6)
where Vw is the approach velocity of water, and rp and rw
are particle and water density, respectively. Once the abovenondimensional forces are calculated, the single collector ef-ficiency, Zsingle, can be solved from the trajectory equation(Kulkarni et al., 2005).
Finally, the overall particle removal performance can beexpressed using a log-removal coefficient, pC*:
pC� ¼ �logCout
Cin
� �(7)
where Cin and Cout are particle concentrations at the filter inletand outlet, respectively. The value of �log(Cout=Cin) can be
Table 1. Experimental Plan for Electrofiltration Tests
Test Approach velocity Vw (mm=s) Applied voltage U (V) Description
1 0.42 0$ 8 Power on and off alternatively2 0.42 0$ 16 Power on and off alternatively3 0.84 0$ 24 Power on and off alternatively4 0.42? 0.63? 0.84 16 Consecutively increasing the approach velocity5 0.84 0? 8? 12? 16 Consecutively increasing the voltage
During each test the filter was backwashed for 15 min between the changes in operating conditions.
1798 LI ET AL.
estimated from the following relation (Yao et al., 1971; Kulk-arni et al., 2005):
� logCout
Cin
� �¼
gsingle
43
ac
(1� e)LH
(8)
where Zsingle is the single collector efficiency, ac is the radius ofsand granule, e is the filter media porosity, and LH is the depthof sand filter.
Results and Discussion
Turbidity and zeta potential
Table 2 lists turbidity and zeta potential results for samplesof river water and presedimentation basin water. The tur-bidity of river water varied from test to test, mainly due toseasonal changes. The turbidity of presedimentation basinwater also changed with corresponding fluctuations in riverwater, but generally was one order of magnitude lower thanthat of the river water. The zeta potential, however, did notvary much from test to test, and it only decreased slightlyfrom the river water to the presedimentation basin water.Because zeta potential is a critical parameter representing thesurface charge of waterborne particles, a higher absolute va-lue of zeta potential normally corresponds to a higher effi-ciency of electrofiltration. Hence, the presedimentation basinwater, which generally has a zeta potential greater than�15 mV (Table 2), was selected as influent water to the E-filter.
Proof of concept tests
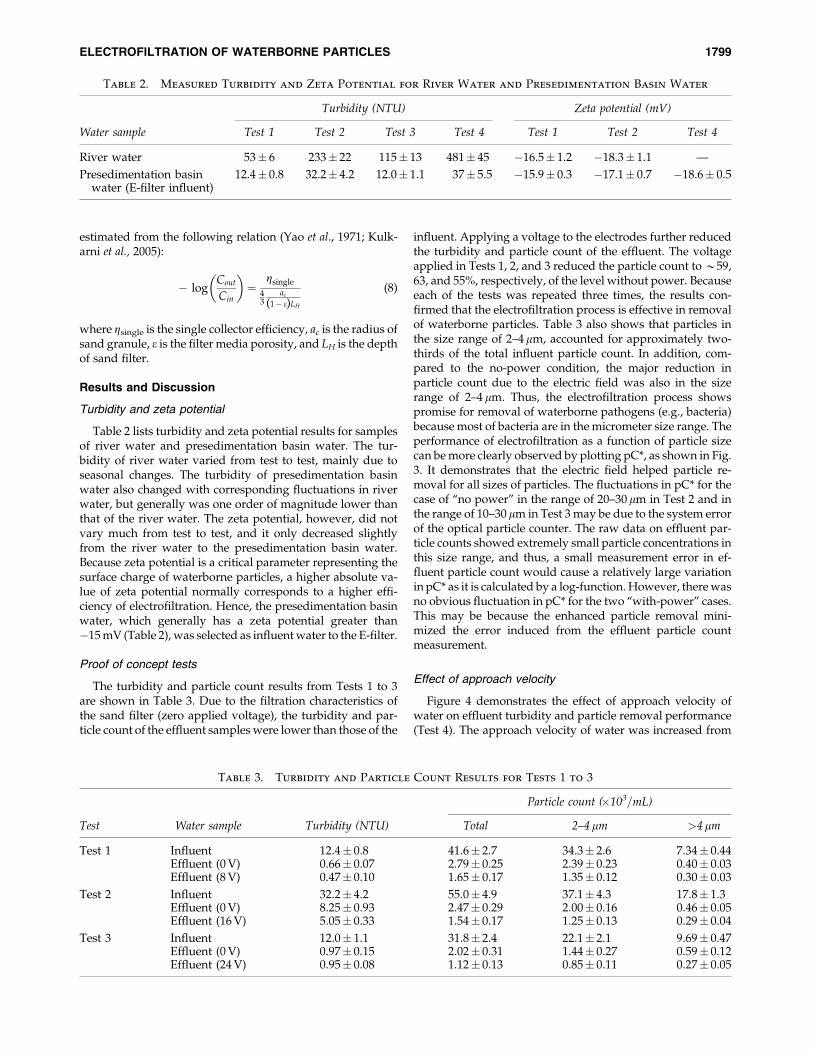
The turbidity and particle count results from Tests 1 to 3are shown in Table 3. Due to the filtration characteristics ofthe sand filter (zero applied voltage), the turbidity and par-ticle count of the effluent samples were lower than those of the
influent. Applying a voltage to the electrodes further reducedthe turbidity and particle count of the effluent. The voltageapplied in Tests 1, 2, and 3 reduced the particle count to *59,63, and 55%, respectively, of the level without power. Becauseeach of the tests was repeated three times, the results con-firmed that the electrofiltration process is effective in removalof waterborne particles. Table 3 also shows that particles inthe size range of 2–4mm, accounted for approximately two-thirds of the total influent particle count. In addition, com-pared to the no-power condition, the major reduction inparticle count due to the electric field was also in the sizerange of 2–4 mm. Thus, the electrofiltration process showspromise for removal of waterborne pathogens (e.g., bacteria)because most of bacteria are in the micrometer size range. Theperformance of electrofiltration as a function of particle sizecan be more clearly observed by plotting pC*, as shown in Fig.3. It demonstrates that the electric field helped particle re-moval for all sizes of particles. The fluctuations in pC* for thecase of ‘‘no power’’ in the range of 20–30 mm in Test 2 and inthe range of 10–30mm in Test 3 may be due to the system errorof the optical particle counter. The raw data on effluent par-ticle counts showed extremely small particle concentrations inthis size range, and thus, a small measurement error in ef-fluent particle count would cause a relatively large variationin pC* as it is calculated by a log-function. However, there wasno obvious fluctuation in pC* for the two ‘‘with-power’’ cases.This may be because the enhanced particle removal mini-mized the error induced from the effluent particle countmeasurement.
Effect of approach velocity
Figure 4 demonstrates the effect of approach velocity ofwater on effluent turbidity and particle removal performance(Test 4). The approach velocity of water was increased from
Table 2. Measured Turbidity and Zeta Potential for River Water and Presedimentation Basin Water
Turbidity (NTU) Zeta potential (mV)
Water sample Test 1 Test 2 Test 3 Test 4 Test 1 Test 2 Test 4
River water 53� 6 233� 22 115� 13 481� 45 �16.5� 1.2 �18.3� 1.1 —
Presedimentation basinwater (E-filter influent)
12.4� 0.8 32.2� 4.2 12.0� 1.1 37� 5.5 �15.9� 0.3 �17.1� 0.7 �18.6� 0.5
Table 3. Turbidity and Particle Count Results for Tests 1 to 3
Particle count (�103=mL)
Test Water sample Turbidity (NTU) Total 2–4mm >4mm
Test 1 Influent 12.4� 0.8 41.6� 2.7 34.3� 2.6 7.34� 0.44Effluent (0 V) 0.66� 0.07 2.79� 0.25 2.39� 0.23 0.40� 0.03Effluent (8 V) 0.47� 0.10 1.65� 0.17 1.35� 0.12 0.30� 0.03
Test 2 Influent 32.2� 4.2 55.0� 4.9 37.1� 4.3 17.8� 1.3Effluent (0 V) 8.25� 0.93 2.47� 0.29 2.00� 0.16 0.46� 0.05Effluent (16 V) 5.05� 0.33 1.54� 0.17 1.25� 0.13 0.29� 0.04
Test 3 Influent 12.0� 1.1 31.8� 2.4 22.1� 2.1 9.69� 0.47Effluent (0 V) 0.97� 0.15 2.02� 0.31 1.44� 0.27 0.59� 0.12Effluent (24 V) 0.95� 0.08 1.12� 0.13 0.85� 0.11 0.27� 0.05
ELECTROFILTRATION OF WATERBORNE PARTICLES 1799
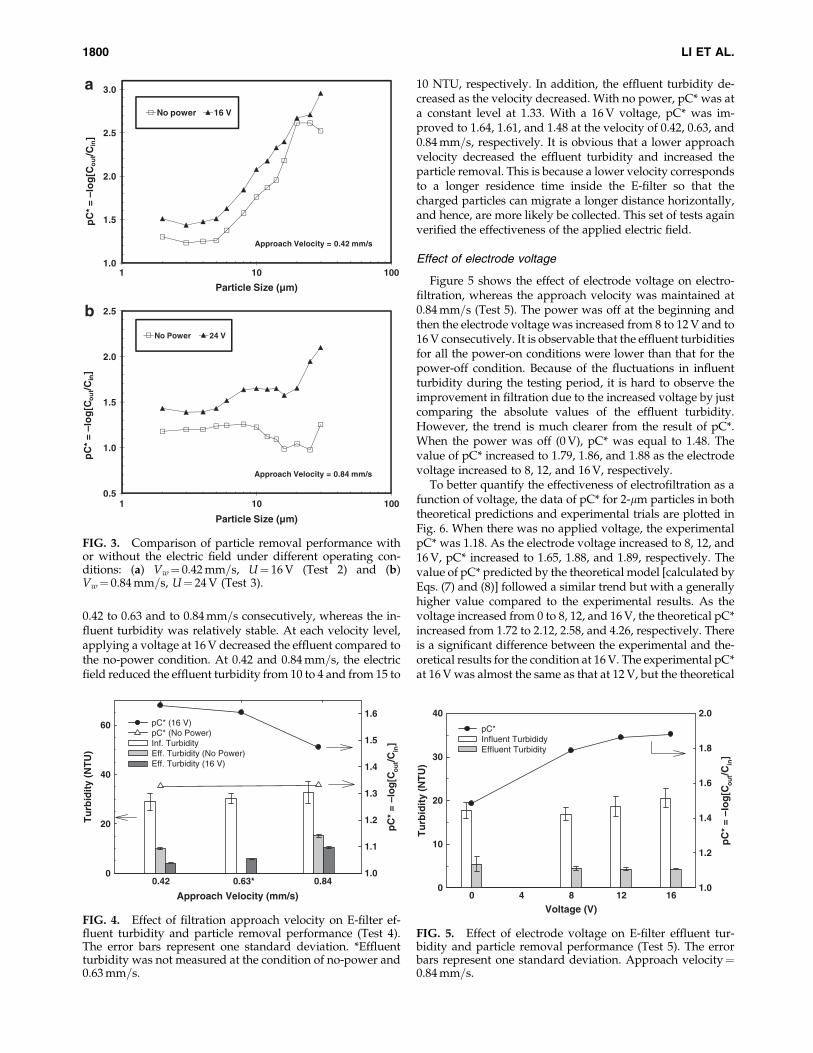
0.42 to 0.63 and to 0.84 mm=s consecutively, whereas the in-fluent turbidity was relatively stable. At each velocity level,applying a voltage at 16 V decreased the effluent compared tothe no-power condition. At 0.42 and 0.84 mm=s, the electricfield reduced the effluent turbidity from 10 to 4 and from 15 to
10 NTU, respectively. In addition, the effluent turbidity de-creased as the velocity decreased. With no power, pC* was ata constant level at 1.33. With a 16 V voltage, pC* was im-proved to 1.64, 1.61, and 1.48 at the velocity of 0.42, 0.63, and0.84 mm=s, respectively. It is obvious that a lower approachvelocity decreased the effluent turbidity and increased theparticle removal. This is because a lower velocity correspondsto a longer residence time inside the E-filter so that thecharged particles can migrate a longer distance horizontally,and hence, are more likely be collected. This set of tests againverified the effectiveness of the applied electric field.
Effect of electrode voltage
Figure 5 shows the effect of electrode voltage on electro-filtration, whereas the approach velocity was maintained at0.84 mm=s (Test 5). The power was off at the beginning andthen the electrode voltage was increased from 8 to 12 V and to16 V consecutively. It is observable that the effluent turbiditiesfor all the power-on conditions were lower than that for thepower-off condition. Because of the fluctuations in influentturbidity during the testing period, it is hard to observe theimprovement in filtration due to the increased voltage by justcomparing the absolute values of the effluent turbidity.However, the trend is much clearer from the result of pC*.When the power was off (0 V), pC* was equal to 1.48. Thevalue of pC* increased to 1.79, 1.86, and 1.88 as the electrodevoltage increased to 8, 12, and 16 V, respectively.
To better quantify the effectiveness of electrofiltration as afunction of voltage, the data of pC* for 2-mm particles in boththeoretical predictions and experimental trials are plotted inFig. 6. When there was no applied voltage, the experimentalpC* was 1.18. As the electrode voltage increased to 8, 12, and16 V, pC* increased to 1.65, 1.88, and 1.89, respectively. Thevalue of pC* predicted by the theoretical model [calculated byEqs. (7) and (8)] followed a similar trend but with a generallyhigher value compared to the experimental results. As thevoltage increased from 0 to 8, 12, and 16 V, the theoretical pC*increased from 1.72 to 2.12, 2.58, and 4.26, respectively. Thereis a significant difference between the experimental and the-oretical results for the condition at 16 V. The experimental pC*at 16 V was almost the same as that at 12 V, but the theoretical
1.0
1.5
2.0
2.5
3.0
100101
pC
* =
–lo
g[C
ou
t/Cin
]
Particle Size (µm)
No power 16 V
Approach Velocity = 0.42 mm/s
0.5
1.0
1.5
2.0
2.5
100101
pC
* =
–lo
g[C
ou
t/Cin
]
Particle Size (µm)
No Power 24 V
Approach Velocity = 0.84 mm/s
a
b
FIG. 3. Comparison of particle removal performance withor without the electric field under different operating con-ditions: (a) Vw¼ 0.42 mm=s, U¼ 16 V (Test 2) and (b)Vw¼ 0.84 mm=s, U¼ 24 V (Test 3).
Approach Velocity (mm/s)
0.42 0.63* 0.84
pC
* =
–lo
g[C
ou
t/Cin
]
1.0
1.1
1.2
1.3
1.4
1.5
1.6
Tu
rbid
ity
(NT
U)
0
20
40
60 pC* (16 V)pC* (No Power)Inf. TurbidityEff. Turbidity (No Power)Eff. Turbidity (16 V)
FIG. 4. Effect of filtration approach velocity on E-filter ef-fluent turbidity and particle removal performance (Test 4).The error bars represent one standard deviation. *Effluentturbidity was not measured at the condition of no-power and0.63 mm=s.
Voltage (V)0 4 8 12 16
pC
* =
–lo
g[C
ou
t/Cin
]
1.0
1.2
1.4
1.6
1.8
2.0
Tu
rbid
ity
(NT
U)
0
10
20
30
40
pC*Influent TurbididyEffluent Turbidity
FIG. 5. Effect of electrode voltage on E-filter effluent tur-bidity and particle removal performance (Test 5). The errorbars represent one standard deviation. Approach velocity¼0.84 mm=s.
1800 LI ET AL.
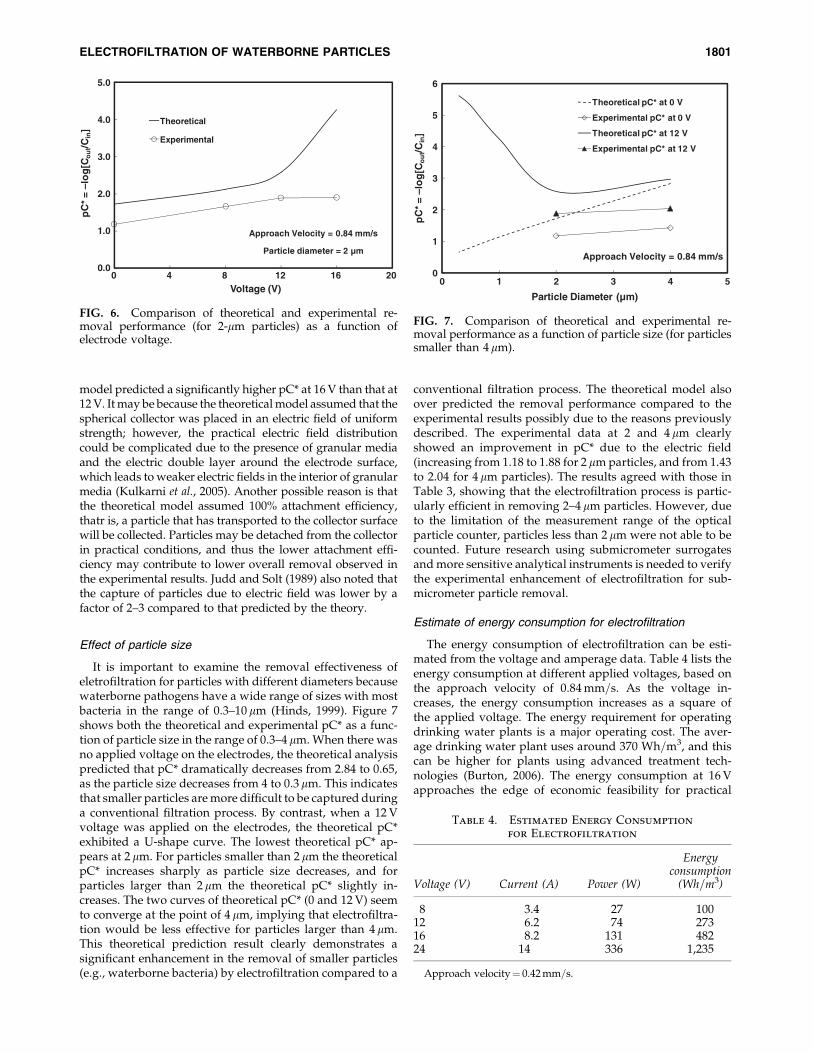
model predicted a significantly higher pC* at 16 V than that at12 V. It may be because the theoretical model assumed that thespherical collector was placed in an electric field of uniformstrength; however, the practical electric field distributioncould be complicated due to the presence of granular mediaand the electric double layer around the electrode surface,which leads to weaker electric fields in the interior of granularmedia (Kulkarni et al., 2005). Another possible reason is thatthe theoretical model assumed 100% attachment efficiency,thatr is, a particle that has transported to the collector surfacewill be collected. Particles may be detached from the collectorin practical conditions, and thus the lower attachment effi-ciency may contribute to lower overall removal observed inthe experimental results. Judd and Solt (1989) also noted thatthe capture of particles due to electric field was lower by afactor of 2–3 compared to that predicted by the theory.
Effect of particle size
It is important to examine the removal effectiveness ofeletrofiltration for particles with different diameters becausewaterborne pathogens have a wide range of sizes with mostbacteria in the range of 0.3–10 mm (Hinds, 1999). Figure 7shows both the theoretical and experimental pC* as a func-tion of particle size in the range of 0.3–4 mm. When there wasno applied voltage on the electrodes, the theoretical analysispredicted that pC* dramatically decreases from 2.84 to 0.65,as the particle size decreases from 4 to 0.3 mm. This indicatesthat smaller particles are more difficult to be captured duringa conventional filtration process. By contrast, when a 12 Vvoltage was applied on the electrodes, the theoretical pC*exhibited a U-shape curve. The lowest theoretical pC* ap-pears at 2 mm. For particles smaller than 2 mm the theoreticalpC* increases sharply as particle size decreases, and forparticles larger than 2 mm the theoretical pC* slightly in-creases. The two curves of theoretical pC* (0 and 12 V) seemto converge at the point of 4 mm, implying that electrofiltra-tion would be less effective for particles larger than 4 mm.This theoretical prediction result clearly demonstrates asignificant enhancement in the removal of smaller particles(e.g., waterborne bacteria) by electrofiltration compared to a
conventional filtration process. The theoretical model alsoover predicted the removal performance compared to theexperimental results possibly due to the reasons previouslydescribed. The experimental data at 2 and 4 mm clearlyshowed an improvement in pC* due to the electric field(increasing from 1.18 to 1.88 for 2 mm particles, and from 1.43to 2.04 for 4 mm particles). The results agreed with those inTable 3, showing that the electrofiltration process is partic-ularly efficient in removing 2–4 mm particles. However, dueto the limitation of the measurement range of the opticalparticle counter, particles less than 2 mm were not able to becounted. Future research using submicrometer surrogatesand more sensitive analytical instruments is needed to verifythe experimental enhancement of electrofiltration for sub-micrometer particle removal.
Estimate of energy consumption for electrofiltration
The energy consumption of electrofiltration can be esti-mated from the voltage and amperage data. Table 4 lists theenergy consumption at different applied voltages, based onthe approach velocity of 0.84 mm=s. As the voltage in-creases, the energy consumption increases as a square ofthe applied voltage. The energy requirement for operatingdrinking water plants is a major operating cost. The aver-age drinking water plant uses around 370 Wh=m3, and thiscan be higher for plants using advanced treatment tech-nologies (Burton, 2006). The energy consumption at 16 Vapproaches the edge of economic feasibility for practical
0
1
2
3
4
5
6
0 1 2 3 4 5
pC
* =
–lo
g[C
ou
t/Cin
]
Particle Diameter (µm)
Theoretical pC* at 0 V
Experimental pC* at 0 V
Theoretical pC* at 12 V
Experimental pC* at 12 V
Approach Velocity = 0.84 mm/s
FIG. 7. Comparison of theoretical and experimental re-moval performance as a function of particle size (for particlessmaller than 4mm).
0.0
1.0
2.0
3.0
4.0
5.0
0 4 8 12 16 20
pC
* =
–lo
g[C
ou
t/Cin
]
Voltage (V)
Theoretical
Experimental
Approach Velocity = 0.84 mm/s
Particle diameter = 2 µm
FIG. 6. Comparison of theoretical and experimental re-moval performance (for 2-mm particles) as a function ofelectrode voltage.
Table 4. Estimated Energy Consumption
for Electrofiltration
Voltage (V) Current (A) Power (W)
Energyconsumption
(Wh=m3)
8 3.4 27 10012 6.2 74 27316 8.2 131 48224 14 336 1,235
Approach velocity¼ 0.42 mm=s.
ELECTROFILTRATION OF WATERBORNE PARTICLES 1801
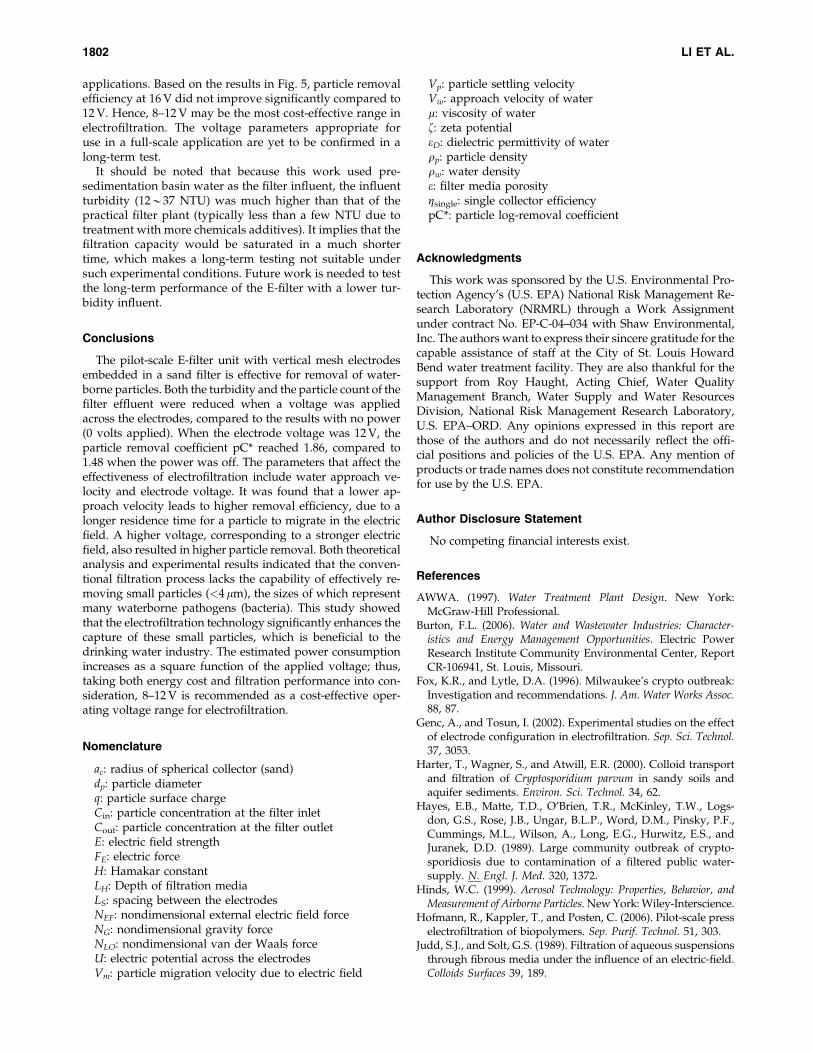
applications. Based on the results in Fig. 5, particle removalefficiency at 16 V did not improve significantly compared to12 V. Hence, 8–12 V may be the most cost-effective range inelectrofiltration. The voltage parameters appropriate foruse in a full-scale application are yet to be confirmed in along-term test.
It should be noted that because this work used pre-sedimentation basin water as the filter influent, the influentturbidity (12*37 NTU) was much higher than that of thepractical filter plant (typically less than a few NTU due totreatment with more chemicals additives). It implies that thefiltration capacity would be saturated in a much shortertime, which makes a long-term testing not suitable undersuch experimental conditions. Future work is needed to testthe long-term performance of the E-filter with a lower tur-bidity influent.
Conclusions
The pilot-scale E-filter unit with vertical mesh electrodesembedded in a sand filter is effective for removal of water-borne particles. Both the turbidity and the particle count of thefilter effluent were reduced when a voltage was appliedacross the electrodes, compared to the results with no power(0 volts applied). When the electrode voltage was 12 V, theparticle removal coefficient pC* reached 1.86, compared to1.48 when the power was off. The parameters that affect theeffectiveness of electrofiltration include water approach ve-locity and electrode voltage. It was found that a lower ap-proach velocity leads to higher removal efficiency, due to alonger residence time for a particle to migrate in the electricfield. A higher voltage, corresponding to a stronger electricfield, also resulted in higher particle removal. Both theoreticalanalysis and experimental results indicated that the conven-tional filtration process lacks the capability of effectively re-moving small particles (<4 mm), the sizes of which representmany waterborne pathogens (bacteria). This study showedthat the electrofiltration technology significantly enhances thecapture of these small particles, which is beneficial to thedrinking water industry. The estimated power consumptionincreases as a square function of the applied voltage; thus,taking both energy cost and filtration performance into con-sideration, 8–12 V is recommended as a cost-effective oper-ating voltage range for electrofiltration.
Nomenclature
ac: radius of spherical collector (sand)dp: particle diameterq: particle surface chargeCin: particle concentration at the filter inletCout: particle concentration at the filter outletE: electric field strengthFE: electric forceH: Hamakar constantLH: Depth of filtration mediaLS: spacing between the electrodesNEF: nondimensional external electric field forceNG: nondimensional gravity forceNLO: nondimensional van der Waals forceU: electric potential across the electrodesVm: particle migration velocity due to electric field
Vp: particle settling velocityVw: approach velocity of waterm: viscosity of waterz: zeta potentialeD: dielectric permittivity of waterrp: particle densityrw: water densitye: filter media porosityZsingle: single collector efficiencypC*: particle log-removal coefficient
Acknowledgments
This work was sponsored by the U.S. Environmental Pro-tection Agency’s (U.S. EPA) National Risk Management Re-search Laboratory (NRMRL) through a Work Assignmentunder contract No. EP-C-04–034 with Shaw Environmental,Inc. The authors want to express their sincere gratitude for thecapable assistance of staff at the City of St. Louis HowardBend water treatment facility. They are also thankful for thesupport from Roy Haught, Acting Chief, Water QualityManagement Branch, Water Supply and Water ResourcesDivision, National Risk Management Research Laboratory,U.S. EPA–ORD. Any opinions expressed in this report arethose of the authors and do not necessarily reflect the offi-cial positions and policies of the U.S. EPA. Any mention ofproducts or trade names does not constitute recommendationfor use by the U.S. EPA.
Author Disclosure Statement
No competing financial interests exist.
References
AWWA. (1997). Water Treatment Plant Design. New York:McGraw-Hill Professional.
Burton, F.L. (2006). Water and Wastewater Industries: Character-istics and Energy Management Opportunities. Electric PowerResearch Institute Community Environmental Center, ReportCR-106941, St. Louis, Missouri.
Fox, K.R., and Lytle, D.A. (1996). Milwaukee’s crypto outbreak:Investigation and recommendations. J. Am. Water Works Assoc.88, 87.
Genc, A., and Tosun, I. (2002). Experimental studies on the effectof electrode configuration in electrofiltration. Sep. Sci. Technol.37, 3053.
Harter, T., Wagner, S., and Atwill, E.R. (2000). Colloid transportand filtration of Cryptosporidium parvum in sandy soils andaquifer sediments. Environ. Sci. Technol. 34, 62.
Hayes, E.B., Matte, T.D., O’Brien, T.R., McKinley, T.W., Logs-don, G.S., Rose, J.B., Ungar, B.L.P., Word, D.M., Pinsky, P.F.,Cummings, M.L., Wilson, A., Long, E.G., Hurwitz, E.S., andJuranek, D.D. (1989). Large community outbreak of crypto-sporidiosis due to contamination of a filtered public water-supply. N. Engl. J. Med. 320, 1372.
Hinds, W.C. (1999). Aerosol Technology: Properties, Behavior, andMeasurement of Airborne Particles. New York: Wiley-Interscience.
Hofmann, R., Kappler, T., and Posten, C. (2006). Pilot-scale presselectrofiltration of biopolymers. Sep. Purif. Technol. 51, 303.
Judd, S.J., and Solt, G.S. (1989). Filtration of aqueous suspensionsthrough fibrous media under the influence of an electric-field.Colloids Surfaces 39, 189.
1802 LI ET AL.

Kulkarni, P., Dutari, G., Weingeist, D., Adin, A., Haught, R., andBiswas, P. (2005). Capture of water-borne colloids in granularbeds using external electric fields: Improving removal ofCryptosporidium parvum. Water Res. 39, 1047.
Lockhart, N.C. (1983). Electroosmotic dewatering of clays. IIIInfluence of clay type, exchangable cations and electrodematerials. Colloids and Surfaces 6, 253.
Ptasinski, K.J., and Kerkhof, P. (1992). Electric-field drivenseparations—Phenomena and applications. Sep. Sci. Technol.27, 995.
Tien, C. (1989). Granular Filtration of Aerosols and Hydrosols.London: Butterworth-Heinemann.
Weigert, T., Altmann, J., and Ripperger, S. (1999). Crossflowelectrofiltration in pilot scale. J. Membr. Sci. 159, 253.
Yao, K., Habibian, M., and O’Melia, C. (1971). Water and waste-water filtration: Concepts and applications. Environ. Sci.Technol. 5, 1105.
Zhang, S., Tan, R.B.H., Neoh, K.G., and Tien, C. (2000). Elec-trofiltration of aqueous suspensions. J. Colloid Interface Sci.228, 393.
ELECTROFILTRATION OF WATERBORNE PARTICLES 1803


