Embed Size (px)
Citation preview
1 1
Model studies of some atmospheric Model studies of some atmospheric aerosols and comparisons with aerosols and comparisons with
measurementsmeasurements
K. G e o r g i e vK. G e o r g i e vI P P – B A S,I P P – B A S,
S o f i a, B u l g a r i aS o f i a, B u l g a r i a

2 2
IntroductionIntroduction
DG Joint Research Centre of European Commission
Institute for Environment and Sustainability
(IES – JRC, Ispra, Italy)
M. Krool, F. Dentener, E. Vignati
3 3
AerosolsAerosols
big and increasing importance for the assessment of air quality and climate forcing;
play a crucial role for global temperature modifications;
research of aerosols in the surface layer is mainly motivated of their impact on human health and possible ecological effects.
4 4
AerosolsAerosols
Aerosols are defined as relatively stable suspensions of solid or liquid particles in a gas.
The aerosols can be classified as primary (those that are emitted in particulate form directly from sources) and secondary (particles produced in the atmosphere).
5 5
AerosolsAerosols
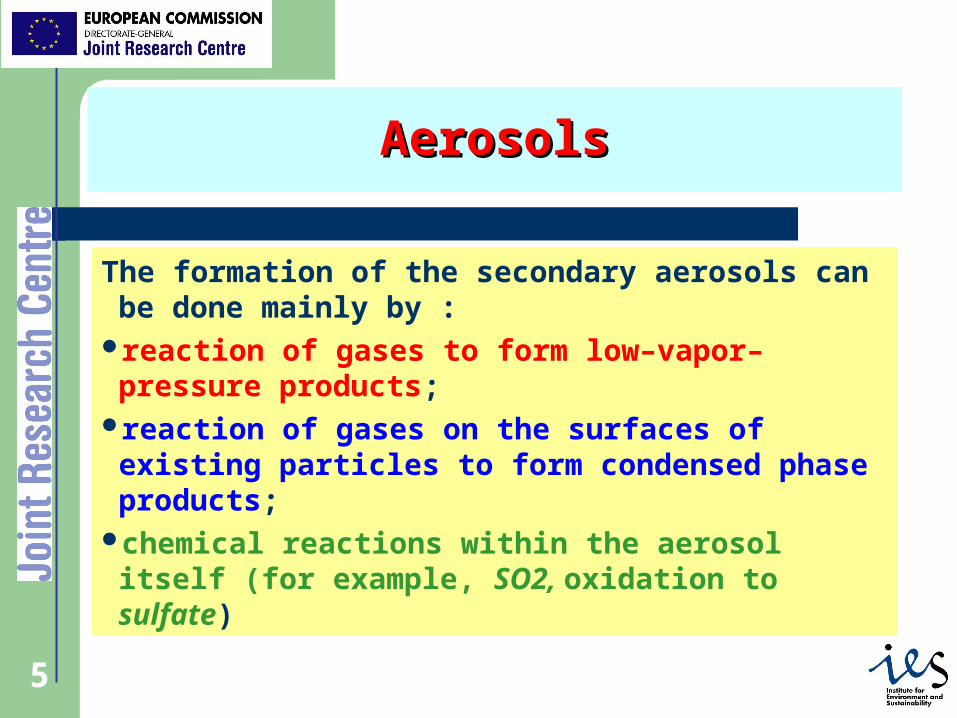
The formation of the secondary aerosols can be done mainly by :
reaction of gases to form low–vapor–pressure products;
reaction of gases on the surfaces of existing particles to form condensed phase products;
chemical reactions within the aerosol itself (for example, SO2, oxidation to sulfate)
6 6
TM5 ModelTM5 Model
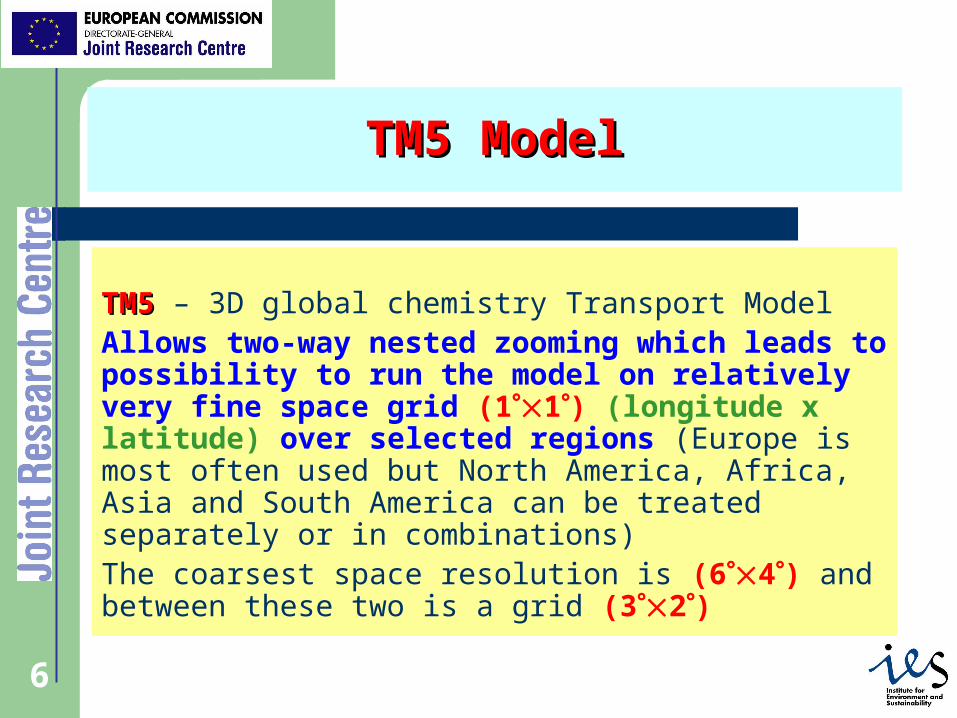
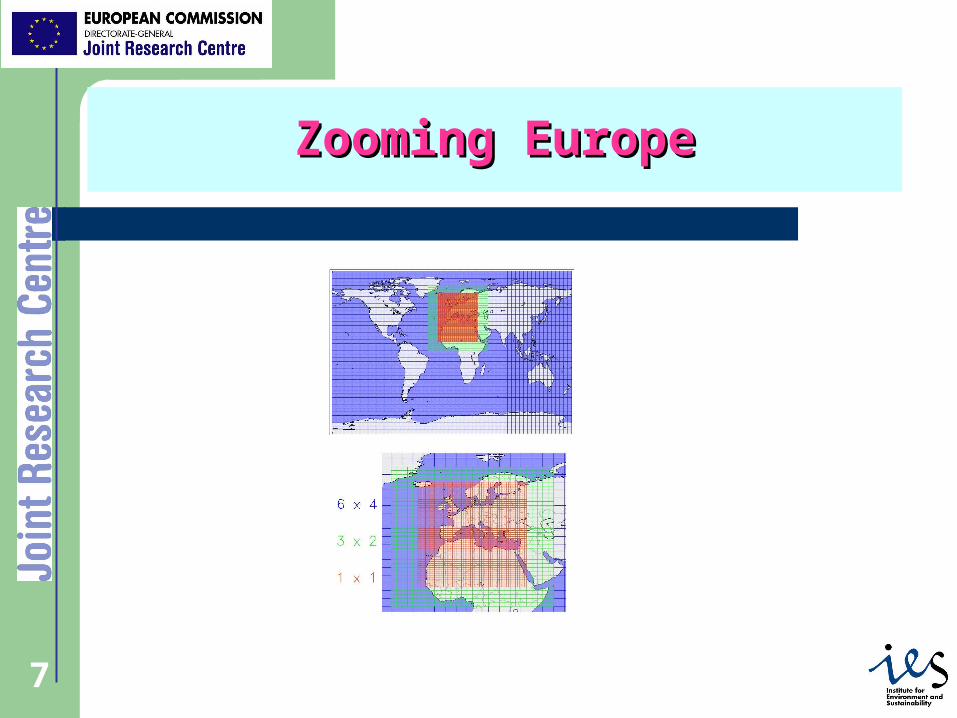
TM5TM5 – 3D global chemistry Transport ModelAllows two-way nested zooming which leads to possibility to run the model on relatively very fine space grid (11) (longitude x latitude) over selected regions (Europe is most often used but North America, Africa, Asia and South America can be treated separately or in combinations)The coarsest space resolution is (64) and between these two is a grid (32)
7 7
Zooming EuropeZooming Europe

8 8
Zooming AfricaZooming Africa

9 9
Zooming AsiaZooming Asia

10 10
Zooming North AmericaZooming North America
11 11
Vertical resolutionVertical resolution
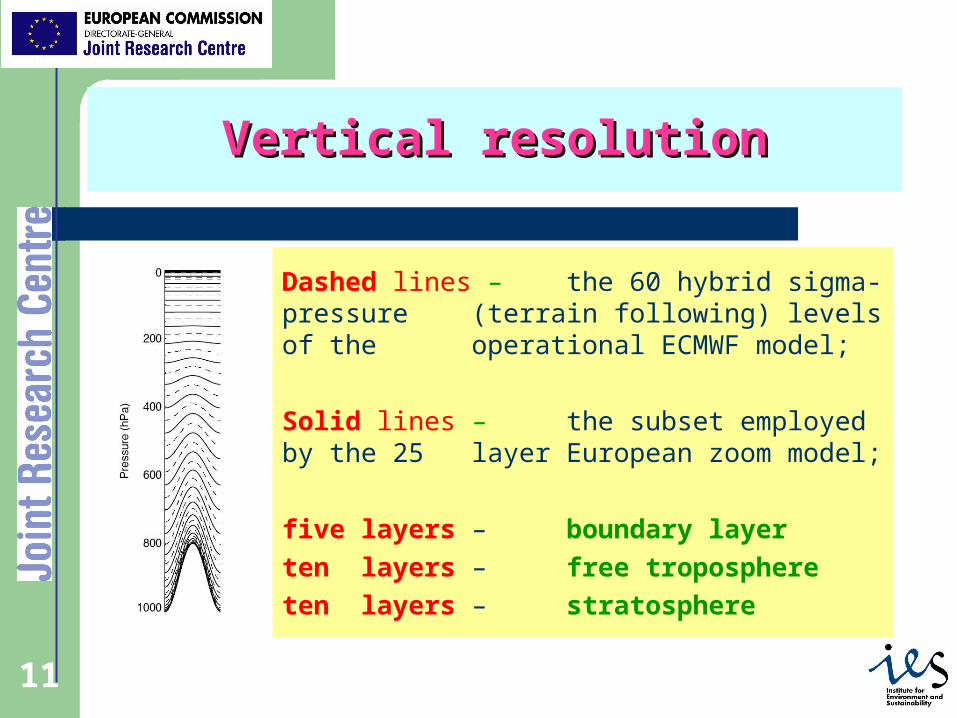
Dashed lines – the 60 hybrid sigma-pressure (terrain following) levels of the operational ECMWF model;
Solid lines – the subset employed by the 25 layer European zoom model;
five layers – boundary layer
ten layers – free troposphere
ten layers – stratosphere
12 12
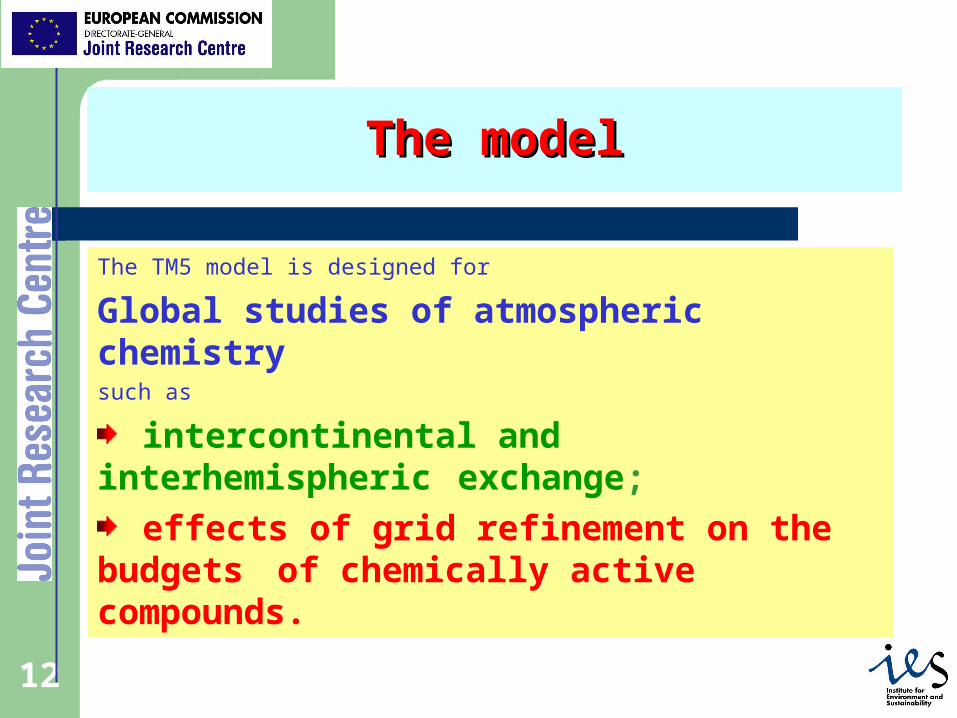
The modelThe model
The TM5 model is designed for
Global studies of atmospheric chemistrysuch as
intercontinental and interhemispheric exchange;
effects of grid refinement on the budgets of chemically active compounds.
13 13
The modelThe model
The TM5 model is an offline model, using
preprocessed meteorological fields from
ECMWF.
14 14
The modelThe modelSplittingSplitting
The basic model operations (advection,
convection, sources, chemistry) are solved
by symmetrical operator splitting
15 15
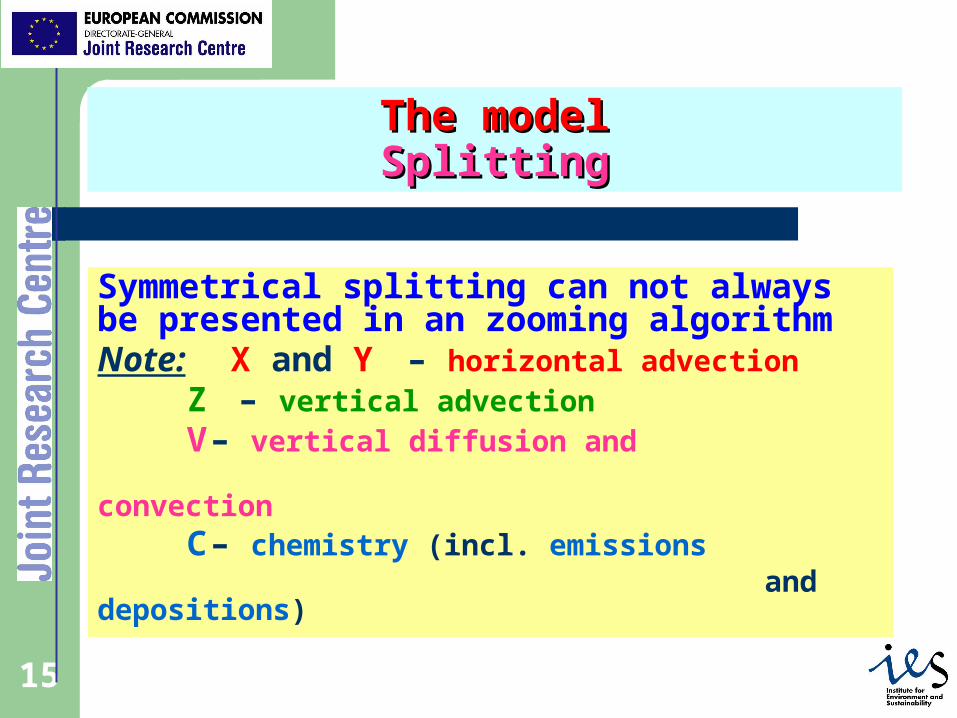
The modelThe modelSplittingSplitting
Symmetrical splitting can not always be presented in an zooming algorithmNote: X and Y – horizontal advection
Z – vertical advection V – vertical diffusion and
convection C – chemistry (incl. emissions
and depositions)

16 16
The modelThe modelSplittingSplitting
Let
– the parents write the boundary conditions to their children
– the parents are updated with the information by their children
17 17
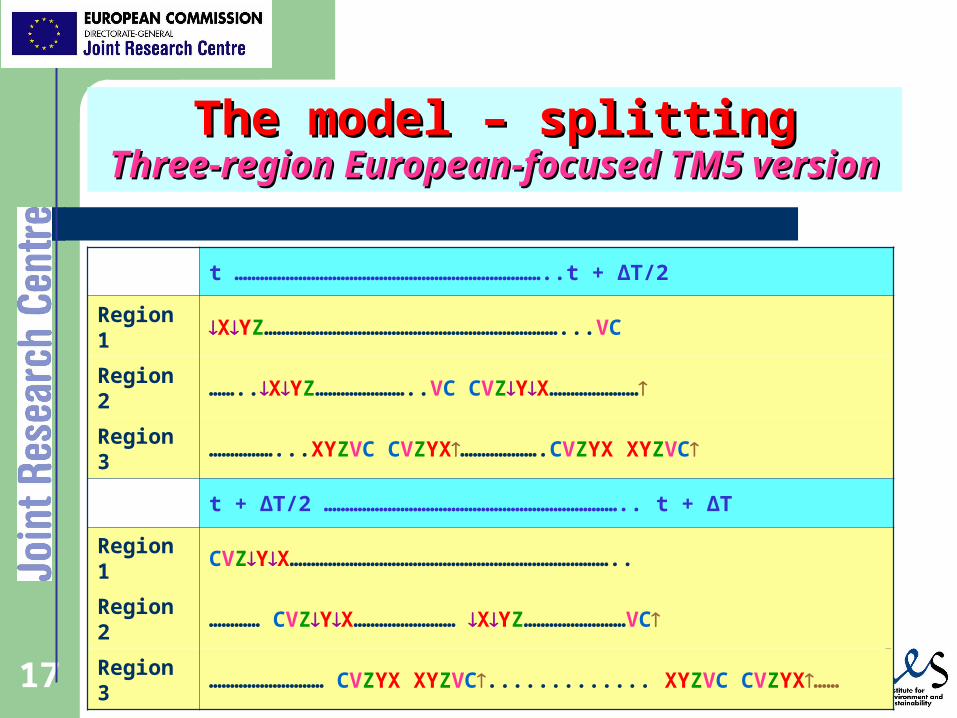
The model – splittingThe model – splittingThree-region European-focused TM5 versionThree-region European-focused TM5 version
t ………………………………………………………………..t + ΔT/2
Region 1 XYZ……………………………………………………………...VC
Region 2 ……..XYZ…………………..VC CVZYX…………………
Region 3 ……………...XYZVC CVZYX……………….CVZYX XYZVC
t + ΔT/2 …………………………………………………………….. t + ΔT
Region 1 CVZYX…………………………………………………………………..
Region 2 ………… CVZYX…………………… XYZ……………………VC
Region 3 ……………………… CVZYX XYZVC............. XYZVC CVZYX……
18 18
The modelThe modelChemistryChemistry
Gas phase chemistry is calculated using the
CBM-IV chemical mechanism solved by
means of the EBI method.
Photochemistry and aerosols are coupled in
the IPCC version of the TM5 model.
19 19
The modelThe modelAerosolAerosol ChemistryChemistry
Aerosols are assumed internally mixed and in an
accumulation mode size distribution for the
calculations of both scavenging and depositions.
They can contain sulphate, ammonium and nitrate
and are described using bulk approach.
20 20
The modelThe modelAerosolAerosol ChemistryChemistry
The water attached to the particles is determined
from the ambient relatively humidity. Sulphate is
reduced to its aerosol phase. It is obtained by the
oxidation of sulphur dioxide in the gas phase by
OH radical. In the aqueous phase this oxidation is
done by H2O2 and ozone.
21 21
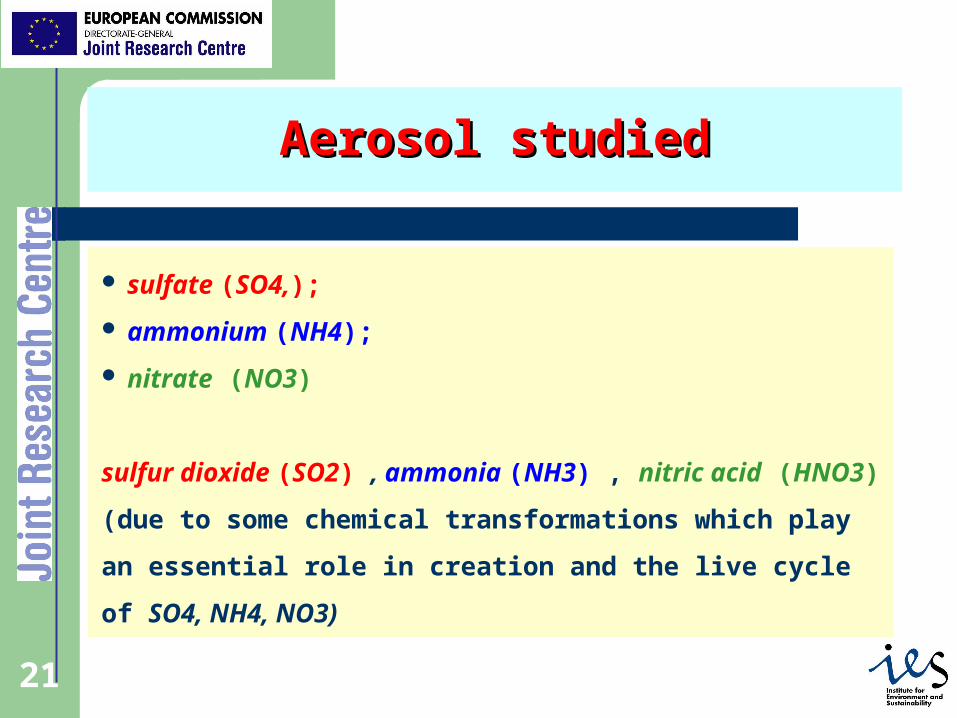
Aerosol studiedAerosol studied
sulfate (SO4,);
ammonium (NH4);
nitrate (NO3)
sulfur dioxide (SO2) , ammonia (NH3) , nitric acid (HNO3)
(due to some chemical transformations which play an
essential role in creation and the live cycle of SO4, NH4, NO3)
22 22
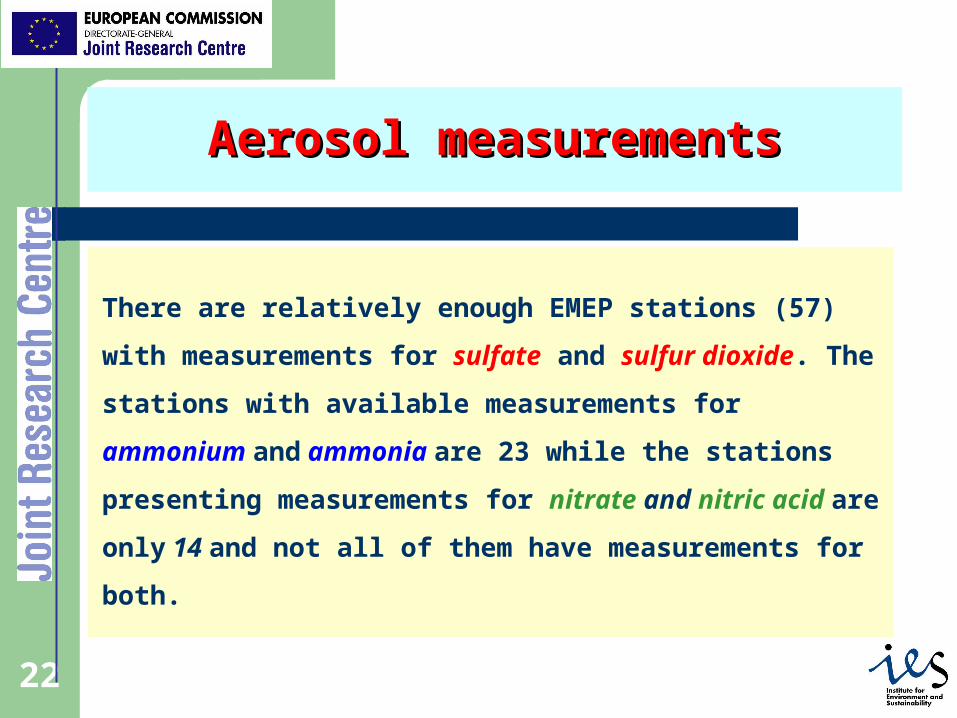
Aerosol measurementsAerosol measurements
There are relatively enough EMEP stations (57) with
measurements for sulfate and sulfur dioxide. The stations
with available measurements for ammonium and ammonia
are 23 while the stations presenting measurements for nitrate
and nitric acid are only 14 and not all of them have
measurements for both.
23 23
Aerosol measurementsAerosol measurements
The measurements reported by the EMEP network
stations are surface measurements. The model
output predictions which are discussed and used
for the comparisons are taken in the first model
layer.
24 24
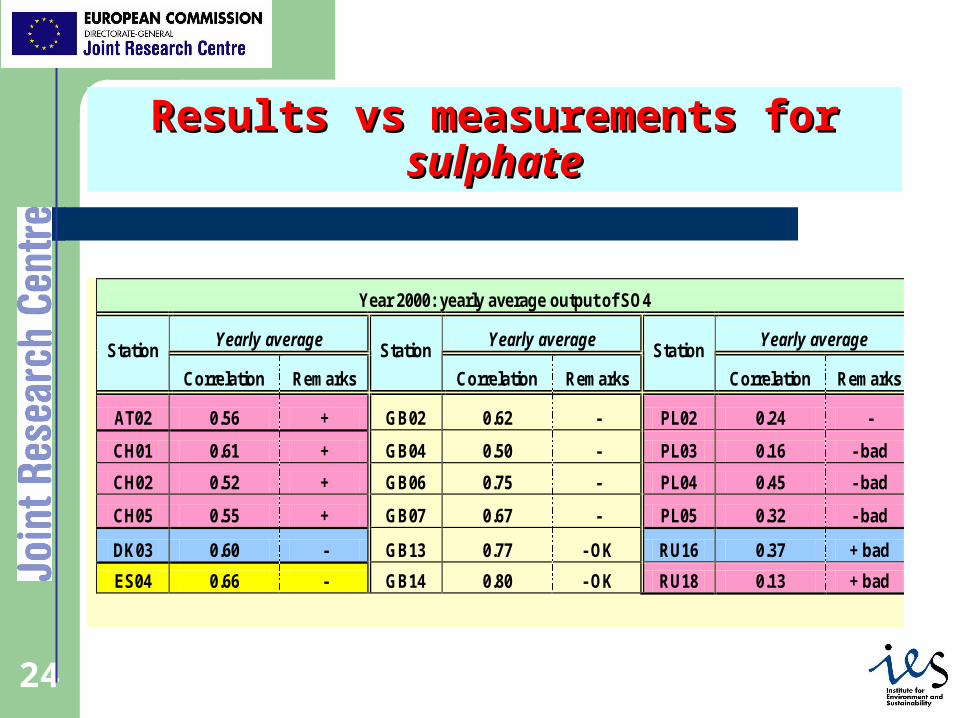
RResults vs measurements for esults vs measurements for sulphatesulphate
Year 2000: yearly average output of SO4
Yearly average Yearly average Yearly average Station
Correlation Remarks
Station
Correlation Remarks
Station
Correlation Remarks
AT02 0.56 + GB02 0.62 - PL02 0.24 -
CH01 0.61 + GB04 0.50 - PL03 0.16 - bad
CH02 0.52 + GB06 0.75 - PL04 0.45 - bad
CH05 0.55 + GB07 0.67 - PL05 0.32 - bad
DK03 0.60 - GB13 0.77 - OK RU16 0.37 + bad
ES04 0.66 - GB14 0.80 - OK RU18 0.13 + bad
25 25
RResults vs measurements for esults vs measurements for sulphatesulphate
The correlation between measurements end model results is relatively good.
The model results underestimate the measurements in the most of the stations (65 %).
26 26
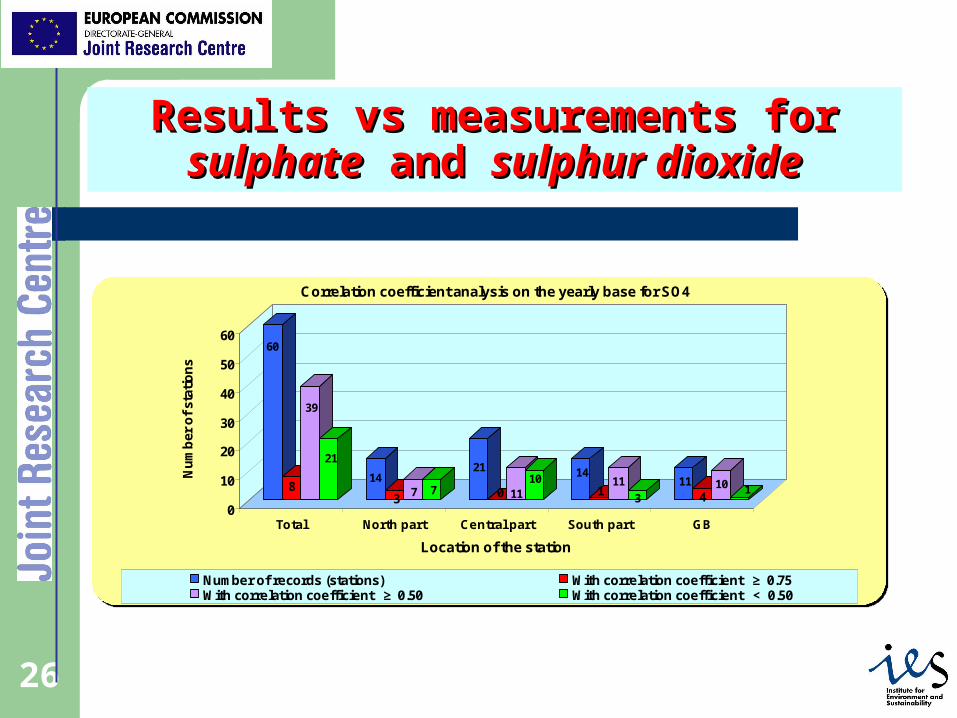
RResults vs measurements for esults vs measurements for sulphatesulphate and and sulphur dioxidesulphur dioxide
60
8
39
21
14
37 7
21
0 1110 14
111
3
114
10 1
0
10
20
30
40
50
60
Nu
mb
er o
f st
atio
ns
Total North part Central part South part GB
Location of the station
Correlation coefficient analysis on the yearly base for SO4
Number of records (stations) With correlation coefficient ≥ 0.75With correlation coefficient ≥ 0.50 With correlation coefficient < 0.50
27 27
RResults vs measurements for esults vs measurements for sulphatesulphate
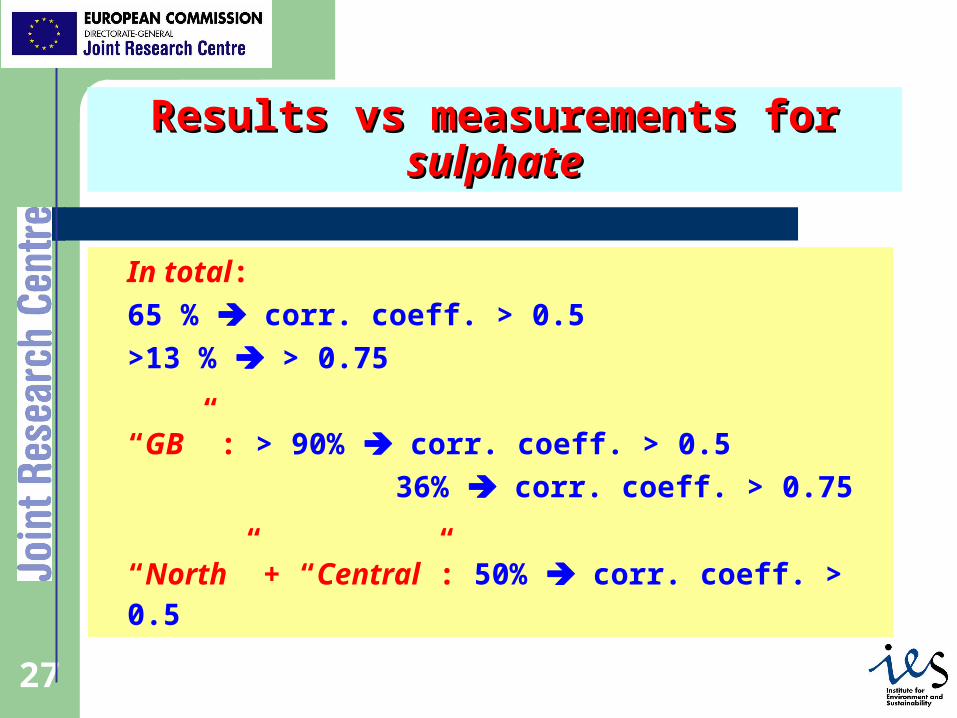
In total:
65 % corr. coeff. > 0.5
>13 % > 0.75
“GB” : > 90% corr. coeff. > 0.5
36% corr. coeff. > 0.75
“North” + “Central”: 50% corr. coeff. > 0.5
28 28
RResults vs measurements for esults vs measurements for sulphatesulphate and and sulphur dioxidesulphur dioxide
TM5 model
overpredicts sulphur dioxide
and
underpredicts sulphate
29 29
RResults vs measurements for esults vs measurements for ammoniumammonium and and ammoniaammonia
TM5 model
overestimate ammonium
and
underestimate ammonia
30 30
RResults vs measurements for esults vs measurements for nitratenitrate and and nitric acidnitric acid
TM5 model
overpredicts nitrate
and
underpredicts nitric acid
31 31
ImplementationImplementation
TM5 program has been coded in Fortran 90
Implemented and tested on: IBM p690+ SGI Origin 3800 MAC OSX SUN Cluster

![CLOUDS, AEROSOLS AND THE DIRECTIONAL ......AEROSOLS AND RADIATION • Cloud-radiation interactions depend on the following steps: 1. Aerosol concentration [g/m3] / load [g/m2] 2. Aerosol](https://img.pdfslide.net/doc/110x75/5f08d9ca7e708231d424070b/clouds-aerosols-and-the-directional-aerosols-and-radiation-a-cloud-radiation.jpg)