Embed Size (px)
Citation preview
1-2
Currently, Pursuing PhD at Panassatra University
Name: Sok Chanrithy, IMBA from National Cheng Kung University
Bachelor of Science Economic at Royal University of Laws and Economics (1999-2003)
Bachelor of Hotel and Tourism at National University of Management (2000-2004)
Lectured by: SOK Chanrithy
1-3
Currently: Monitoring and Evaluation Specialist, STVET Project (ADB Grant 0178 CAM0
2009 - 2010: Part-time Country Manager at Connect Education (Australia Company)
2007-2009: General Manager at a Hotel in Siem Reap
Teaching and Research Assistant with Economic Professor in Taiwan in 2005-2007
Lectured by: SOK Chanrithy

1-4
◦ Email: [email protected]◦Website: www.chanrithysok.com◦ Tel: 017388989
Grading Policy◦ Case Analysis and Presentation 15%◦ Attendance 10%◦ Mid-Term exam 25%◦ Final exam 50%
Lectured by: SOK Chanrithy
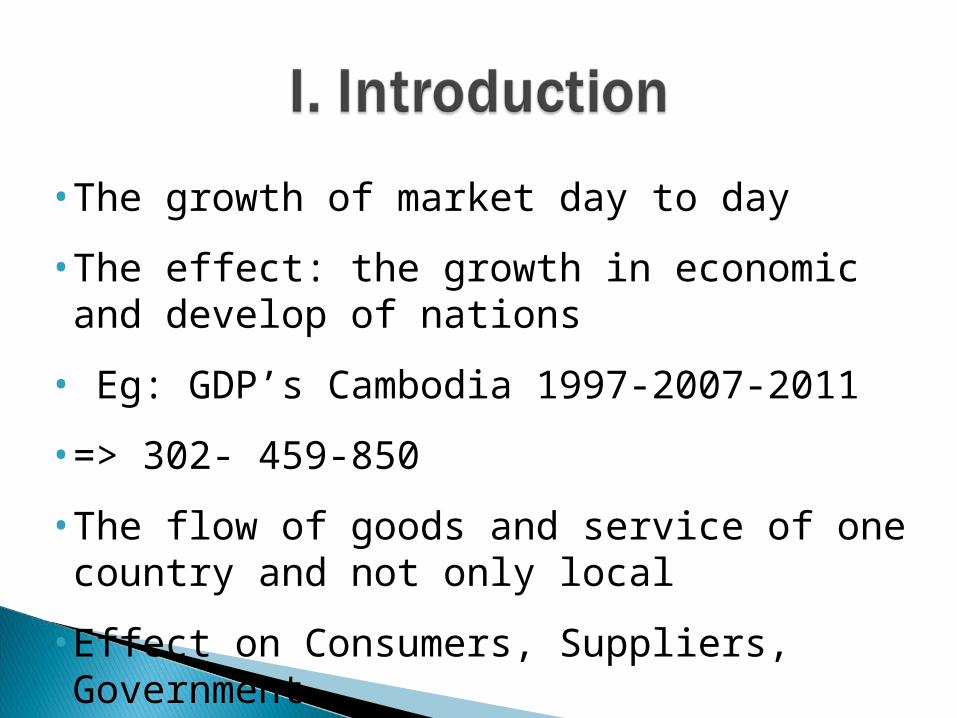
• The growth of market day to day
• The effect: the growth in economic and develop of nations
• Eg: GDP’s Cambodia 1997-2007-2011
• => 302- 459-850
• The flow of goods and service of one country and not only local
• Effect on Consumers, Suppliers, Government…
Globalization more formally refers to the economic,
social, cultural or environmental changes that tend to interconnect peoples around the world.
Global marketplace on consumers, businesses and governments.
That is where the study of international economics begins.
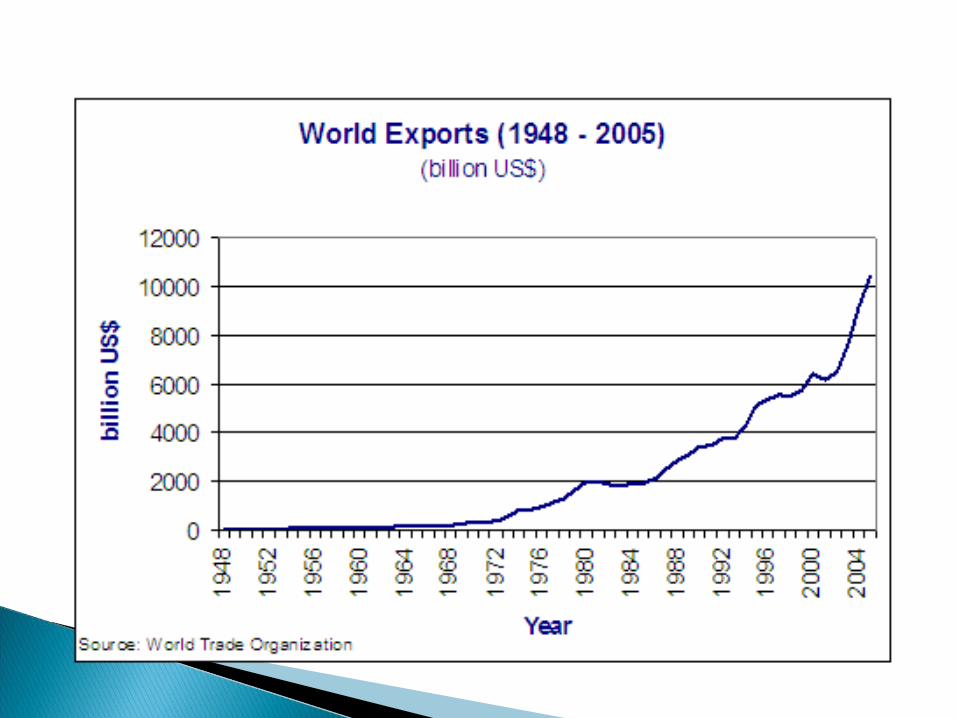
International economics is growing in importance as a field of study because of the rapid integration of international economic markets.
International economics is a field of study which assesses the implications of◦international trade in goods and services and
◦international investment.
International trade - applies microeconomic models to help understand the international economy.
Its content includes: ◦supply and demand analysis, ◦firm and consumer behavior, ◦perfectly competitive, ◦oligopolistic and monopolistic market
structures,◦the effects of market distortions.
International trade is the exchange of goods and services across international boundaries or territories. In most countries, it represents a significant share of GDP.
Industrialization, advanced transportation, globalization, multinational corporations, and outsourcing are all having a major impact. Increasing international trade is the primary meaning of "globalization".
International finance applies macroeconomic models to help understand the international economy.
Interrelationships between aggregate economic variables: GDP, unemployment rates, inflation rates, trade balances, exchange rates, interest rates, etc.
International exchanges rate trade imbalances, the determinants of exchange
rates and the aggregate effects of government monetary and fiscal policies.
pros and cons of fixed versus floating exchange rate systems
1. GATT
1947: USA+23 countries- General Agreement on Tariff and Trade( GATT) which is now more than 100 countries.
Purpose: ◦ foster equal (nondiscriminatory treatment
for all member nations)◦ Promote the reduction of tariff by
multilateral negotiation◦ Foster the elimination of import Quotas
Now begin to liberalize agriculture and services market.
They would eliminate the many quota systems - like the multi-fiber agreement in clothing - that had sprouted up in previous decades.
minimum standards to protect intellectual property rights such as patents, trademarks and copyrights.
The WTO: ◦ created to manage this system of new
agreements,◦ to provide a forum for regular discussion of trade
matters ◦ process for settling trade disputes that might
arise among countries.
As of 2006, 149 countries were members of the WTO "trade liberalization club" and many more countries were still negotiating entry.
latest round of trade liberalization discussion called the Doha round concludes with an agreement, world markets will become increasingly open to trade and investment.
[Note: the Doha round begun in 2001 and remains uncompleted as of 2006]
2. USA+Canada+Mexico – North American Free Trade Agreement (NAFTA) in 1994◦ To compete effectiveness with EEC( European
Economic Commodity) and other trading blocs that might develop in future.
3. IMF: International Monetary Fund mission provide loan to country that are in financial trouble.
IMF: dictates the term of the loans, including cutting domestic subsidies, privatizing government industries, and moderation trade policies.
4. World Bank: 157- help less developed countries achieve economic growth through improved trade. ( provide laon, guaranteeing, insuring private loans to nation in need financial assistant.
In trade policy discussions terms such as: ◦protectionism ◦free trade, ◦trade liberalization are used repeatedly.
One other term is commonly used in the analysis of trade models:◦namely national autarky, or just autarky.
Some countries, Singapore and (formerly) Hong Kong, highly free trade oriented.
Others, like North Korea and Cuba, have long been relatively closed economies and thus are closer to the state of autarky.
The rest of the world lies somewhere in between.
“Globalization”◦ Means different things to different people
My definitions:1. The increasing world-wide integration of markets for
goods, services and capital.2. Also role of MNCs, IMF, WTO, World Bank.3. Elsewhere: domination by United States.
Some see good, others bad Bad: reading by powell Good: reading by Bhagwati
Both make valid points. Read to see what they are.
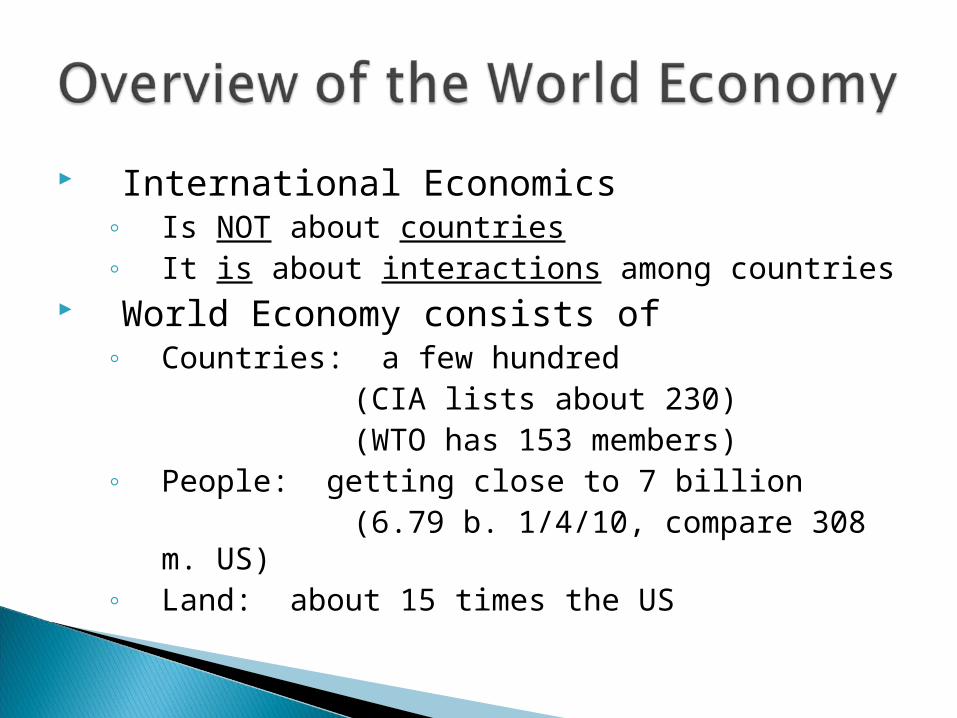
International Economics◦ Is NOT about countries◦ It is about interactions among countries
World Economy consists of◦ Countries: a few hundred
(CIA lists about 230)(WTO has 153 members)
◦ People: getting close to 7 billion(6.79 b. 1/4/10, compare 308 m.
US)◦ Land: about 15 times the US
An excellent source of information about countries is the CIA World Fact Book
(Just Google “fact book”)
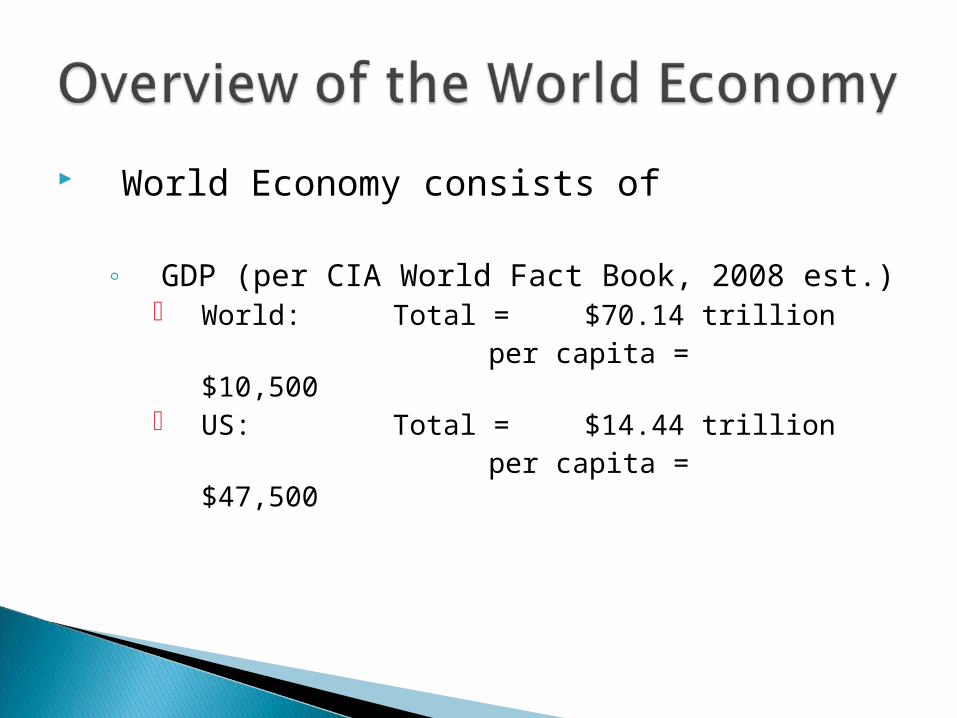
World Economy consists of
◦ GDP (per CIA World Fact Book, 2008 est.) World: Total = $70.14 trillion
per capita = $10,500 US: Total = $14.44 trillion
per capita = $47,500
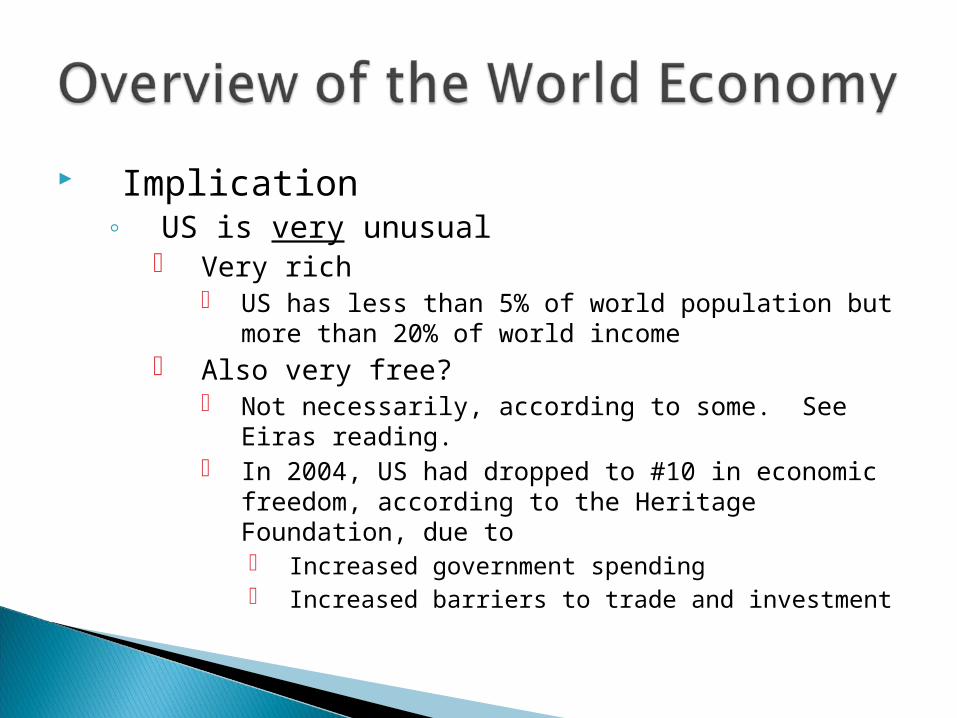
Implication◦ US is very unusual
Very rich US has less than 5% of world population but more
than 20% of world income Also very free?
Not necessarily, according to some. See Eiras reading.
In 2004, US had dropped to #10 in economic freedom, according to the Heritage Foundation, due to Increased government spending Increased barriers to trade and investment
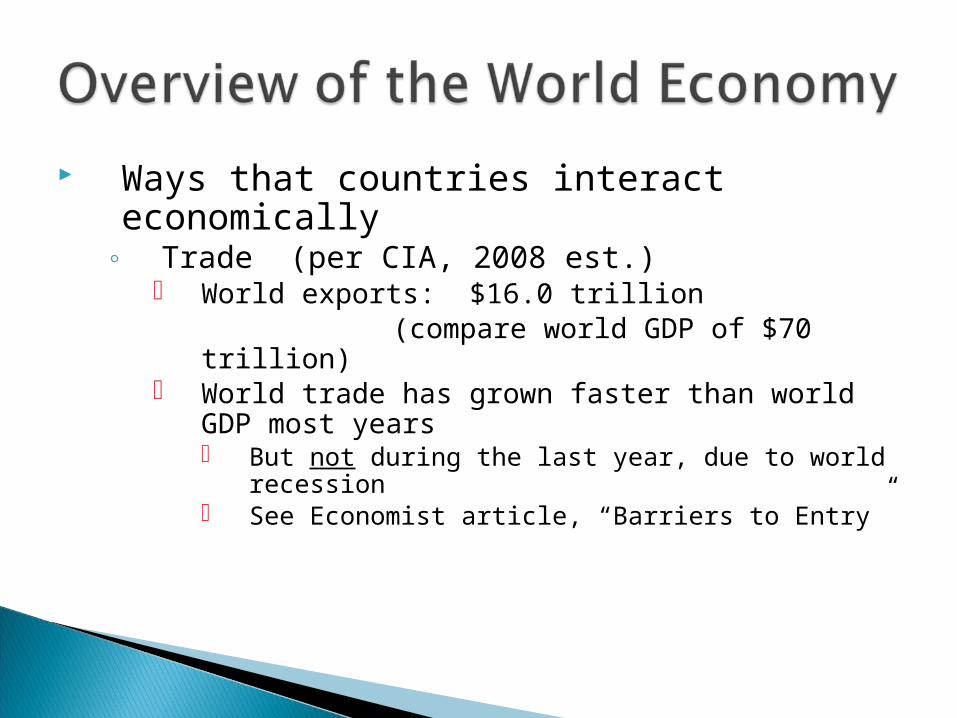
Ways that countries interact economically◦ Trade (per CIA, 2008 est.)
World exports: $16.0 trillion(compare world GDP of $70 trillion)
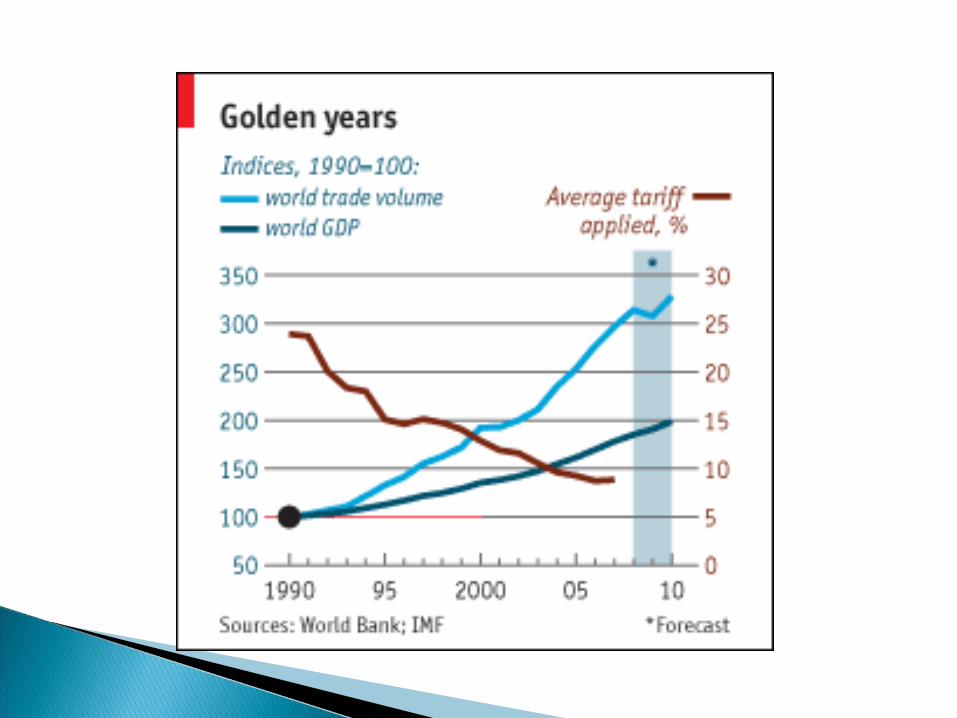
World trade has grown faster than world GDP most years But not during the last year, due to world recession See Economist article, “Barriers to Entry”
See tables below for◦ Who trades most?◦ Who trades with whom?◦ Compare trade in services with trade in goods◦ Share of trade in GDP◦ US: What do we export/import? To/from
whom?
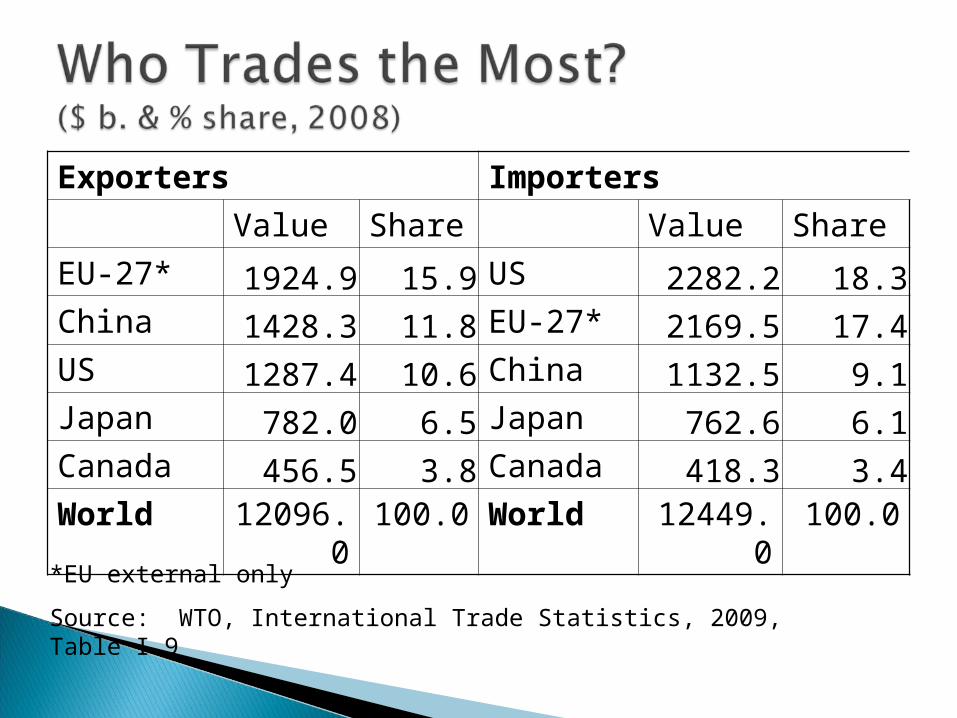
Exporters Importers
Value Share Value Share
EU-27* 1924.9 15.9 US 2282.2 18.3China 1428.3 11.8 EU-27* 2169.5 17.4US 1287.4 10.6 China 1132.5 9.1Japan 782.0 6.5 Japan 762.6 6.1Canada 456.5 3.8 Canada 418.3 3.4World 12096.0 100.0 World 12449.0 100.0
*EU external only
Source: WTO, International Trade Statistics, 2009, Table I.9
Developed countries are the biggest traders China is catching up, in trade volume
◦ It was the #3 exporter two years ago when I taught the course; now it’s #2.
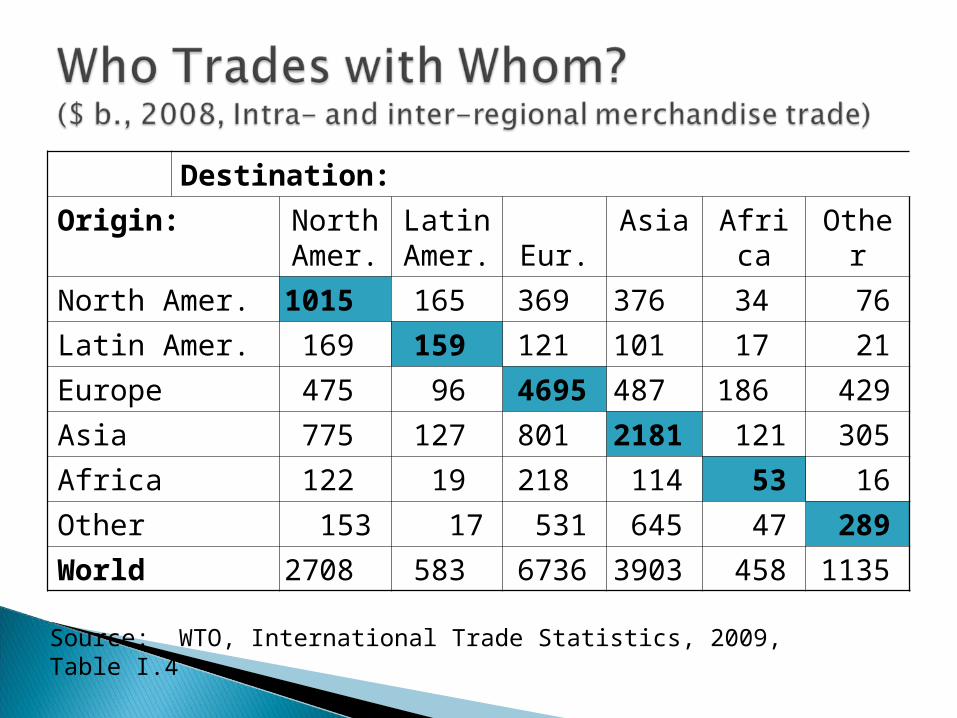
Destination:
Origin: North Amer.
Latin Amer.
Eur. Asia Africa Other
North Amer. 1015 165 369 376 34 76
Latin Amer. 169 159 121 101 17 21
Europe 475 96 4695 487 186 429
Asia 775 127 801 2181 121 305
Africa 122 19 218 114 53 16
Other 153 17 531 645 47 289
World 2708 583 6736 3903 458 1135
Source: WTO, International Trade Statistics, 2009, Table I.4
North America, Europe, and Asia trade mostly within their group
Poorer regions – Latin America, Africa – trade mostly with the richer regions
This reflects what is not so clear in the table:◦ Rich countries trade most with each other◦ Poor countries trade most with rich countries
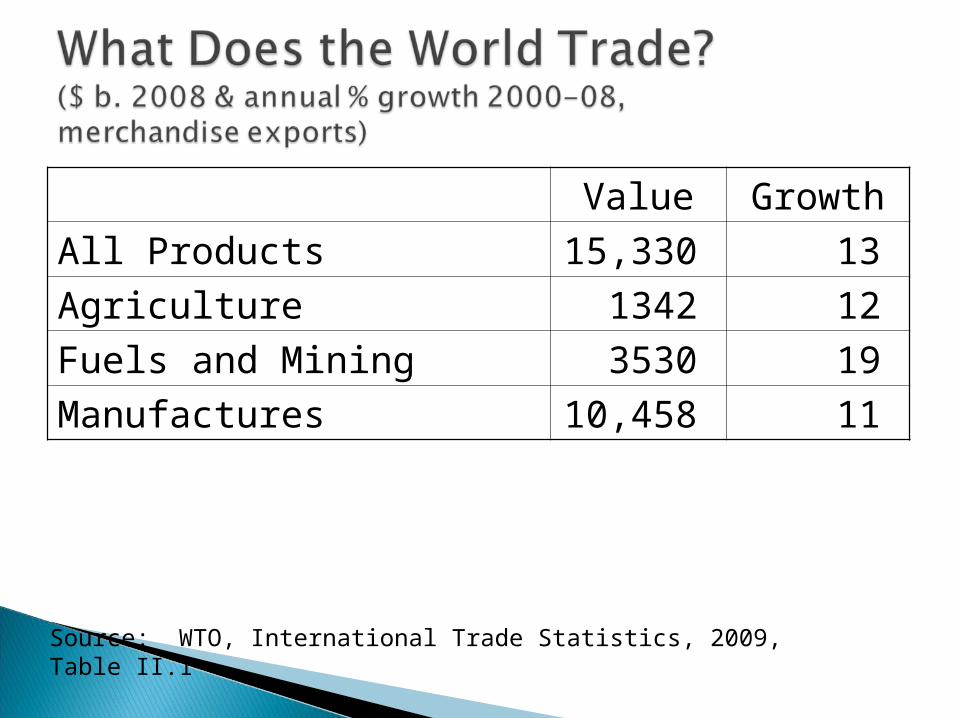
Value Growth
All Products 15,330 13
Agriculture 1342 12
Fuels and Mining 3530 19
Manufactures 10,458 11
Source: WTO, International Trade Statistics, 2009, Table II.1
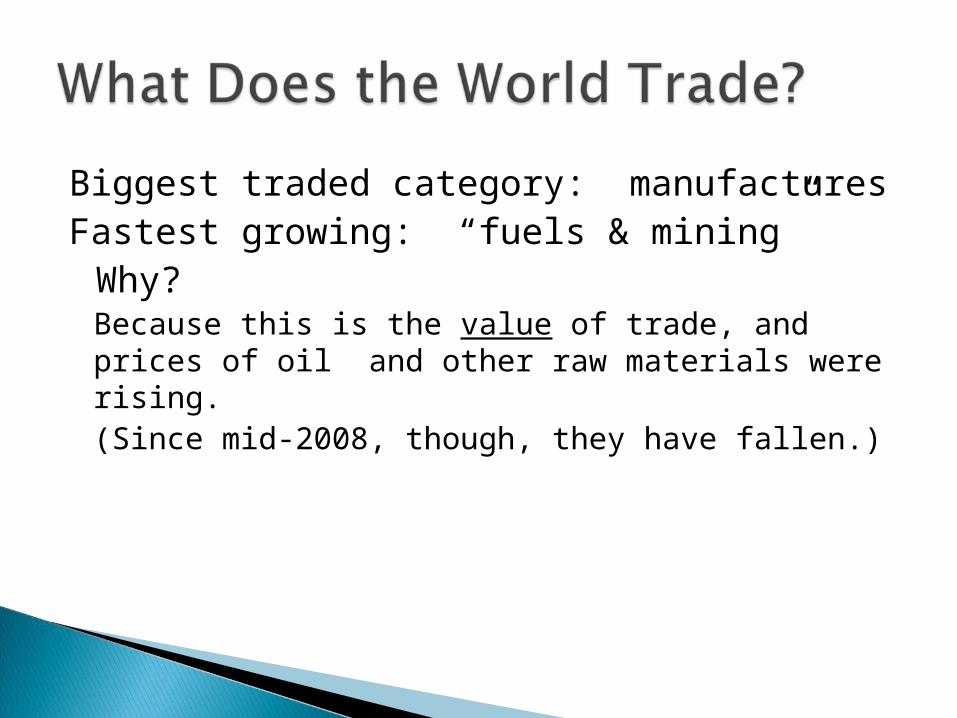
Biggest traded category: manufacturesFastest growing: “fuels & mining”
Why? Because this is the value of trade, and prices of oil and other raw materials were rising.(Since mid-2008, though, they have fallen.)
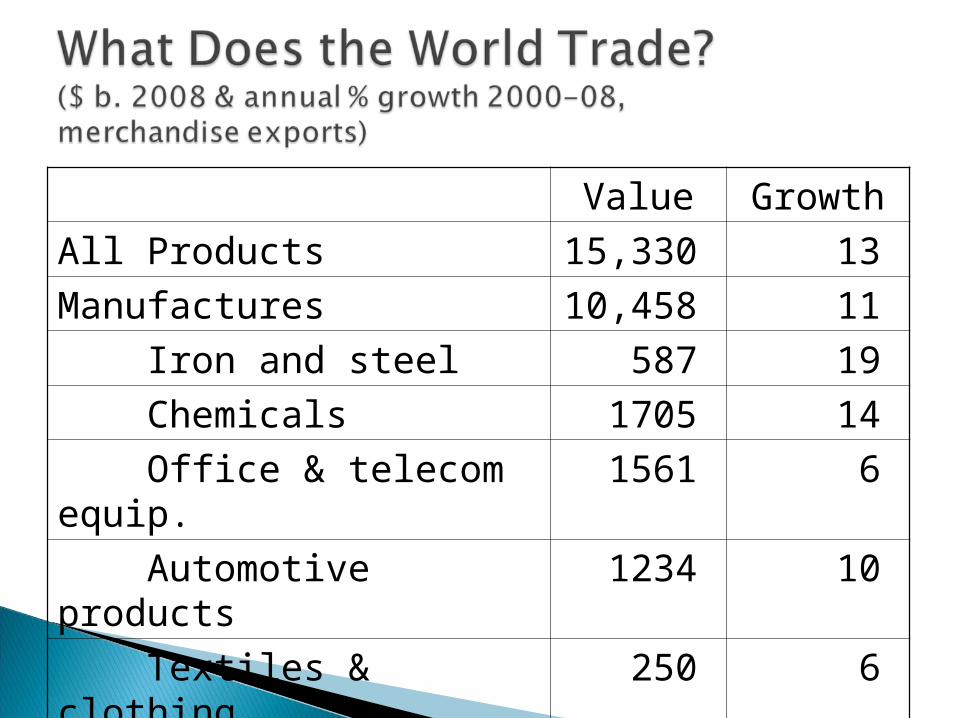
Value Growth
All Products 15,330 13
Manufactures 10,458 11
Iron and steel 587 19
Chemicals 1705 14
Office & telecom equip. 1561 6
Automotive products 1234 10
Textiles & clothing 250 6
Almost 10% of all trade is automotive Fastest growing, lately, is iron and steel,
and chemicals (which includes pharmaceuticals)
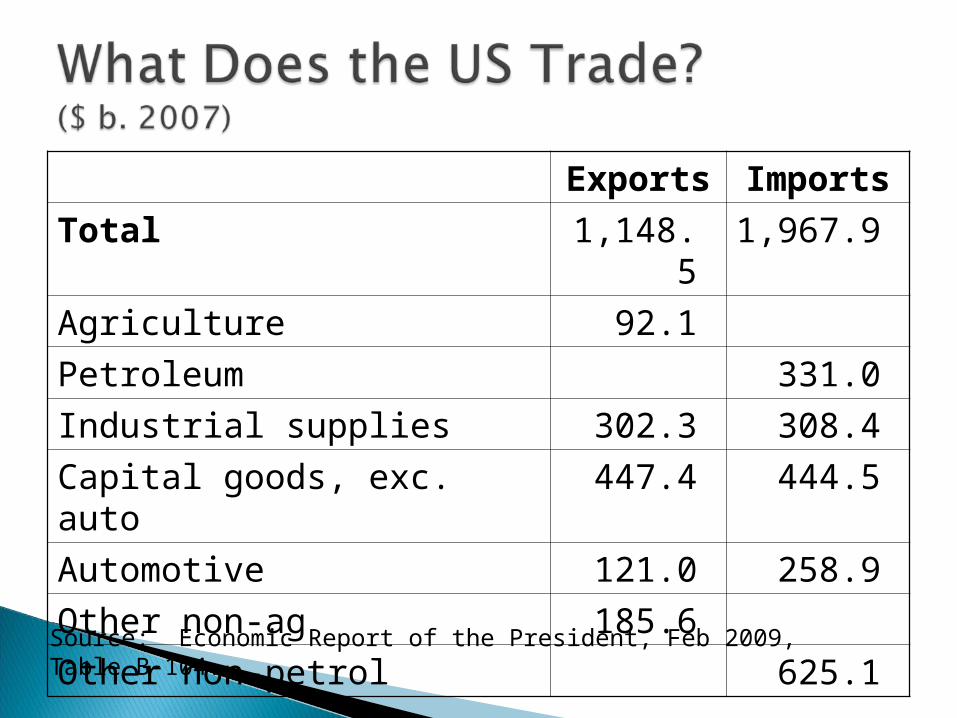
Exports Imports
Total 1,148.5 1,967.9
Agriculture 92.1
Petroleum 331.0
Industrial supplies 302.3 308.4
Capital goods, exc. auto 447.4 444.5
Automotive 121.0 258.9
Other non-ag 185.6
Other non-petrol 625.1Source: Economic Report of the President, Feb 2009, Table B-104.
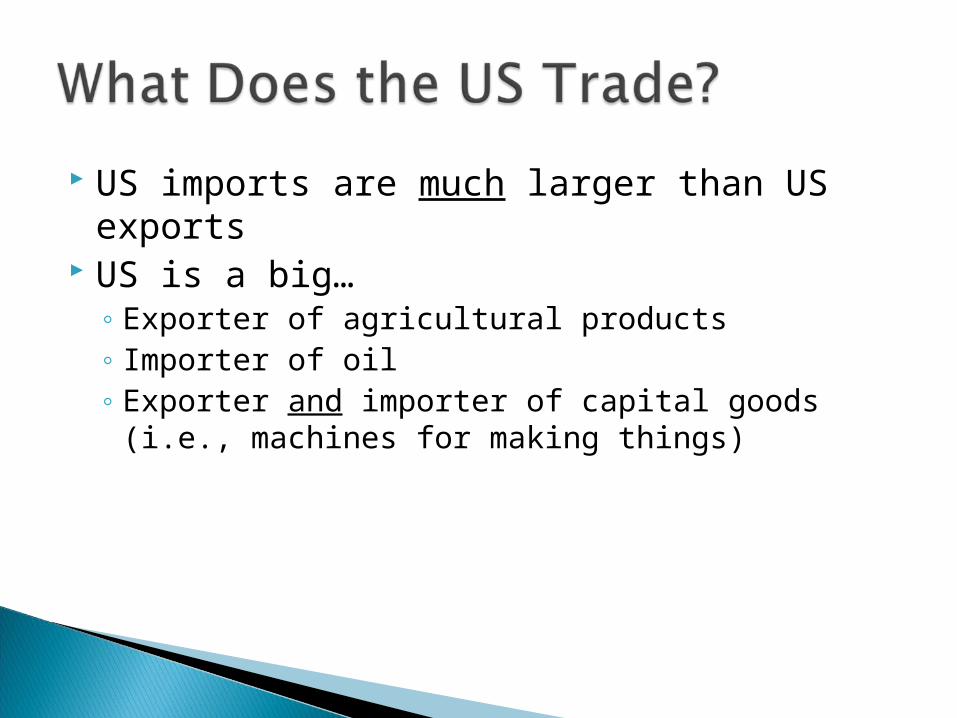
US imports are much larger than US exports US is a big…
◦ Exporter of agricultural products◦ Importer of oil◦ Exporter and importer of capital goods (i.e.,
machines for making things)
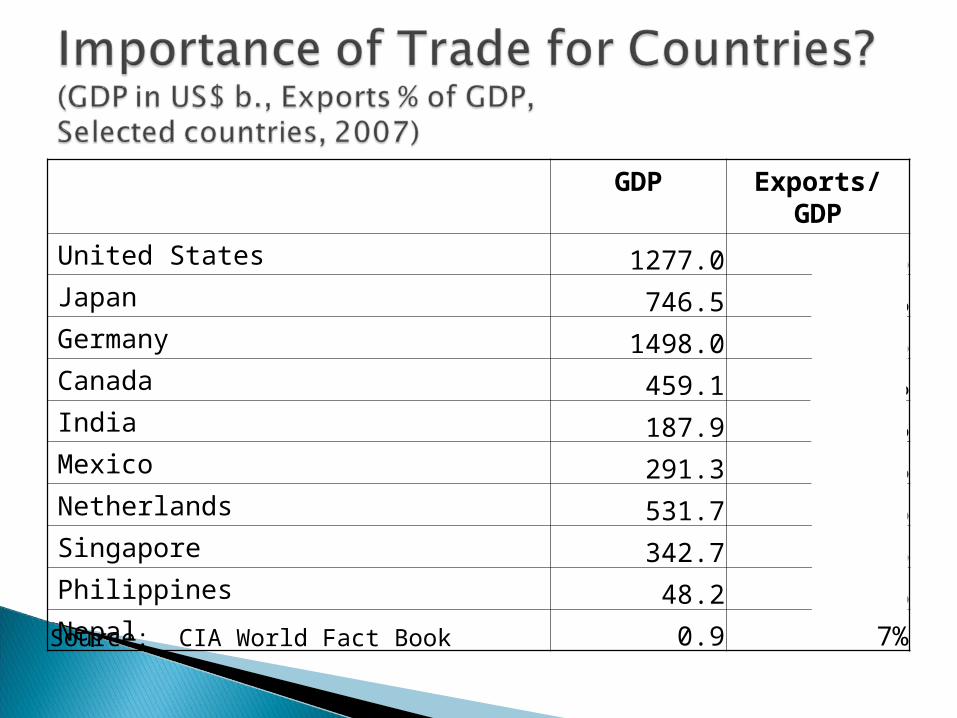
GDP Exports/GDP
United States 1277.0 9%Japan 746.5 15%Germany 1498.0 41%Canada 459.1 31%India 187.9 16%Mexico 291.3 27%Netherlands 531.7 61%Singapore 342.7 188%Philippines 48.2 29%Nepal 0.9 7%
Source: CIA World Fact Book
Even though we trade more than most, US trade is a smaller part of US GDP than for many other countries
Others that are low: India, Nepal (even lower than US)
Note Singapore: Exports can be more than GDP.◦ Reason: Exports are made using imports.
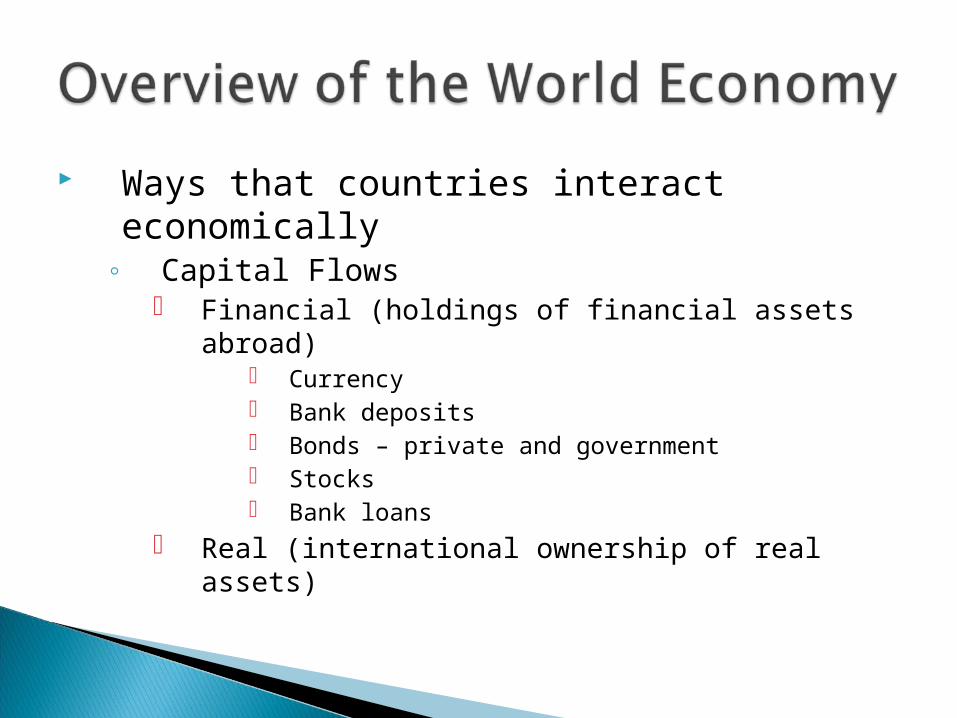
Ways that countries interact economically◦ Capital Flows
Financial (holdings of financial assets abroad) Currency Bank deposits Bonds – private and government Stocks Bank loans
Real (international ownership of real assets)
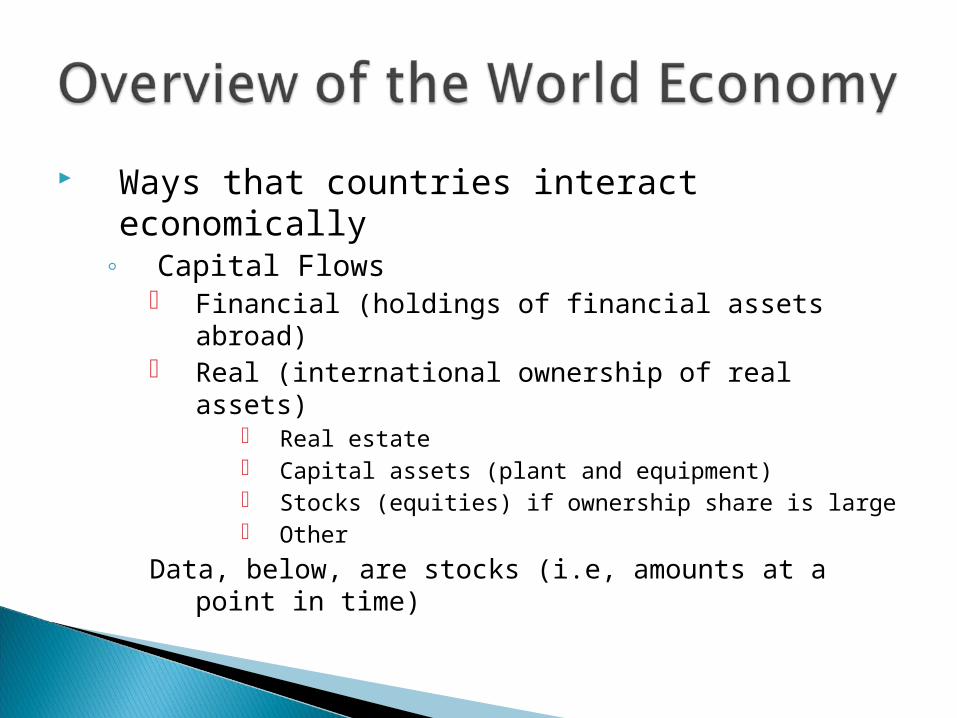
Ways that countries interact economically◦ Capital Flows
Financial (holdings of financial assets abroad) Real (international ownership of real assets)
Real estate Capital assets (plant and equipment) Stocks (equities) if ownership share is large Other
Data, below, are stocks (i.e, amounts at a point in time)
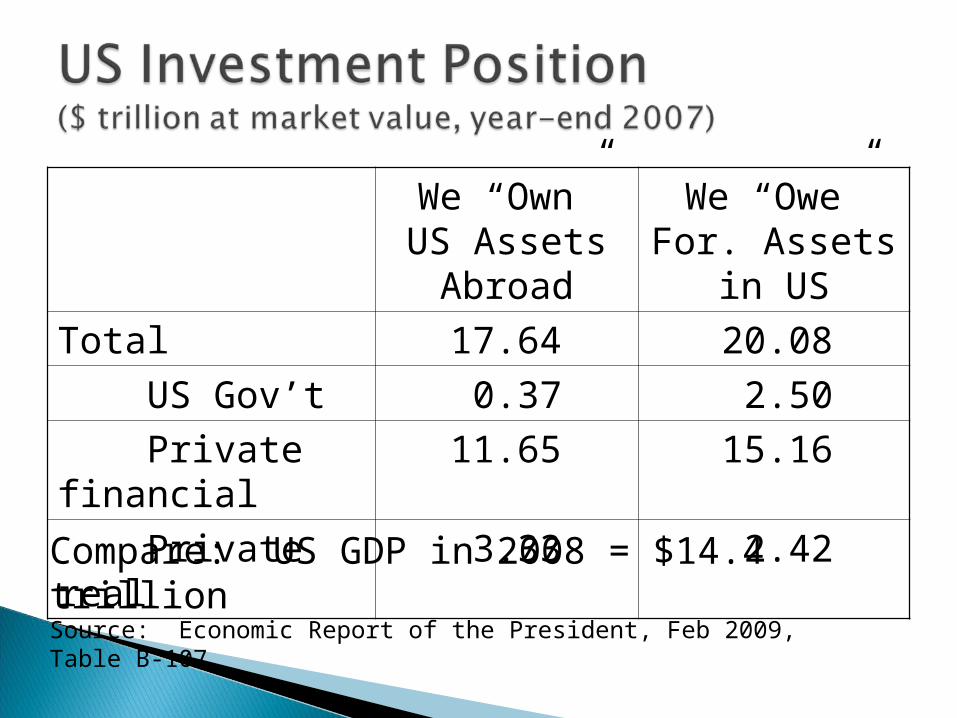
We “Own” US Assets Abroad
We “Owe” For. Assets in US
Total 17.64 20.08
US Gov’t 0.37 2.50
Private financial 11.65 15.16
Private real 3.33 2.42
Source: Economic Report of the President, Feb 2009, Table B-107
Compare: US GDP in 2008 = $14.4 trillion
(Qualification: “Owe” isn’t quite right. This includes all assets in the US owned by foreigners, including land, buildings, etc. Not just what we’ve borrowed.)
Lessons:◦ US is a large net “debtor” (result of our spending
more than we earn)◦ Part of this is government, but most is private
Ways that countries interact economically◦ Migration
Temporary Guest workers Day workers
Permanent In practice, most (all?) countries limit migration
severely
Ways that countries interact economically◦ Policies that affect other countries
Direct Trade policies (tariffs, quotas) Foreign aid Capital controls Exchange rate management Immigration restrictions
Indirect
Aside on Tariffs◦ We will be dealing a lot with these◦ See reading by Hufbauer and Grieco:
US tariffs are much lower than they used to be (average 4% now, vs. 40% in 1946)
US has gained a great deal from lowering tariffs US still has much to gain from further lowering But there are also severe costs for some people
and firms who compete with imports
Aside on Tariffs◦ Tariffs could go up: See Economist article
WTO enforces only upper limits on tariffs Actual tariffs are below these limits, and could
legally rise The current world recession could push countries
to do that
Aside on Tariffs◦ See also reading from CGD (Center for Global
Development) 45% of US exports go to developing countries US tariffs are much higher against developing
countries than against developed countries
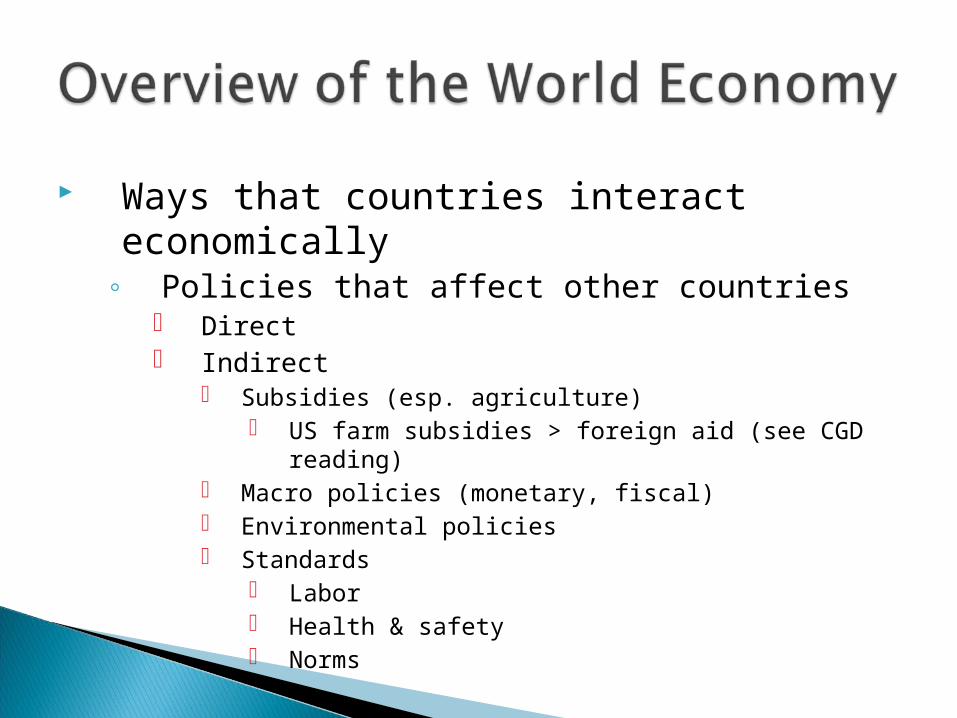
Ways that countries interact economically
◦ Policies that affect other countries Direct Indirect
Subsidies (esp. agriculture) US farm subsidies > foreign aid (see CGD reading)
Macro policies (monetary, fiscal) Environmental policies Standards
Labor Health & safety Norms
International economics is about how nations interact through trade of goods and services, through flows of money and through investment.
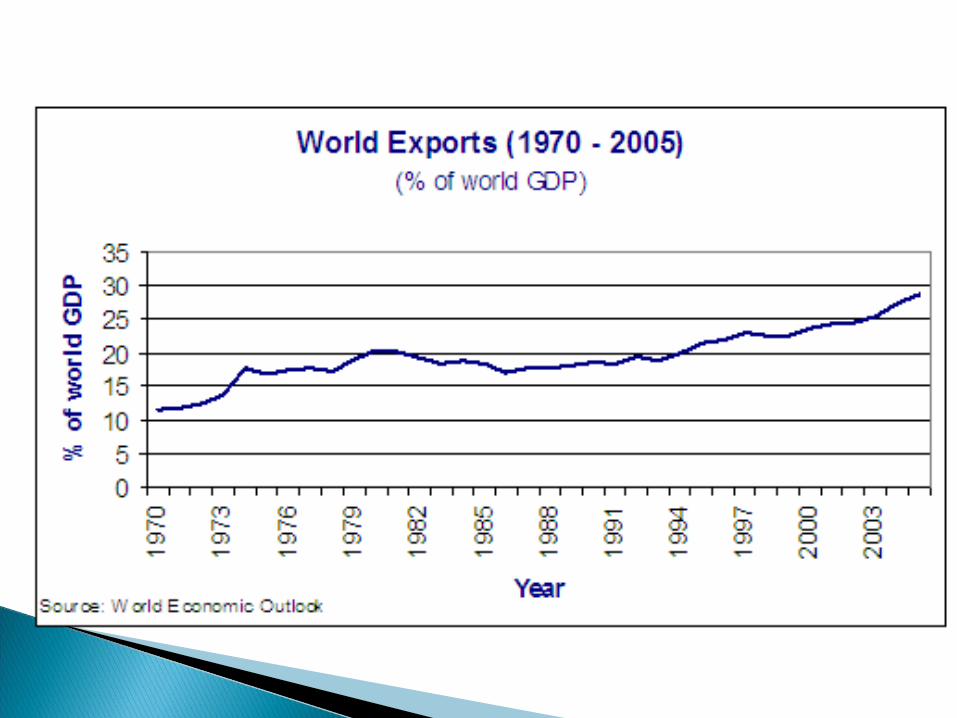
International economics is an old subject, but it continues to grow in importance as countries become tied to the international economy.
Nations are more closely linked through trade in goods and services, through flows of money, and through investment than ever before.
International trade as a fraction of the national economy has tripled for the U.S. in the past 40 years.
Compared to the U.S., other countries are even more tied to international trade.
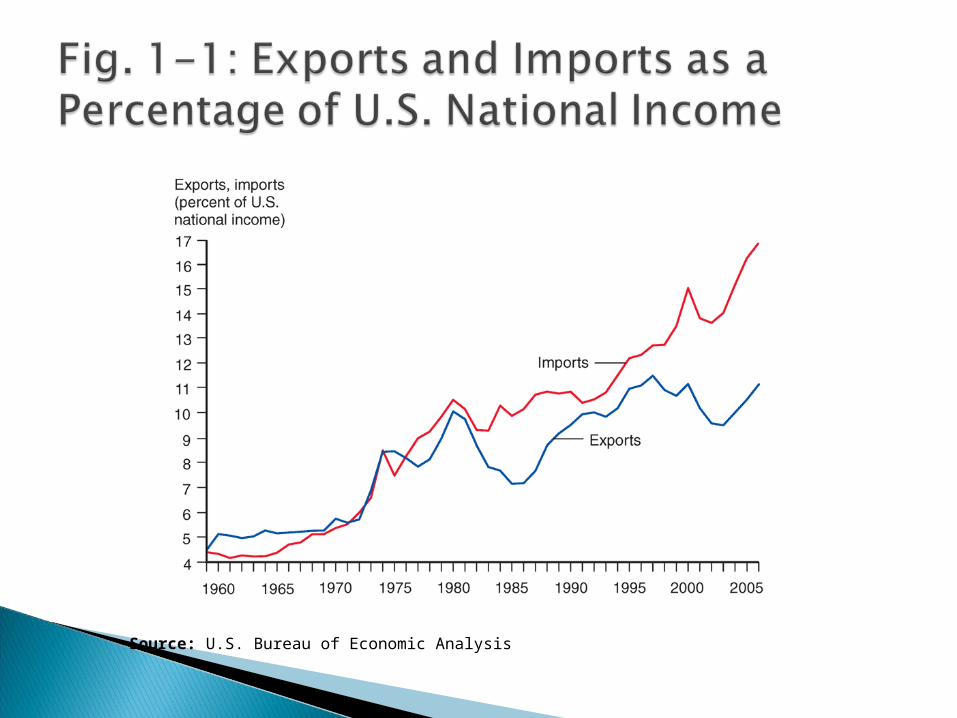
Source: U.S. Bureau of Economic Analysis
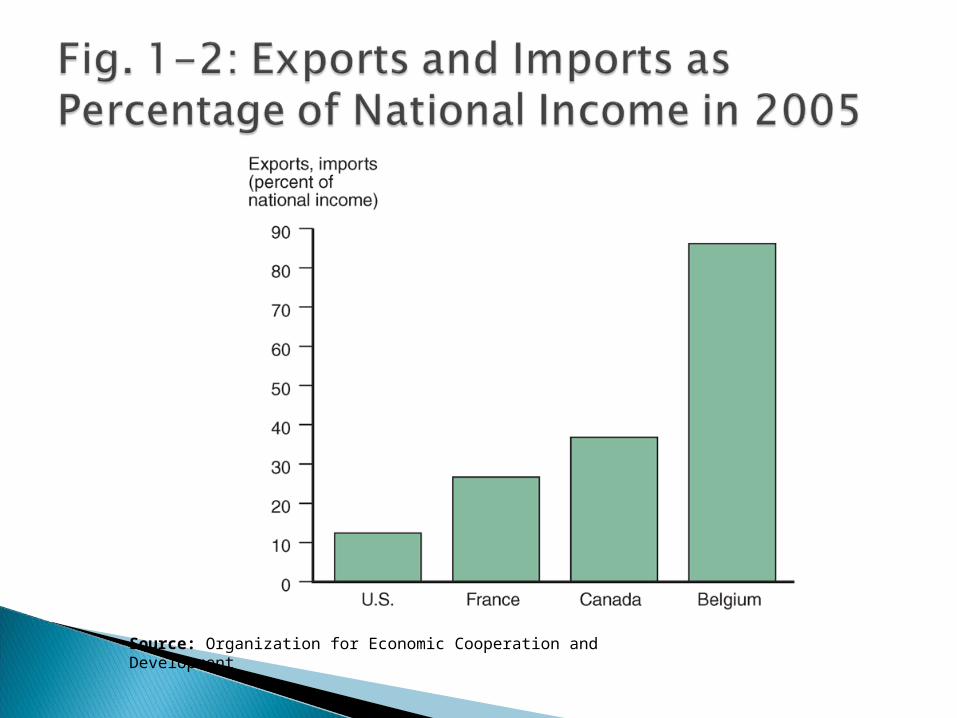
Source: Organization for Economic Cooperation and Development
Several ideas underlie the gains from trade1. When a buyer and a seller engage in a
voluntary transaction, both receive something that they want and both can be made better off. Norwegian consumers could buy oranges through
international trade that they otherwise would have a difficult time producing.
The producer of the oranges receives income that it can use to buy the things that it desires.
2. How could a country that is the most (least) efficient producer of everything gain from trade?
◦ With a finite amount of resources, countries can use those resources to produce what they are most productive at (compared to their other production choices), then trade those products for goods and services that they want to consume.
◦ Countries can specialize in production, while consuming many goods and services through trade.
3. Trade is predicted to benefit a country by making it more efficient when it exports goods which use abundant resources and imports goods which use scarce resources.
4. When countries specialize, they may also be more efficient due to large scale production.
5. Countries may also gain by trading current resources for future resources (lending and borrowing).
Trade is predicted to benefit countries as a whole in several ways, but trade may harm particular groups within a country.
◦ International trade can adversely affect the owners of resources that are used intensively in industries that compete with imports.
◦ Trade may therefore have effects on the distribution of income within a country.
◦ Conflicts about trade should occur between groups within countries rather than between countries.
Differences in climate and resources can explain why Brazil exports coffee and Australia exports iron ore.
But why does Japan export automobiles, while the U.S. exports aircraft?
Differences in labor productivity may explain why some countries export certain products.
How relative supplies of capital, labor and land are used in the production of different goods and services may also explain why some countries export certain products.
Policy makers affect the amount of trade through ◦ tariffs: a tax on imports or exports,
◦ quotas: a quantity restriction on imports or exports,
◦ export subsidies: a payment to producers that export,
◦ or through other regulations (ex., product specifications) that exclude foreign products from the market, but still allow domestic products.
What are the costs and benefits of these policies?
Economists design models that try to measure the effects of different trade policies.
If a government must restrict trade, which policy should it use?
If a government must restrict trade, how much should it restrict trade?
If a government restricts trade, what are the costs if foreign governments respond likewise?
Governments measure the value of exports and imports, as well as the value of financial assets that flow into and out of their countries.
Related to these two measures is the measure of official settlements balance, or the balance of payments: the balance of funds that central banks use for official international payments.
All three values are measured in the government’s national income accounts.
Besides financial asset flows and the official settlements balance, exchange rates are also an important financial issue for most governments.
◦ Exchange rates measure how much domestic currency can be exchanged for foreign currency.
◦ They also affect how much goods that are denominated in foreign currency (imports) cost.
◦ And they affect how much goods denominated in domestic currency (exports) cost in foreign markets.
International trade focuses on transactions of goods and services across nations. ◦ These transactions usually involve a physical movement
of goods or a commitment of tangible resources like labor services.
International finance focuses on financial or monetary transactions across nations. ◦ For example, purchases of U.S. dollars or financial assets
by Europeans.
The Three Main Institutions (IMF, World Bank, WTO)◦ Why They Were Created, and When◦ How They Have Changed◦ Their Reputations Today
Other Institutions◦ United Nations◦ OECD = Organization for Economic Cooperation and
Development◦ Preferential Trading Arrangements
What’s Happening Now?◦ The World Financial Crisis◦ The Doha Round◦ PTAs◦ Trade Disputes
Functions◦ IMF (International Monetary Fund): Financial
Assistance◦ World Bank: Development Assistance◦ WTO (World Trade Organization): Trade Policy
Regulation and Negotiation
History◦ Before World War II
Great Depression High Tariffs on trade Competitive Devaluations
of currencies“Beggar Thy
Neighbor Policies”
(we’ll see why later)
History◦ End of World War II
Bretton Woods Meeting (Bretton Woods, NH) IMF World Bank ITO (International Trade Organization)
Never ratified Instead: GATT (General Agreement on Tariffs and Trade)
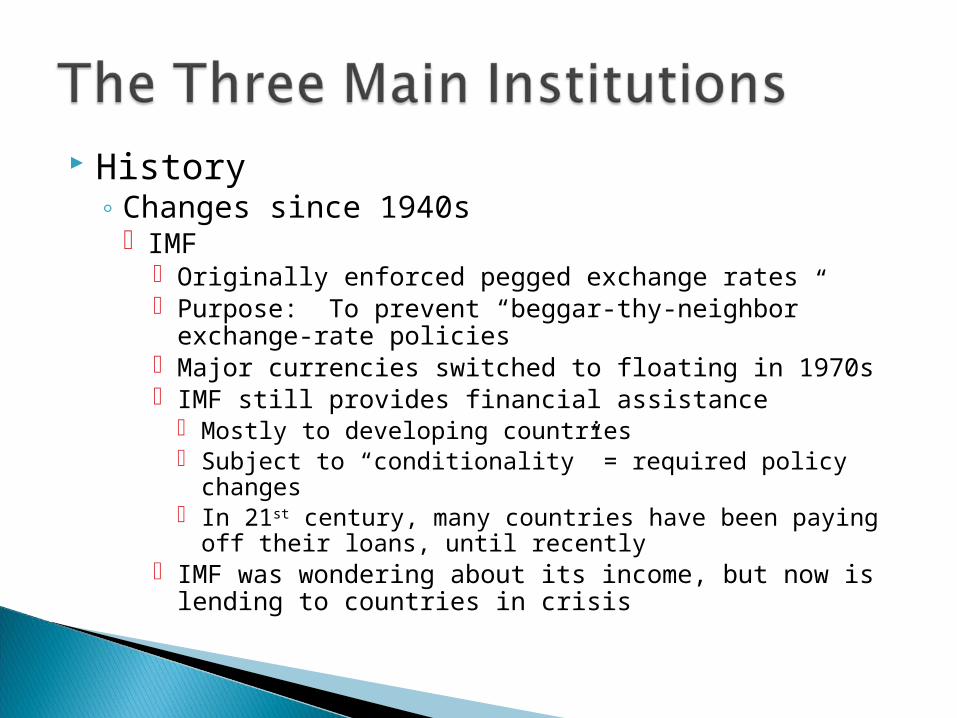
History◦ Changes since 1940s
IMF Originally enforced pegged exchange rates Purpose: To prevent “beggar-thy-neighbor” exchange-
rate policies Major currencies switched to floating in 1970s IMF still provides financial assistance
Mostly to developing countries Subject to “conditionality” = required policy changes In 21st century, many countries have been paying off their
loans, until recently IMF was wondering about its income, but now is lending
to countries in crisis
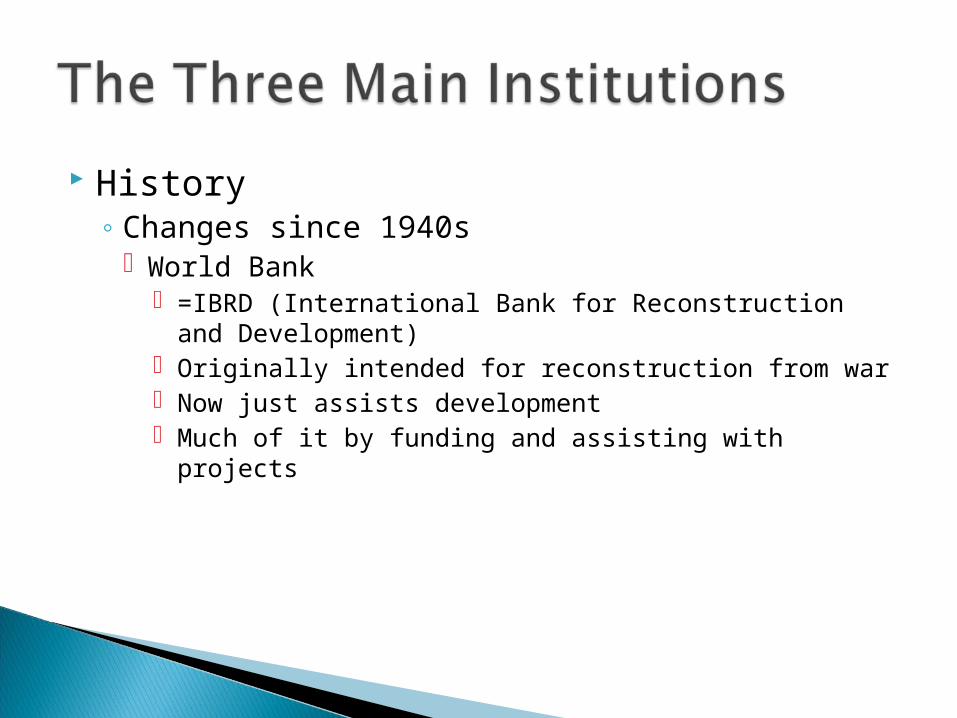
History◦ Changes since 1940s
World Bank =IBRD (International Bank for Reconstruction and
Development) Originally intended for reconstruction from war Now just assists development Much of it by funding and assisting with projects
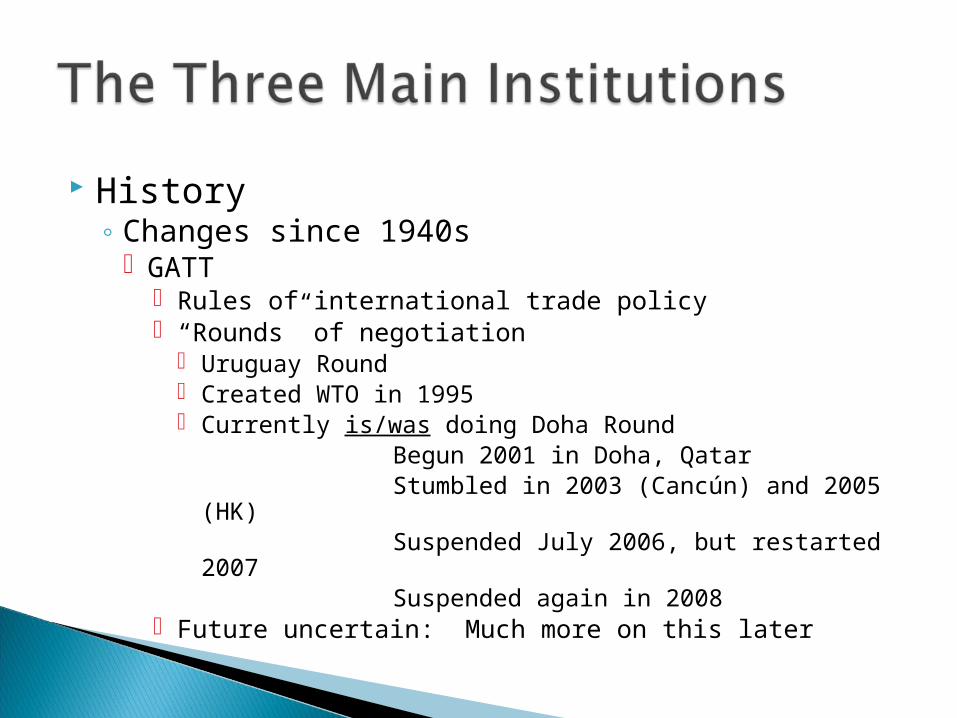
History◦ Changes since 1940s
GATT Rules of international trade policy “Rounds” of negotiation
Uruguay Round Created WTO in 1995 Currently is/was doing Doha Round
Begun 2001 in Doha, QatarStumbled in 2003 (Cancún) and 2005
(HK)Suspended July 2006, but restarted 2007Suspended again in 2008
Future uncertain: Much more on this later
Reputation Today:
Reputation Today: Criticized by◦ Opponents of globalization◦ Opponents of corporations◦ Some in Developing Countries for dominance
by US by rich countries by corporations
◦ Some in US for undermining US power
Reputation Today: Criticized by◦ Scholars for institutional flaws
IMF: Has imposed misguided policies World Bank: Wastes resources on corrupt elites WTO: Dominated by rich countries, corporations

G-7, G-8, G-20: These are Groups of countries◦ G-7 = US, Canada, Japan, Britain, France,
Germany, Italy Finance ministers meet
◦ G-8 = G-7 + Russia (since 1998) Heads of state met annually, until recently
◦ G-20 = G-8 + Australia & EU, + 10 major EMEs (Emerging Market Economies)
= 19 Countries
+ EU
G-20◦ Used to meet regularly, but only the finance
ministers◦ First G-20 summit (i.e., heads of state) met
November 2008, London◦ Met again September 2009, Pittsburgh◦ Now looks like G-20 summits will be the main
regular meeting, probably twice a year Next in Toronto, Canada, June 2010, and then Seoul,
S. Korea, November 2010
UN = United Nations◦ UNCTAD (United Nations Conference on Trade
and Development)
◦ ILO (International Labor Organization)◦ WIPO (World Intellectual Property Organization)
EU = European Union NAFTA = North American Free Trade Area OECD = Organization for Economic
Cooperation and Development◦ Club of high-income countries◦ Does research, collects data, drafts policies
Started in US with burst of housing bubble◦ Loans had been made, counting on rising house
prices◦ With burst, loans went bad◦ Banks and other institutions were interlinked via
Bad loans Complex financial instruments whose value fell
and/or was uncertain
Crisis spread◦ To most other developed countries through
financial institutions◦ To some developing countries too
Income and expenditure fell, causing world-wide recession◦ Falling house prices alone reduced wealth◦ Failures in financial markets made it worse◦ Banks stopped lending
Recession caused immediate drop in international trade◦ This made matters worse◦ It spread the recession to countries that had not
been exposed to financial markets
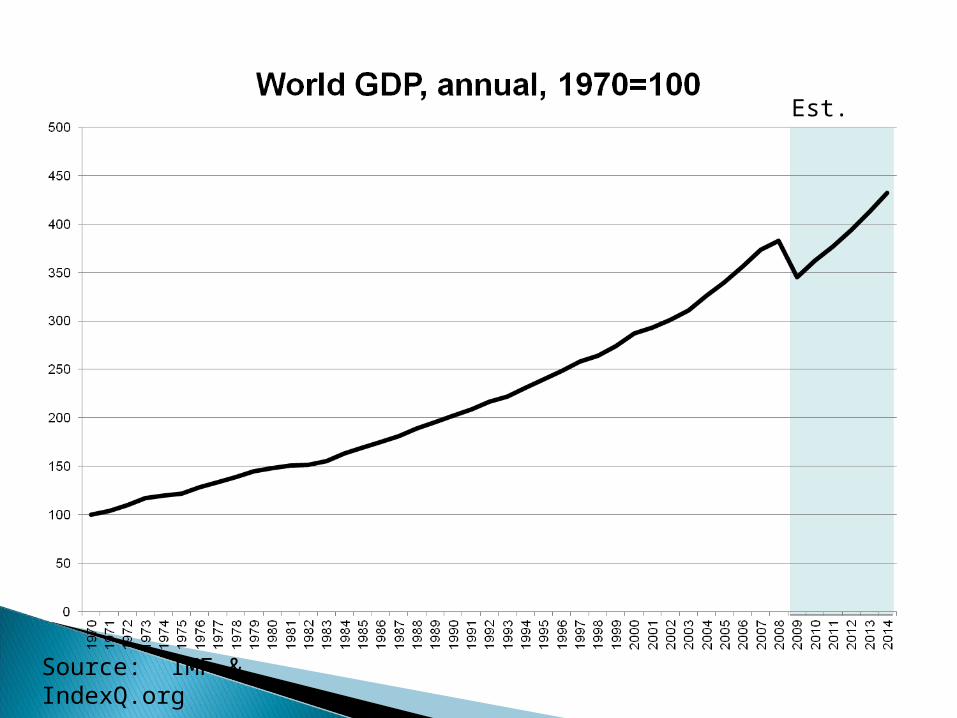
Est.
Source: IMF & IndexQ.org
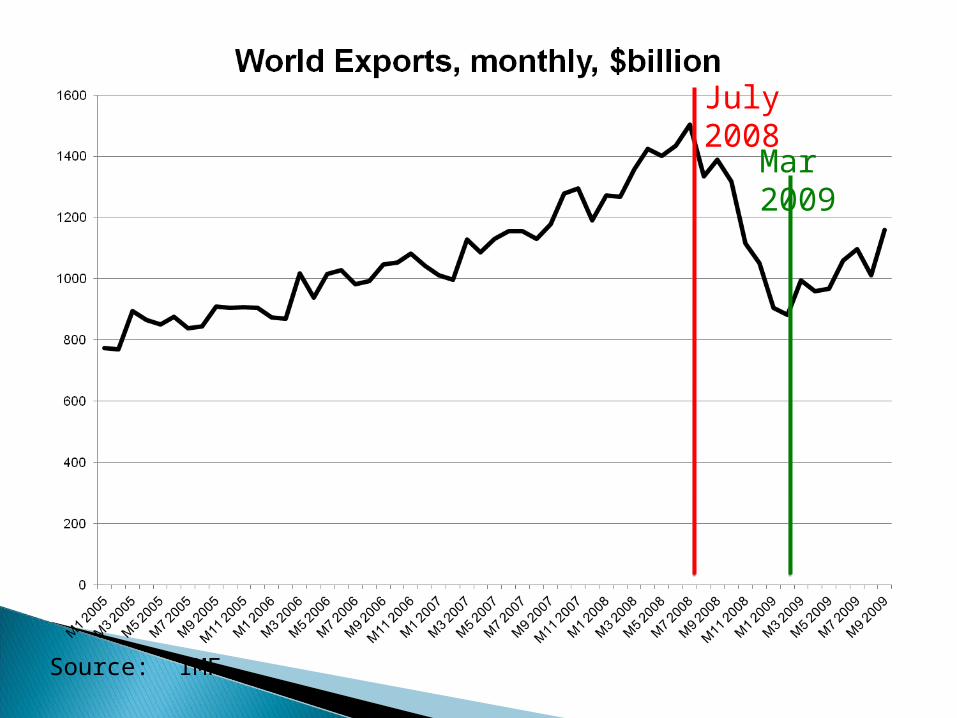
July 2008
Mar 2009
Source: IMF
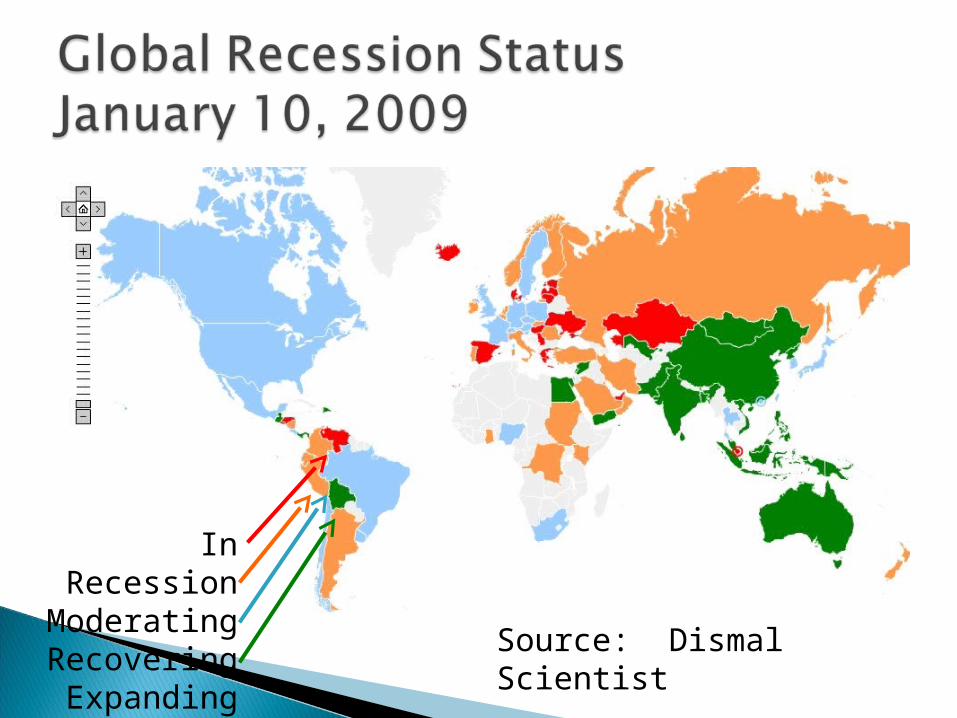
In RecessionModeratingRecoveringExpanding
Source: Dismal Scientist
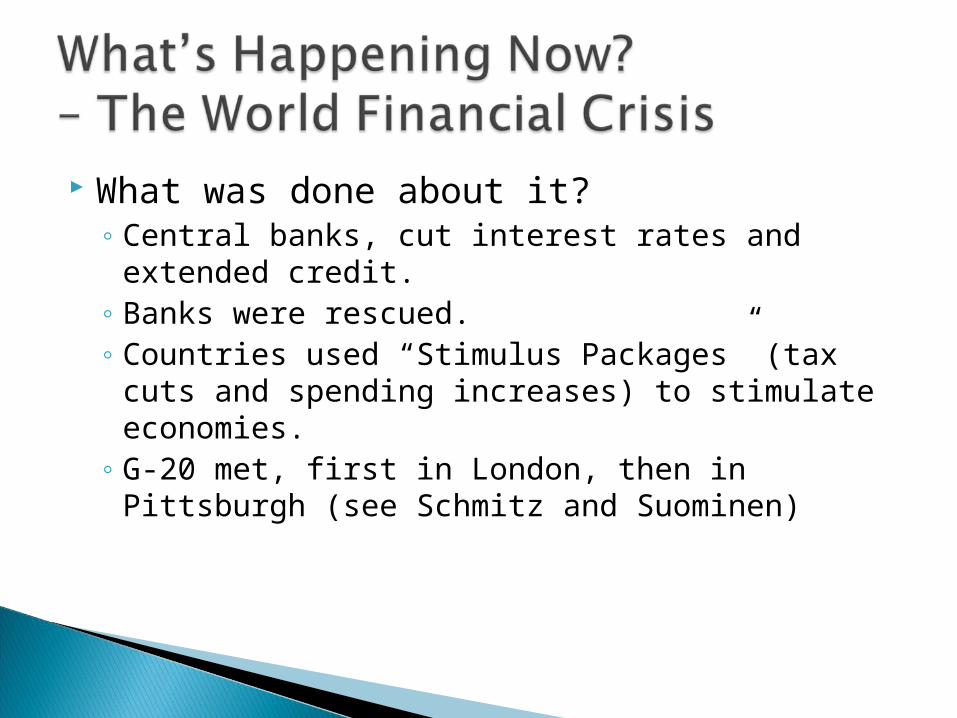
What was done about it?◦ Central banks, cut interest rates and extended
credit.◦ Banks were rescued.◦ Countries used “Stimulus Packages” (tax cuts and
spending increases) to stimulate economies.◦ G-20 met, first in London, then in Pittsburgh (see
Schmitz and Suominen)
What was done about it?◦ IMF back in business making loans.
Packages already in hand for Iceland Hungary Ukraine. Many more
G-20 promised more funds to IMF
What will prevent future problems?◦ Financial regulation
restraints on bank lending reform of credit rating agencies
◦ Managed currency policies? (US concern with China’s currency.)
IFIs = International Financial Institutions◦ IMF and World Bank◦ See Lachman article:
Reputations have suffered IMF from financial crises and mis-management WB from leadership of Paul Wolfowitz
Roles have been reduced by private lending, but their staffs have grown, by 50% over last 10 years
What should they be doing? IMF: surveillance over exchange systems and
imbalances WB: alleviate poverty, especially in Africa
Doha Round (of multilateral trade negotiations under the WTO)◦ Began at Doha, Qatar, 2001◦ Negotiations
Take place at WTO Headquarters in Geneva, Switzerland
But periodically occur at “Ministerial Meetings” (meetings of trade ministers) in other cities
Doha Round starts and stops◦ Cancún Ministerial, 2003: Failed to agree
Doha Round starts and stops◦ Cancún Ministerial, 2003: Failed to agree◦ Hong Kong Ministerial, 2005: Only minimal
agreement
Doha Round starts and stops◦ Cancún Ministerial, 2003: Failed to agree◦ Hong Kong Ministerial, 2005: Only minimal
agreement◦ Negotiations suspended July 2006, restarted
2007◦ US, EU, Brazil and India met in Potsdam,
Germany, but ended in deadlock June 21, 2007◦ June 30, 2007: US negotiating authority expired◦ July 29, 2008: Negotiations broke down over
agriculture◦ Future uncertain; don’t know when, & whether,
talks will resume
Doha Round ◦ Objective was: Doha Development Agenda
To achieve substantial further reduction in trade barriers,
In both developed and developing countries, While for the first time providing meaningful benefits
to developing countries◦ Conflicts:
US and EU agricultural subsidies and tariffs Developing-country import barriers in manufactures
and services
Doha Round ◦ Reasons for failure of Doha Round:
All countries wanted other countries to reduce trade-distorting policies, but not to change their own policies
WTO requires agreement by all of its member countries (now 153); that’s hard to achieve!
Doha Round ◦ Reason for collapse in 2008 : Disagreement in
agriculture US trade distorting subsidies: US would “cap” these,
but not at a low enough level to satisfy India and China
“Special safeguards” for India: Permission to raise tariffs if imports rise above some threshold
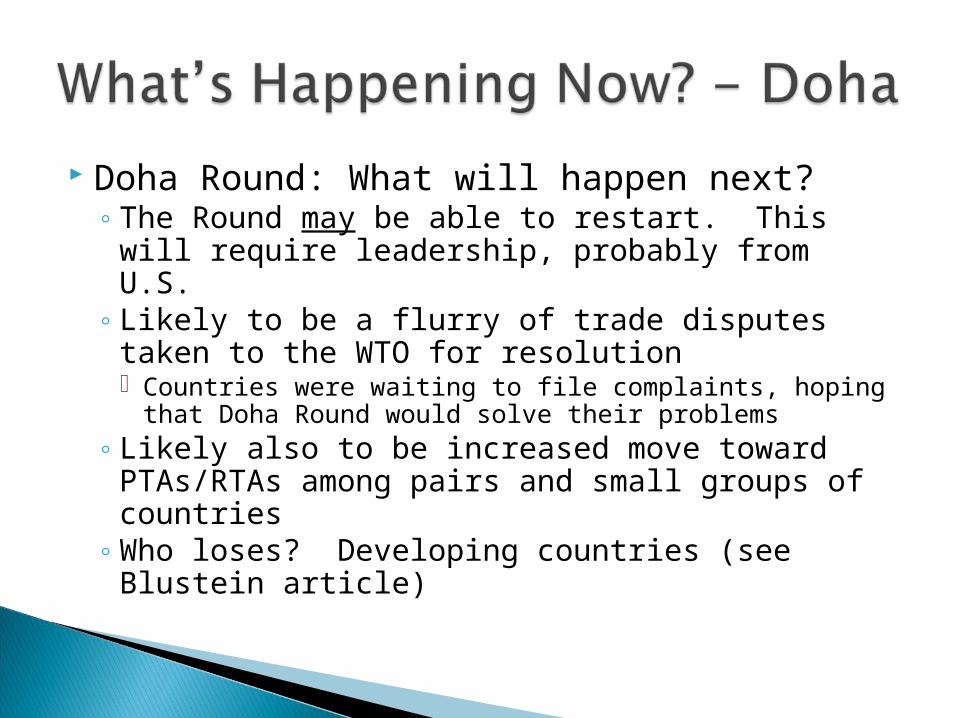
Doha Round: What will happen next?◦ The Round may be able to restart. This will
require leadership, probably from U.S.◦ Likely to be a flurry of trade disputes taken to
the WTO for resolution Countries were waiting to file complaints, hoping that
Doha Round would solve their problems◦ Likely also to be increased move toward
PTAs/RTAs among pairs and small groups of countries
◦ Who loses? Developing countries (see Blustein article)
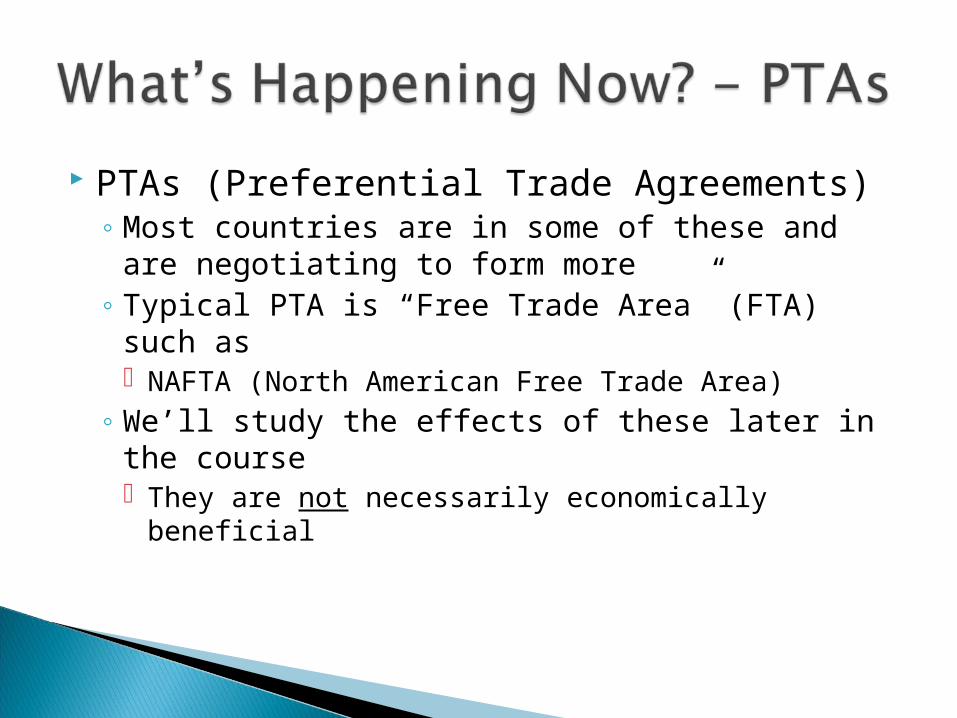
PTAs (Preferential Trade Agreements) ◦ Most countries are in some of these and are
negotiating to form more◦ Typical PTA is “Free Trade Area” (FTA) such as
NAFTA (North American Free Trade Area)◦ We’ll study the effects of these later in the course
They are not necessarily economically beneficial
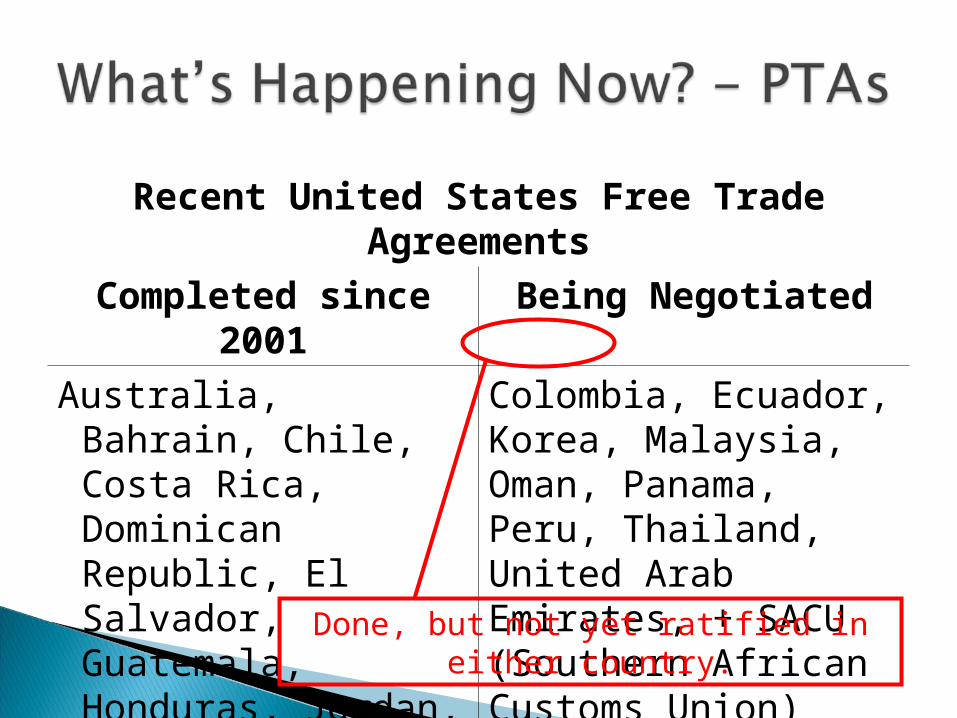
Recent United States Free Trade Agreements
Completed since 2001 Being Negotiated
Australia, Bahrain, Chile, Costa Rica, Dominican Republic, El Salvador, Guatemala, Honduras, Jordan, Morocco, Nicaragua, Singapore
Colombia, Ecuador, Korea, Malaysia, Oman, Panama, Peru, Thailand, United Arab Emirates, + SACU (Southern African Customs Union)
Done, but not yet ratified in either country.
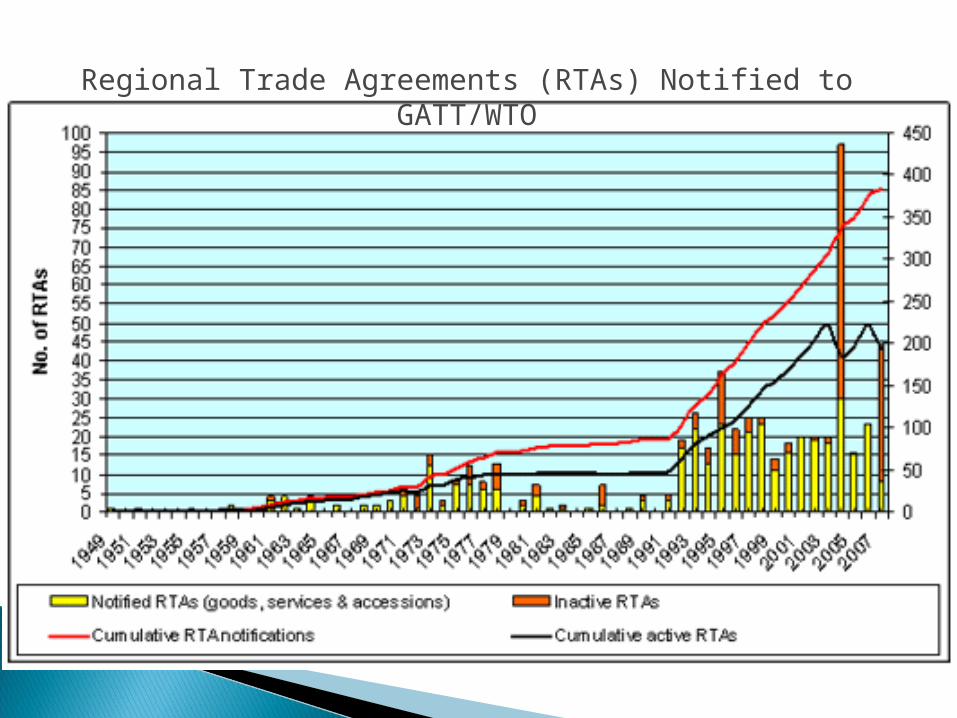
Regional Trade Agreements (RTAs) Notified to GATT/WTO
Most recently:◦ On January 1, China and ASEAN announced a new
Free Trade Agreement◦ ASEAN = Association of Southeast Asian Nations:
Indonesia, Philippines, Viet Nam, Thailand, & Singapore, + 5 more
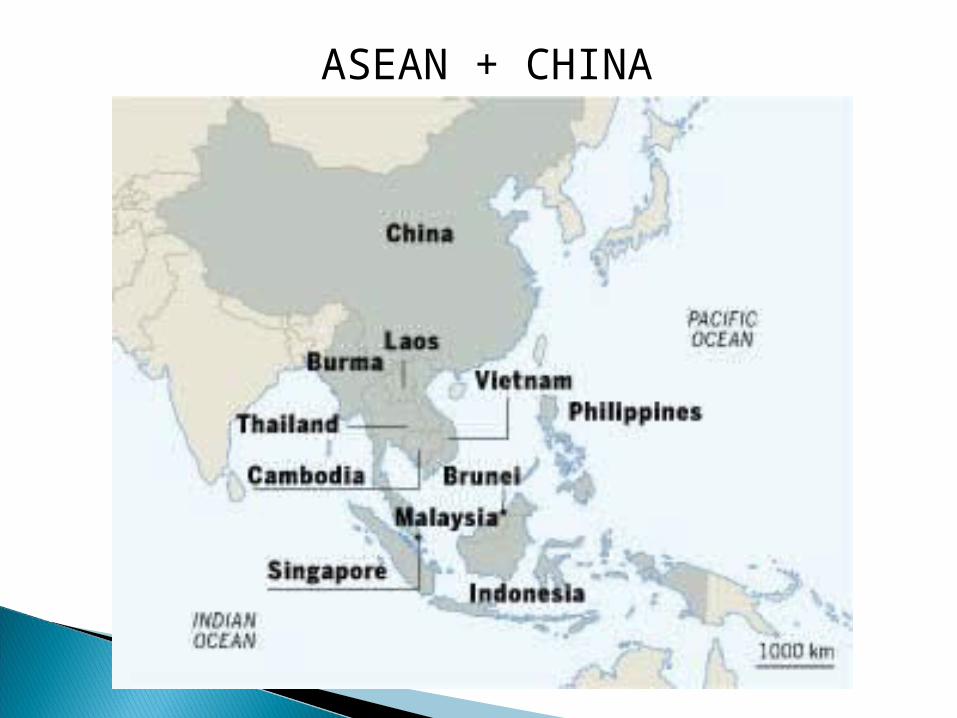
ASEAN + CHINA
Trade Disputes◦ China’s currency (the yuan)
Was pegged to US $ at 8.2765 ¥/$ and considered undervalued
Allowed to rise as of July 21, 2005. It rose 2.1% Since then it has risen steadily until July 2008, to
6.8363 ¥/$ about 20% In July 2008, dollar itself started to rise, and yuan has
stayed the same Many, in US and especially in EU, think yuan should
rise much more. China says no!
Comparative Advantage and the Gains from Trade◦ What causes countries to export and import?◦ Why do they gain from trading?◦ The “Ricardian Model” of International Trade