Embed Size (px)
Citation preview

1
2
The New Geography of Immigration and Local Policy Responses
Brookings Mountain WestUniversity of Nevada Las Vegas
March 9, 2010
Audrey SingerSenior Fellow

3
The state of play on immigration: national policy and national trends
The New Geography of Immigration and Policy Response
I
The new metropolitan geographyII
Local policy response and the challenges for the Obama AdministrationIII
4
I. Immigration Reform:The National Context
Mexico-US border near San Diego, CA

5
Historically rapid growth of the immigrant population
A new geography of immigrant settlement, including many areas with little recent history of immigration
Failure of the federal government to overhaul laws
Why is immigration currently a big deal?
6
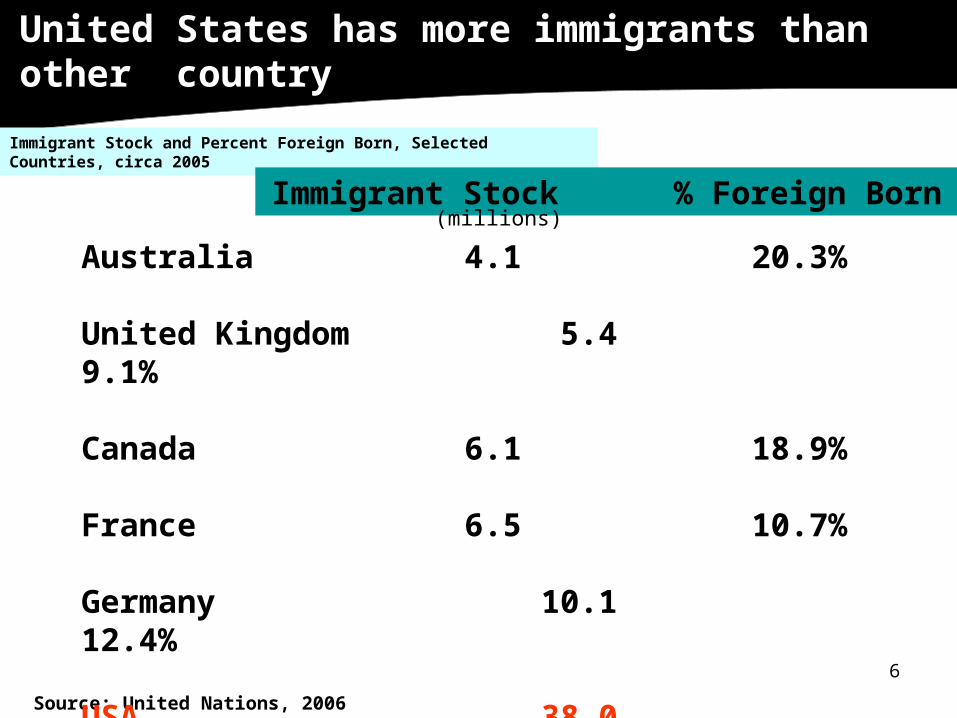
Immigrant Stock and Percent Foreign Born, Selected Countries, circa 2005
Source: United Nations, 2006
Immigrant Stock % Foreign Born
Australia 4.1 20.3%
United Kingdom 5.4 9.1%
Canada 6.1 18.9%
France 6.5 10.7%
Germany 10.1 12.4%
USA 38.0 12.6%
(millions)
The United States has more immigrants than any other country

7
Net Immigration,
42.3%Natural
Increase, 57.7%
Components of population change, 2000-2005
Source: Population Estimates, US Census Bureau
Currently forty-two percent of US population growth comes from immigration

8
Estimated legal status of the foreign born, 2005
Source: Passel, 2006
Unauthorized Migrants
11.1 million30%
Temporary Legal Residents 1.3 million
3%
Naturalized Citizens (former
LPRs) 12.8 million
35%
Legal Permanent Residents (LPRs)
11.8 million32%
Source: Passel, 2006
An estimated 30 percent of immigrants in the US are unauthorized

9Source: U.S. Census Bureau, ACS 2006
Africa4%
Europe13%
Asia27%
Latin America53%
Other3%
More than half of all immigrants are from Latin America; Asian immigrants represent about one-quarter

10
1 Mexico 11,541,404
2 Philippines 1,638,413
3 India 1,519,157
4 China 1,334,079
5 Vietnam 1,117,800
6 El Salvador 1,047,124
7 Korea 1,023,956
8 Cuba 935,865
9 Canada 846,913
10 Dominican Republic 766,570Source: U.S. Census Bureau, ACS 2006
Nationally, Mexican immigrants dominate; diverse originsround out the top ten countries
Foreign-born Persons Residing in the U.S.2006

11
Foreign-born Proportion of US Labor Force and Total Population, 1970-2005
14.7
7.9
12.1
6.7
5.3
9.3
12.6
11.0
4.8
6.3
0
4
8
12
16
1970 1980 1990 2000 2005
Foreign born in civilian labor force Foreign born in total population
Immigrant workers are a growing part of the U.S. labor force

12
Total population and age 65+ growth, 1970-2030
0
5
10
15
20
25
30
35
40
1970-80 1980-90 1990-00 2000-10 2010-20 2020-30
Total Population Age 65+
Source: William H. Frey analysis
The U.S. population 65 and over is projected to spike in the next few decades

13Source: Passel and Cohn, 2008
The Latino population will triple in size and account for most of the population growth, 2005-2050
14
II. The New Metropolitan
Geography of Immigration
Public Library, Montgomery County, MD

15
10.3 13.5 13.9 14.2 11.6 10.3 9.7 9.6 14.1 19.8 38.031.1
13.6%
11.6%
6.9%
5.4%4.7%
6.2%
12.5%
14.7%
11.1%
7.9%
13.2%
8.8%
-
5
10
15
20
25
30
35
40
1900 1910 1920 1930 1940 1950 1960 1970 1980 1990 2000 2008
Pop
ulat
ion
in M
illio
ns
0%
2%
4%
6%
8%
10%
12%
14%
16%
Per
cent
of
Tot
al P
opul
atio
n
Population Percent of Population
Source: U.S. Census Bureau
Total Foreign Born and Share Foreign Born in the United States, 1900-2008
Source: U.S. Census Bureau
Africans are a part of the “new immigration” that has takenplace since 1965.

16
1900
New York 1,270,080 37.0
Chicago 587,112 34.6
Philadelphia 295,340 22.8
Boston 197,129 35.1
Cleveland 124,631 32.6
San Francisco 116,885 34.1
St. Louis 111,356 19.4
Buffalo 104,252 29.6
Detroit 96,503 33.8
Milwaukee 88,991 31.2
Houston
10.5204,746Philadelphia
35.0293,811San Francisco
26.6335,784Dallas
25.2339,617San Diego
38.1359,786San Jose
23.3370,047Phoenix
28.4593,514
21.4638,730Chicago
39.41,537,661Los Angeles
36.43,365,107New York
2008
Few cities have maintained their status as gateways throughout the 20th century

17
0
5
10
15
20
25
30
35
40
Year
Per
cen
t fo
reig
n b
orn
Former
FormerBuffaloClevelandDetroitPittsburghSt. Louis
Percent of Foreign Born in Cities by Gateway Type, 1900-2000
Former gateways are no longer major destinations

180
5
10
15
20
25
30
35
40
Year
Pe
rcen
t fo
reig
n b
orn
Continuous
ContinuousBostonChicago New YorkSan Francisco
Percent of Foreign Born in Cities by Gateway Type, 1900-2000
Continuous gateways have always attracted more than their fair share of immigrants

19
0
5
10
15
20
25
30
35
40
Year
Perc
en
t fo
reig
n b
orn
Post-WWII
Post-WWIIHoustonLos AngelesMiami
Percent of Foreign Born in Cities by Gateway Type, 1900-2000
Post-WWII gateways became destinations during the past 50 years
20
0
5
10
15
20
25
30
35
40
Year
Perc
en
t fo
reig
n b
orn
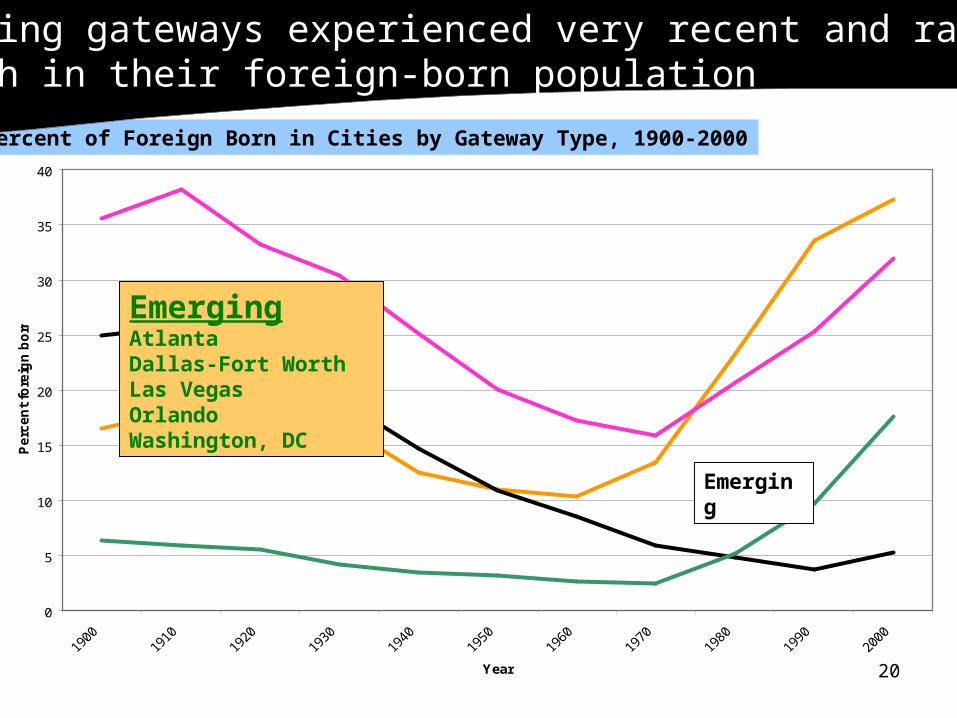
Emerging
EmergingAtlanta Dallas-Fort WorthLas VegasOrlandoWashington, DC
Percent of Foreign Born in Cities by Gateway Type, 1900-2000
Emerging gateways experienced very recent and rapid growth in their foreign-born population

21
0
5
10
15
20
25
30
35
40
Year
Perc
en
t fo
reig
n b
orn
Re-Emerging
Re-EmergingMinneapolis-St. PaulPortlandSacramentoSeattle
Percent of Foreign Born in Cities by Gateway Type, 1900-2000
Re-Emerging gateways are once again major destinations for immigrants

22
0
5
10
15
20
25
30
35
40
Year
Perc
en
t fo
reig
n b
orn
Re-Emerging
Former
Continuous
Post-WWII
Emerging
Percent of Foreign Born in Cities by Gateway Type, 1900-2000
Emerging gateways represent a new context for immigrant integration

23
1 New York-Northern New Jersey-Long Island 5,328,033
2 Los Angeles-Long Beach-Santa Ana 4,374,583
3 Miami-Fort Lauderdale-Pompano Beach 1,995,037
4 Chicago-Naperville-Joliet 1,689,617
5 San Francisco-Oakland-Fremont 1,258,324
6 Houston-Sugar Land-Baytown 1,237,719
7 Dallas-Fort Worth-Arlington 1,121,321
8 Washington-Arlington-Alexandria 1,089,950
9 Riverside-San Bernardino-Ontario 894,527
10 Boston-Cambridge-Quincy 731,960
Eight out of the top ten metropolitan areas have more than 1 million immigrant residents
Metropolitan Areas with the Largest Number of Immigrants, 2008

24
Metropolitan Las Vegas ranked 6th among all metro areas in immigrant growth between 1990 and 2008
Metropolitan Areas with the Fastest Rate of Foreign-Born Growth, 1990-2008
2008 % change 1990-2008
Charlotte-Gastonia-Concord 163,539 621
Raleigh-Cary 117,298 569
Greensboro-High Point 51,423 511
Atlanta-Sandy Springs-Marietta 710,885 506
Nashville-Davidson-Murfreesboro-Franklin 107,184 488
Las Vegas-Paradise 403,674 474
Greenville-Mauldin-Easley 39,915 431
Cape Coral-Fort Myers 89,388 412
Boise City-Nampa 44,844 368
Provo-Orem 36,644 340

25
Metro areas in the Southeast had the highest rates of immigrant growth

26
Residence of the Foreign-born Population in the United States, 1980-2008
41.3
41.8
37.9
34.0
44.0
46.5
48.1
51.4
9.3
8.5
9.4
10.1
5.4
3.2
4.6
4.4
0 5 10 15 20 25 30 35 40
1980
1990
2000
2008
Millions
Cities
Suburbs
Small Metros
Non-metros
Note: Cities and suburbs are defined for the 100 largest metropolitan areas based on 2000 population. Central cities are those that are first named in the metropolitan area title and any other named cities that had at least 100,000 total population in 2000. The residual of the metro area is defined as suburban. The 261 metro areas that are not in the top 100 are classified as "small metros." In 2008, data for five cities in five of the top 100 metros were not available so the foreign-born population in those metros were classified as fully suburban.
19.8M
31.1M
38.0M
14.1M
Dramatic shifts in settlement patterns among immigrants show more immigrants in the suburbs of the 100 largest metros than in the cities

27
What happened between 2007 and 2008?
Weathering the Recession?Atlanta, Houston, Dallas-Ft. Worth, Portland (OR)
Immigration U-Turn?Phoenix, Riverside-San Bernardino, San Jose,
Minneapolis-St Paul, Las Vegas
Holding Steady?Charlotte, Raleigh, Salt Lake City, Orlando,
Sacramento, Philadelphia, Washington DC

28
What’s Next: Policy Options
III. State and Local Response
Outside a tax preparation shop, Herndon, VA

29
National Conference of State Legislatures reports more than 1500 state laws were considered in 2009 that are immigrant- and immigration-related
353 became law in 48 states
Countless local jurisdictions across the country have introduced local laws
State- and local-level reforms

30
Hostility
Accommodation
Tolerance
Deflection
Local response and legislation variesin the absence of federal immigration reform

31
Local efforts may be compounded by the large number of recent arrivals and local governance structure
No uniform set of policies and programs to aid in the social, economic, and political incorporation of immigrants
Local action, i.e., day labor, language policies, occupancy policies, local police enforcement offer fragmented response
Immigrant integration operates at the local level
THE INTEGRATION OF IMMIGRANTS: The Policy Context for Localities
32
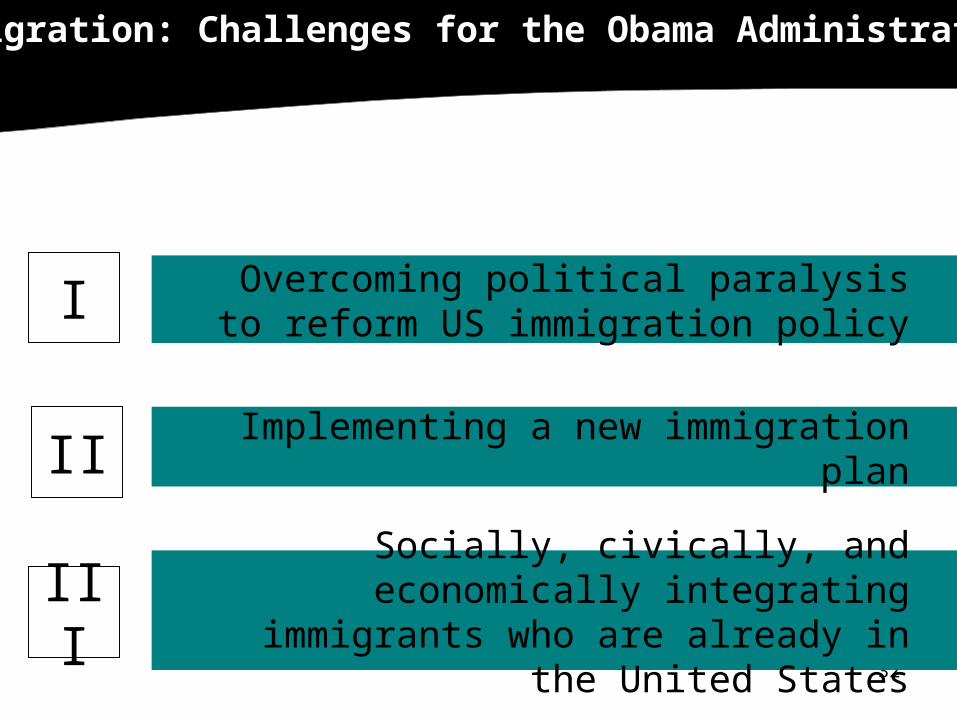
Overcoming political paralysis to reform US immigration policy
Implementing a new immigration plan
Socially, civically, and economically integrating immigrants who are already in
the United States
Immigration: Challenges for the Obama Administration
I
II
III

33
www.brookings.edu/metro
v i s i t m e t r o :

34