Embed Size (px)
Citation preview
1
2006 Washington State 2006 Washington State Prevention SummitPrevention Summit
2006 Washington State 2006 Washington State Prevention SummitPrevention Summit
Analyzing and Preparing Data for Analyzing and Preparing Data for Outcome-Based Evaluation Outcome-Based Evaluation
Using the Assigned Measures and the Using the Assigned Measures and the PBPS Outcomes ReportPBPS Outcomes Report
October 20, 2006October 20, 2006
Sarah StachowiakSarah StachowiakOrganizational Research ServicesOrganizational Research Services
2
Purpose and GoalsPurpose and GoalsPurpose and GoalsPurpose and Goals
Increased knowledge of Increased knowledge of Assigned Measures (AMs)Assigned Measures (AMs)
Increased skills in collecting Increased skills in collecting participant dataparticipant data
Increased skills in interpreting Increased skills in interpreting PBPS Outcomes ReportPBPS Outcomes Report
3
DASA Required MeasuresDASA Required Measures
Pre-Post Survey Questions for All Youth Pre-Post Survey Questions for All Youth Participants 13-17 years oldParticipants 13-17 years old
PPG Items for Family, Community, PPG Items for Family, Community, School and Individual DomainsSchool and Individual Domains
Questions on: Perceived Risk, Questions on: Perceived Risk, Perceived Harm, Perceived Perceived Harm, Perceived “Wrongfulness” and 30-Day Use of “Wrongfulness” and 30-Day Use of SubstancesSubstances
15 Questions on PPG03 – Individual 15 Questions on PPG03 – Individual Domain ScaleDomain Scale
4
DASADASA Assigned Measures – Development Assigned Measures – Development ProcessProcess
Search of literature on Impacts and Search of literature on Impacts and Effects of Different Best PracticesEffects of Different Best Practices
Search for common shorter term, more Search for common shorter term, more direct outcomes for youth and parents direct outcomes for youth and parents participating in different programs and participating in different programs and practicespractices
Definitions of Outcomes -> Measurable Definitions of Outcomes -> Measurable IndicatorsIndicators
Search for Valid and Reliable Search for Valid and Reliable Measurement ScalesMeasurement Scales
5
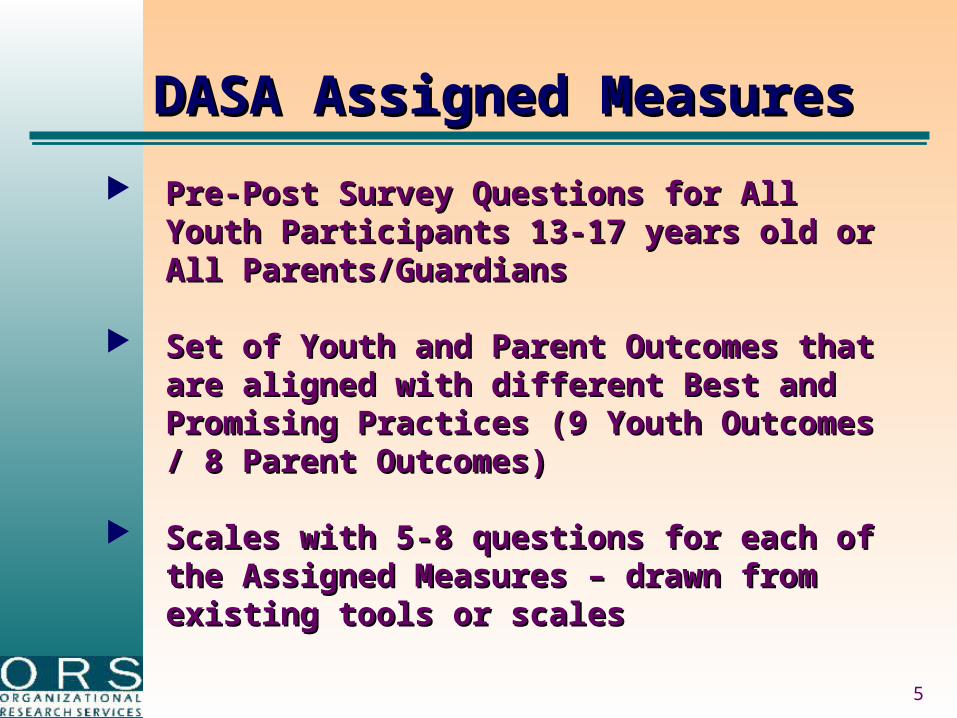
DASA Assigned MeasuresDASA Assigned Measures
Pre-Post Survey Questions for All Youth Pre-Post Survey Questions for All Youth Participants 13-17 years old or All Participants 13-17 years old or All Parents/GuardiansParents/Guardians
Set of Youth and Parent Outcomes that Set of Youth and Parent Outcomes that are aligned with different Best and are aligned with different Best and Promising Practices (9 Youth Promising Practices (9 Youth Outcomes / 8 Parent Outcomes)Outcomes / 8 Parent Outcomes)
Scales with 5-8 questions for each of Scales with 5-8 questions for each of the Assigned Measures – drawn from the Assigned Measures – drawn from existing tools or scalesexisting tools or scales
6
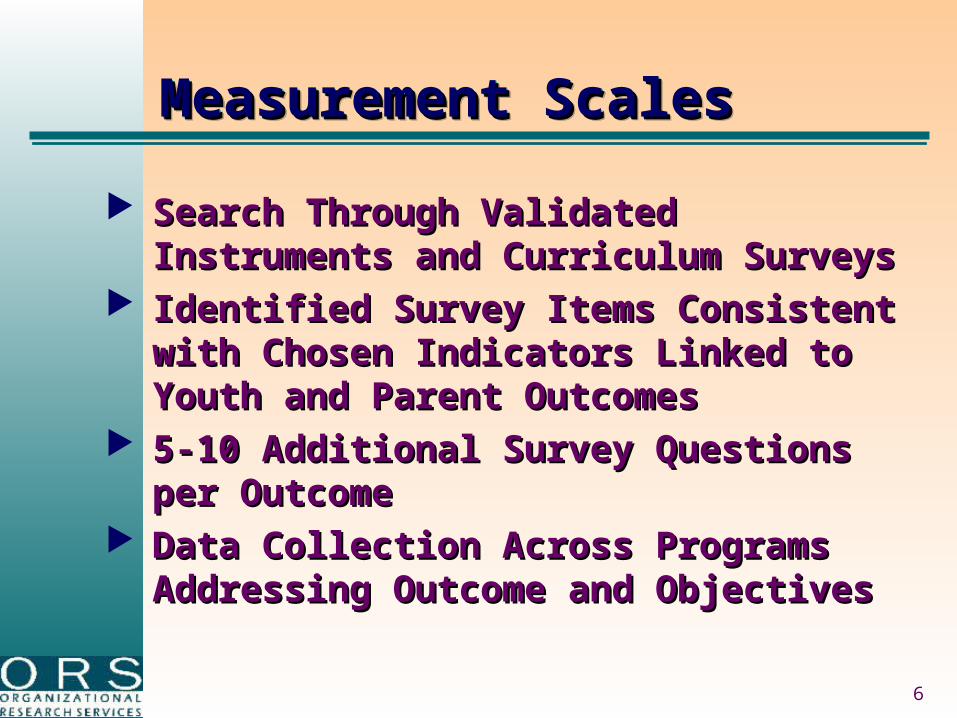
Measurement ScalesMeasurement ScalesMeasurement ScalesMeasurement Scales
Search Through Validated Search Through Validated Instruments and Curriculum Instruments and Curriculum Surveys Surveys
Identified Survey Items Consistent Identified Survey Items Consistent with Chosen Indicators Linked to with Chosen Indicators Linked to Youth and Parent OutcomesYouth and Parent Outcomes
5-10 Additional Survey Questions 5-10 Additional Survey Questions per Outcomeper Outcome
Data Collection Across Programs Data Collection Across Programs Addressing Outcome and ObjectivesAddressing Outcome and Objectives

7
Parent OutcomesParent OutcomesParent OutcomesParent Outcomes
Improved Family CohesionImproved Family Cohesion Improved Attitudes about Improved Attitudes about
Family Management SkillsFamily Management Skills Increased Use of Family Increased Use of Family
Management SkillsManagement Skills Increased Family InvolvementIncreased Family Involvement Improved Family Improved Family
CommunicationCommunication Reduced Family Conflict Reduced Family Conflict
8
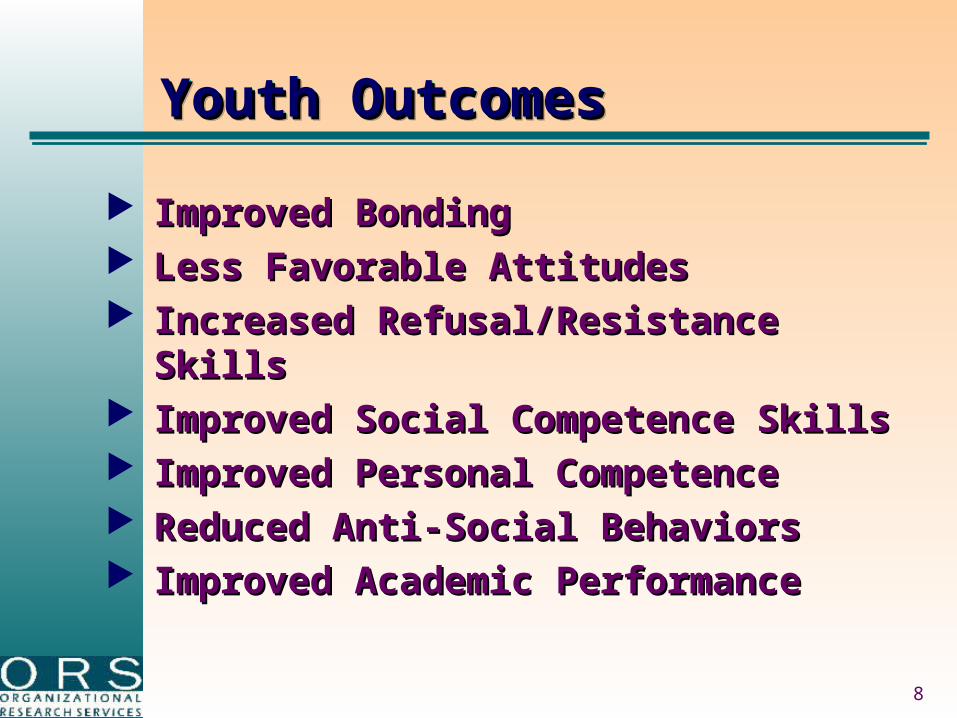
Youth OutcomesYouth OutcomesYouth OutcomesYouth Outcomes
Improved BondingImproved Bonding Less Favorable AttitudesLess Favorable Attitudes Increased Refusal/Resistance SkillsIncreased Refusal/Resistance Skills Improved Social Competence SkillsImproved Social Competence Skills Improved Personal CompetenceImproved Personal Competence Reduced Anti-Social BehaviorsReduced Anti-Social Behaviors Improved Academic PerformanceImproved Academic Performance
9
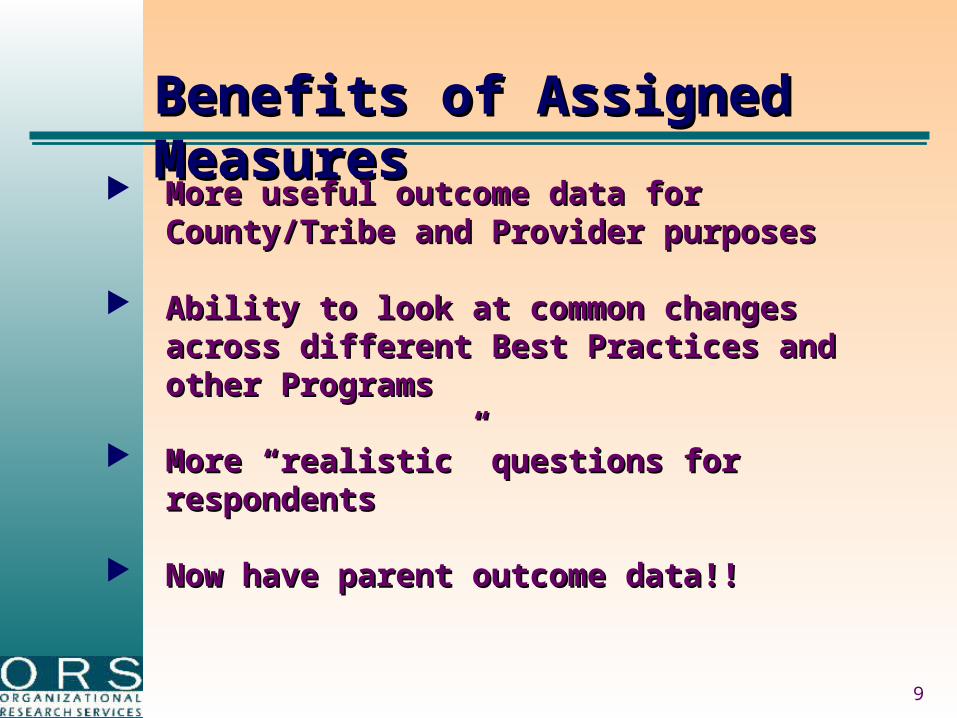
Benefits of Assigned MeasuresBenefits of Assigned Measures
More useful outcome data for More useful outcome data for County/Tribe and Provider purposesCounty/Tribe and Provider purposes
Ability to look at common changes Ability to look at common changes across different Best Practices and across different Best Practices and other Programsother Programs
More “realistic” questions for More “realistic” questions for respondentsrespondents
Now have parent outcome data!!Now have parent outcome data!!
10
Collecting Participant DataCollecting Participant DataCollecting Participant DataCollecting Participant Data
Participant ID IssuesParticipant ID Issues Administering SurveysAdministering Surveys Managing Data CollectionManaging Data Collection
11
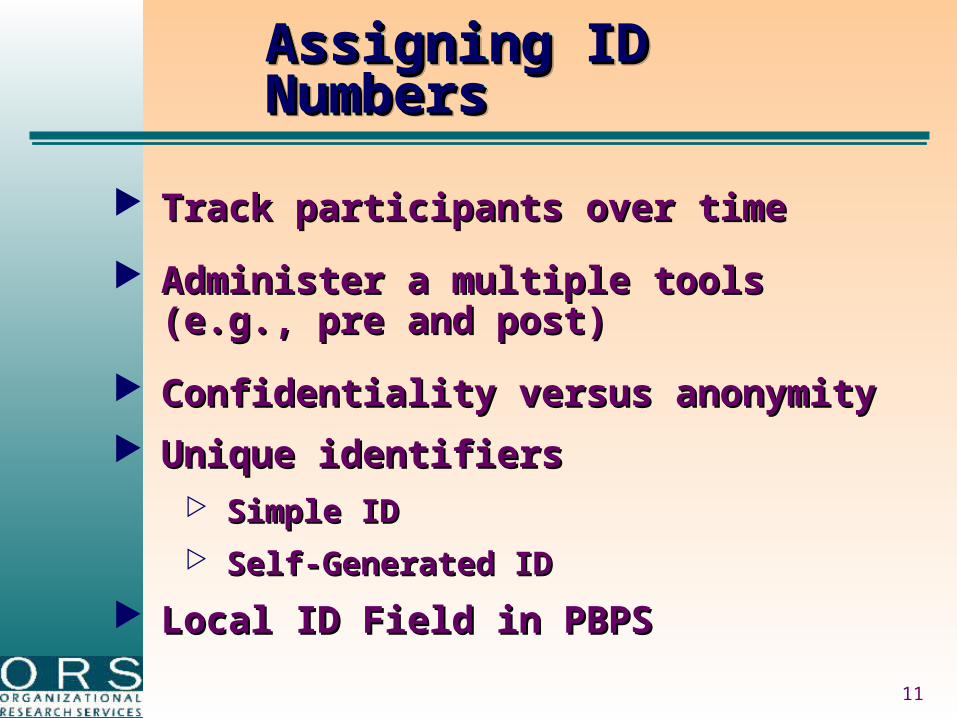
Assigning ID NumbersAssigning ID NumbersAssigning ID NumbersAssigning ID Numbers
Track participants over timeTrack participants over time
Administer a multiple tools (e.g., Administer a multiple tools (e.g., pre and post)pre and post)
Confidentiality versus anonymityConfidentiality versus anonymity
Unique identifiersUnique identifiers Simple IDSimple ID Self-Generated IDSelf-Generated ID
Local ID Field in PBPSLocal ID Field in PBPS
12
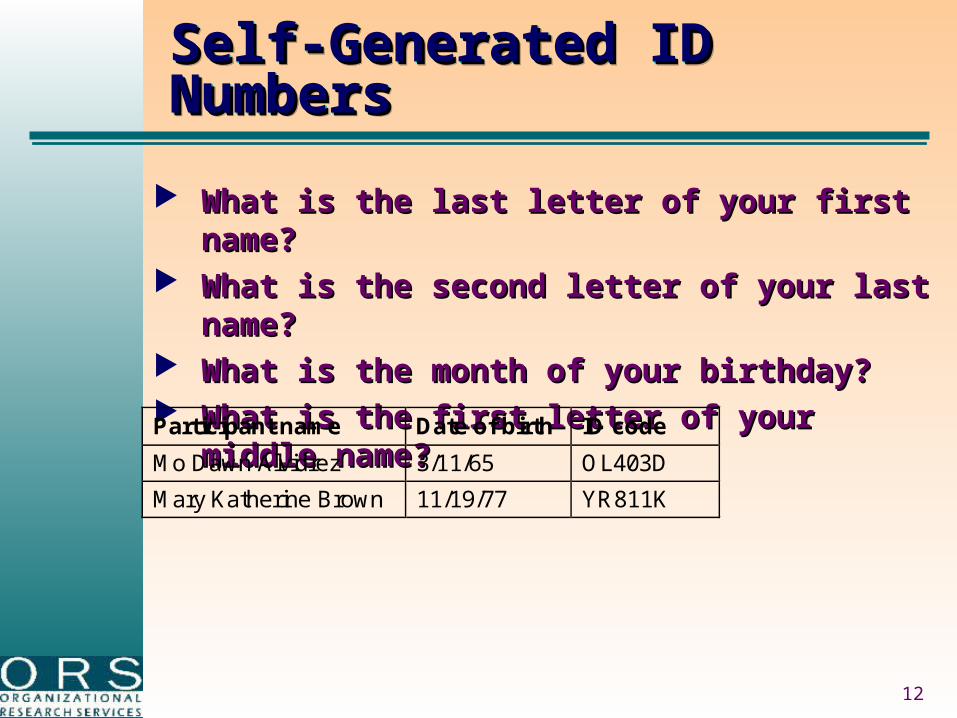
Self-Generated ID NumbersSelf-Generated ID NumbersSelf-Generated ID NumbersSelf-Generated ID Numbers
What is the last letter of your first What is the last letter of your first name?name?
What is the second letter of your last What is the second letter of your last name?name?
What is the month of your birthday?What is the month of your birthday? What is the first letter of your middle What is the first letter of your middle
name?name?Participant name Date of birth ID code
Mo Dawn Alvidrez 3/11/65 OL403D
Mary Katherine Brown 11/19/77 YR811K
13
Administering SurveysAdministering SurveysAdministering SurveysAdministering Surveys
Share the purpose and intentShare the purpose and intent Assure confidentialityAssure confidentiality Make sure everyone Make sure everyone
understands the ID code understands the ID code directionsdirections
Consider type of Consider type of administration (e.g., facilitator administration (e.g., facilitator reads questions)reads questions)
14
Managing Data Collection Managing Data Collection Managing Data Collection Managing Data Collection
Maintain a survey tracking Maintain a survey tracking systemsystem
Take steps to maximize Take steps to maximize response rateresponse rate
Use “data windows”Use “data windows” Collect data when you have Collect data when you have
access to participantsaccess to participants Consider incentivesConsider incentives
15
PBPS Outcome ReportPBPS Outcome ReportPBPS Outcome ReportPBPS Outcome Report
Levels of AggregationLevels of Aggregation Types of Data PresentedTypes of Data Presented Service CharacteristicsService Characteristics Pre-Post ChangesPre-Post Changes
16
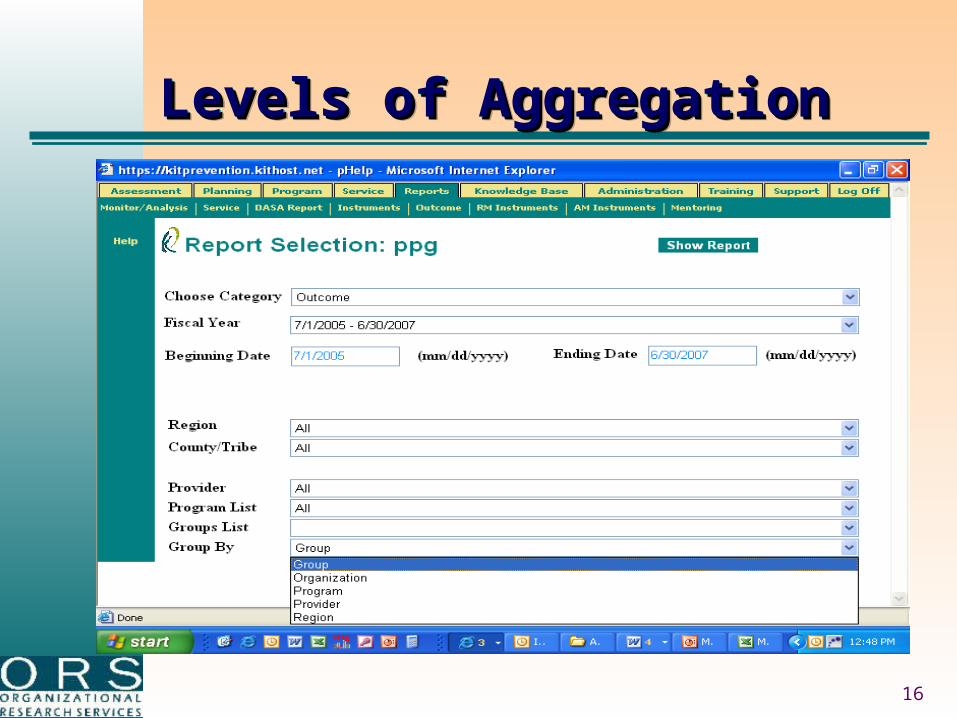
Levels of AggregationLevels of AggregationLevels of AggregationLevels of Aggregation
17
Descriptive DataDescriptive DataDescriptive DataDescriptive Data
Frequencies: Frequencies: summaries of the summaries of the number or percent of observations in number or percent of observations in each response categoryeach response category
Averages: Averages: mean of responsesmean of responses Cross-tabulations: Cross-tabulations: summaries of summaries of
frequency distributions across different frequency distributions across different subgroups or levels of a second subgroups or levels of a second variable (not yet available)variable (not yet available)
18
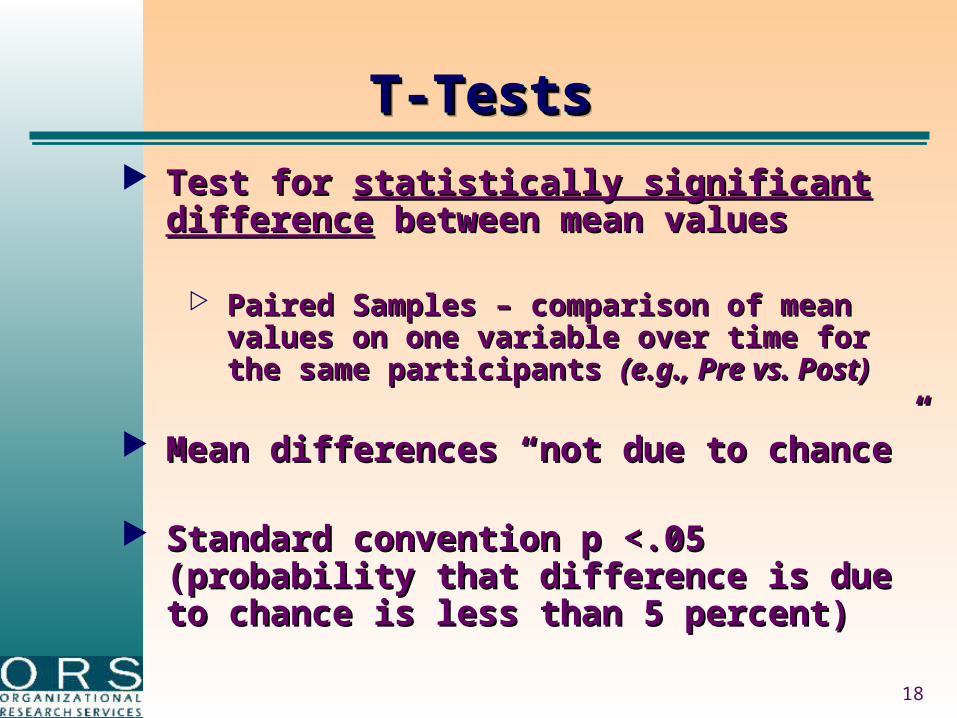
T-TestsT-TestsT-TestsT-Tests
Test for Test for statistically significant statistically significant differencedifference between mean values between mean values
Paired Samples – comparison of mean Paired Samples – comparison of mean values on one variable over time for the values on one variable over time for the same participants same participants (e.g., Pre vs. Post)(e.g., Pre vs. Post)
Mean differences “not due to Mean differences “not due to chance”chance”
Standard convention p <.05 Standard convention p <.05 (probability that difference is due to (probability that difference is due to chance is less than 5 percent)chance is less than 5 percent)
19
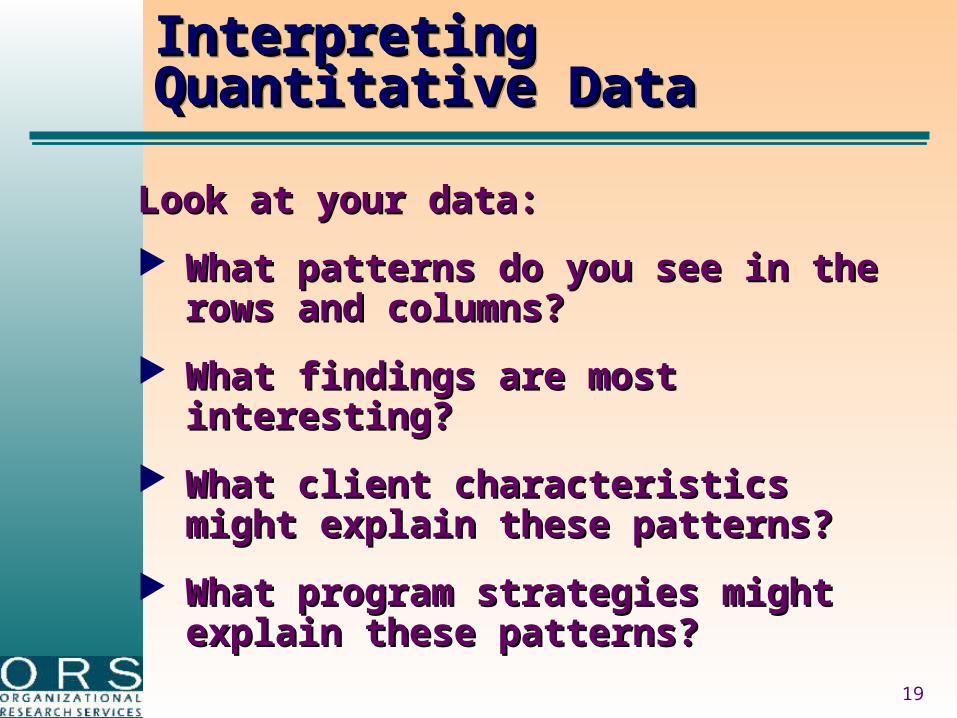
Interpreting Quantitative DataInterpreting Quantitative DataInterpreting Quantitative DataInterpreting Quantitative Data
Look at your data:Look at your data:
What patterns do you see in the What patterns do you see in the rows and columns? rows and columns?
What findings are most What findings are most interesting?interesting?
What client characteristics might What client characteristics might explain these patterns? explain these patterns?
What program strategies might What program strategies might explain these patterns?explain these patterns?
20
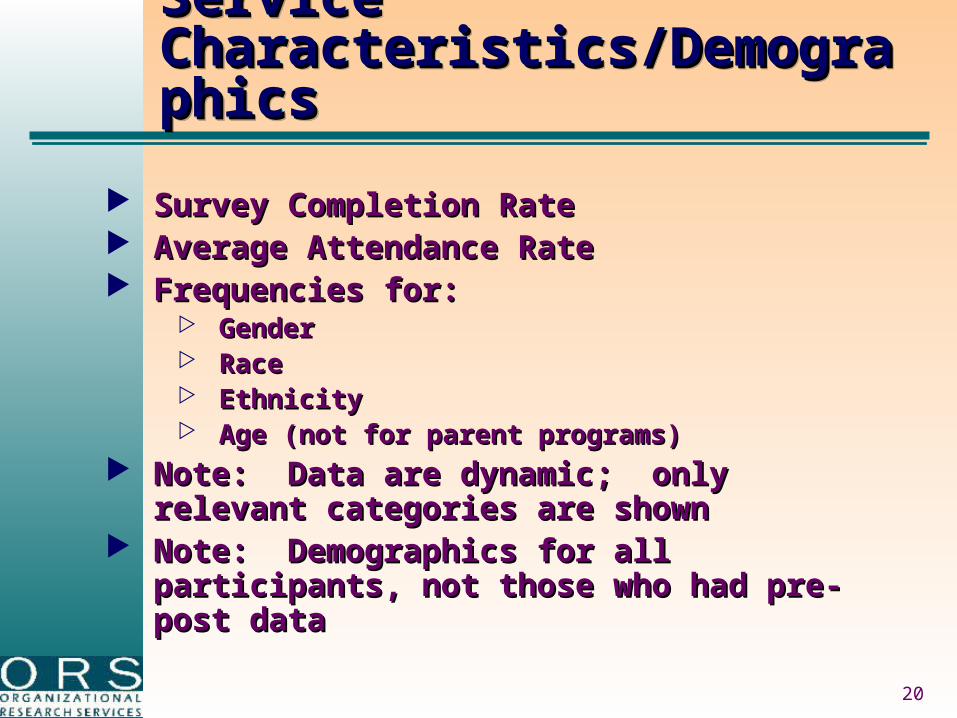
Service Service Characteristics/DemographicsCharacteristics/DemographicsService Service Characteristics/DemographicsCharacteristics/Demographics
Survey Completion RateSurvey Completion Rate Average Attendance RateAverage Attendance Rate Frequencies for:Frequencies for:
GenderGender RaceRace EthnicityEthnicity Age (not for parent programs)Age (not for parent programs)
Note: Data are dynamic; only relevant Note: Data are dynamic; only relevant categories are showncategories are shown
Note: Demographics for all participants, Note: Demographics for all participants, not those who had pre-post datanot those who had pre-post data
21
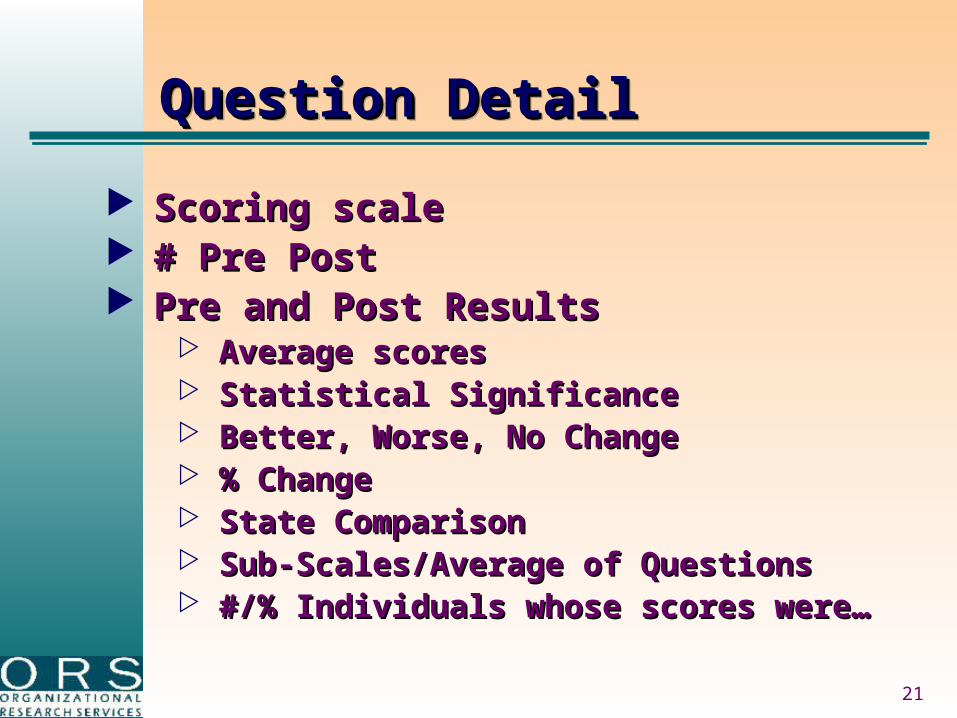
Question DetailQuestion DetailQuestion DetailQuestion Detail
Scoring scaleScoring scale # Pre Post# Pre Post Pre and Post ResultsPre and Post Results
Average scoresAverage scores Statistical SignificanceStatistical Significance Better, Worse, No ChangeBetter, Worse, No Change % Change% Change State Comparison State Comparison Sub-Scales/Average of QuestionsSub-Scales/Average of Questions #/% Individuals whose scores were…#/% Individuals whose scores were…

22
Interpretation ConsiderationsInterpretation ConsiderationsInterpretation ConsiderationsInterpretation Considerations
Sample sizeSample size Completion rateCompletion rate RepresentativenessRepresentativeness Cross tabulations (available Cross tabulations (available
2007)2007)
23
Group ExerciseGroup ExerciseGroup ExerciseGroup Exercise
Interpreting Outcome Report Interpreting Outcome Report DataData
24
Reporting FindingsReporting FindingsReporting FindingsReporting Findings
Considerations:Considerations: What do the data say about the What do the data say about the
outcomes?outcomes? Who is your audience? What is Who is your audience? What is
your purpose?your purpose? How can you best communicate How can you best communicate
what the data say?what the data say? What are the implications of the What are the implications of the
findings for program findings for program development? For marketing?development? For marketing?
25
Reporting FindingsReporting FindingsReporting FindingsReporting Findings
Provide Context:Provide Context:
Outputs (e.g., dosage (frequency, Outputs (e.g., dosage (frequency, quantity of intervention, number of quantity of intervention, number of participants)participants)
Description of interventionDescription of intervention
Background information that will Background information that will help you interpret the datahelp you interpret the data
Process information (e.g., fidelity)Process information (e.g., fidelity)
26
ResourcesResourcesResourcesResources
Updated Evaluation GuidebookUpdated Evaluation Guidebook Regional Prevention ManagersRegional Prevention Managers
27
Final ThoughtsFinal ThoughtsFinal ThoughtsFinal Thoughts
Goals of AMs and Outcome Goals of AMs and Outcome Report: Report:
Learning!Learning! Better decision-makingBetter decision-making Stronger prevention planning Stronger prevention planning
and programmingand programming Work in progressWork in progress
28
Contact InformationContact InformationContact InformationContact Information
Sarah StachowiakSarah Stachowiak
Organizational Research Organizational Research ServicesServices
[email protected]@organizationalresearch.comcom
206-728-0474 x10206-728-0474 x10