Embed Size (px)
Citation preview
1 © 2015 Pearson Education, Inc.
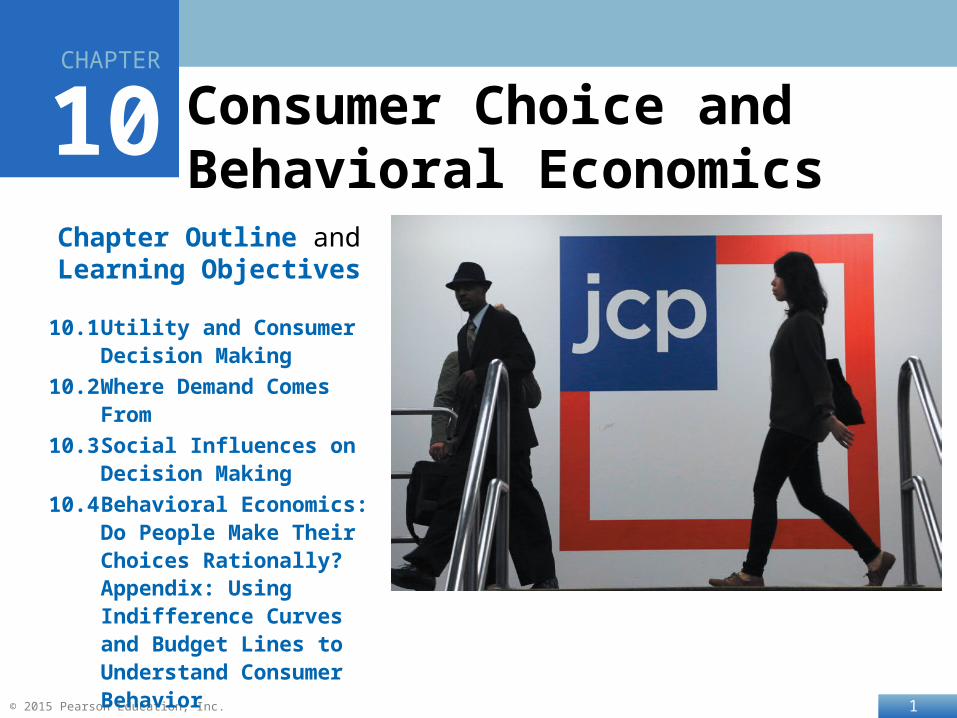
Chapter Outline andLearning Objectives
10.1 Utility and Consumer Decision Making
10.2 Where Demand Comes From
10.3 Social Influences on Decision Making
10.4 Behavioral Economics: Do People Make Their Choices Rationally?
Appendix: Using Indifference Curves and Budget Lines to Understand Consumer Behavior
CHAPTER
10CHAPTER
Consumer Choice and Behavioral Economics
2 © 2015 Pearson Education, Inc.
Consumer Decision Making
In our study of consumers so far, we have looked at what they do, but not why they do what they do.
Economics is all about the choices that people make; a better understanding of those choices furthers our understanding of economic behavior.
At the same time, we need to know the limits of our understanding. This chapter will examine what we know, and what we can’t explain, about how consumers behave.
3 © 2015 Pearson Education, Inc.
Rationality and Its Implications
As a starting point, economists assume that consumers are rational: making choices intended to make themselves as well-off as possible.
We examine these choices when consumers make their decisions about how much of various items to buy, given their scarce resources (income).
4 © 2015 Pearson Education, Inc.
Measuring Happiness
Economists refer to the enjoyment or satisfaction that people obtain from consuming goods and services as utility.
Utility cannot be directly measured; but for now, suppose that it could. What would we see?• As people consumed more of an item (say, pizza) their total utility
would change:• The amount by which it would change when consuming an
extra unit of a good or service is called the marginal utility.• Generally expect to see the first items consumed produce the most
marginal utility, so that subsequent items gave diminishing marginal utility.
Law of diminishing marginal utility: The principle that consumers experience diminishing additional satisfaction as they consume more of a good or service during a given period of time.
5 © 2015 Pearson Education, Inc.
Pizza on Super Bowl Sunday
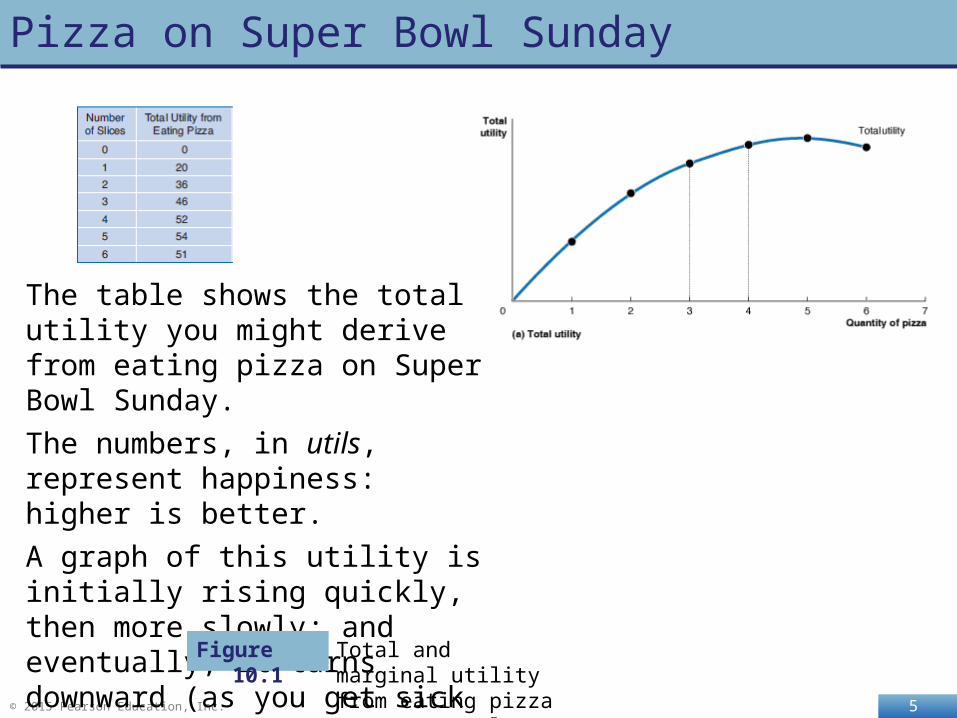
The table shows the total utility you might derive from eating pizza on Super Bowl Sunday.
The numbers, in utils, represent happiness: higher is better.
A graph of this utility is initially rising quickly, then more slowly; and eventually, it turns downward (as you get sick of pizza).
Total and marginal utility from eating pizza on Super Bowl Sunday
Figure 10.1
6 © 2015 Pearson Education, Inc.
Pizza on Super Bowl Sunday—continued
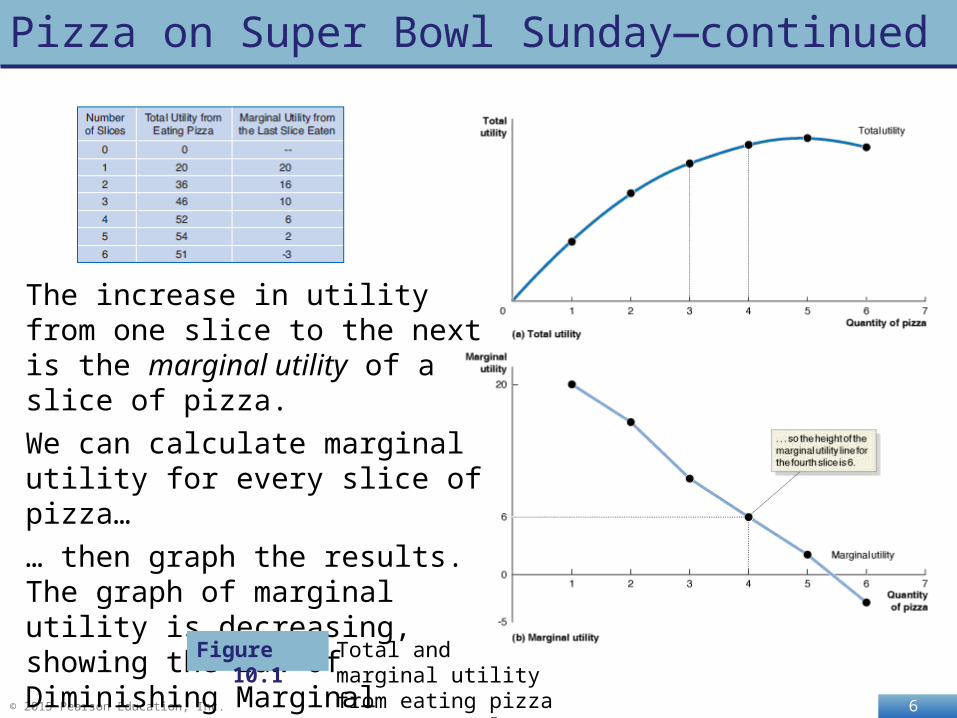
The increase in utility from one slice to the next is the marginal utility of a slice of pizza.
We can calculate marginal utility for every slice of pizza…
… then graph the results. The graph of marginal utility is decreasing, showing the Law of Diminishing Marginal Utility directly.
Total and marginal utility from eating pizza on Super Bowl Sunday
Figure 10.1
7 © 2015 Pearson Education, Inc.
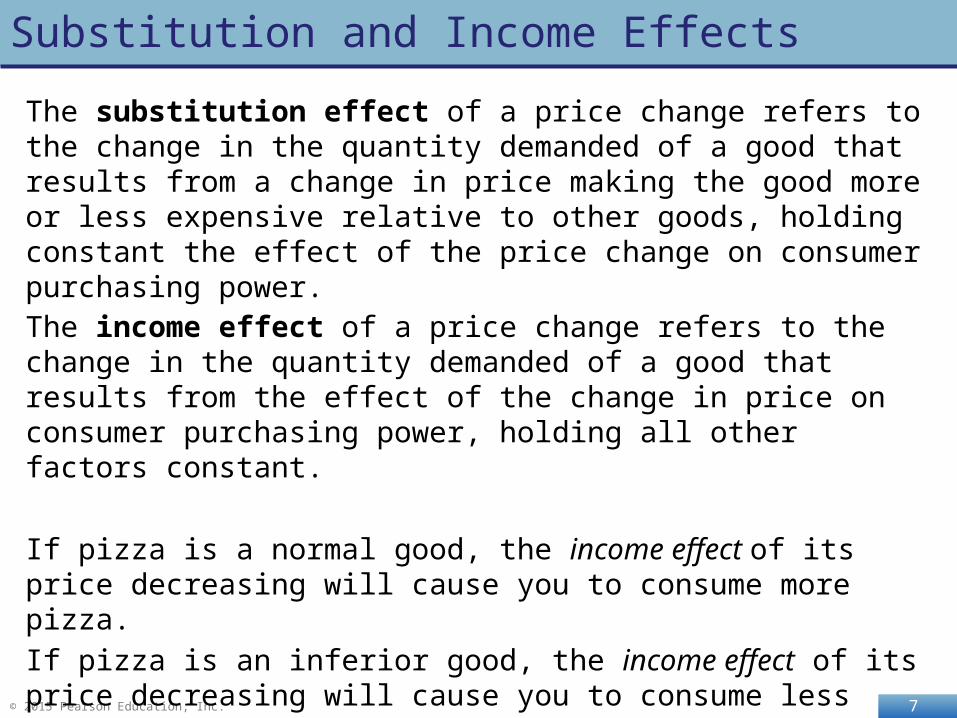
Substitution and Income Effects
The income effect of a price change refers to the change in the quantity demanded of a good that results from the effect of the change in price on consumer purchasing power, holding all other factors constant.
If pizza is a normal good, the income effect of its price decreasing will cause you to consume more pizza.
If pizza is an inferior good, the income effect of its price decreasing will cause you to consume less pizza.
The substitution effect of a price change refers to the change in the quantity demanded of a good that results from a change in price making the good more or less expensive relative to other goods, holding constant the effect of the price change on consumer purchasing power.
8 © 2015 Pearson Education, Inc.
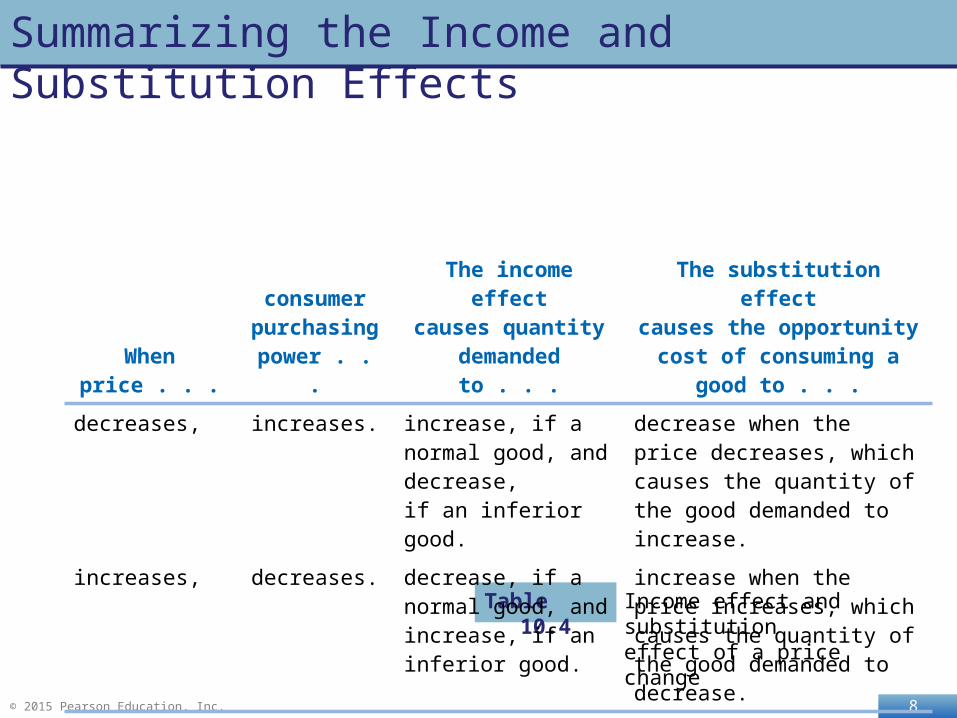
Summarizing the Income and Substitution Effects
Income effect and substitution effect of a price change
Table 10.4
When price . . .
consumerpurchasingpower . . .
The income effectcauses quantitydemanded to . . .
The substitution effectcauses the opportunity cost of consuming a good to . . .
decreases, increases. increase, if a normal good, and decrease, if an inferior good.
decrease when the price decreases, which causes the quantity of the good demanded to increase.
increases, decreases. decrease, if a normal good, and increase, if an inferior good.
increase when the price increases, which causes the quantity of the good demanded to decrease.
9 © 2015 Pearson Education, Inc.
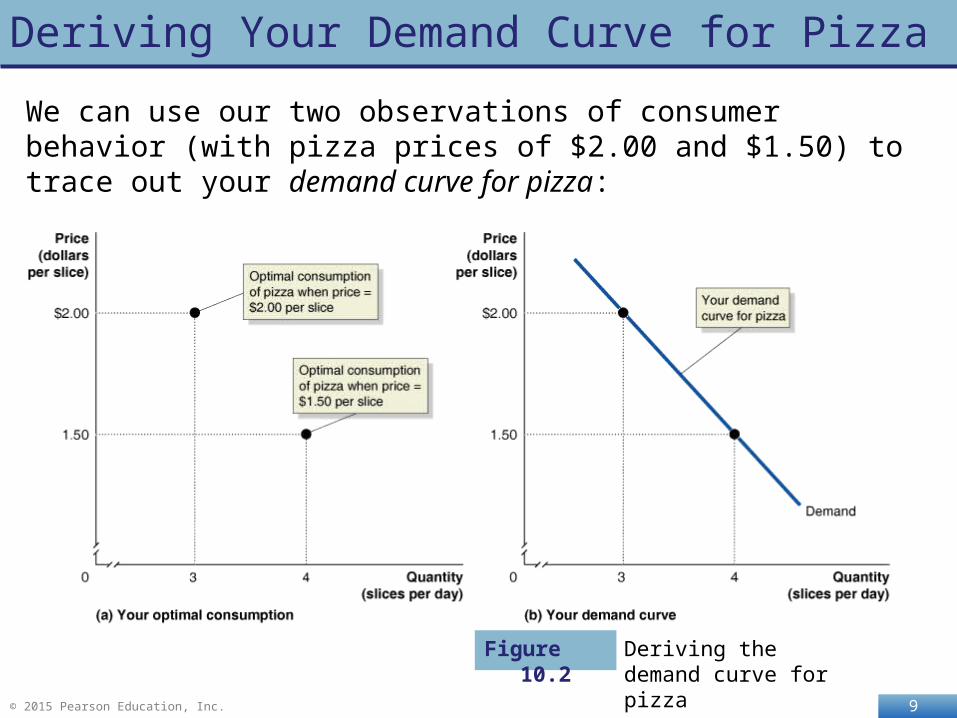
Deriving Your Demand Curve for Pizza
We can use our two observations of consumer behavior (with pizza prices of $2.00 and $1.50) to trace out your demand curve for pizza:
Deriving the demand curve for pizza
Figure 10.2
10 © 2015 Pearson Education, Inc.
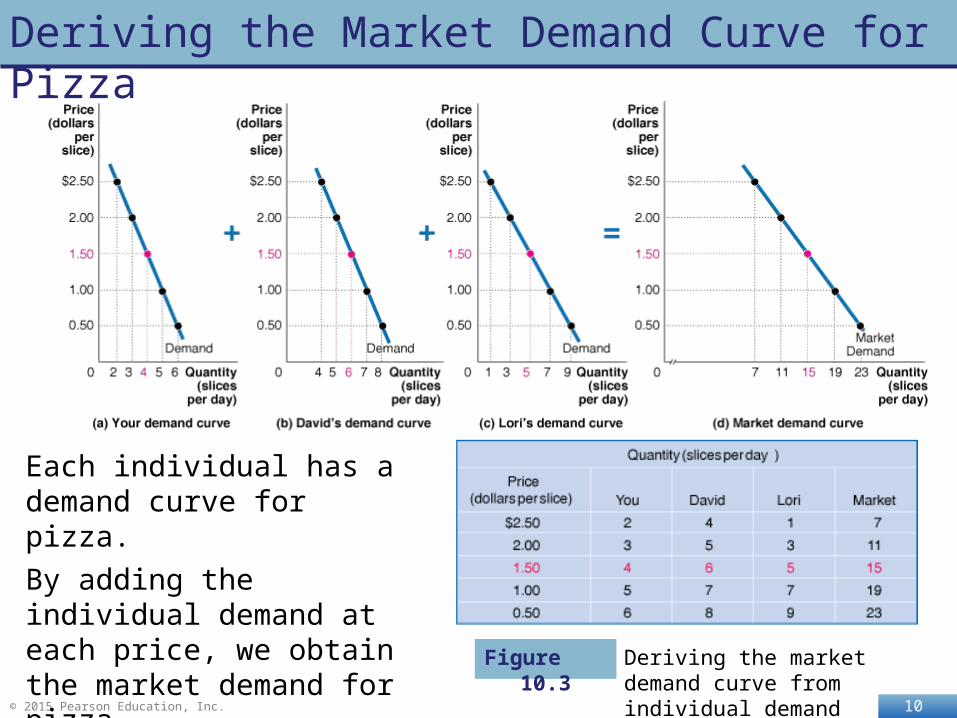
Deriving the Market Demand Curve for Pizza
Each individual has a demand curve for pizza.
By adding the individual demand at each price, we obtain the market demand for pizza. Deriving the market demand
curve from individual demand curves
Figure 10.3
11 © 2015 Pearson Education, Inc.
Makingthe
ConnectionCould a Demand Curve Slope Upward?
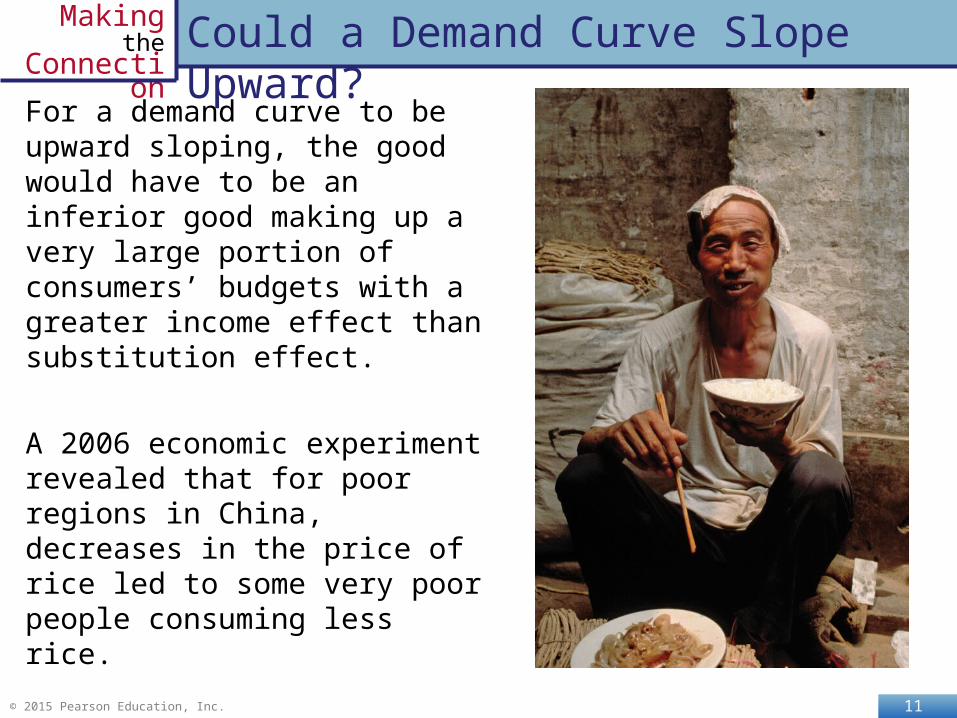
For a demand curve to be upward sloping, the good would have to be an inferior good making up a very large portion of consumers’ budgets with a greater income effect than substitution effect.
A 2006 economic experiment revealed that for poor regions in China, decreases in the price of rice led to some very poor people consuming less rice.
A good with an upward-sloping demand curve is known as a Giffen good.
12 © 2015 Pearson Education, Inc.
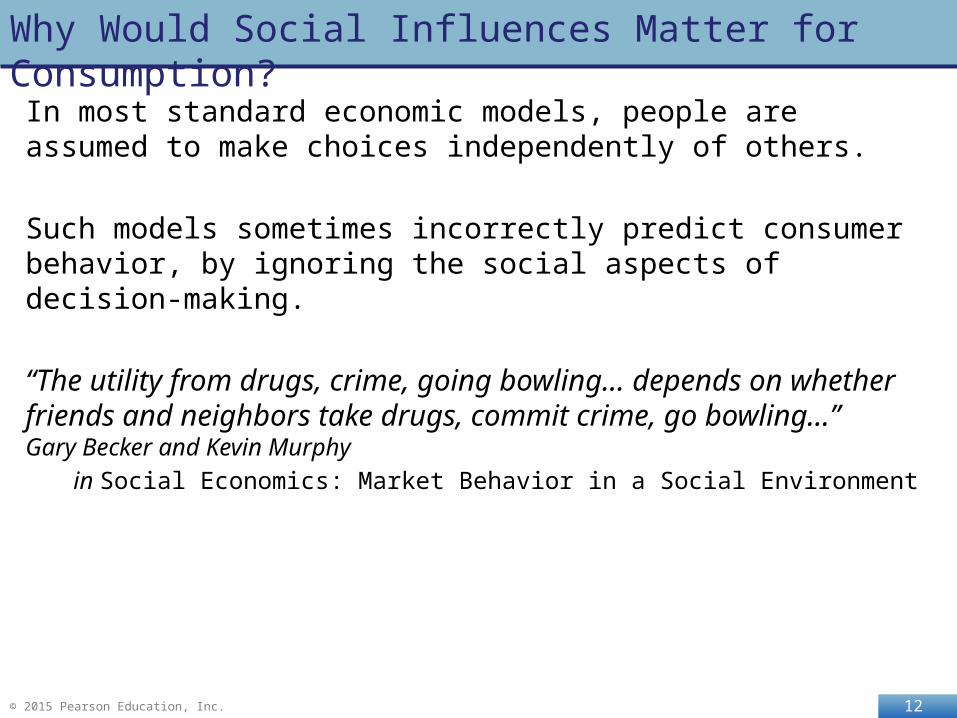
Why Would Social Influences Matter for Consumption?
In most standard economic models, people are assumed to make choices independently of others.
Such models sometimes incorrectly predict consumer behavior, by ignoring the social aspects of decision-making.
“The utility from drugs, crime, going bowling… depends on whether friends and neighbors take drugs, commit crime, go bowling…”Gary Becker and Kevin Murphy
in Social Economics: Market Behavior in a Social Environment
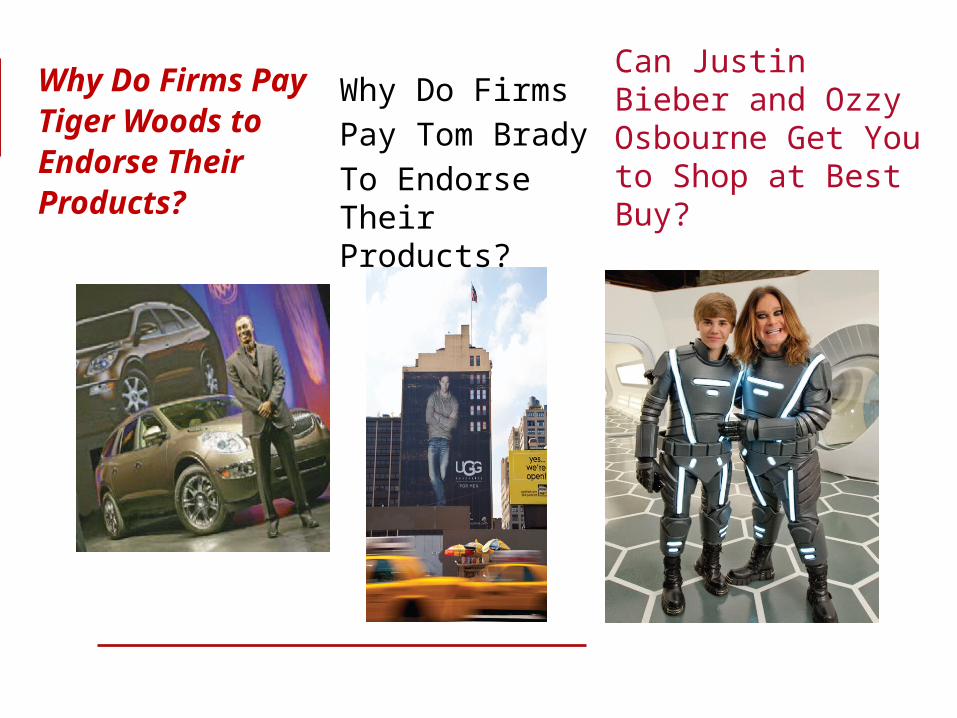
Why Do Firms Pay Tiger Woods to Endorse Their Products?
Can Justin Bieber and Ozzy Osbourne Get You to Shop at Best Buy?
Why Do Firms
Pay Tom Brady
To Endorse Their Products?
14 © 2015 Pearson Education, Inc.
Examples of Social Influences on Demand
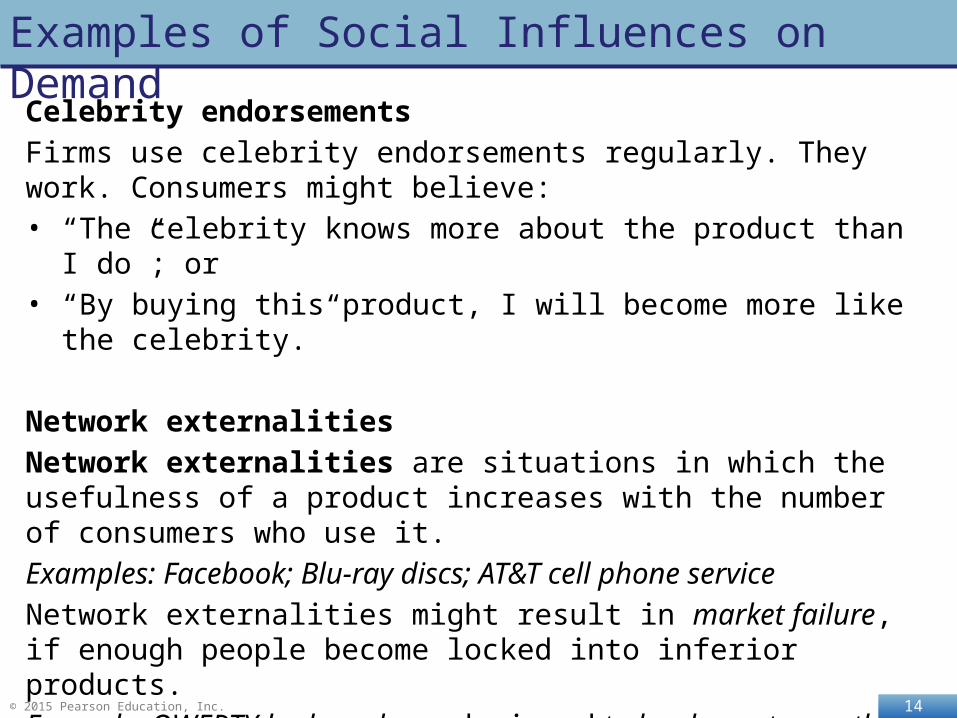
Celebrity endorsements
Firms use celebrity endorsements regularly. They work. Consumers might believe:• “The celebrity knows more about the product than I do”; or• “By buying this product, I will become more like the celebrity.”
Network externalities
Network externalities are situations in which the usefulness of a product increases with the number of consumers who use it.
Examples: Facebook; Blu-ray discs; AT&T cell phone service
Network externalities might result in market failure, if enough people become locked into inferior products.
Example: QWERTY keyboards are designed to be slower to use than alternatives, but almost all keyboards are QWERTY now.
15 © 2015 Pearson Education, Inc.
Examples of Social Influences on Demand—cont.
Fairness
People like to be treated fairly, and prefer to treat each other fairly even if it is bad for them financially.
Example: People tend to tip their servers, even if they never plan to go back to the restaurant.
Businesses learn from this, and attempt to appear fair even when it will cost them profits.
Example: The NFL sells tickets to the Super Bowl at $850-$1250 (2013 prices); but these tickets get resold for much more.
Surveys reveal that NFL fans would consider it unfair if the NFL raised ticket prices; instead, fans believe the current system of randomly distributing tickets to applicants is fairer.
The NFL forgoes potential profit to avoid alienating fans.
16 © 2015 Pearson Education, Inc.
Testing Fairness in the Laboratory
Ultimatum game
Pairs are given a sum of money, say $100, to split.
Person A proposes a split of the money, say $75 for him, and $25 for person B.
If B accepts, each get the money. If B rejects, neither gets any.
Dictator game
Same game, except B cannot reject.
17 © 2015 Pearson Education, Inc.
Testing Fairness in the Laboratory—conclusions
The results from these laboratory games suggest that people strongly value fairness.
However it may be the perception of fairness that people value:• Subjects might be concerned about the experimenter or other
subjects thinking they were selfish, if they kept a large proportion for themselves.
• When subjects are asked to perform tasks to earn the money, they are more likely to keep as much as they believe they earned.
Conclusion: Care needs to be taken in interpreting artificial laboratory experiments.
18 © 2015 Pearson Education, Inc.
Makingthe
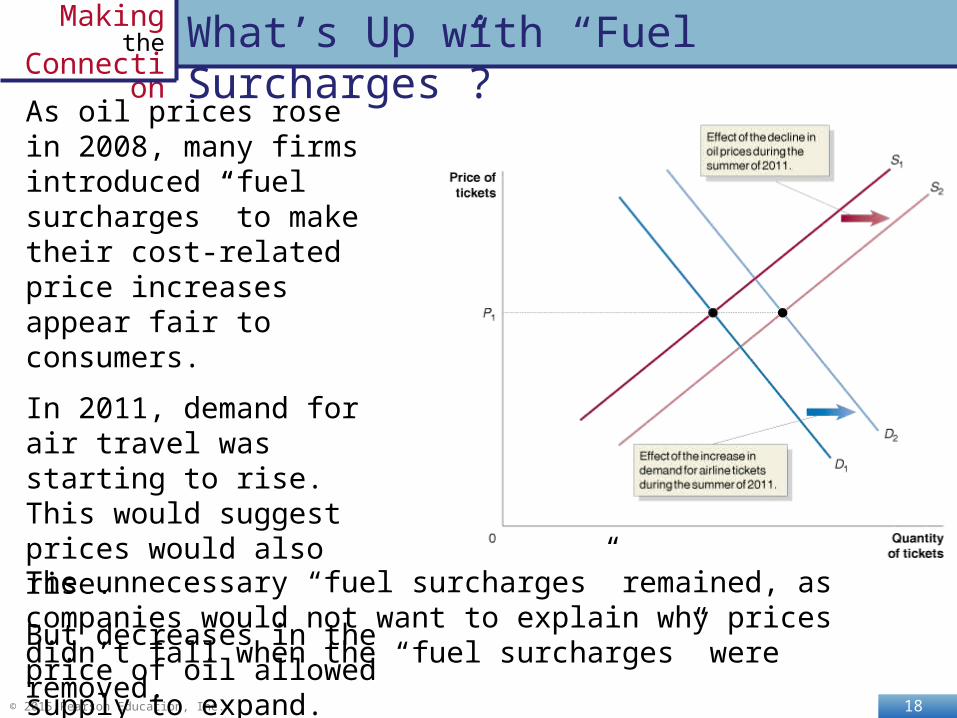
ConnectionWhat’s Up with “Fuel Surcharges”?
As oil prices rose in 2008, many firms introduced “fuel surcharges” to make their cost-related price increases appear fair to consumers.
In 2011, demand for air travel was starting to rise. This would suggest prices would also rise.
But decreases in the price of oil allowed supply to expand.
The unnecessary “fuel surcharges” remained, as companies would not want to explain why prices didn’t fall when the “fuel surcharges” were removed.
19 © 2015 Pearson Education, Inc.
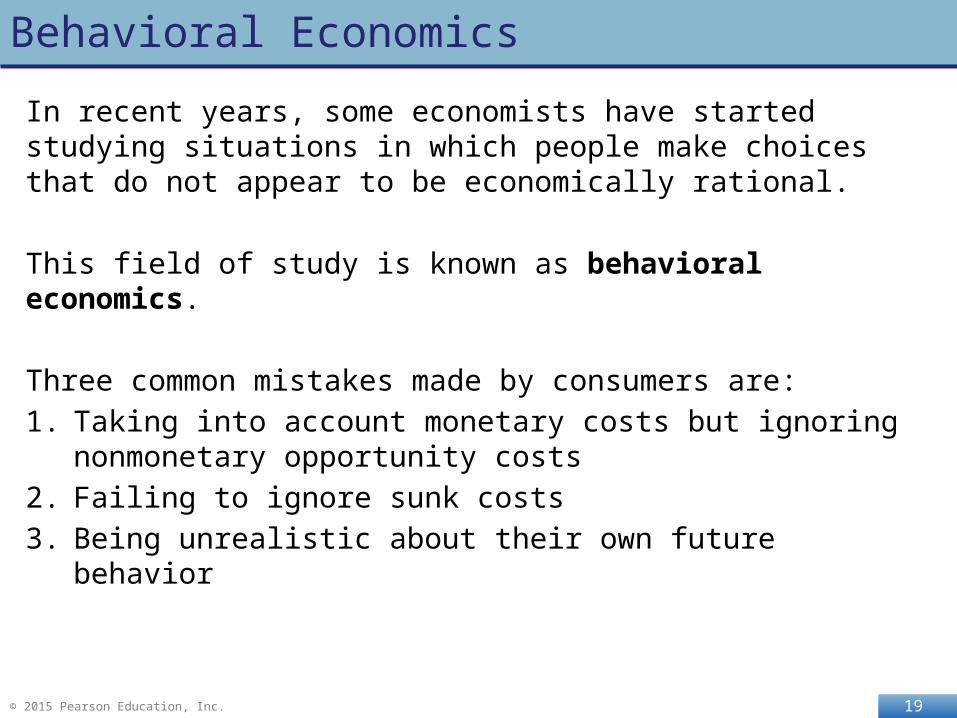
Behavioral Economics
In recent years, some economists have started studying situations in which people make choices that do not appear to be economically rational.
This field of study is known as behavioral economics.
Three common mistakes made by consumers are:
1. Taking into account monetary costs but ignoring nonmonetary opportunity costs
2. Failing to ignore sunk costs
3. Being unrealistic about their own future behavior
20 © 2015 Pearson Education, Inc.
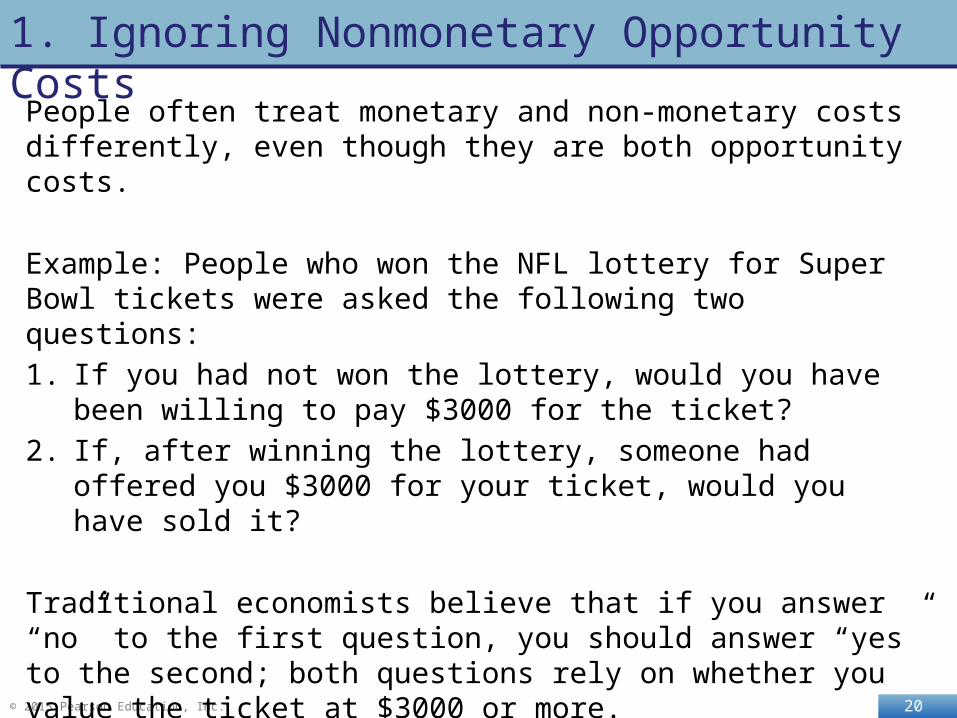
1. Ignoring Nonmonetary Opportunity Costs
People often treat monetary and non-monetary costs differently, even though they are both opportunity costs.
Example: People who won the NFL lottery for Super Bowl tickets were asked the following two questions:
1. If you had not won the lottery, would you have been willing to pay $3000 for the ticket?
2. If, after winning the lottery, someone had offered you $3000 for your ticket, would you have sold it?
Traditional economists believe that if you answer “no” to the first question, you should answer “yes” to the second; both questions rely on whether you value the ticket at $3000 or more.
21 © 2015 Pearson Education, Inc.
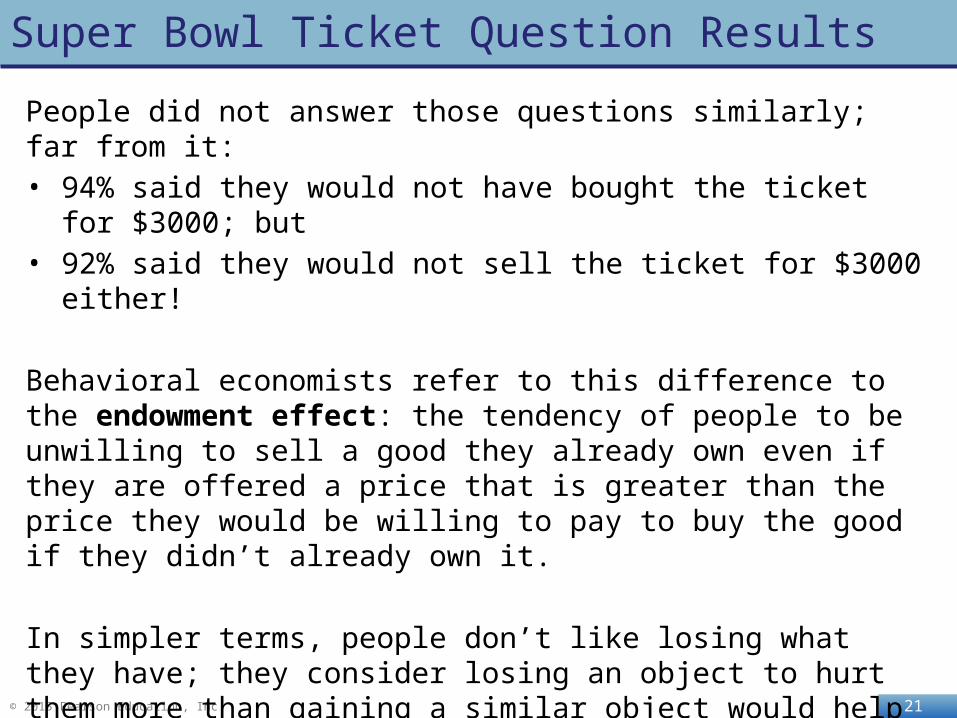
Super Bowl Ticket Question Results
People did not answer those questions similarly; far from it:• 94% said they would not have bought the ticket for $3000; but• 92% said they would not sell the ticket for $3000 either!
Behavioral economists refer to this difference to the endowment effect: the tendency of people to be unwilling to sell a good they already own even if they are offered a price that is greater than the price they would be willing to pay to buy the good if they didn’t already own it.
In simpler terms, people don’t like losing what they have; they consider losing an object to hurt them more than gaining a similar object would help them.
22 © 2015 Pearson Education, Inc.
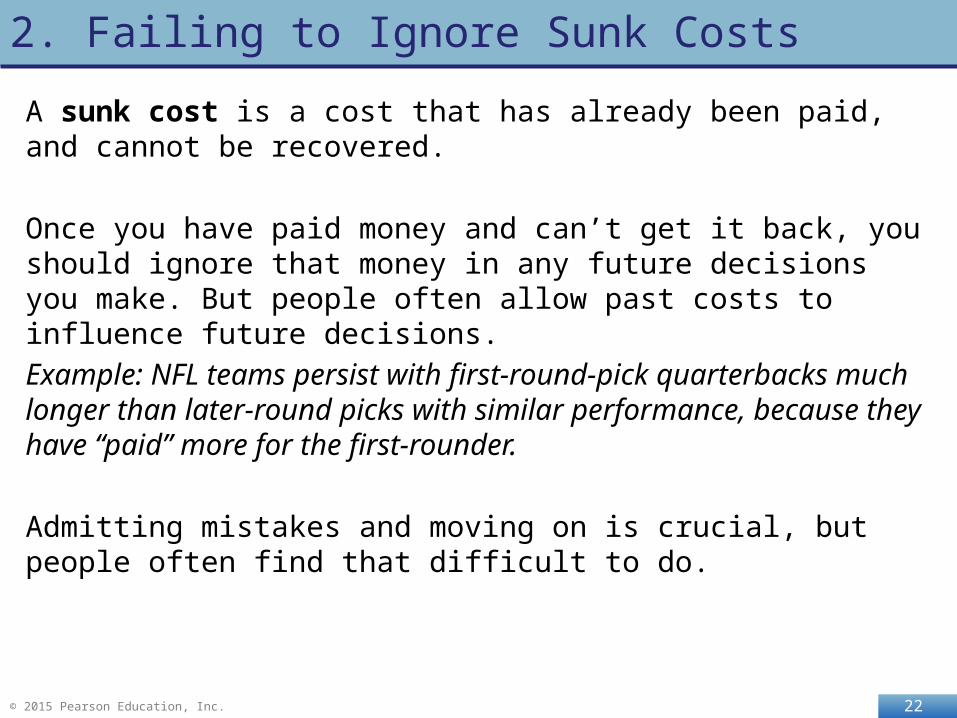
2. Failing to Ignore Sunk Costs
A sunk cost is a cost that has already been paid, and cannot be recovered.
Once you have paid money and can’t get it back, you should ignore that money in any future decisions you make. But people often allow past costs to influence future decisions.
Example: NFL teams persist with first-round-pick quarterbacks much longer than later-round picks with similar performance, because they have “paid” more for the first-rounder.
Admitting mistakes and moving on is crucial, but people often find that difficult to do.
23 © 2015 Pearson Education, Inc.
Makingthe
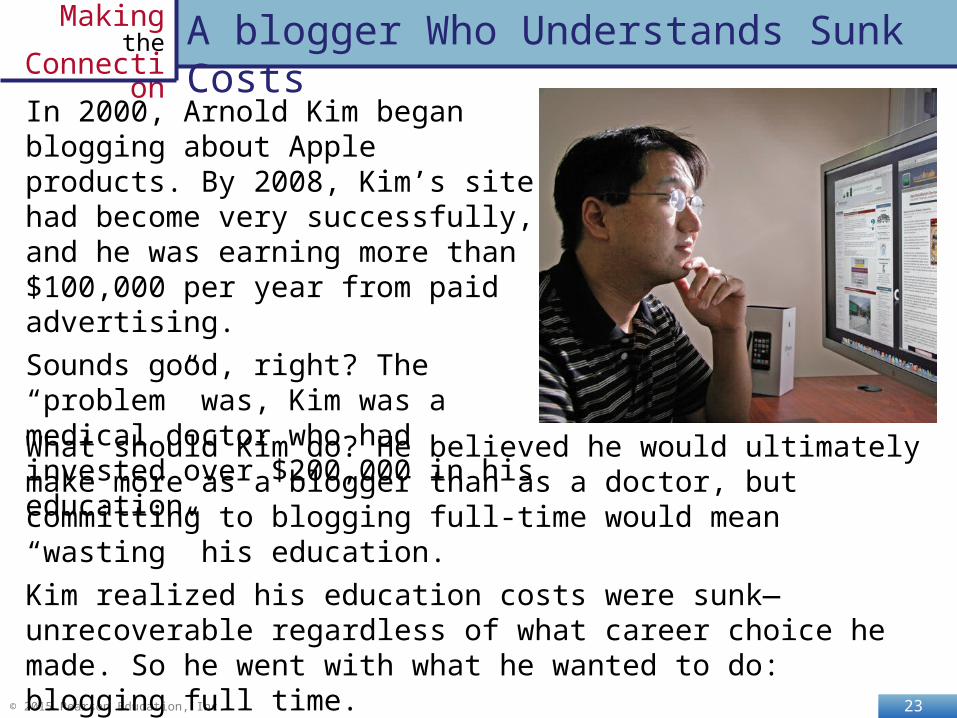
ConnectionA blogger Who Understands Sunk Costs
In 2000, Arnold Kim began blogging about Apple products. By 2008, Kim’s site had become very successfully, and he was earning more than $100,000 per year from paid advertising.
Sounds good, right? The “problem” was, Kim was a medical doctor who had invested over $200,000 in his education.
What should Kim do? He believed he would ultimately make more as a blogger than as a doctor, but committing to blogging full-time would mean “wasting” his education.
Kim realized his education costs were sunk—unrecoverable regardless of what career choice he made. So he went with what he wanted to do: blogging full time.
• Could you have made the same choice?
24 © 2015 Pearson Education, Inc.
3. Being Unrealistic about Future Behavior
People often make decisions that are inconsistent with their long-run intentions.
Example: In 2010, 69% of smokers reported wanting to quit, and 52% actually attempted to quit. But despite their intentions, few actually quit; they found it hard to control their future behavior.
Have you ever intended to quit a bad behavior or start a new good behavior, and failed? You likely believed that you would be able to carry through with your intentions.
25 © 2015 Pearson Education, Inc.
Is Our Theory Useless?
Our theory of utility maximization suggests we should compare the marginal utility per dollar spent on every item we buy.
But when you go grocery shopping, buying dozens of items, would you really do this? Likely, no.
Does this invalidate our theory? Traditional economists often answer “no”, because:
1. Unrealistic assumptions are necessary to simplify complex decision making problems, in order to focus on the most important factors.
2. Models are best judged by the success of their predictions, rather than the accuracy of their assumptions.
Indeed, models like our standard one are quite successful in predicting many types of consumer behavior.
26 © 2015 Pearson Education, Inc.
The Behavioral Economics of Shopping
Behavioral economists say that it does matter that consumers do not usually make “optimal” consumption choices.
• They believe modeling how people actually make decisions is important.
Some important “irrational” consumption behaviors include:
Rules of Thumb
• Making general rules that often, but not always, produce optimal results
• This can save on decision-making time
Anchoring
• “Irrelevant” information can often influence behavior.
• Example: posting “limit 10 items per customer” will often induce people to buy 10 items, even they would have bought fewer without the sign
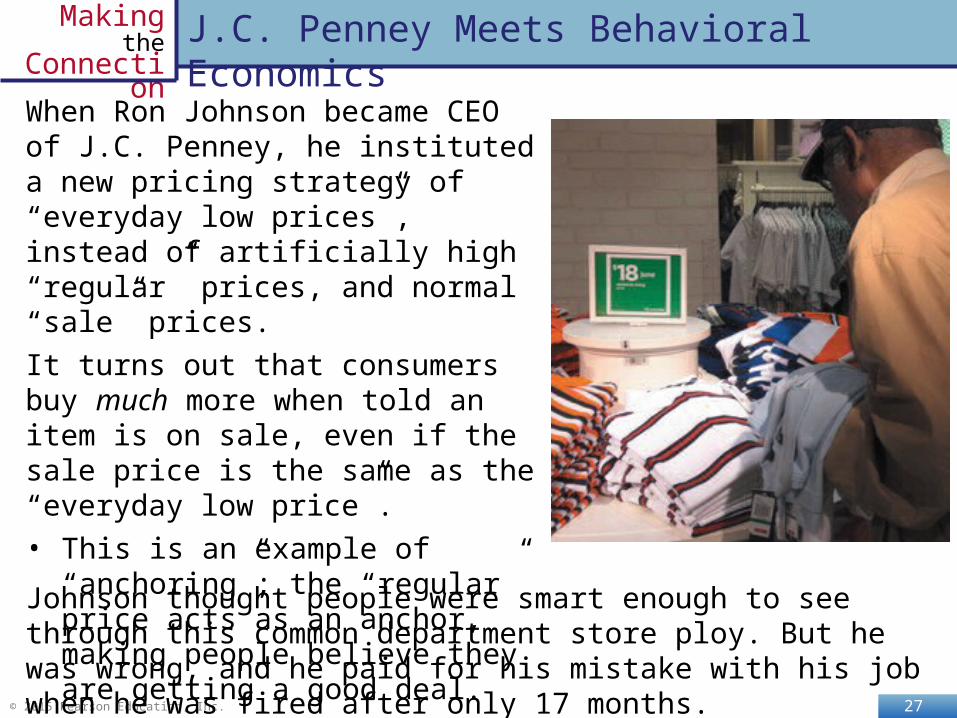
27 © 2015 Pearson Education, Inc.
Makingthe
ConnectionJ.C. Penney Meets Behavioral Economics
When Ron Johnson became CEO of J.C. Penney, he instituted a new pricing strategy of “everyday low prices”, instead of artificially high “regular” prices, and normal “sale” prices.
It turns out that consumers buy much more when told an item is on sale, even if the sale price is the same as the “everyday low price”.
• This is an example of “anchoring”; the “regular” price acts as an anchor, making people believe they are getting a good deal.
Johnson thought people were smart enough to see through this common department store ploy. But he was wrong, and he paid for his mistake with his job when he was fired after only 17 months.