Embed Size (px)
Citation preview

1
22 February 2007
Sir Ian RobinsonChairman
2
Rosemary ThorneGroup Finance Director
3
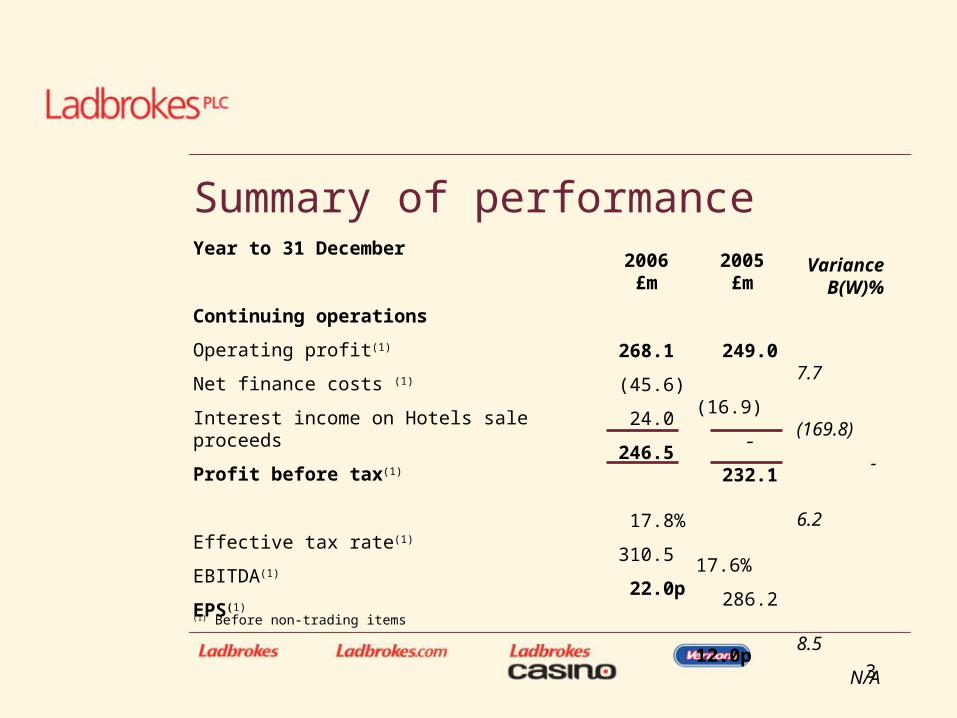
Continuing operations
Operating profit(1)
Net finance costs (1)
Interest income on Hotels sale proceeds
Profit before tax(1)
Effective tax rate(1)
EBITDA(1)
EPS(1)
Year to 31 December
Summary of performance
(1) Before non-trading items
2006£m
268.1
(45.6)
24.0
246.5
17.8%
310.5
22.0p
2005£m
249.0
(16.9)
-
232.1
17.6%
286.2
12.0p
Variance B(W)%
7.7
(169.8)
-
6.2
8.5
N/A

4
UK Retail
Ireland & Belgium
eGaming
Telephone Betting
Vernons
Central Costs
Total
Year to 31 December
Betting and Gaming
2006£m
715.8
84.0
144.4
46.1
18.6
-
1,008.9
2005£m
683.6
71.0
123.1
21.0
19.3
-
918.0
2006£m
195.4
17.3
47.0
17.7
5.9
(15.2)
268.1
2005£m
207.8
11.7
41.4
(0.1)
5.8
(17.6)
249.0
VarianceB(W)%
(6.0%)
47.9%
13.5%
n/a
1.7%
13.6%
7.7%
Gross Win Operating Profit
VarianceB(W)%
4.7%
18.3%
17.3%
119.5%
(3.6)%
9.9%

5
OTC gross win
Machines gross win
Total gross win
Adjustments to gross win (1)
Net revenue
Gross profits tax
Staff costs
Property costs (2)
Content costs (3)
Other costs (inc. depn and FOBT tax) (4)
Operating profit
Year to 31 December
UK Retail – Results
(1) Fair value adjustments, VAT, associate income(2) Rent, rates and utilities
2006£m
510.5
205.3
715.8
(27.9)
687.9
(75.0)
(183.7)
(89.1)
(58.6)
(86.1)
195.4
2005£m
484.5
199.1
683.6
(2.0)
681.6
(96.9)
(171.4)
(78.2)
(53.4)
(73.9)
207.8
VarianceB(W)%
5.4
3.1
4.7
0.9
22.6
(7.2)
(13.9)
(9.7)
(16.5)
(6.0)(3) Pictures, data, levy, Sky(4) Depreciation = £34.7m (2005: £29.8m), FOBT tax = £5.6m (2005:£nil)

6
Like for like Total gross win growth
Like for like OTC gross win growth
Like for like machines gross win growth
OTC margin
Like for like total costs (1) increase
Like for like shop staff costs increase
Stake per slip (2)
Average number of FOBTs
Average weekly gross win per FOBT
Year to 31 December
UK Retail – KPIs
(1) Excludes VAT, Gross profits tax and FOBT tax
2006
0.8%
1.1%
0.1%
16.9%
4%
2.9%
£8.39
6,743
£538
2005
0.4%
(2.3)%
7.7%
16.1%
5%
7.3%
£8.47
6,403
£545
Variance B(W)%
(0.9)
5.3
(1.3)
(2) Slips exclude machines
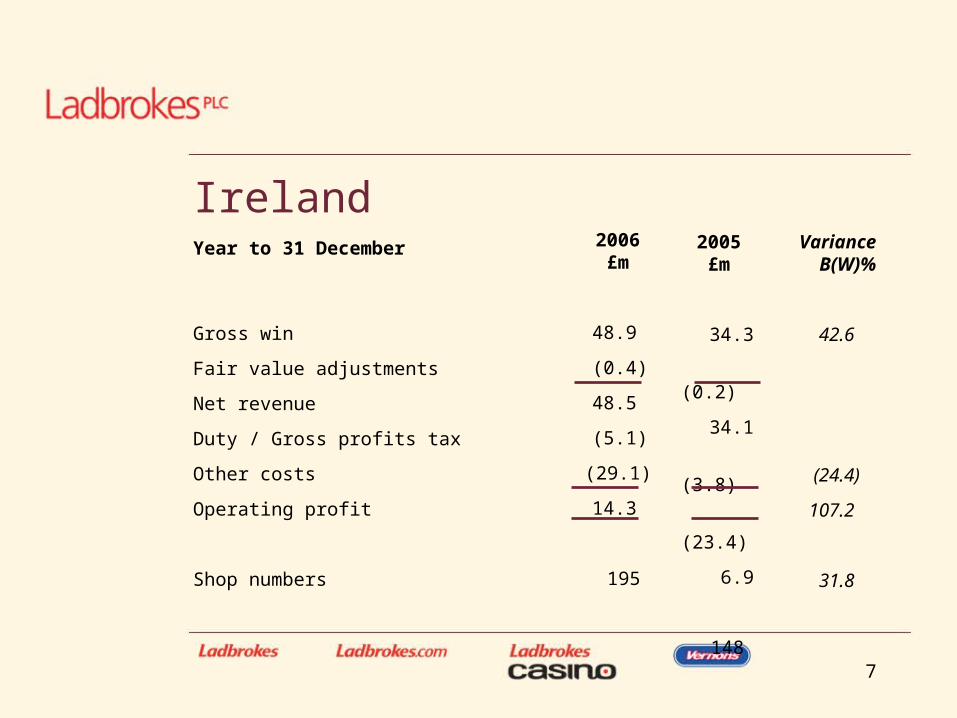
7
Gross win
Fair value adjustments
Net revenue
Duty / Gross profits tax
Other costs
Operating profit
Shop numbers
Year to 31 December
Ireland2006£m
48.9
(0.4)
48.5
(5.1)
(29.1)
14.3
195
2005£m
34.3
(0.2)
34.1
(3.8)
(23.4)
6.9
148
VarianceB(W)%
42.6
(24.4)
107.2
31.8

8
Sportsbook
Poker
Casino
Games
Gross Win
Year to 31 December
eGaming – Gross win2006
£m
46.4
40.3
44.7
13.0
144.4
2005£m
33.0
41.4
39.1
9.6
123.1
VarianceB(W)%
40.6
(2.7)
14.3
35.4
17.3

9
Gross win
Fair value adjustments (1)
Net revenue
Gross profits tax
Levy
Staff costs
Software & geographical partners (2)
Marketing (inc. affiliates)
Banking and chargebacks
Other costs (inc. depn)
Operating profit
eGaming – Results2006£m
144.4
(10.3)
134.1
(6.9)
(2.1)
(11.0)
(29.0)
(17.3)
(7.8)
(13.0)
47.0
%age of net
revenue
5.1
1.6
8.2
21.6
12.9
5.8
9.7
35.0
VarianceB(W)%
17.3
15.4
13.5
2005£m
123.1
(6.9)
116.2
(5.8)
(1.5)
(10.2)
(26.9)
(14.2)
(5.3)
(10.9)
41.4
Year to 31 December%age of
net revenue
5.0
1.3
8.8
23.1
12.2
4.6
9.4
35.6(1) Adjustments for free bets, promotions and bonuses (2) Payments to third party software and platform providers and
geographical partners
10
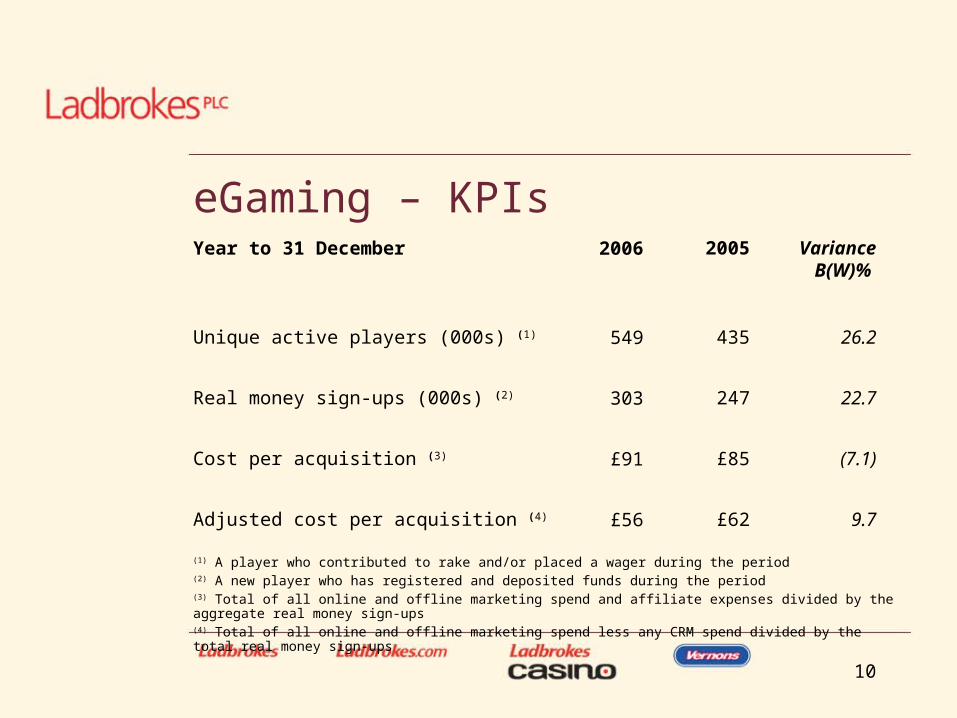
Unique active players (000s) (1)
Real money sign-ups (000s) (2)
Cost per acquisition (3)
Adjusted cost per acquisition (4)
Year to 31 December
eGaming – KPIs2006
549
303
£91
£56
2005
435
247
£85
£62
VarianceB(W)%
26.2
22.7
(7.1)
9.7
(1) A player who contributed to rake and/or placed a wager during the period(2) A new player who has registered and deposited funds during the period(3) Total of all online and offline marketing spend and affiliate expenses divided by the aggregate real money sign-ups(4) Total of all online and offline marketing spend less any CRM spend divided by the total real money sign-ups
11
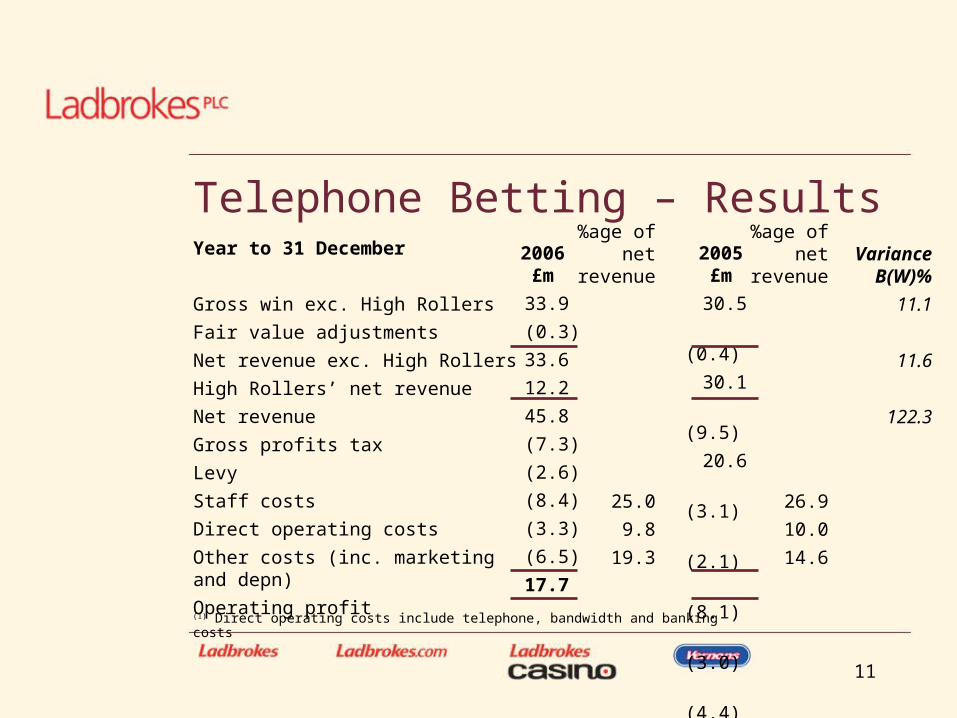
Gross win exc. High Rollers
Fair value adjustments
Net revenue exc. High Rollers
High Rollers’ net revenue
Net revenue
Gross profits tax
Levy
Staff costs
Direct operating costs
Other costs (inc. marketing and depn)
Operating profit
Telephone Betting – Results2006£m
33.9
(0.3)
33.6
12.2
45.8
(7.3)
(2.6)
(8.4)
(3.3)
(6.5)
17.7
%age of net
revenue
25.0
9.8
19.3
VarianceB(W)%
11.1
11.6
122.3
2005£m
30.5
(0.4)
30.1
(9.5)
20.6
(3.1)
(2.1)
(8.1)
(3.0)
(4.4)
(0.1)
Year to 31 December%age of
net revenue
26.9
10.0
14.6
(1) Direct operating costs include telephone, bandwidth and banking costs
12
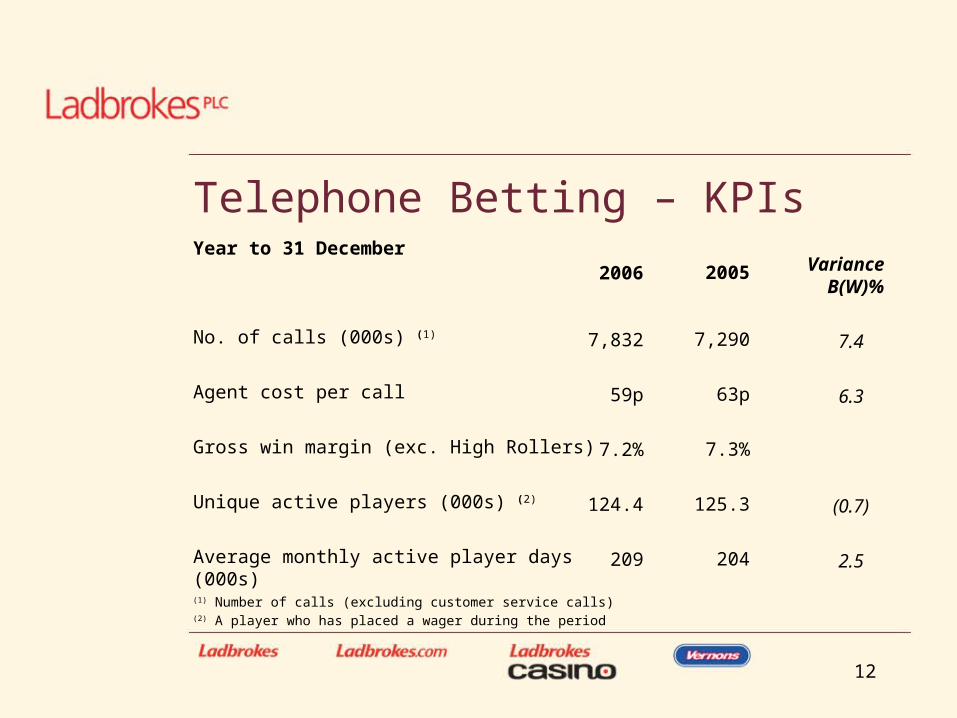
No. of calls (000s) (1)
Agent cost per call
Gross win margin (exc. High Rollers)
Unique active players (000s) (2)
Average monthly active player days (000s)
Year to 31 December
Telephone Betting – KPIs
2006
7,832
59p
7.2%
124.4
209
2005
7,290
63p
7.3%
125.3
204
VarianceB(W)%
7.4
6.3
(0.7)
2.5
(1) Number of calls (excluding customer service calls)(2) A player who has placed a wager during the period

13
CapexUK Development (1)
FOBTs and EPOS
Xtra
Ireland
Other (including IT: £8.0m; 2005 - £3.1m)
Retail
eGaming / Telephone Betting
Total
AcquisitionsJack Brown
Other (UK: £2.1m, Ireland: £25.6m, Italy: £4.7m)
Year to 31 December
Analysis of 2006 capital expenditure2006
£m
38.8
15.7
6.3
3.7
17.8
82.3
5.1
87.4
-
32.4
119.8
2005£m
37.7
-
4.1
3.2
11.1
56.1
4.1
60.2
80.3
44.5
185.0(1) Development = new licences, relocations and refurbishments (inc. Jack Brown)

14
2006 gross win impacts
High Rollers
World Cup (1)
2007 incremental costs
FOBT tax (2)
Gambling Commission
Specific ItemsFY£m
(12)
(9)
(8)
(3)
H1£m
(13)
(5)
(7)
(1)
(1) Assumes 50% substitution(2) The incremental cost expected in 2007 over 2006
15
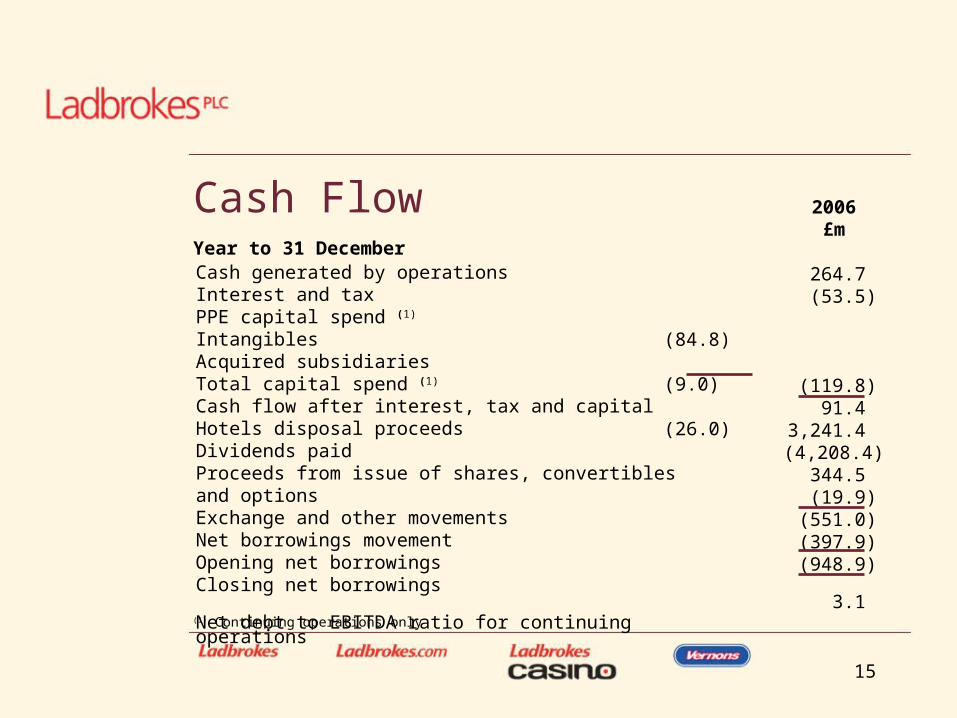
Cash generated by operationsInterest and taxPPE capital spend (1)
IntangiblesAcquired subsidiariesTotal capital spend (1)
Cash flow after interest, tax and capitalHotels disposal proceedsDividends paidProceeds from issue of shares, convertibles and optionsExchange and other movementsNet borrowings movementOpening net borrowingsClosing net borrowings
Net debt to EBITDA ratio for continuing operations
Year to 31 December
Cash Flow
(84.8)(9.0)
(26.0)
2006£m
264.7(53.5)
(119.8)91.4
3,241.4(4,208.4)
344.5(19.9)
(551.0)(397.9)(948.9)
3.1(1) Continuing operations only

16
Christopher BellChief Executive

17
Overview• Good World Cup
• Continued eGaming growth
• Successful year with Telephone High Rollers

18
Agenda• 2006 performance
• Strategic overview, including:
– International progress
– Casino ambitions
• Current trading
19
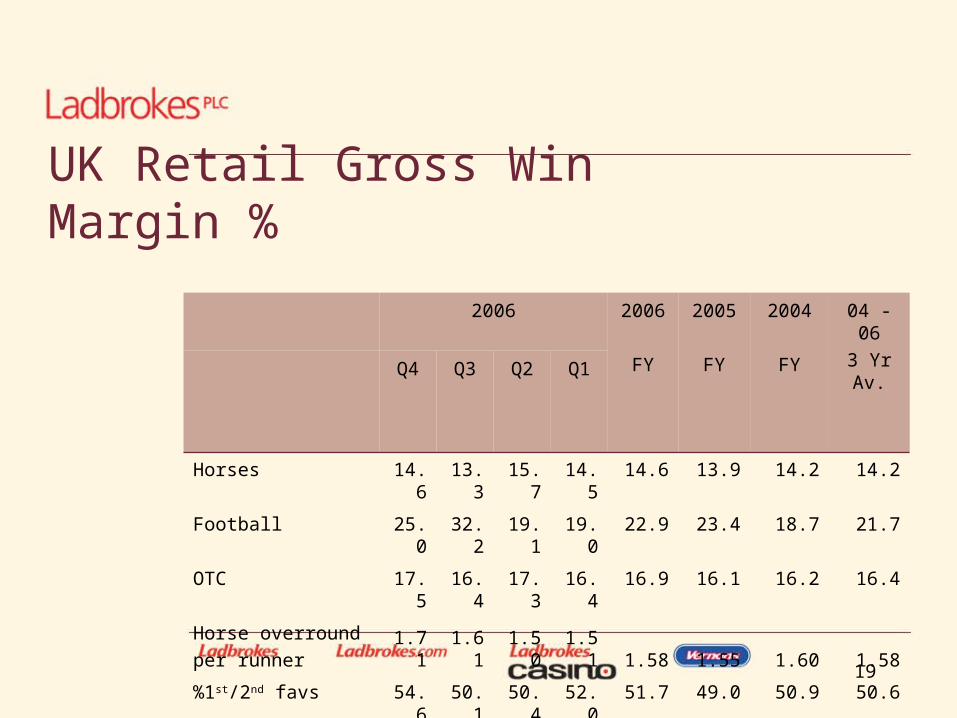
UK Retail Gross Win Margin %
2006 2006
FY
2005
FY
2004
FY
04 - 06
3 Yr Av.
Q4 Q3 Q2 Q1
Horses 14.6 13.3 15.7 14.5 14.6 13.9 14.2 14.2
Football 25.0 32.2 19.1 19.0 22.9 23.4 18.7 21.7
OTC 17.5 16.4 17.3 16.4 16.9 16.1 16.2 16.4
Horse overround
per runner 1.71 1.61 1.50 1.51 1.58 1.55 1.60 1.58
%1st/2nd favs 54.6 50.1 50.4 52.0 51.7 49.0 50.9 50.6

20
Retail EstateNumber of shops ’06 ’07
pipeline
Acquisitions 44 9
New licences 27 33
Relocations 91 42
Extensions 25 11
Refurbishments 67 17
Total 254 112

21
Shops• New Dual screen FOBT estate
• EPOS renewal completed by April
• Winter evening opening from September
• £500 Jackpot machines from September
• Self service terminals being tested
• Largest retail estate in Ireland
• No negative impact from Scottish smoking ban

22
eGaming• Continued organic growth
• Poker competitive but improvement in Q4
• Good year for Casino and Games
• Strong Sportsbook growth
• Growing global market enabled by broadband
• Turnaround for Telephone Betting

23
Strategy• Targeted shop investment
• Online expansion
• International expansion
• New UK Casino operation

24
International• Italy
– 3 shops at year end (now 4 shops)– 58 sports and 33 horseracing
licences– 51 in shop/café-bar kiosks– eGaming and Telephone Betting
licences– JV with Pianeta Scommesse – 200 outlets in the next 3 years

25
International• Spain
– Madrid first to regulate fixed odds betting
– Virtually a green field for fixed odds betting
– Large existing lottery, bingo, casino and slots market
– JV with market leading Cirsa Slot
26
International• Asia
– Vietnam• First time regulation of sports betting
expected in Q2
– China• Happy Pool single match betting shops• Shops in three provinces• JV with Asia Gaming Technologies
• Scandinavia– Acquisition of Sponsio

27
Casinos• Paddington Casino and Sports Bar
• Targeting to operate a number of the 17 new casinos
• Will bid for Manchester
28
Summary• Strong, highly motivated company
• World class brand, people and technology
• Continually evolving the Ladbrokes business
• Maintain future sustainability and grow earnings
29
Current Trading• Trading satisfactory to date
• Good football results
• More race cancellations than 2006
• eGaming performing strongly
• Telephone Betting in line with our expectations
• International plans on track, positive contribution in 2008

30
Q&As

31
Appendix

32
eGaming – Net revenue2006£m
2005£m
Variance% B(W)
Sportsbook 45.5 32.4 40.4
Poker 35.0 39.2 (10.7)
Casino 41.0 35.2 16.5
Games 12.6 9.4 34.0
Net revenue 134.1 116.2 15.4
Year to 31 December

33
eGaming – KPIs
2006 2005Variance% B(W)
Year to 31 December Sportsbook Gross win margin 6.4% 6.8% Unique active players (000s) 398 305 30.5 Average monthly active player days (000s) 610 451 35.3 Yield per unique active player (£) (1) 114 106 7.5
Poker Unique active players (000s) 154 128 20.3 Average monthly active player days (000s) 461 411 12.2 Yield per unique active player (£) (1) 227 306 (25.8)
Casino Unique active players (000s) 90 77 16.9 Average monthly active player days (000s) 72 64 12.5 Yield per unique active player (£) (1) 454 455 (0.2)
Games Unique active players (000s) 126 78 61.5 Average monthly active player days (000s) 99 54 83.3 Yield per unique active player (£) (1) 100 120 (16.7)
(1) Net revenue per unique active player for the period
34
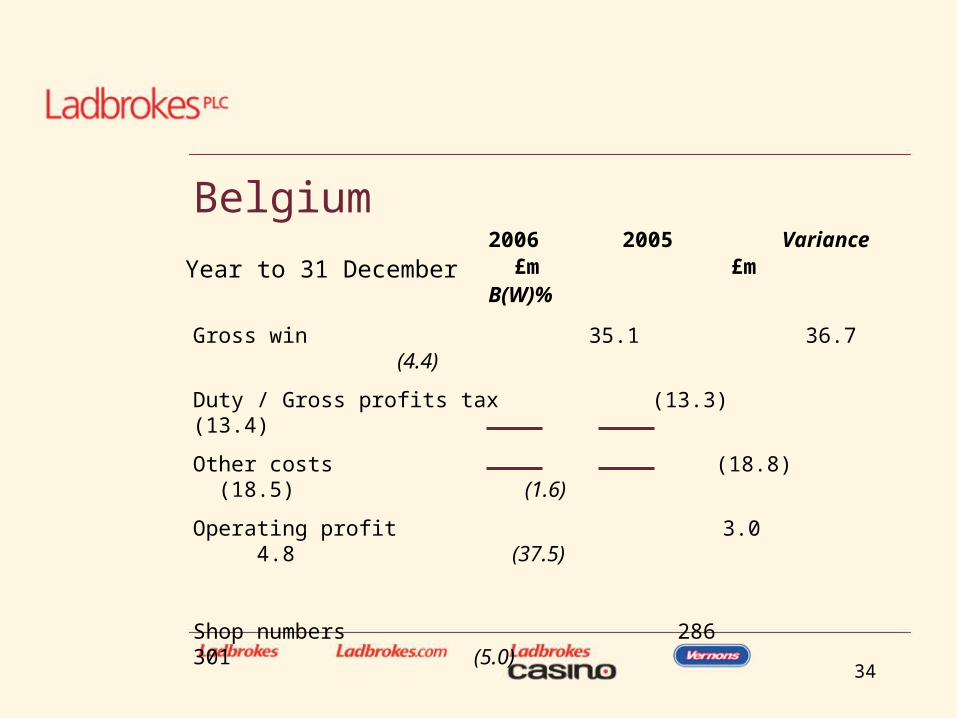
Belgium
Gross win 35.1 36.7 (4.4)
Duty / Gross profits tax (13.3) (13.4)
Other costs (18.8) (18.5) (1.6)
Operating profit 3.0 4.8 (37.5)
Shop numbers 286 301 (5.0)
Year to 31 December2006 2005 Variance £m £m B(W)%

35
Gross win / Net revenue 18.6 19.3 (3.6)
Duty / Gross profits tax (2.6) (2.8)
Other costs (10.1) (10.7) 5.6
Operating profit 5.9 5.8 1.7
Customer recruitment (000’s):
New customers 53 71 (25.4)
Reactivated customers 65 68 (4.4)
Vernons2006£m
2005£m
VarianceB(W)%
Year to 31 December
36
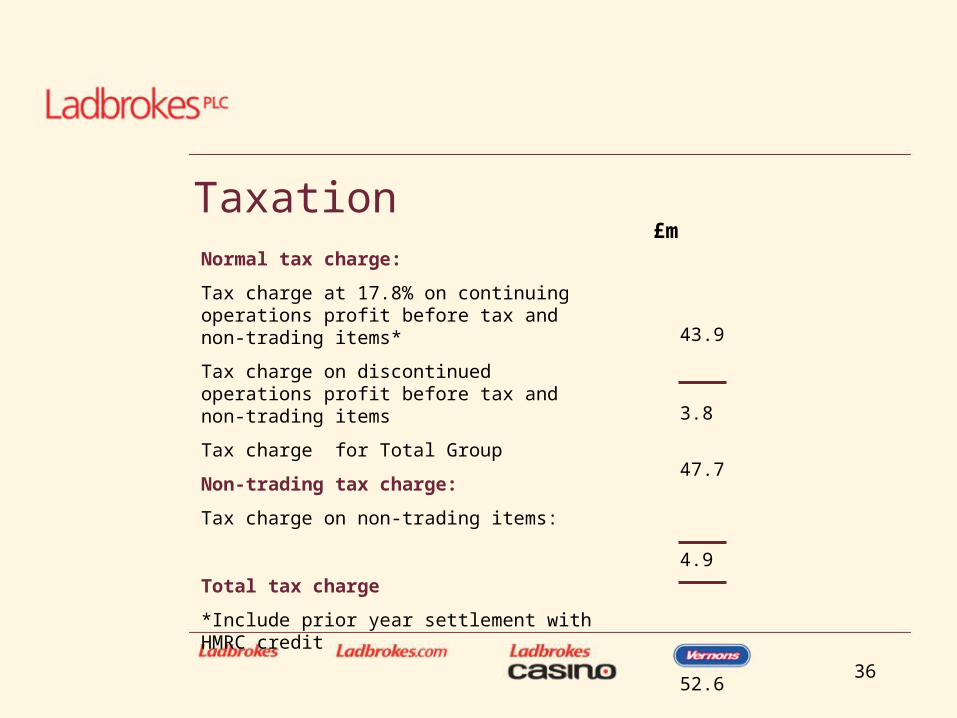
Taxation£m
Normal tax charge:
Tax charge at 17.8% on continuing operations profit before tax and non-trading items*
Tax charge on discontinued operations profit before tax and non-trading items
Tax charge for Total Group
Non-trading tax charge:
Tax charge on non-trading items:
Total tax charge
*Include prior year settlement with HMRC credit
43.9
3.8
47.7
4.9
52.6
37
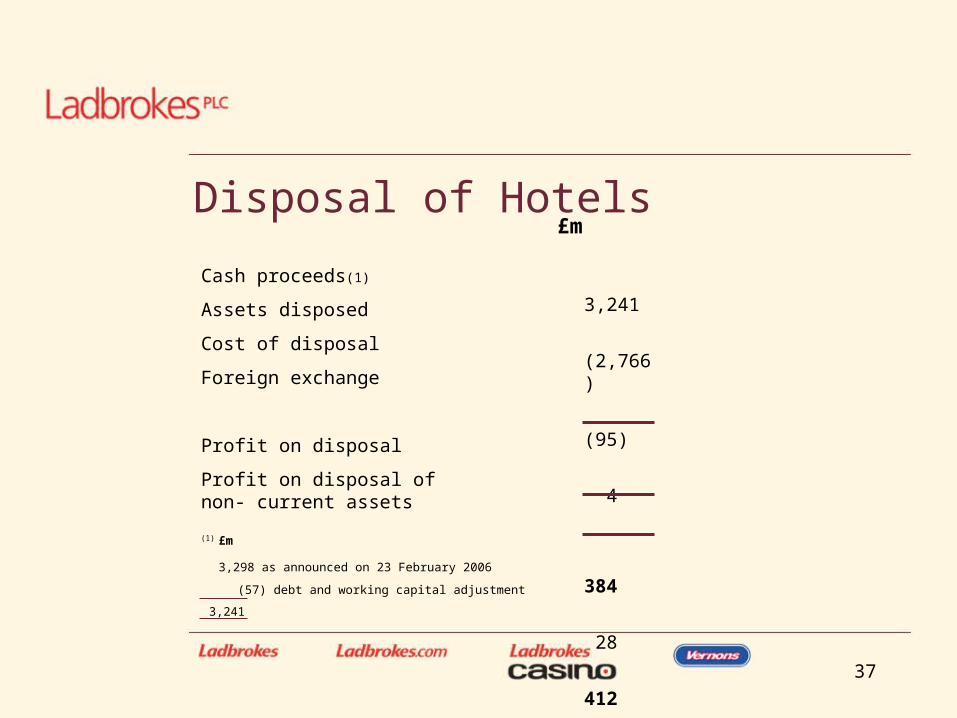
Disposal of Hotels£m
Cash proceeds(1)
Assets disposed
Cost of disposal
Foreign exchange
Profit on disposal
Profit on disposal of non- current assets
3,241
(2,766)
(95)
4
384
28
412£m
3,298 as announced on 23 February 2006
(57) debt and working capital adjustment
3,241
(1)
38
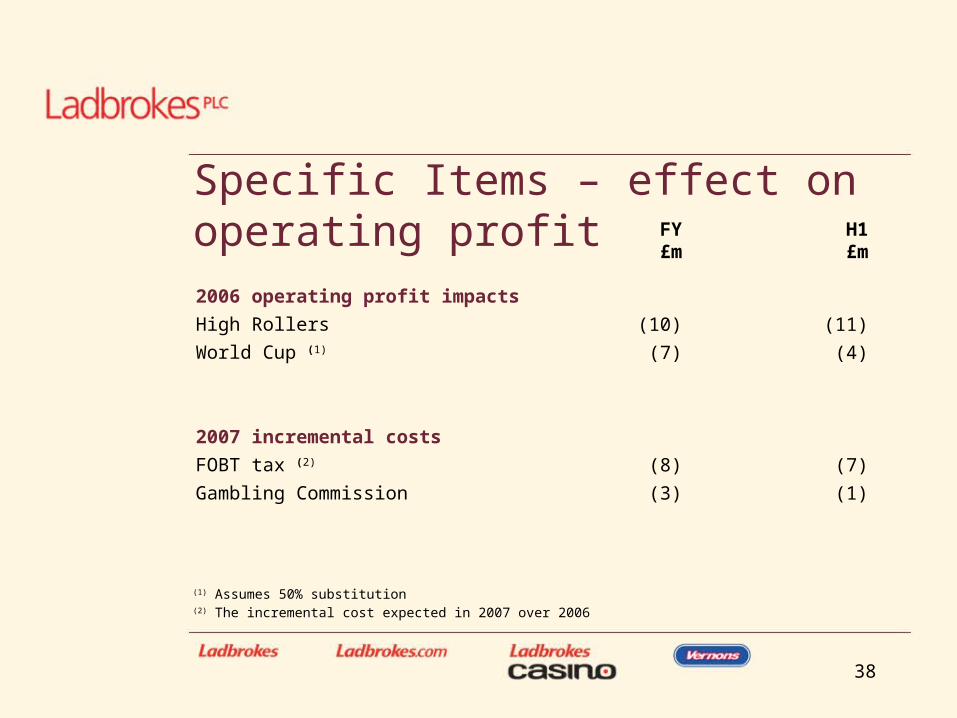
2006 operating profit impacts
High Rollers
World Cup (1)
2007 incremental costs
FOBT tax (2)
Gambling Commission
Specific Items – effect on operating profit FY
£m
(10)
(7)
(8)
(3)
H1£m
(11)
(4)
(7)
(1)
(1) Assumes 50% substitution(2) The incremental cost expected in 2007 over 2006