Embed Size (px)
Citation preview
1 A Description of Sample Data Sets Used in Further Chapters
1.1. A Description of Example Data Sets
The various data sets described here are used in various chapters of the book, but we thought it would be useful to describe the methodologies in a little more detail here. The actual data can be downloaded from the book Web site at http://www.uark.edu/ua/multivariate/index.htm.
1.1.1. White Corn Tortilla Chips
1.1.1.1. Introduction
This data set is used extensively as an example in Chapters 3, 4, 5, and 7. Additional details about these studies are published in Meullenet et al. 2002 and 2003. Households in the United States are very fond of salty snacks, including tortilla chips. According to Dies (2000), 76% of U.S. households purchase tortilla chips every 32 days. In 1996, tortilla and potato chips accounted for five of the top 10 products in the salty snack category (Anony-mous, 1998). In the United States, tortilla chips have a 20% market share of salty snack purchases, second only to potato chips (Lisser, 1993). In 1996, tortilla chips enjoyed their highest sales in 10 years and yellow tortilla chips gained in popularity (Wellman, 1997).
A few studies have been carried out for the evaluation of the sensory properties of tortilla chips. Buttery and Ling (1995, 1998) characterized the flavor volatiles of corn tortilla chips, whereas Hawrysh et al. (1995) examined the sensory and chemical stability of tortilla chips fried in canola oil, corn oil, and partially hydrogenated soybean oil. Stinson and Tomassetti (1995) showed that the flavor and texture acceptability of low-fat tortilla chips increased when natural corn flavor was added. However, the consumer preference pattern of white corn tortilla chips is not yet clearly defined. This study was conducted to determine the preferences for tortilla chips and to quantify the specific sensory character-istics found in the tortilla chips presently on the market.
1.1.1.2. Samples
A broad range of 25 commercially available tortilla chips were purchased at local super-markets. The original group of tortilla chips, which included both yellow and white corn chips, was visually screened based on color, shape, and levels of salt and fat reported on the labels. Eleven commercially available toasted white corn tortilla chip products (Table 1.1) were selected for this study because white corn tortilla chips are more popular with consumers than yellow corn tortilla chips and there was a financial constraint for this project. Large bags of each of the 11 types of tortilla chips were purchased 1–2 days before testing. The samples were randomly coded with a three-digit number and stored to prevent fractioning of chips.
9
Multivariate and Probabilistic Analyses of Sensory Science ProblemsJean-François Meullenet, Rui Xiong, Christopher J. Findlay
Copyright © 2007 by Blackwell Publishing
COPYRIG
HTED M
ATERIAL

10 Chapter 1
The coded samples were presented to panelists on white plastic plates that were 6 inches in diameter. Approximately five or six large chips or six to eight bite-size chips were placed on each plate. Each bag of chips was immediately resealed using a bag clip to preserve freshness. Chips that were excessively fractured were discarded.
1.1.1.3. Descriptive Analysis
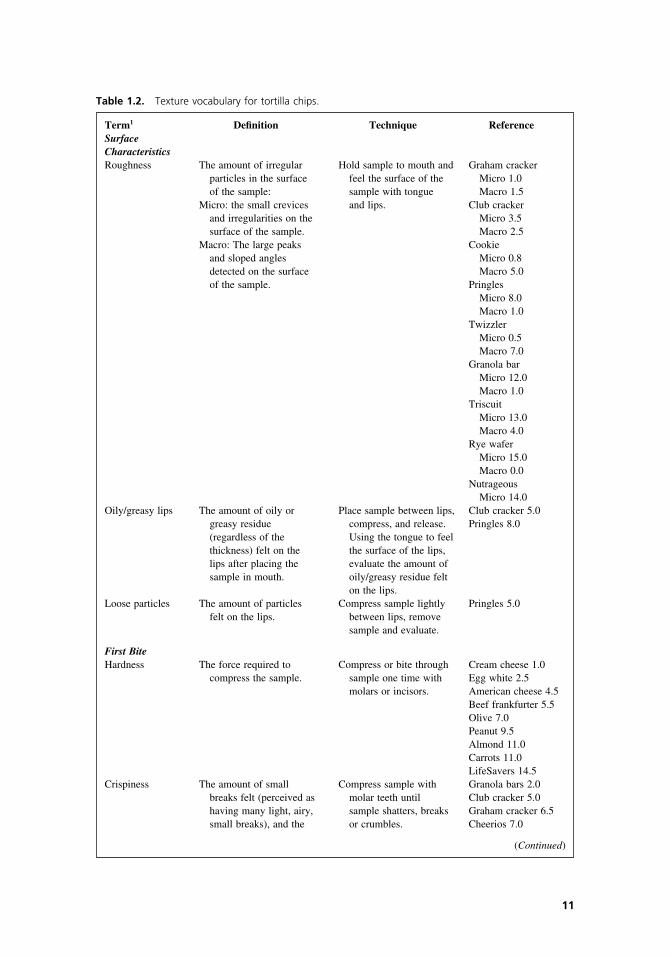
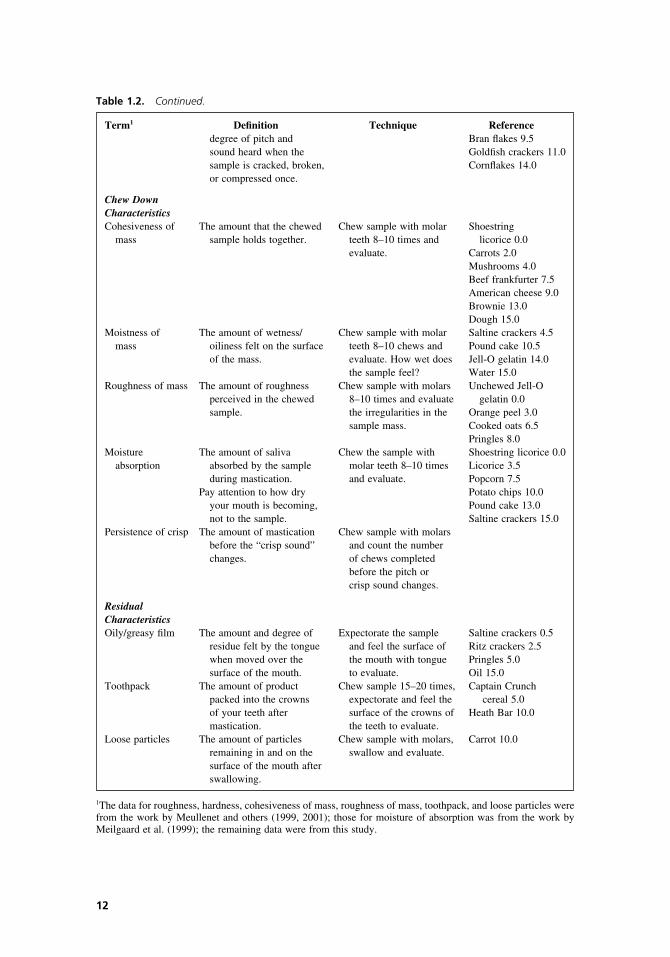
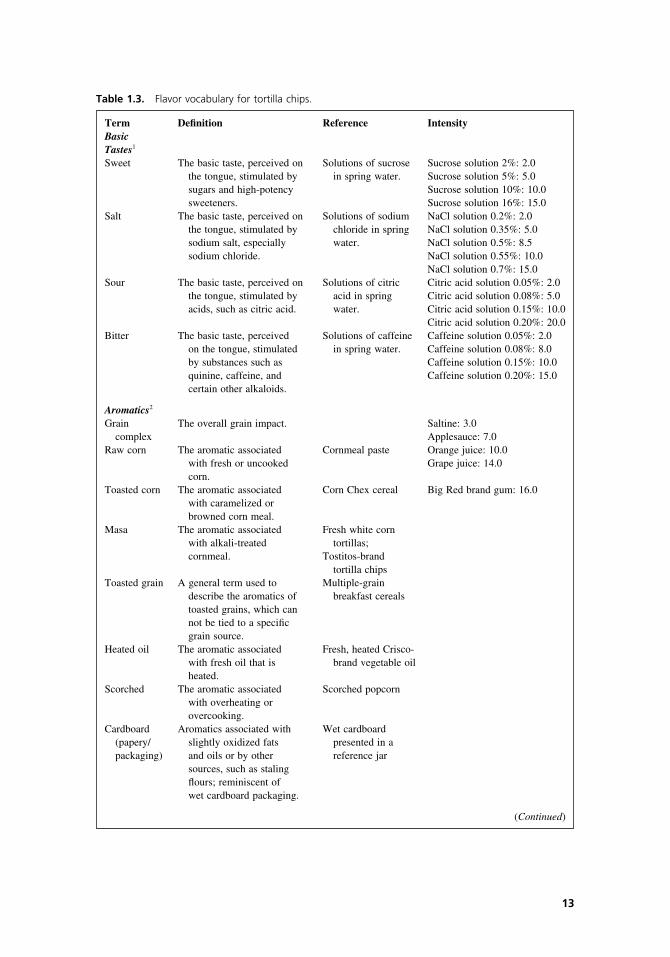
Eleven tortilla chip samples were evaluated for appearance, flavor, and texture by a group of nine Spectrum-trained panelists. Panel orientation was conducted to develop a descrip-tive lexicon for the appearance, flavor, and texture attributes specific to tortilla chips, using the Spectrum method (Sensory Spectrum Inc., Chatham, NJ). References used for panel orientation and lexicon development are presented in Tables 1.2, 1.3, and 1.4. The panel orientation on tortilla chip texture, flavor, and appearance was conducted over three 3-hour sessions. The texture ballot analyzed four major categories of product texture characteristics—surface, first bite, chew down, and residual—for a total of 15 texture attributes (Table 1.2). The flavor, basic taste, aromatics, feeling factors, and aftertaste profiles consisted of 23 attributes (Table 1.3). The appearance ballot consisted of fiveattributes (Table 1.4).
Texture, flavor, and appearance evaluations were carried out under controlled condi-tions over two 3-hour sessions, two 2.5-hour sessions, and one 2-hour session, respec-tively. During each session, the samples were presented in a random order to each panelist (i.e., each panelists was assigned a different randomization scheme). The evaluation was performed in individual booths featuring controlled lighting and positive air pressure. Panelists were provided with a paper ballot, references, and crackers (Nabisco Premium Unsalted brand) and water for cleansing and rinsing their palates between each sample. A 10-minute break was scheduled during each session. The texture and flavor evaluations
Salt Content Fat ContentProduct Name Abbreviation Producer Shape (%)1 (%)1
Best Yet White BYW Fleming Triangle 4 12Corn Companies, Inc.
Green Mountain GMG Green Mountain Strip 5 13Gringo Gringo
Guy’s Restaurant GUY Guy’s Snack Foods Round 3 9Rounds
Medallion White MED Medallion Food Triangle 2 11Corn Corporation
Mission Strips MIS Mission Food Strip 4 10Corporation
Mission Triangle MIT Mission Food Triangle 4 10Corporation
Oak Creek OAK Oak Creek Round 2 11Farms—White FarmsCorn
Santita’s SAN Frito-Lay Triangle 5 8Tom’s White Corn TOM Tom’s Foods Inc. Triangle 5 10Tostito’s Bite Size TOB Frito-Lay Round 5 12Tostito’s TOR Frito-Lay Triangle 3 9
Restaurant Style
Table 1.1. Commercial pure white corn tortilla chip products.
1Expressed as percentage daily intake; percentage daily value is based on a 2000-calorie diet.
Term1 Definition Technique ReferenceSurfaceCharacteristicsRoughness The amount of irregular Hold sample to mouth and Graham cracker
particles in the surface feel the surface of the Micro 1.0of the sample: sample with tongue Macro 1.5
Micro: the small crevices and lips. Club crackerand irregularities on the Micro 3.5surface of the sample. Macro 2.5
Macro: The large peaks Cookieand sloped angles Micro 0.8detected on the surface Macro 5.0of the sample. Pringles
Micro 8.0Macro 1.0
TwizzlerMicro 0.5Macro 7.0
Granola barMicro 12.0Macro 1.0
TriscuitMicro 13.0Macro 4.0
Rye waferMicro 15.0Macro 0.0
NutrageousMicro 14.0
Oily/greasy lips The amount of oily or Place sample between lips, Club cracker 5.0greasy residue compress, and release. Pringles 8.0(regardless of the Using the tongue to feelthickness) felt on the the surface of the lips,lips after placing the evaluate the amount ofsample in mouth. oily/greasy residue felt
on the lips.Loose particles The amount of particles Compress sample lightly Pringles 5.0
felt on the lips. between lips, removesample and evaluate.
First BiteHardness The force required to Compress or bite through Cream cheese 1.0
compress the sample. sample one time with Egg white 2.5molars or incisors. American cheese 4.5
Beef frankfurter 5.5Olive 7.0Peanut 9.5Almond 11.0Carrots 11.0LifeSavers 14.5
Crispiness The amount of small Compress sample with Granola bars 2.0breaks felt (perceived as molar teeth until Club cracker 5.0having many light, airy, sample shatters, breaks Graham cracker 6.5small breaks), and the or crumbles. Cheerios 7.0
(Continued)
Table 1.2. Texture vocabulary for tortilla chips.
11
Term1 Definition Technique Referencedegree of pitch and Bran flakes 9.5sound heard when the Goldfish crackers 11.0sample is cracked, broken, Cornflakes 14.0or compressed once.
Chew DownCharacteristicsCohesiveness of The amount that the chewed Chew sample with molar Shoestring
mass sample holds together. teeth 8–10 times and licorice 0.0evaluate. Carrots 2.0
Mushrooms 4.0Beef frankfurter 7.5American cheese 9.0Brownie 13.0Dough 15.0
Moistness of The amount of wetness/ Chew sample with molar Saltine crackers 4.5mass oiliness felt on the surface teeth 8–10 chews and Pound cake 10.5
of the mass. evaluate. How wet does Jell-O gelatin 14.0the sample feel? Water 15.0
Roughness of mass The amount of roughness Chew sample with molars Unchewed Jell-Operceived in the chewed 8–10 times and evaluate gelatin 0.0sample. the irregularities in the Orange peel 3.0
sample mass. Cooked oats 6.5Pringles 8.0
Moisture The amount of saliva Chew the sample with Shoestring licorice 0.0absorption absorbed by the sample molar teeth 8–10 times Licorice 3.5
during mastication. and evaluate. Popcorn 7.5Pay attention to how dry Potato chips 10.0
your mouth is becoming, Pound cake 13.0not to the sample. Saltine crackers 15.0
Persistence of crisp The amount of mastication Chew sample with molarsbefore the “crisp sound” and count the numberchanges. of chews completed
before the pitch orcrisp sound changes.
ResidualCharacteristicsOily/greasy film The amount and degree of Expectorate the sample Saltine crackers 0.5
residue felt by the tongue and feel the surface of Ritz crackers 2.5when moved over the the mouth with tongue Pringles 5.0surface of the mouth. to evaluate. Oil 15.0
Toothpack The amount of product Chew sample 15–20 times, Captain Crunchpacked into the crowns expectorate and feel the cereal 5.0of your teeth after surface of the crowns of Heath Bar 10.0mastication. the teeth to evaluate.
Loose particles The amount of particles Chew sample with molars, Carrot 10.0remaining in and on the swallow and evaluate.surface of the mouth afterswallowing.
1The data for roughness, hardness, cohesiveness of mass, roughness of mass, toothpack, and loose particles were from the work by Meullenet and others (1999, 2001); those for moisture of absorption was from the work by Meilgaard et al. (1999); the remaining data were from this study.
Table 1.2. Continued.
12
13
Term Definition Reference IntensityBasicTastes1
Sweet The basic taste, perceived on Solutions of sucrose Sucrose solution 2%: 2.0the tongue, stimulated by in spring water. Sucrose solution 5%: 5.0sugars and high-potency Sucrose solution 10%: 10.0sweeteners. Sucrose solution 16%: 15.0
Salt The basic taste, perceived on Solutions of sodium NaCl solution 0.2%: 2.0the tongue, stimulated by chloride in spring NaCl solution 0.35%: 5.0sodium salt, especially water. NaCl solution 0.5%: 8.5sodium chloride. NaCl solution 0.55%: 10.0
NaCl solution 0.7%: 15.0Sour The basic taste, perceived on Solutions of citric Citric acid solution 0.05%: 2.0
the tongue, stimulated by acid in spring Citric acid solution 0.08%: 5.0acids, such as citric acid. water. Citric acid solution 0.15%: 10.0
Citric acid solution 0.20%: 20.0Bitter The basic taste, perceived Solutions of caffeine Caffeine solution 0.05%: 2.0
on the tongue, stimulated in spring water. Caffeine solution 0.08%: 8.0by substances such as Caffeine solution 0.15%: 10.0quinine, caffeine, and Caffeine solution 0.20%: 15.0certain other alkaloids.
Aromatics2
Grain The overall grain impact. Saltine: 3.0complex Applesauce: 7.0
Raw corn The aromatic associated Cornmeal paste Orange juice: 10.0with fresh or uncooked Grape juice: 14.0corn.
Toasted corn The aromatic associated Corn Chex cereal Big Red brand gum: 16.0with caramelized orbrowned corn meal.
Masa The aromatic associated Fresh white cornwith alkali-treated tortillas;cornmeal. Tostitos-brand
tortilla chipsToasted grain A general term used to Multiple-grain
describe the aromatics of breakfast cerealstoasted grains, which cannot be tied to a specifi cgrain source.
Heated oil The aromatic associated Fresh, heated Crisco-with fresh oil that is brand vegetable oilheated.
Scorched The aromatic associated Scorched popcornwith overheating orovercooking.
Cardboard Aromatics associated with Wet cardboard(papery/ slightly oxidized fats presented in apackaging) and oils or by other reference jar
sources, such as staling flours; reminiscent of
wet cardboard packaging.
(Continued)
Table 1.3. Flavor vocabulary for tortilla chips.
14 Chapter 1
Term Definition Reference IntensityFeelingFactors3
Astringent A chemical feeling factor Plain yogurt Plain yogurt: 3.5felt on the tongue orother surfaces of theoral cavity, described aspuckering/dry andassociated with tanninsor alums.
1The reference and intensity for basic taste was the one used by Meilgaard et al. (1999).2The reference and intensity for aromatics was a slightly modified version of the reference and intensity used by Meilgaard et al. (1999).3The reference and intensity for feeling factor was the one used by Meullenet et al. (2001).
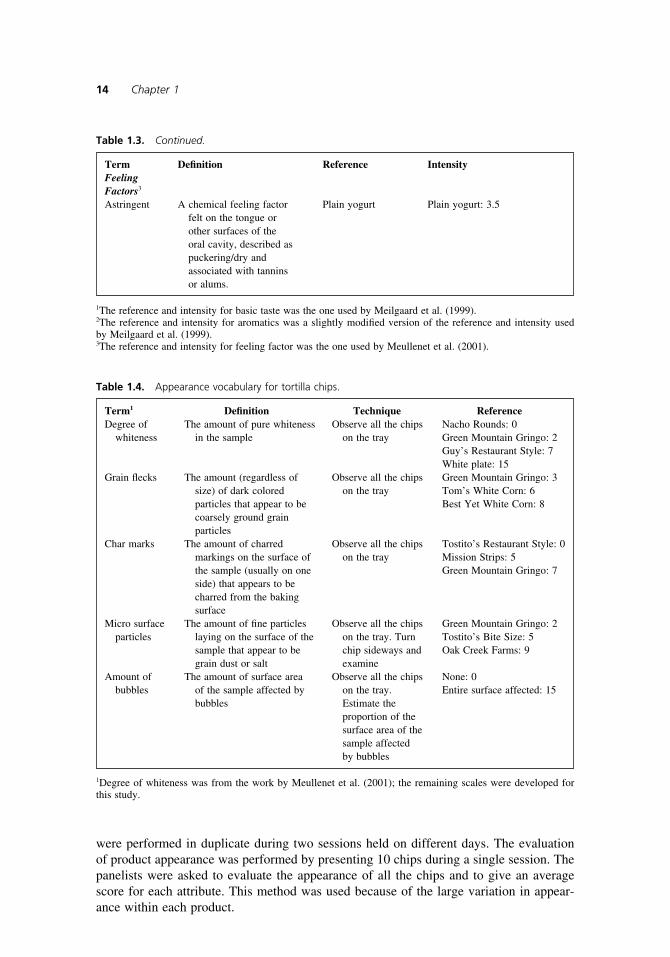
Table 1.3. Continued.
Term1 Definition Technique ReferenceDegree of The amount of pure whiteness Observe all the chips Nacho Rounds: 0
whiteness in the sample on the tray Green Mountain Gringo: 2Guy’s Restaurant Style: 7White plate: 15
Grain flecks The amount (regardless of Observe all the chips Green Mountain Gringo: 3size) of dark colored on the tray Tom’s White Corn: 6particles that appear to be Best Yet White Corn: 8coarsely ground grainparticles
Char marks The amount of charred Observe all the chips Tostito’s Restaurant Style: 0markings on the surface of on the tray Mission Strips: 5the sample (usually on one Green Mountain Gringo: 7side) that appears to becharred from the bakingsurface
Micro surface The amount of fine particles Observe all the chips Green Mountain Gringo: 2particles laying on the surface of the on the tray. Turn Tostito’s Bite Size: 5
sample that appear to be chip sideways and Oak Creek Farms: 9grain dust or salt examine
Amount of The amount of surface area Observe all the chips None: 0bubbles of the sample affected by on the tray. Entire surface affected: 15
bubbles Estimate theproportion of thesurface area of thesample affectedby bubbles
Table 1.4. Appearance vocabulary for tortilla chips.
1Degree of whiteness was from the work by Meullenet et al. (2001); the remaining scales were developed for this study.
were performed in duplicate during two sessions held on different days. The evaluation of product appearance was performed by presenting 10 chips during a single session. The panelists were asked to evaluate the appearance of all the chips and to give an average score for each attribute. This method was used because of the large variation in appear-ance within each product.
A Description of Example Data Sets Used in Further Chapters 15
1.1.1.4. Consumer Testing
Based on the work of Dies (2000), who reported that 76% of U.S. households purchase tortilla chips every 32 days, we assumed that 75% of the population in Northwest Arkansas consumes tortilla chip products on a regular basis. The minimum sample size necessary to obtain a representative sample of the population was calculated to be 73 consumers, using the formula Z p(1 − p)/Cp
2 (Rea and Parker, 1992; in this case, Z = 1.96, associ-ated with 95% confidence level, the proportion p = 0.75, and the confidence interval Cp
2 ≤10%). Because the consumer test was performed over a 2-day period, 80 consumers were selected in anticipation of second-day no shows.
The consumer panel was recruited by posting advertisements at local restaurants, grocery stores, supermarkets, and the university campus, requesting participation in a salty snack consumer taste. Consumers of these snack products between the ages of 18 and 35 years who were interested in participating were asked to call a number given on the advertisements. A phone screener was used to determine whether the caller consumed tortilla chips on a regular basis, which was considered to be every 2 weeks, or twice a month. Eighty tortilla chip consumers were selected and scheduled for the 2-day test. A $20 gift card was offered as an incentive and was paid on completion of the test.
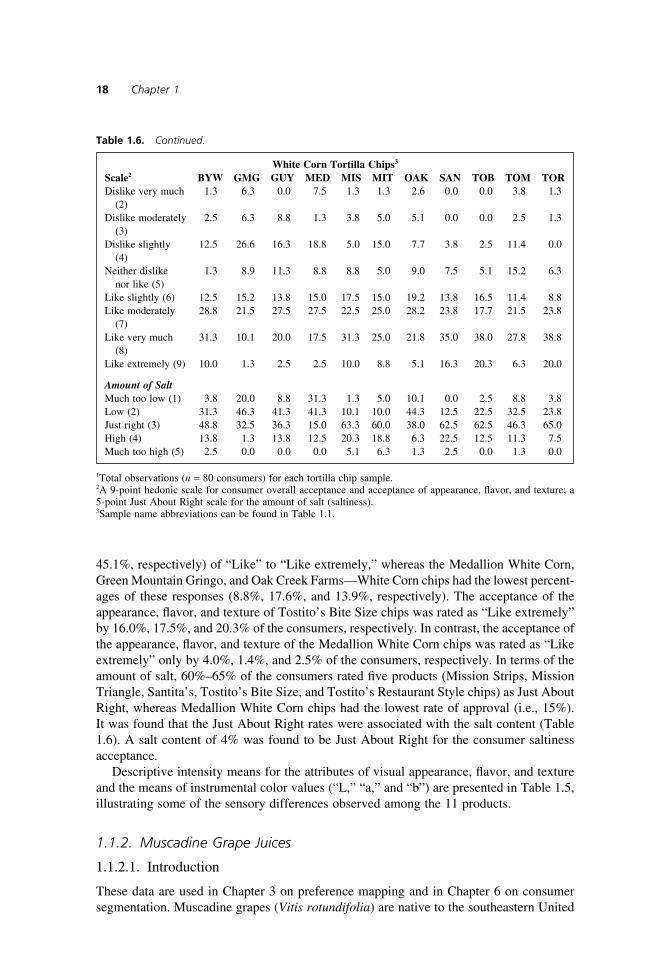
A completely randomized design was used across the 11 samples for the 80 consum-ers (Meilgaard et al., 1999). The 2-day consumer test was carried out at the University of Arkansas Sensory Laboratories. Each consumer was seated in an individual testing booth with controlled lighting and positive airflow and was presented with five and six tortilla chip samples on the first and second days of the test, respectively. The consumers were provided with five or six large chips or from six to eight bite-size chips for each sample, presented on 6-inch-diameter coded white plastic plates. Each sample was assigned a three-digit code to be entered by consumers on the ballot as a means of identifying the sample. Each consumer was asked to evaluate the appearance, overall impression, flavor,and texture of each sample on a 9-point hedonic scale with 9 being “like extremely” and 1 being “dislike extremely” (Table 1.5). Consumers were also asked to rate the amount of saltiness on a 5-point Just About Right scale with Just About Right being a score of 3 (1 = “much too low” and 5 = “much too high”; Table 1.6). Demographic data including gender, age group, consumption frequency, and preference for brands and shapes of tortilla chips were also gathered.
1.1.1.5. Appearance Measurements
The color of the samples was instrumentally evaluated using a Minolta CR-300 colorimeter (Minolta Co., Ltd., Osaka, Japan). The hunter color values (L, a, and b) were used. The color value “L,” measuring whiteness, is quantified on a scale from 0 to 100. The color value “a” quantifies red (positive values) to green (negative values), and the color value “b” quantifies yellow (positive values) to blue (negative values).
1.1.1.6. Summary Results
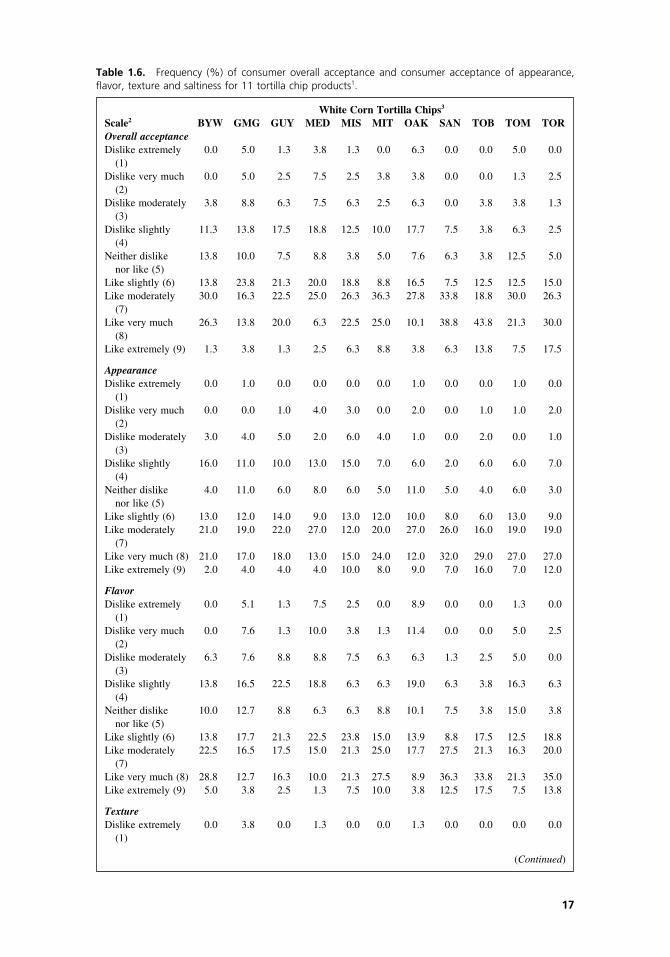
The frequency (percentage) of the consumer overall acceptance and acceptance of appear-ance, flavor, texture, and amount of salt is presented in Table 1.6. It was evident that the Tostito’s Restaurant Style chips had the highest overall acceptance frequency of “Like extremely” responses, followed by the Tostito’s Bite Size chips. Both Tostito’s Bite Size and Tostito’s Restaurant Style tortilla chips, together with Santita’s chips, from the same manufacturer (Frito-Lay), appeared to have the highest percentages (57.6%, 47.5%, and
α α
White Corn Tortilla Chips1
Attribute BYW GMG GUY MED MIS MIT OAK SAN TOB TOM TORAppearanceInstrumental color L 95.9 92.7 93.7 84.9 68.9 69.6 96.5 93.1 95.9 92.9 92.7Instrumental color a −0.1 −0.3 −0.6 0.4 0.4 0.3 0.6 −0.8 −0.4 −0.3 −0.8Instrumental color b 12.1 22.1 2.6 9.5 23.5 23.6 7.4 8.8 13 8.7 4.9Degree of whiteness 6 2 7 6.5 5 3 6 6 6 7 6Grain flecks 8 3 6 3.5 4 3 6 8 6 6 8Char marks 2 7 7 3 5 4.5 2 1.5 0 6 0Micro surface 2 0.5 1 2 2.5 2 2 1 2.5 3.5 2
particlesAmount of bubbles 6 6 6 6 5 5 6 7 7.5 7 5
FlavorSweet 0.5 0.5 0.5 0.4 0.6 0.4 0.7 0.6 0.4 0.4 0.6Salt 8.8 7.2 7.8 6.9 9.4 9.9 7.3 9 8.9 8.5 8Grain complex 6.9 7.2 6.6 6.5 7.1 6.9 6.8 7 6.9 7 6.9Toasted corn 2.7 2.3 1.6 2.3 3.8 2.8 1.3 3.4 2.6 2.5 2.6Raw corn 0 0.2 0 0 0 0 0.3 0 0 0 0Masa 3.7 3.7 3.8 3.8 3.1 3.2 4.2 3.7 4 4.1 3.4Toasted grain 1.4 2.2 2.2 1.5 1.2 2 1.8 0.8 1 1.4 2.3Sweet 0.5 0.5 0.5 0.4 0.6 0.4 0.7 0.6 0.4 0.4 0.6Heated oil 4.4 4.4 4.5 4.3 4.5 4.4 4.2 4.3 4.5 4.6 4.3Scorched 0 0.5 0.6 0 2.7 0.6 0 0 0.2 0 0Cardboard 2.4 2 2.8 3.3 2.7 2.6 2.6 2.1 1.9 2.4 2.4Astringent 2.6 2.5 2.5 2.5 2.7 2.6 2.6 2.6 2.6 2.6 2.5Aftertaste: toasted 1.4 1.1 0.7 1.1 2.2 1.8 0.5 2.4 1.7 1.1 1.5
cornAftertaste: toasted 1 1.4 1.2 1.2 0.8 0.9 1.2 0.4 0.4 1.1 1.4
grainAftertaste: toasted 2 1.6 2 1.5 1.3 1.7 1.5 1.6 1.3 1.7 1.2
masaAftertaste: raw masa 0.2 0.9 0.6 0.7 0.2 0 1.3 0.2 0.4 1.1 0.6Aftertaste: heated oil 2.5 2.8 2.8 2.7 3.1 2.7 2.4 2.8 3.1 2.8 2.9Aftertaste: salt 3.6 3.1 3.3 2.9 3.9 4.1 3.3 3.8 4.1 3.5 3.7Aftertaste: sweet 0.4 0.4 0.5 0.3 0.4 0.4 0.5 0.4 0.3 0.3 0.4
TextureMicro roughness 8.8 7.6 8.6 8.3 8.1 8.7 8.2 7.6 7.8 6.9 7.7Macro roughness 3.2 3.1 2.8 4.4 4.1 4.3 3.2 4.1 3.8 5.5 4.4Oily/greasy lips 6.7 4.4 5 6 5.3 5.8 6 5.8 5.8 5.9 5.3Loose particles 6.7 4.4 5 6 5.8 5.3 6 5.8 5.8 5.9 5.3Hardness 8.8 9.6 8.6 9 8.7 8.8 8.7 8.8 8.2 8.5 8Crispness 10.4 9.6 9.9 10.6 10.2 10.2 9.5 10.7 11.1 10.7 11.5Fracturability 7.4 7.2 7.8 7.9 7.5 7.7 7.1 7.7 8 7.5 7.9Cohesiveness of 2.7 3.3 3.2 3.1 2.9 3 3.5 3 3.2 3.1 3.4
massRoughness of mass 7.6 7.2 7.4 7.5 7.3 7.5 7.5 7.6 7.3 7.7 7.6Moistness of mass 7.3 7.6 7.1 7.2 7.3 6.9 7.7 7.4 7.3 7.7 7.2Moisture absorption 9.1 9.2 9.5 9.1 9.6 9.7 9.1 9.5 9.1 9 9.3Persistence of crisp 6 5.2 5.1 5.5 4.9 5.3 5.1 5.7 5.7 5.4 5.4Toothpack 5.2 5.2 5.1 5.2 5.4 5.8 5.4 5.3 5.3 5.2 5.1Loose particles 7.2 7.2 6.9 7 7.3 7 7.1 7.5 7.3 7.3 6.9Oily/greasy film 4 3.8 3.9 4.3 3.9 3.9 3.8 3.8 3.9 4.5 3.8
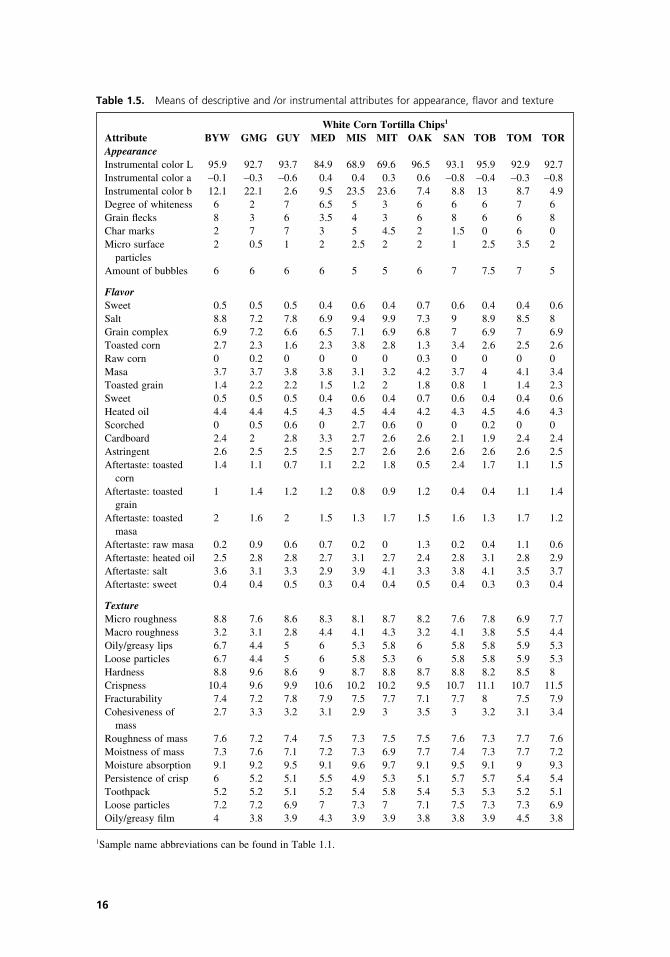
Table 1.5. Means of descriptive and /or instrumental attributes for appearance, fl avor and texture
1Sample name abbreviations can be found in Table 1.1.
16
White Corn Tortilla Chips3
Scale2 BYW GMG GUY MED MIS MIT OAK SAN TOB TOM TOROverall acceptanceDislike extremely 0.0 5.0 1.3 3.8 1.3 0.0 6.3 0.0 0.0 5.0 0.0
(1)Dislike very much 0.0 5.0 2.5 7.5 2.5 3.8 3.8 0.0 0.0 1.3 2.5
(2)Dislike moderately 3.8 8.8 6.3 7.5 6.3 2.5 6.3 0.0 3.8 3.8 1.3
(3)Dislike slightly 11.3 13.8 17.5 18.8 12.5 10.0 17.7 7.5 3.8 6.3 2.5
(4)Neither dislike 13.8 10.0 7.5 8.8 3.8 5.0 7.6 6.3 3.8 12.5 5.0
nor like (5)Like slightly (6) 13.8 23.8 21.3 20.0 18.8 8.8 16.5 7.5 12.5 12.5 15.0Like moderately 30.0 16.3 22.5 25.0 26.3 36.3 27.8 33.8 18.8 30.0 26.3
(7)Like very much 26.3 13.8 20.0 6.3 22.5 25.0 10.1 38.8 43.8 21.3 30.0
(8)Like extremely (9) 1.3 3.8 1.3 2.5 6.3 8.8 3.8 6.3 13.8 7.5 17.5
AppearanceDislike extremely 0.0 1.0 0.0 0.0 0.0 0.0 1.0 0.0 0.0 1.0 0.0
(1)Dislike very much 0.0 0.0 1.0 4.0 3.0 0.0 2.0 0.0 1.0 1.0 2.0
(2)Dislike moderately 3.0 4.0 5.0 2.0 6.0 4.0 1.0 0.0 2.0 0.0 1.0
(3)Dislike slightly 16.0 11.0 10.0 13.0 15.0 7.0 6.0 2.0 6.0 6.0 7.0
(4)Neither dislike 4.0 11.0 6.0 8.0 6.0 5.0 11.0 5.0 4.0 6.0 3.0
nor like (5)Like slightly (6) 13.0 12.0 14.0 9.0 13.0 12.0 10.0 8.0 6.0 13.0 9.0Like moderately 21.0 19.0 22.0 27.0 12.0 20.0 27.0 26.0 16.0 19.0 19.0
(7)Like very much (8) 21.0 17.0 18.0 13.0 15.0 24.0 12.0 32.0 29.0 27.0 27.0Like extremely (9) 2.0 4.0 4.0 4.0 10.0 8.0 9.0 7.0 16.0 7.0 12.0
FlavorDislike extremely 0.0 5.1 1.3 7.5 2.5 0.0 8.9 0.0 0.0 1.3 0.0
(1)Dislike very much 0.0 7.6 1.3 10.0 3.8 1.3 11.4 0.0 0.0 5.0 2.5
(2)Dislike moderately 6.3 7.6 8.8 8.8 7.5 6.3 6.3 1.3 2.5 5.0 0.0
(3)Dislike slightly 13.8 16.5 22.5 18.8 6.3 6.3 19.0 6.3 3.8 16.3 6.3
(4)Neither dislike 10.0 12.7 8.8 6.3 6.3 8.8 10.1 7.5 3.8 15.0 3.8
nor like (5)Like slightly (6) 13.8 17.7 21.3 22.5 23.8 15.0 13.9 8.8 17.5 12.5 18.8Like moderately 22.5 16.5 17.5 15.0 21.3 25.0 17.7 27.5 21.3 16.3 20.0
(7)Like very much (8) 28.8 12.7 16.3 10.0 21.3 27.5 8.9 36.3 33.8 21.3 35.0Like extremely (9) 5.0 3.8 2.5 1.3 7.5 10.0 3.8 12.5 17.5 7.5 13.8
TextureDislike extremely 0.0 3.8 0.0 1.3 0.0 0.0 1.3 0.0 0.0 0.0 0.0
(1)
(Continued)
Table 1.6. Frequency (%) of consumer overall acceptance and consumer acceptance of appearance, fl avor, texture and saltiness for 11 tortilla chip products1.
17
18 Chapter 1
White Corn Tortilla Chips3
Scale2 BYW GMG GUY MED MIS MIT OAK SAN TOB TOM TORDislike very much 1.3 6.3 0.0 7.5 1.3 1.3 2.6 0.0 0.0 3.8 1.3
(2)Dislike moderately 2.5 6.3 8.8 1.3 3.8 5.0 5.1 0.0 0.0 2.5 1.3
(3)Dislike slightly 12.5 26.6 16.3 18.8 5.0 15.0 7.7 3.8 2.5 11.4 0.0
(4)Neither dislike 1.3 8.9 11.3 8.8 8.8 5.0 9.0 7.5 5.1 15.2 6.3
nor like (5)Like slightly (6) 12.5 15.2 13.8 15.0 17.5 15.0 19.2 13.8 16.5 11.4 8.8Like moderately 28.8 21.5 27.5 27.5 22.5 25.0 28.2 23.8 17.7 21.5 23.8
(7)Like very much 31.3 10.1 20.0 17.5 31.3 25.0 21.8 35.0 38.0 27.8 38.8
(8)Like extremely (9) 10.0 1.3 2.5 2.5 10.0 8.8 5.1 16.3 20.3 6.3 20.0
Amount of SaltMuch too low (1) 3.8 20.0 8.8 31.3 1.3 5.0 10.1 0.0 2.5 8.8 3.8Low (2) 31.3 46.3 41.3 41.3 10.1 10.0 44.3 12.5 22.5 32.5 23.8Just right (3) 48.8 32.5 36.3 15.0 63.3 60.0 38.0 62.5 62.5 46.3 65.0High (4) 13.8 1.3 13.8 12.5 20.3 18.8 6.3 22.5 12.5 11.3 7.5Much too high (5) 2.5 0.0 0.0 0.0 5.1 6.3 1.3 2.5 0.0 1.3 0.0
1Total observations (n = 80 consumers) for each tortilla chip sample.2A 9-point hedonic scale for consumer overall acceptance and acceptance of appearance, flavor, and texture; a 5-point Just About Right scale for the amount of salt (saltiness).3Sample name abbreviations can be found in Table 1.1.
Table 1.6. Continued.
45.1%, respectively) of “Like” to “Like extremely,” whereas the Medallion White Corn, Green Mountain Gringo, and Oak Creek Farms—White Corn chips had the lowest percent-ages of these responses (8.8%, 17.6%, and 13.9%, respectively). The acceptance of the appearance, flavor, and texture of Tostito’s Bite Size chips was rated as “Like extremely” by 16.0%, 17.5%, and 20.3% of the consumers, respectively. In contrast, the acceptance of the appearance, flavor, and texture of the Medallion White Corn chips was rated as “Like extremely” only by 4.0%, 1.4%, and 2.5% of the consumers, respectively. In terms of the amount of salt, 60%–65% of the consumers rated five products (Mission Strips, Mission Triangle, Santita’s, Tostito’s Bite Size, and Tostito’s Restaurant Style chips) as Just About Right, whereas Medallion White Corn chips had the lowest rate of approval (i.e., 15%). It was found that the Just About Right rates were associated with the salt content (Table 1.6). A salt content of 4% was found to be Just About Right for the consumer saltiness acceptance.
Descriptive intensity means for the attributes of visual appearance, flavor, and texture and the means of instrumental color values (“L,” “a,” and “b”) are presented in Table 1.5, illustrating some of the sensory differences observed among the 11 products.
1.1.2. Muscadine Grape Juices
1.1.2.1. Introduction
These data are used in Chapter 3 on preference mapping and in Chapter 6 on consumer segmentation. Muscadine grapes (Vitis rotundifolia) are native to the southeastern United
A Description of Example Data Sets Used in Further Chapters 19
States and have been produced commercially in Arkansas since 1972 (Lanier and Morris, 1979). Recent economic analysis indicates that muscadine grape production can be a prof-itable enterprise for growers (Noguera et al., 2005). Interest in production of muscadines has increased since muscadines and products from muscadines were identified as a source of vitamins, minerals, fiber, antioxidants, and phenolic compounds (Ector, 2001; Ector et al., 1996; Lee and Talcott, 2004; Pastrana-Bonilla et al., 2003; Striegler et al., 2005; Talcott and Lee, 2002; Threlfall et al., 2005; Yilmaz and Toledo, 2004).
The increase in consumer interest in a healthier lifestyle provides an opportunity for the muscadine industry to capture a section of the nutraceutical market that is projected to reach $28 billion in the United States by 2006 (Green, 2003). The muscadine grape juice used to study the acceptability and sensory properties of the product was hand-harvested from black and bronze cultivars from the University of Arkansas Southwest Research and Extension Center. The cultivars included Black Beauty (Brooks and Olmo, 1991), Carlos (Brooks and Olmo, 1970), Granny Val (Brooks and Olmo, 1991), Nesbitt (Goldy and Nesbitt, 1985), Southern Home (Mortensen et al., 1994), Summit (Lane, 1977), and Supreme (Brooks and Olmo, 1991).
1.1.2.2. Samples
Thirty-six kilograms of each grape cultivar were used for juice processing. The grapes were crushed twice and placed in a plastic container with a food-grade polyethylene liner. After being processed, the juice was placed in cold storage overnight and then stabilized for 2 weeks at 2°C. The juice was then pasteurized and sealed in glass bottles and stored again at the same temperature.
Each muscadine juice was assigned a random three-digit number for identification. Two commercial muscadine juices were also included, one red juice and one white juice.
1.1.2.3. Descriptive Analysis
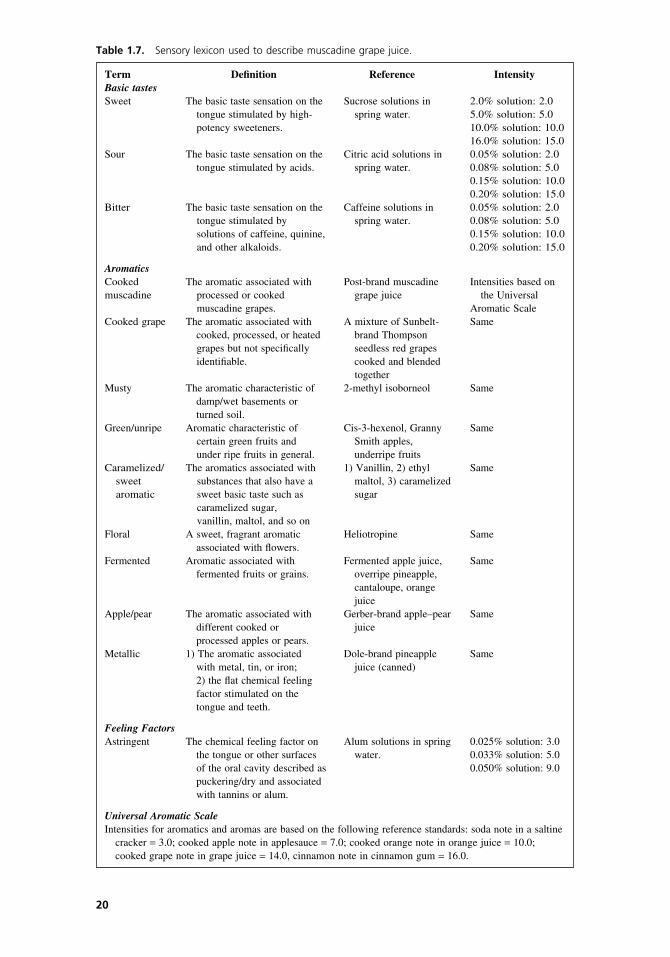
The 10 muscadine juices were examined for aroma, basic tastes, aromatics, feeling factors, and aftertaste by a group of nine Spectrum-trained panelists. Panel orientation was held over a 2-day period during two 3-hour sessions to develop a descriptive lexicon. The lexicon and references used to describe the sensory properties of muscadine grape juice can be found in Table 1.7.
Flavor, aroma, feeling factors, and aftertaste were evaluated under controlled conditions over two sessions of 3 hours each. The samples were replicated and presented to each panelist according to different randomized schemes so that the order of presentation was balanced. Panelists were provided with appropriate references and paper ballots, and they used a numerical scale from 0 to 15, with one significant digit (Meilgaard et al., 1999). The panelists were also given crackers (Nabisco Premium Unsalted) and water for cleansing and rinsing their palates between each sample.
1.1.2.4. Consumer Testing
Sixty-one individuals were recruited from a database of over 2000 local consumers. Con-sumers were recruited on the basis of the frequency of their muscadine and muscadine juice consumption. They were also chosen on the basis of their level of liking for musca-dine grapes. The 10 juices were tested over the course of 2 days.
A completely randomized serving order was used across the 10 juices for the 61 con-sumers (Meilgaard et al., 1999). Each consumer saw the first five juices the first day of
Term Definition Reference IntensityBasic tastesSweet The basic taste sensation on the Sucrose solutions in 2.0% solution: 2.0
tongue stimulated by high- spring water. 5.0% solution: 5.0potency sweeteners. 10.0% solution: 10.0
16.0% solution: 15.0Sour The basic taste sensation on the Citric acid solutions in 0.05% solution: 2.0
tongue stimulated by acids. spring water. 0.08% solution: 5.0 0.15% solution: 10.0 0.20% solution: 15.0
Bitter The basic taste sensation on the Caffeine solutions in 0.05% solution: 2.0tongue stimulated by spring water. 0.08% solution: 5.0solutions of caffeine, quinine, 0.15% solution: 10.0and other alkaloids. 0.20% solution: 15.0
AromaticsCooked The aromatic associated with Post-brand muscadine Intensities based onmuscadine processed or cooked grape juice the Universal
muscadine grapes. Aromatic ScaleCooked grape The aromatic associated with A mixture of Sunbelt- Same
cooked, processed, or heated brand Thompsongrapes but not specifically seedless red grapesidentifiable. cooked and blended
togetherMusty The aromatic characteristic of 2-methyl isoborneol Same
damp/wet basements orturned soil.
Green/unripe Aromatic characteristic of Cis-3-hexenol, Granny Samecertain green fruits and Smith apples,under ripe fruits in general. underripe fruits
Caramelized/ The aromatics associated with 1) Vanillin, 2) ethyl Samesweet substances that also have a maltol, 3) caramelizedaromatic sweet basic taste such as sugar
caramelized sugar,vanillin, maltol, and so on
Floral A sweet, fragrant aromatic Heliotropine Sameassociated with flowers.
Fermented Aromatic associated with Fermented apple juice, Samefermented fruits or grains. overripe pineapple,
cantaloupe, orangejuice
Apple/pear The aromatic associated with Gerber-brand apple–pear Samedifferent cooked or juiceprocessed apples or pears.
Metallic 1) The aromatic associated Dole-brand pineapple Samewith metal, tin, or iron; juice (canned)2) the flat chemical feelingfactor stimulated on thetongue and teeth.
Feeling FactorsAstringent The chemical feeling factor on Alum solutions in spring 0.025% solution: 3.0
the tongue or other surfaces water. 0.033% solution: 5.0of the oral cavity described as 0.050% solution: 9.0puckering/dry and associatedwith tannins or alum.
Universal Aromatic ScaleIntensities for aromatics and aromas are based on the following reference standards: soda note in a saltine
cracker = 3.0; cooked apple note in applesauce = 7.0; cooked orange note in orange juice = 10.0;cooked grape note in grape juice = 14.0, cinnamon note in cinnamon gum = 16.0.
Table 1.7. Sensory lexicon used to describe muscadine grape juice.
20
A Description of Example Data Sets Used in Further Chapters 21
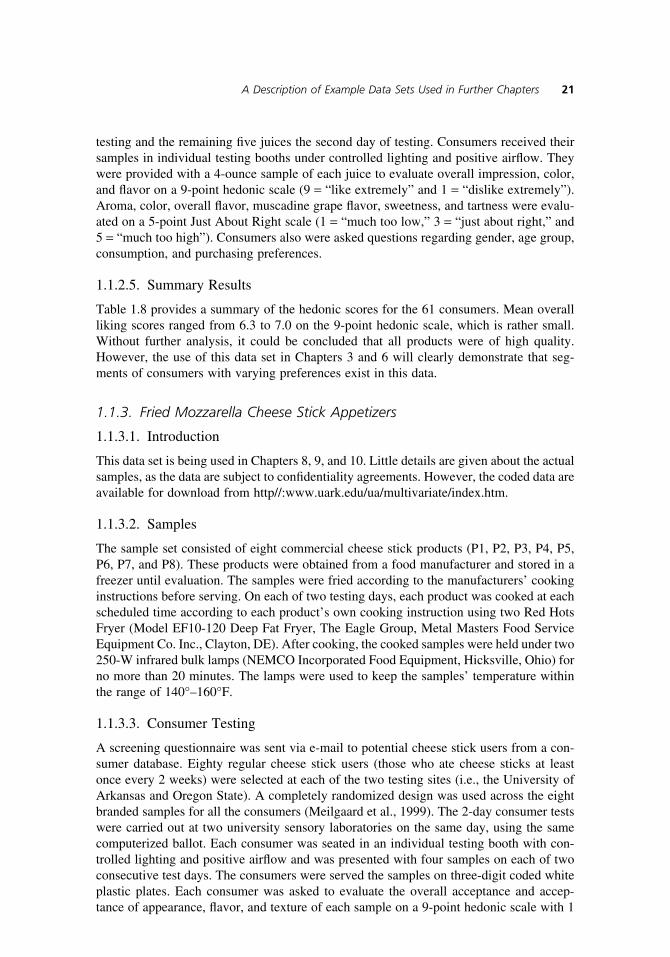
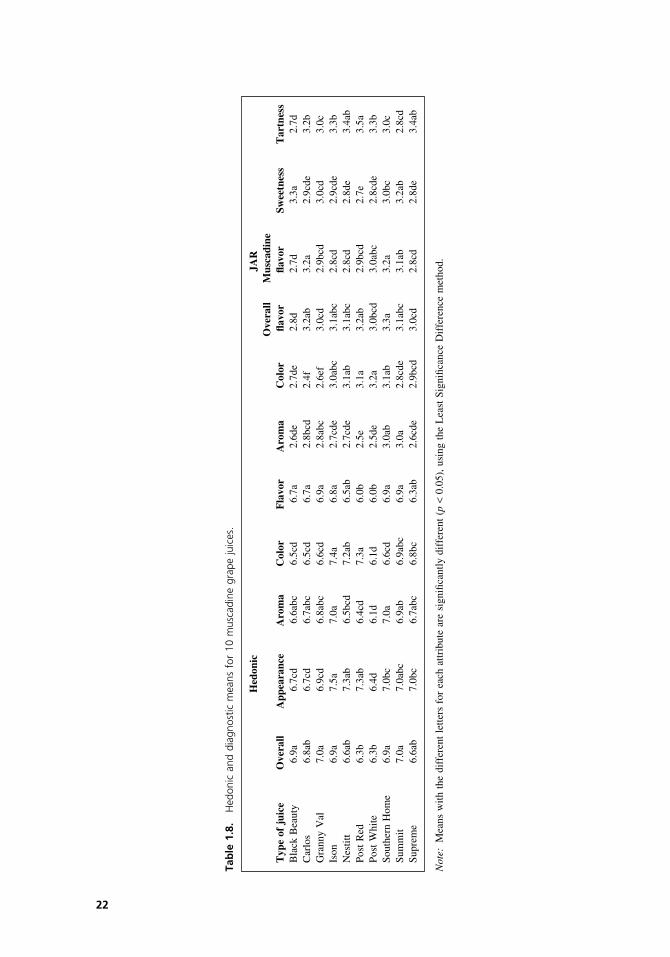
testing and the remaining five juices the second day of testing. Consumers received their samples in individual testing booths under controlled lighting and positive airflow. They were provided with a 4-ounce sample of each juice to evaluate overall impression, color, and flavor on a 9-point hedonic scale (9 = “like extremely” and 1 = “dislike extremely”). Aroma, color, overall flavor, muscadine grape flavor, sweetness, and tartness were evalu-ated on a 5-point Just About Right scale (1 = “much too low,” 3 = “just about right,” and 5 = “much too high”). Consumers also were asked questions regarding gender, age group, consumption, and purchasing preferences.
1.1.2.5. Summary Results
Table 1.8 provides a summary of the hedonic scores for the 61 consumers. Mean overall liking scores ranged from 6.3 to 7.0 on the 9-point hedonic scale, which is rather small. Without further analysis, it could be concluded that all products were of high quality. However, the use of this data set in Chapters 3 and 6 will clearly demonstrate that seg-ments of consumers with varying preferences exist in this data.
1.1.3. Fried Mozzarella Cheese Stick Appetizers
1.1.3.1. Introduction
This data set is being used in Chapters 8, 9, and 10. Little details are given about the actual samples, as the data are subject to confidentiality agreements. However, the coded data are available for download from http//:www.uark.edu/ua/multivariate/index.htm.
1.1.3.2. Samples
The sample set consisted of eight commercial cheese stick products (P1, P2, P3, P4, P5, P6, P7, and P8). These products were obtained from a food manufacturer and stored in a freezer until evaluation. The samples were fried according to the manufacturers’ cooking instructions before serving. On each of two testing days, each product was cooked at each scheduled time according to each product’s own cooking instruction using two Red Hots Fryer (Model EF10-120 Deep Fat Fryer, The Eagle Group, Metal Masters Food Service Equipment Co. Inc., Clayton, DE). After cooking, the cooked samples were held under two 250-W infrared bulk lamps (NEMCO Incorporated Food Equipment, Hicksville, Ohio) for no more than 20 minutes. The lamps were used to keep the samples’ temperature within the range of 140°–160°F.
1.1.3.3. Consumer Testing
A screening questionnaire was sent via e-mail to potential cheese stick users from a con-sumer database. Eighty regular cheese stick users (those who ate cheese sticks at least once every 2 weeks) were selected at each of the two testing sites (i.e., the University of Arkansas and Oregon State). A completely randomized design was used across the eight branded samples for all the consumers (Meilgaard et al., 1999). The 2-day consumer tests were carried out at two university sensory laboratories on the same day, using the same computerized ballot. Each consumer was seated in an individual testing booth with con-trolled lighting and positive airflow and was presented with four samples on each of two consecutive test days. The consumers were served the samples on three-digit coded white plastic plates. Each consumer was asked to evaluate the overall acceptance and accep-tance of appearance, flavor, and texture of each sample on a 9-point hedonic scale with 1
Hed
onic
JAR
Ove
rall
Mus
cadi
neT
ype
of j
uice
O
vera
ll A
ppea
ranc
e A
rom
a C
olor
F
lavo
r A
rom
a C
olor
fla
vor
flavo
r Sw
eetn
ess
Tar
tnes
sB
lack
Bea
uty
6.9a
6.
7cd
6.6a
bc
6.5c
d 6.
7a
2.6d
e 2.
7de
2.8d
2.
7d
3.3a
2.
7dC
arlo
s 6.
8ab
6.7c
d 6.
7abc
6.
5cd
6.7a
2.
8bcd
2.
4f
3.2a
b 3.
2a
2.9c
de
3.2b
Gra
nny
Val
7.
0a
6.9c
d 6.
8abc
6.
6cd
6.9a
2.
8abc
2.
6ef
3.0c
d 2.
9bcd
3.
0cd
3.0c
Ison
6.
9a
7.5a
7.
0a
7.4a
6.
8a
2.7c
de
3.0a
bc
3.1a
bc
2.8c
d 2.
9cde
3.
3bN
estit
t 6.
6ab
7.3a
b 6.
5bcd
7.
2ab
6.5a
b 2.
7cde
3.
1ab
3.1a
bc
2.8c
d 2.
8de
3.4a
bPo
st R
ed
6.3b
7.
3ab
6.4c
d 7.
3a
6.0b
2.
5e
3.1a
3.
2ab
2.9b
cd
2.7e
3.
5aPo
st W
hite
6.
3b
6.4d
6.
1d
6.1d
6.
0b
2.5d
e 3.
2a
3.0b
cd
3.0a
bc
2.8c
de
3.3b
Sout
hern
Hom
e 6.
9a
7.0b
c 7.
0a
6.6c
d 6.
9a
3.0a
b 3.
1ab
3.3a
3.
2a
3.0b
c 3.
0cSu
mm
it 7.
0a
7.0a
bc
6.9a
b 6.
9abc
6.
9a
3.0a
2.
8cde
3.
1abc
3.
1ab
3.2a
b 2.
8cd
Supr
eme
6.6a
b 7.
0bc
6.7a
bc
6.8b
c 6.
3ab
2.6c
de
2.9b
cd
3.0c
d 2.
8cd
2.8d
e 3.
4ab
Tab
le 1
.8.
Hed
onic
and
dia
gnos
tic m
eans
for
10
mus
cadi
ne g
rape
juic
es.
Not
e:M
eans
with
the
dif
fere
nt l
ette
rs f
or e
ach
attr
ibut
e ar
e si
gnifi
cant
ly d
iffe
rent
(p
<0.
05),
usi
ng t
he L
east
Sig
nific
ance
Dif
fere
nce
met
hod.
22
A Description of Example Data Sets Used in Further Chapters 23
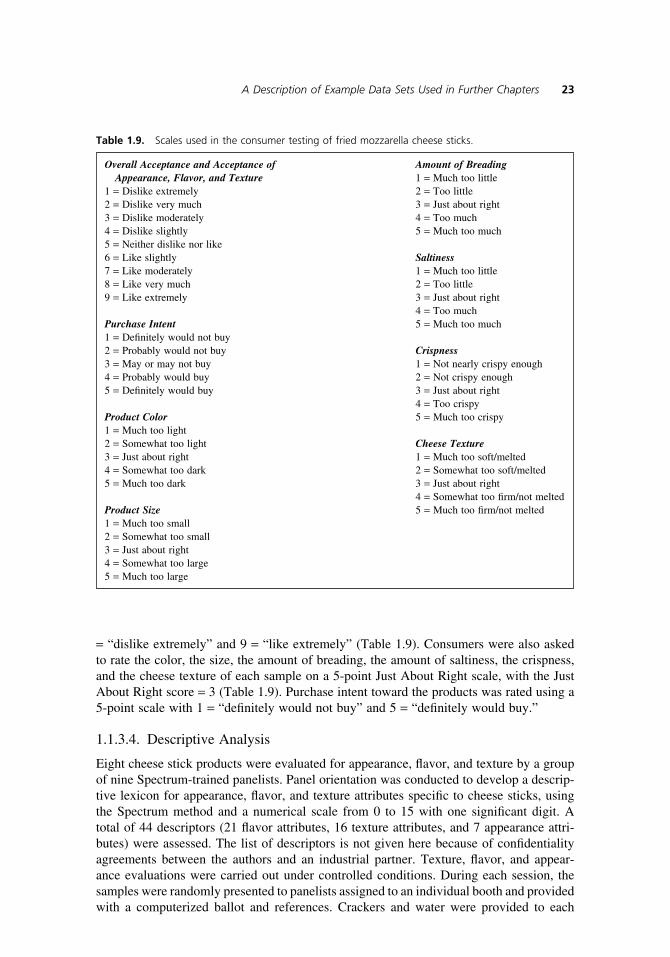
= “dislike extremely” and 9 = “like extremely” (Table 1.9). Consumers were also asked to rate the color, the size, the amount of breading, the amount of saltiness, the crispness, and the cheese texture of each sample on a 5-point Just About Right scale, with the Just About Right score = 3 (Table 1.9). Purchase intent toward the products was rated using a 5-point scale with 1 = “definitely would not buy” and 5 = “definitely would buy.”
1.1.3.4. Descriptive Analysis
Eight cheese stick products were evaluated for appearance, flavor, and texture by a group of nine Spectrum-trained panelists. Panel orientation was conducted to develop a descrip-tive lexicon for appearance, flavor, and texture attributes specific to cheese sticks, using the Spectrum method and a numerical scale from 0 to 15 with one significant digit. A total of 44 descriptors (21 flavor attributes, 16 texture attributes, and 7 appearance attri-butes) were assessed. The list of descriptors is not given here because of confidentialityagreements between the authors and an industrial partner. Texture, flavor, and appear-ance evaluations were carried out under controlled conditions. During each session, the samples were randomly presented to panelists assigned to an individual booth and provided with a computerized ballot and references. Crackers and water were provided to each
Overall Acceptance and Acceptance of Amount of BreadingAppearance, Flavor, and Texture 1 = Much too little
1 = Dislike extremely 2 = Too little2 = Dislike very much 3 = Just about right3 = Dislike moderately 4 = Too much4 = Dislike slightly 5 = Much too much5 = Neither dislike nor like6 = Like slightly Saltiness7 = Like moderately 1 = Much too little8 = Like very much 2 = Too little9 = Like extremely 3 = Just about right
4 = Too muchPurchase Intent 5 = Much too much1 = Definitely would not buy2 = Probably would not buy Crispness3 = May or may not buy 1 = Not nearly crispy enough4 = Probably would buy 2 = Not crispy enough5 = Definitely would buy 3 = Just about right
4 = Too crispyProduct Color 5 = Much too crispy1 = Much too light2 = Somewhat too light Cheese Texture3 = Just about right 1 = Much too soft/melted4 = Somewhat too dark 2 = Somewhat too soft/melted5 = Much too dark 3 = Just about right
4 = Somewhat too firm/not meltedProduct Size 5 = Much too firm/not melted1 = Much too small2 = Somewhat too small3 = Just about right4 = Somewhat too large5 = Much too large
Table 1.9. Scales used in the consumer testing of fried mozzarella cheese sticks.
Hed
onic
Ju
st A
bout
Rig
htSa
mpl
e na
me
Ove
rall
App
eara
nce
Fla
vor
Tex
ture
Si
ze
Bre
adin
g C
olor
Sa
ltin
ess
Cri
spne
ss
Tex
ture
P1
6.47
a 6.
94ab
6.
63a
6.11
ab
3.13
a 3.
09a
2.80
c 3.
09ab
2.
63ab
3.
61a
P2
6.56
a 7.
02ab
6.
25ab
6.
48a
3.03
a 3.
04a
3.02
a 2.
86c
2.61
ab
3.19
bP3
5.
50b
4.99
d 5.
61c
5.84
b 2.
06c
2.75
b 2.
31d
2.84
c 2.
53ab
c 3.
47a
P4
5.70
b 6.
13c
5.27
cd
5.91
b 3.
12a
2.88
b 2.
90bc
2.
45e
2.67
a 3.
02c
P5
4.95
c 5.
07d
4.97
de
5.14
c 2.
20b
3.04
a 2.
78c
2.96
bc
2.08
d 3.
11bc
P6
4.31
d 4.
51e
4.76
e 4.
11d
1.87
d 2.
49c
1.81
e 2.
64d
1.52
e 2.
56d
P7
6.60
a 7.
25a
6.22
b 6.
15ab
3.
04a
3.04
a 2.
99ab
3.
13a
2.42
c 3.
25b
P8
6.27
a 6.
85b
6.32
ab
5.95
b 3.
07a
3.12
a 3.
01ab
3.
11a
2.49
bc
3.54
a
Tab
le 1
.10.
Con
sum
er h
edon
ic a
nd d
iagn
ostic
and
pur
chas
e in
tent
mea
ns f
or e
ight
frie
d m
ozza
rella
che
ese
stic
ks.
Not
e:M
eans
with
the
sam
e le
tter
in t
he c
olum
n ar
e no
t si
gnifi
cant
ly d
iffe
rent
(p
<0.
05)
with
the
Lea
st S
igni
fican
ce D
iffe
renc
e m
etho
d.JA
R=
Just
Abo
ut R
ight
sca
le.
24
A Description of Example Data Sets Used in Further Chapters 25
panelist as a means for cleansing and rinsing their palates between each sample. A 10-minute break was scheduled at each session. The texture and flavor evaluations were performed in duplicate, whereas the appearance evaluation, because of product nonuni-formity, was performed by presenting several cheese sticks on a white plate.
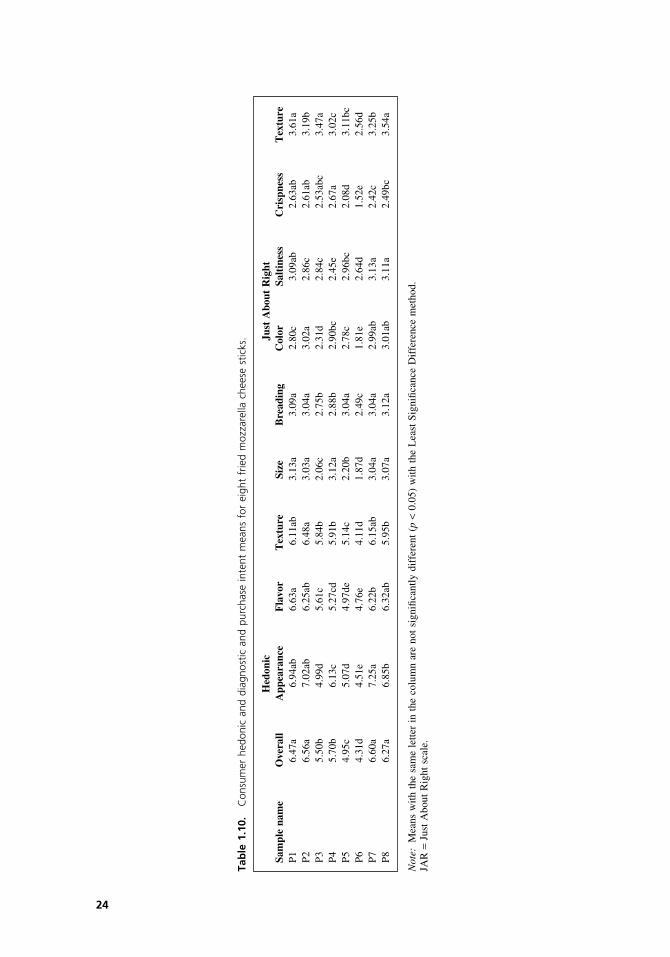
1.1.3.5. Summary Results
A summary of consumer testing means is provided in Table 1.10 for the eight products tested. Overall liking means ranged from 4.31 to 6.47, with products P1, P2, and P7 being most liked and products P5 and P6 being most disliked. This data set is used in Chapter 5 as an illustration of Landscape Segment Analysis, in Chapter 8 to introduce the concepts of risk analysis, and in Chapter 9 to describe the application of multivariate adaptive regres-sion splines to identifying attributes driving liking of this type of product.
1.1.4. Data Sets for Panelist and Panel Performance Evaluation
1.1.4.1. Chocolate Chip Cookies—Simple DA
This experiment dates back to the 1980s. Chocolate chip cookies are a common product across North America. There are clear differences among commercial products that result from the use of real chocolate chips versus compound chips and the proportion of chips in the formula. In recent years, chewy biscuits have been included in this product category. It is easy to find four or five brands that are sufficiently different that a novice panel may be trained in the evaluation of a small number of key attributes in a short period of time, usually under 1 hour. This data set was created in 2002 as part of a training exercise. The attributes were familiar to most potential panelists. In this case, the Excel (Microsoft Corp., Redmond, WA) sheet held responses from 10 panelists for five attributes and five prod-ucts in a single session. Because this was a training session, the samples were presented monadically in a fixed order.
1.1.4.2. White Wine Descriptive Panel
This data set was part of a major study that has been reported in the literature (Findlay et al., 2006). A total of 20 white wines were evaluated in triplicate by 10 panelists using 76 attributes. For this reduced data set, there are 10 wines, and the 27 attributes are those related to flavor and mouthfeel. The data were collected over nine sessions that provided three replicates. The design was a balanced complete block that was broken across sessions.
References
Anonymous. 1998. An interview with McCormick on trends in the snack food industry. Cereal Food World 43(2):60–65.
Brooks, R.M. and H.P. Olmo. 1991. Register of new fruit and nut varieties. List 36. HortScience 26:964–967.Brooks, R.M. and H.P. Olmo. 1970. Register of new fruit and nut varieties. List 25. HortScience 5:384–385.Buttery R.G. and L.C. Ling. 1995. Volatile flavor components of corn tortillas and related products. J Agri Food
Chem 43: 1878–1882.Buttery R.G. and L.C. Ling. 1998. Additional studies on flavor components of corn tortilla chips. J Agri Food
Chem 46:2764–2769.Dies C.R. 2000. Food Product Design: Applications. Available at http://www.Foodproductdesign.com/archive/
2000/0100ap.html. Accessed on December 2, 2000.
26 Chapter 1
Ector, B.J. 2001. Compositional and nutritional characteristics p. 341–367. In: Muscadine Grapes. F.M. Basiouny and D.G. Himelrick (eds.). Alexandria, VA: ASHS Press.
Ector, B.J., J.B. Magee, C.P. Hegwood, and M.J. Coign. 1996. Resveratrol concentration in muscadine berries, juice, pomace, purees, seeds, and wines. Am. J. Enol. Vitic. 47:57–62.
Findlay, C., J. Castura, P. Schlish, and I. Lesschaeve. 2006. Use of feedback calibration to reduce the training time for wine panels. Food Qual. Pref. 17:266–276.
Goldy, R.G. and W.B. Nesbitt. 1985. ‘Nesbitt’ muscadine grape. HortScience 20:777.Green, C. 2003. Nutraceuticals and pharmaceuticals—market is growing rapidly for medicinal foods. Ag.
Innovation News 12(1).Hawrysh Z.J., M.K. Erin, S.S. Kim, and R.T. Hardin. 1995. Sensory and chemical stability of tortilla chips fried
in canola oil, corn oil, and partially hydrogenated soybean oil. J. Am. Oil Chemist Soc. 72:1123–1130.Lane, R.P. 1977. ‘Summit’ muscadine grape. HortScience 12(6):588.Lanier, M.R. and J.R. Morris. 1979. Evaluation of density separation for defining fruit maturities and maturation
rates of once-over harvested muscadine grapes. J. Am. Soc. Hort. Sci. 104:249–252.Lee, J.H. and S.T. Talcott. 2004. Fruit maturity and juice extraction influences ellagic acid derivatives and other
antioxidant polyphenolics in muscadine grapes. J. Agric. Food Chem. 52:361–366.Lisser, E. 1993. Tortilla chips tempt snackers with changes. Wall Street Journal, May 6, p B1.Meilgaard M., G.V. Civille, and B.T. Carr. 1999. Sensory Evaluation Techniques. 3rd Ed. Boca Raton, FL:
CRC.Meullenet, J.-F., R. Xiong, M. Monsoor, T. Bellman-Horner, S. Zivanovic, P. Dias, H. Fromm, and Z. Liu. 2002
Preference mapping of commercial toasted white corn tortilla chips. J. Food Sci. 67:1950–1957.Meullenet, J-F., R. Xiong, J.A. Hankins, P. Dias, S. Zivanovic, M.A. Monsoor, T. Bellman-Horner, Z. Liu, and
H. Fromm. 2003. Modeling preference of commercial toasted white corn tortilla chips using proportional odds models. Food Q. Pref. 14(2003):603–614.
Mortensen, J.A., J.W. Harris, and D.L. Hopkins. 1994. ‘Southern Home’: an interspecific hybrid grape with ornamental value. HortScience 29:1371–1372.
Noguera, E., Morris, J., Striegler, K., and Thomsen, M. 2005. Production budgets for Arkansas wine and juice grapes. Ark. Agri. Expt. Sta. In press.
Pastrana-Bonilla, E., C.C. Akoh, S. Sellappan, and G. Krewer. 2003. Phenolic content and antioxidant capacity of muscadine grapes. J. Agric. Food Chem. 51:5497–5503.
Rea L.M. and R.A. Parker. 1992. Designing and conducting survey research: a comprehensive guide. San Francisco: Jossey-Bass.
Stinson, C.T., and Tomassetti, S.J. 1995. Effect of natural corn flavor on the sensory quality of low fat tortilla chips. Food Tech. 49(5):84, 88–90.
Striegler, R.K., P.M. Carter, J.R. Morris, J.R. Clark, R.T. Threlfall, and L.R. Howard. 2005. Yield, quality and nutraceutical potential of selected muscadine cultivars grown in southwestern Arkansas. HortTechnology 15(2):276–284.
Talcott, S.T. and J.H. Lee. 2002. Ellagic acid and flavonoid antioxidant content of muscadine wine and juice. J. Agric. Food Chem. 50:3186–3192.
Threlfall, R.T., J.R. Morris, L.R. Howard, C.R. Brownmiller, and T.L. Walker. 2005. Pressing effects on yield, quality, and nutraceutical content of juice, seeds, and skins from Black Beauty and Sunbelt grapes. J. Food Sci. 70(3):167–171.
Wellman D. 1997. Snack foods. Supermarket Bus. 52(9):64.Yilmaz, Y. and R.T. Toledo. 2004. Major flavonoids in grape seeds and skins: antioxidant capacity of catechin,
epicatechin, and gallic acid. J. Agric. Food Chem. 52:255–260.