Embed Size (px)
Citation preview

1
ATOVS and SSM/I assimilation at the Met
Office
Stephen English, Dave Jones, Andrew Smith, Fiona Hilton and Keith Whyte

2
NESDISNESDIS
NESDISNESDIS
NWP system for ATOVS+SSM/I
AAPP 1D-var
3D-var
1D-var
1B 1D
1D+QCT* etc.
1C
HRPT
AT
OV
S
SS
M/I
NWP system
Global (4 x 6 hrs)
3D-var/FGAT
325x217 30L
Mesoscale (8 x 3 hrs)
43-63N, 15E-15W
12km 38L
AMVs, sondes, synop, AIREP, AMDAR, buoy and ship data Winds
TCWV LWP
T+6 or T+3
Analysis

3
Status NOAA-15AMSU 4-12
NOAA-14MSU 2-4
HIRS 1-8, 10-15
DMSP-F13Windspeed
NOAA-15AMSU 4-12, 18, 20
NOAA-16AMSU 4-12, 18-20
HIRS 5-8, 10-12, 15
DMSP-F13Windspeed
DMSP-F15Windspeed
Sept 2000 Feb 2002A
TO
VS
SS
M/I

4
Impact of satellite and relevant assimilation change since introduction of 3D-varMarch 29 1999 Introduction of 3DVAR and NOAA-15 ATOVS
July 20 1999 Use of ATOVS over Siberia, covariance retuning, increased thinning of scatterometer winds
October 19 1999 Direct assimilation of (A)TOVS Radiances, Use of Surface Wind from SSM/I, Remove scatterometer winds over ice, improved use of Synop pressures
May 16 2000 Time interpolation of background, covariance retuning
February 13 2001 Second SSM/I satellite, humidity covariance retuning, improved use of AMSU channel 5 in cloudy conditions
April 18 2001 Use of AMSU-B and NOAA-16 ATOVS replaces NOAA-14 TOVS
October 17 2001 Improved use of SSM/I, AMVs, ATOVS thinning, ATOVS over sea ice
5
ATOVS & 3D-var +4ATOVS & 3D-var +4
ATOVS sea ice & AMVs +2
ATOVS sea ice & AMVs +2
NOAA-16 & AMSU-B +1.5
NOAA-16 & AMSU-B +1.5
ATOVS over Siberia +0.75ATOVS over Siberia +0.75
Direct radiance assimilation +2Direct radiance assimilation +2
Tuning of 3D-var +1.5Tuning of 3D-var +1.5
2nd SSM/I etc. +0.752nd SSM/I etc. +0.75
1997
1998
1999
2000
2001
1996
1990-1999
1999-2002
6
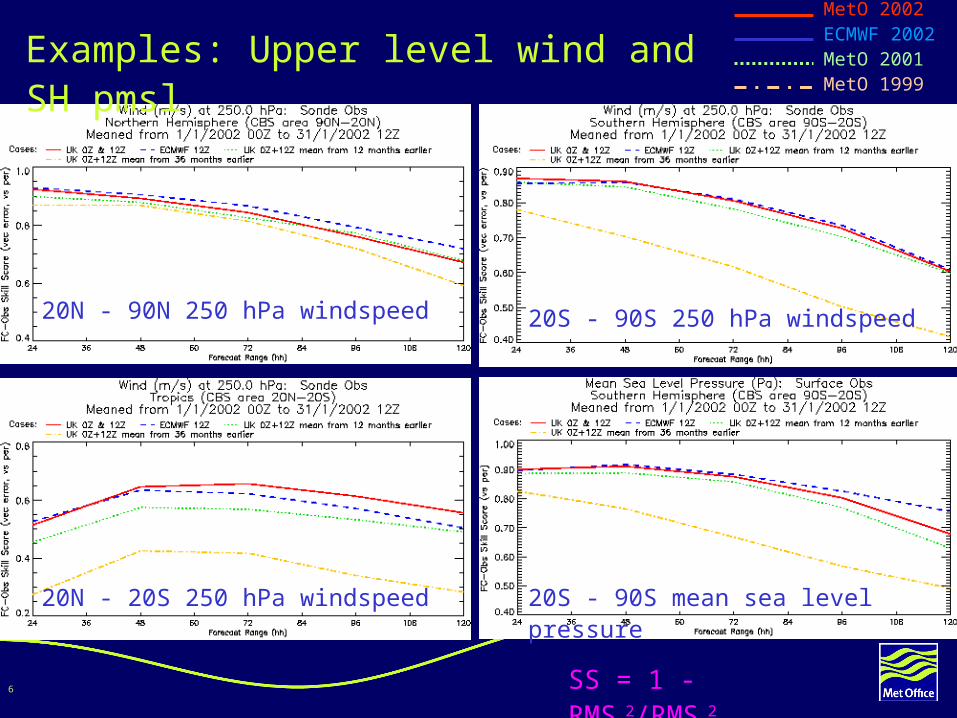
Examples: Upper level wind and SH pmsl
SS = 1 - RMSf
2/RMSp2
20N - 90N 250 hPa windspeed
20S - 90S mean sea level pressure
20S - 90S 250 hPa windspeed
20N - 20S 250 hPa windspeed
MetO 2002ECMWF 2002MetO 2001MetO 1999

7
ATOVS changes1. AMSU channel 5: increased use in cloudy areas
Date: Feb 13 2001 Trials: Dec 99 + Jul 00
Method
Stop using HIRS cloud flag status when cloud checking for AMSU ch.5
Impact Large at short range
– improved fit to radiances and radiosondes at T+6
– RMSE slightly lower ( 1-2%) for height at T+24-T+72, especially in SH and tropics (RMSE 3% at 700 hPa in tropics), but < 1% improvement for winds and RH.
Neutral in medium range (T+96-T+144)

8
2. Replacement of NOAA-14 TOVS with NOAA-16 ATOVS Date: April 18 2001 Trials: Mar-Apr 01
Method
As NOAA-15 ATOVS.
Impact Replacing NOAA-14 with NOAA-16 had a very large impact 500 hPa
height RMSE 10% in SH and 3-5% in NH at short and medium range
Also losing NOAA-14 without replacing with NOAA-16 would have had a significant negative impact
The largest impact of any ATOVS change since the original introduction of NOAA-15

9
3. Use of AMSU-B from NOAA-15 and NOAA-16 Date: April 18 2001 Trials: Dec 99 + Jul-Aug 00 + Mar-Apr 01
Method
AMSU-B channels 18, 20 from NOAA-15, 18-20 from NOAA-16. Sea points only. Cirrus check for channel 20. Precipitation checks for channels 18, 19.
Impact AMSU-B had a small positive impact on mass and wind field
–tropical low level wind (T+24 RMSE 2% at 850 hPa).
–20S -70S low level height (T+24 RMSE 5% at 850 hPa).
AMSU-B had a large positive impact on tropical relative humidity
–tropical low level RH 850- 500 hPa (RMSE 5% at 850 hPa T+24) .
–improved to RMSE 10% when bias corrections were recalculated.
Subjective verification of cloud and rain fields
–improvements versus SSM/I global rain retrievals from NESDIS and versus geostationary VIS/IR imagery.

10
Fit to radiances
Fit much improved in tropics
Fit much improved in tropics
Ch. 18 (200-500 hPa)Ch. 18 (200-500 hPa)
90S 45S Equator 45 N 90N
Std
. Dev
. Obs
-FG
K6
5
4
3
2
1
0
Observation error = 4 K assumedObservation error = 4 K assumed
Fit marginally improved in SHFit marginally improved in SH
Almost neutral in NHAlmost neutral in NH
11
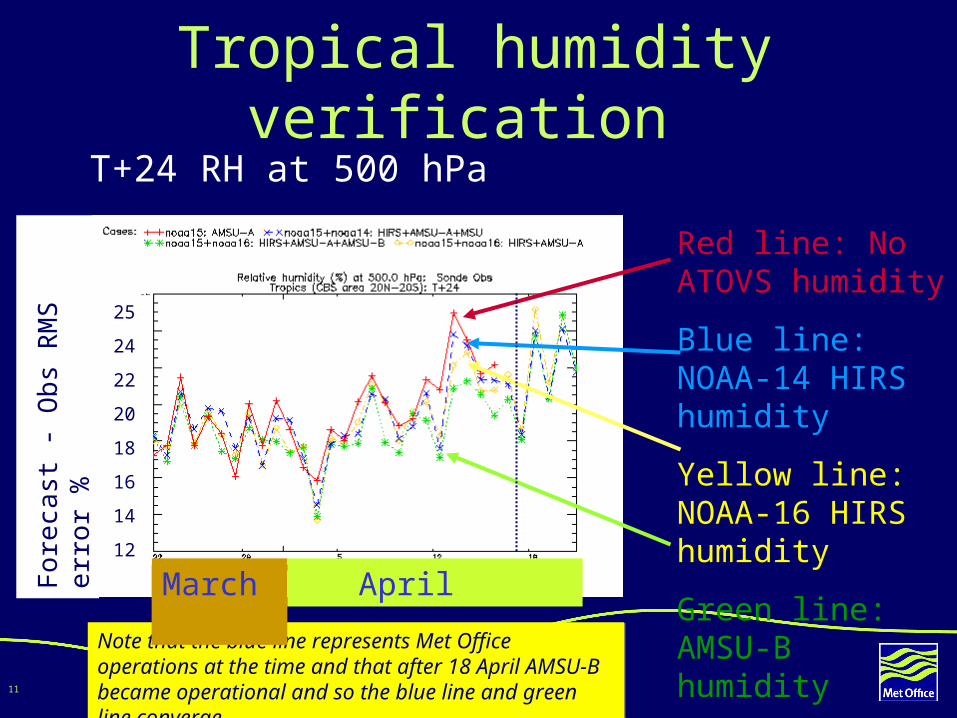
Tropical humidity verification T+24 RH at 500 hPa
Red line: No ATOVS humidity
Blue line: NOAA-14 HIRS humidity
Yellow line: NOAA-16 HIRS humidity
Green line: AMSU-B humidity
Note that the blue line represents Met Office operations at the time and that after 18 April AMSU-B became operational and so the blue line and green line converge.
Note that the blue line represents Met Office operations at the time and that after 18 April AMSU-B became operational and so the blue line and green line converge.
March April
25
24
22
20
18
16
14
12
For
ecas
t - O
bs R
MS
err
or %

12
RH verification for the UK April 2000-Jan 2002
Performance for Mesoscale model area is consistently higher in Apr 2001-> than April 2000-Mar 2001 (so far…)
Global model
(red = longer data cut-off)
Mesoscale model
500 hPa RH v radiosondes at T+12
13
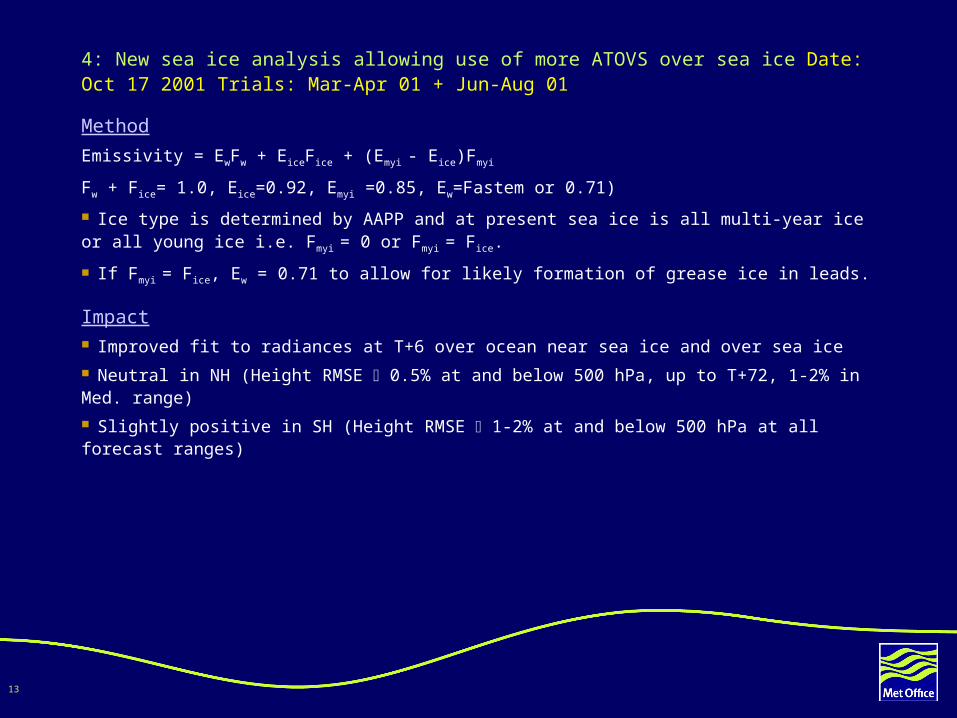
4: New sea ice analysis allowing use of more ATOVS over sea ice Date: Oct 17 2001 Trials: Mar-Apr 01 + Jun-Aug 01
Method
Emissivity = EwFw + EiceFice + (Emyi - Eice)Fmyi
Fw + Fice= 1.0, Eice=0.92, Emyi =0.85, Ew=Fastem or 0.71)
Ice type is determined by AAPP and at present sea ice is all multi-year ice or all young ice i.e. Fmyi = 0 or Fmyi = Fice.
If Fmyi = Fice, Ew = 0.71 to allow for likely formation of grease ice in leads.
Impact Improved fit to radiances at T+6 over ocean near sea ice and over sea ice Neutral in NH (Height RMSE 0.5% at and below 500 hPa, up to T+72, 1-2% in Med. range) Slightly positive in SH (Height RMSE 1-2% at and below 500 hPa at all forecast ranges)

14
5: Modify ATOVS thinning to increase number of cloudy obs assimilated Date: 17 October 2001 Trials: Mar-Apr 01 + Jun-Aug 01
Method
Favour observations where microwave cloud check detects no cloud, but infra-red cloud check detects cloud. Why? Model background errors are found to be systematically higher in cloudy areas.
Impact Very positive at short range (T+6) in fit to radiances and also radiosondes. Height RMSE 2-3% T+24 to T+48 in SH, 1-2% in NH Neutral at T+72 to T+144 and in tropics
** **
* * ** * ****
*
*
?
* ****
***** ***
15
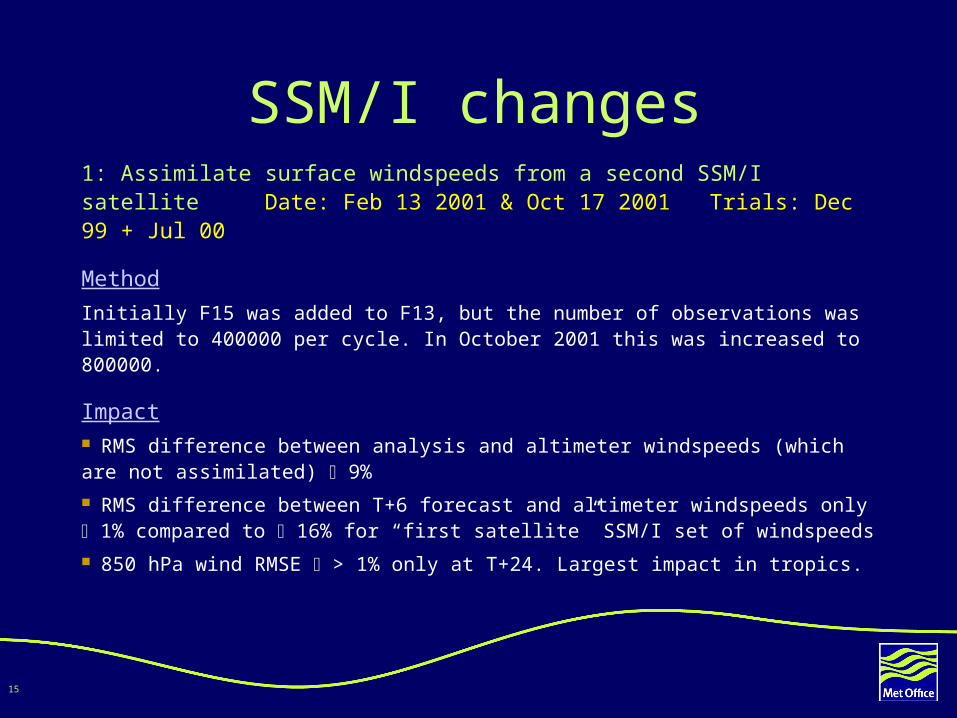
SSM/I changes1: Assimilate surface windspeeds from a second SSM/I satellite Date: Feb 13 2001 & Oct 17 2001 Trials: Dec 99 + Jul 00
Method
Initially F15 was added to F13, but the number of observations was limited to 400000 per cycle. In October 2001 this was increased to 800000.
Impact RMS difference between analysis and altimeter windspeeds (which are not assimilated) 9% RMS difference between T+6 forecast and altimeter windspeeds only 1% compared to 16% for “first satellite” SSM/I set of windspeeds 850 hPa wind RMSE > 1% only at T+24. Largest impact in tropics.

16
Work in progress AMSU-B in the Met Office Mesoscale Model
– see poster Jones et al. presented by me.
Move ATOVS bias correction into 3D-var with new predictors
Preparation for SSMIS Cloud analysis in 1D-var and 3D-var
– see poster by English and Weng presented by me.
Improved use of ATOVS over sea ice
– still reject too much ATOVS over sea ice.
ATOVS over land
– no significant progress since last ITSC.
Total column water vapour from SSM/I
17
Conclusions NOAA-16 and AMSU-B gave a major improvement in NWP skill and
the second ATOVS satellite now gives a large and measurable impact, even in the NH.
Tuning of 3D-var and regular improvements to ATOVS and SSM/I processing mean that Met Office global forecasts are improving very rapidly (last 3 years improvement = previous 9 years at Met Office, sum of small changes since ATOVS+3Dvar introduced now twice the impact of the original change).
Final thought…data denial experiments at the Met Office confirm ECMWF result that satellite data impact is comparable with conventional data impact even in the NH.