Embed Size (px)
Citation preview
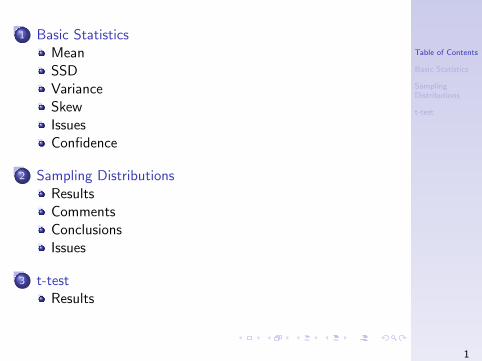
Table of Contents
Basic Statistics
SamplingDistributions
t-test
1 Basic StatisticsMeanSSDVarianceSkewIssuesConfidence
2 Sampling DistributionsResultsCommentsConclusionsIssues
3 t-testResults
1
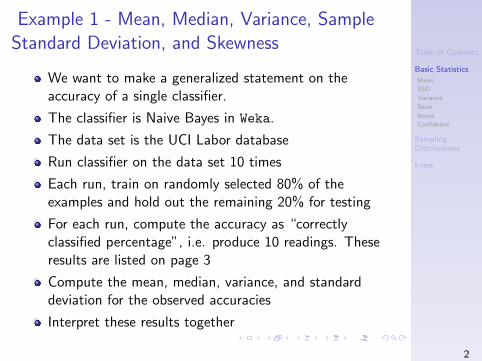
Table of Contents
Basic Statistics
Mean
SSD
Variance
Skew
Issues
Confidence
SamplingDistributions
t-test
Example 1 - Mean, Median, Variance, SampleStandard Deviation, and Skewness
We want to make a generalized statement on theaccuracy of a single classifier.
The classifier is Naive Bayes in Weka.
The data set is the UCI Labor database
Run classifier on the data set 10 times
Each run, train on randomly selected 80% of theexamples and hold out the remaining 20% for testing
For each run, compute the accuracy as “correctlyclassified percentage”, i.e. produce 10 readings. Theseresults are listed on page 3
Compute the mean, median, variance, and standarddeviation for the observed accuracies
Interpret these results together
2
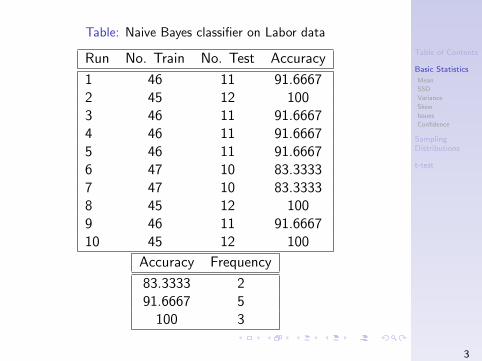
Table of Contents
Basic Statistics
Mean
SSD
Variance
Skew
Issues
Confidence
SamplingDistributions
t-test
Table: Naive Bayes classifier on Labor data
Run No. Train No. Test Accuracy
1 46 11 91.66672 45 12 1003 46 11 91.66674 46 11 91.66675 46 11 91.66676 47 10 83.33337 47 10 83.33338 45 12 1009 46 11 91.666710 45 12 100
Accuracy Frequency
83.3333 291.6667 5
100 3
3
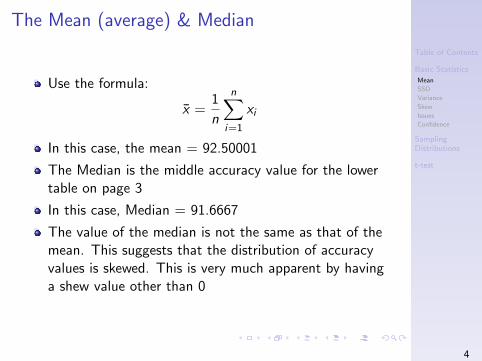
Table of Contents
Basic Statistics
Mean
SSD
Variance
Skew
Issues
Confidence
SamplingDistributions
t-test
The Mean (average) & Median
Use the formula:
x̄ =1
n
n∑i=1
xi
In this case, the mean = 92.50001
The Median is the middle accuracy value for the lowertable on page 3
In this case, Median = 91.6667
The value of the median is not the same as that of themean. This suggests that the distribution of accuracyvalues is skewed. This is very much apparent by havinga shew value other than 0
4
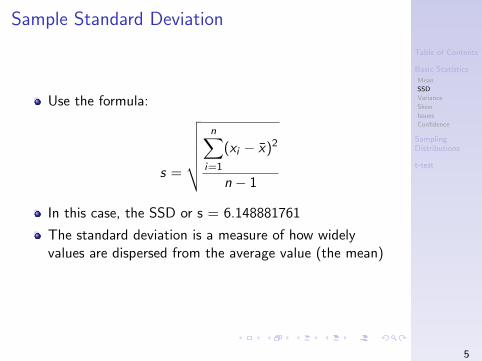
Table of Contents
Basic Statistics
Mean
SSD
Variance
Skew
Issues
Confidence
SamplingDistributions
t-test
Sample Standard Deviation
Use the formula:
s =
√√√√√√n∑
i=1
(xi − x̄)2
n − 1
In this case, the SSD or s = 6.148881761
The standard deviation is a measure of how widelyvalues are dispersed from the average value (the mean)
5
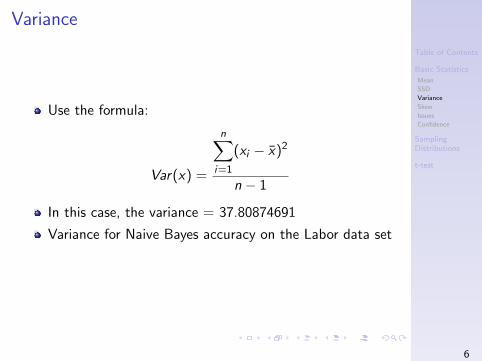
Table of Contents
Basic Statistics
Mean
SSD
Variance
Skew
Issues
Confidence
SamplingDistributions
t-test
Variance
Use the formula:
Var(x) =
n∑i=1
(xi − x̄)2
n − 1
In this case, the variance = 37.80874691
Variance for Naive Bayes accuracy on the Labor data set
6
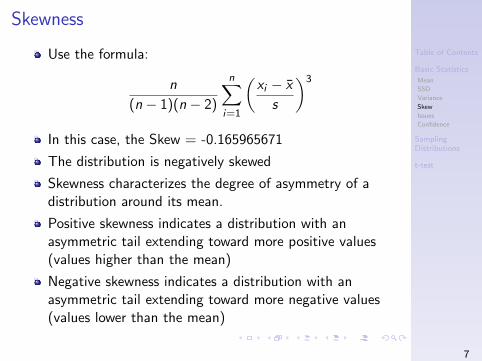
Table of Contents
Basic Statistics
Mean
SSD
Variance
Skew
Issues
Confidence
SamplingDistributions
t-test
Skewness
Use the formula:
n
(n − 1)(n − 2)
n∑i=1
(xi − x̄
s
)3
In this case, the Skew = -0.165965671
The distribution is negatively skewed
Skewness characterizes the degree of asymmetry of adistribution around its mean.
Positive skewness indicates a distribution with anasymmetric tail extending toward more positive values(values higher than the mean)
Negative skewness indicates a distribution with anasymmetric tail extending toward more negative values(values lower than the mean)
7
Table of Contents
Basic Statistics
Mean
SSD
Variance
Skew
Issues
Confidence
SamplingDistributions
t-test
Issues - Sample Size
How many runs do we need to present results that arereliable? Well, there is no obvious answer, however weused a rule of thumb here. Our rule is to never use datapoints fewer than 10. This is based on a statisticaladvice to use a minimum number of n to be 10 orgreater
In this example, we applied this rule of thumb twice,once for the number of test examples (we randomlyselected at least 10 examples to test) and we performedat least 10 random runs. Is this sufficient? We reckonthis is the least.
8
Table of Contents
Basic Statistics
Mean
SSD
Variance
Skew
Issues
Confidence
SamplingDistributions
t-test
Issues - Distribution
What are our assumptions?
We implicitly assumed that these values are normallydistributed and we measured their mean, median,variance, and skewness.
Is this really true? The answer at this point is “notsure” because we have no evidence to support this
If we repeat this experiment a million times will weobtain a normal distribution? According to our results, itmay not be the case, the distribution is skewed.
However, based on central limit theorem and samplingdistribution, we know that the distribution of samplemeans is approximately normal.
Can we use this to address this issue? (later!)
9
Table of Contents
Basic Statistics
Mean
SSD
Variance
Skew
Issues
Confidence
SamplingDistributions
t-test
Issues - Confidence
What about confidence?
How reliable are these numbers?
We use a statistical method to compute confidence
10
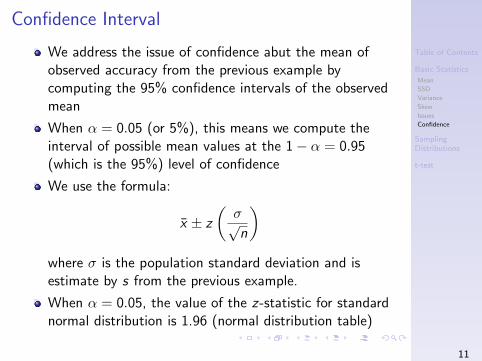
Table of Contents
Basic Statistics
Mean
SSD
Variance
Skew
Issues
Confidence
SamplingDistributions
t-test
Confidence Interval
We address the issue of confidence abut the mean ofobserved accuracy from the previous example bycomputing the 95% confidence intervals of the observedmean
When α = 0.05 (or 5%), this means we compute theinterval of possible mean values at the 1− α = 0.95(which is the 95%) level of confidence
We use the formula:
x̄ ± z
(σ√n
)where σ is the population standard deviation and isestimate by s from the previous example.
When α = 0.05, the value of the z-statistic for standardnormal distribution is 1.96 (normal distribution table)
11
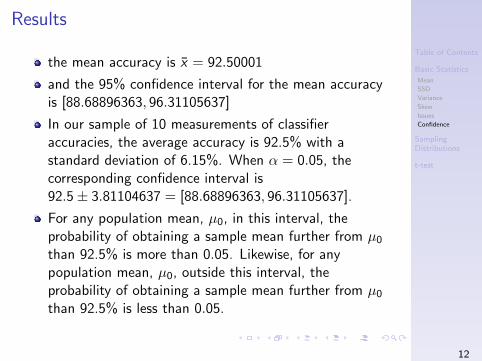
Table of Contents
Basic Statistics
Mean
SSD
Variance
Skew
Issues
Confidence
SamplingDistributions
t-test
Results
the mean accuracy is x̄ = 92.50001
and the 95% confidence interval for the mean accuracyis [88.68896363, 96.31105637]
In our sample of 10 measurements of classifieraccuracies, the average accuracy is 92.5% with astandard deviation of 6.15%. When α = 0.05, thecorresponding confidence interval is92.5± 3.81104637 = [88.68896363, 96.31105637].
For any population mean, µ0, in this interval, theprobability of obtaining a sample mean further from µ0
than 92.5% is more than 0.05. Likewise, for anypopulation mean, µ0, outside this interval, theprobability of obtaining a sample mean further from µ0
than 92.5% is less than 0.05.
12
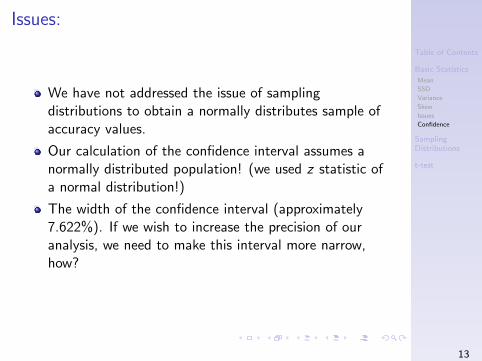
Table of Contents
Basic Statistics
Mean
SSD
Variance
Skew
Issues
Confidence
SamplingDistributions
t-test
Issues:
We have not addressed the issue of samplingdistributions to obtain a normally distributes sample ofaccuracy values.
Our calculation of the confidence interval assumes anormally distributed population! (we used z statistic ofa normal distribution!)
The width of the confidence interval (approximately7.622%). If we wish to increase the precision of ouranalysis, we need to make this interval more narrow,how?
13
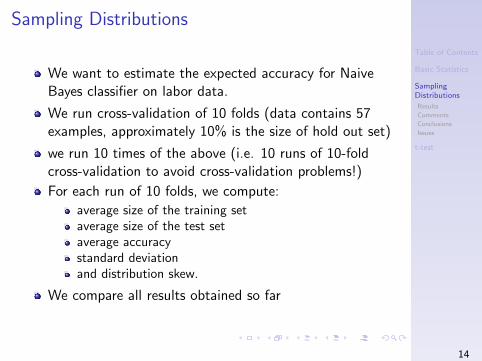
Table of Contents
Basic Statistics
SamplingDistributions
Results
Comments
Conclusions
Issues
t-test
Sampling Distributions
We want to estimate the expected accuracy for NaiveBayes classifier on labor data.
We run cross-validation of 10 folds (data contains 57examples, approximately 10% is the size of hold out set)
we run 10 times of the above (i.e. 10 runs of 10-foldcross-validation to avoid cross-validation problems!)
For each run of 10 folds, we compute:
average size of the training setaverage size of the test setaverage accuracystandard deviationand distribution skew.
We compare all results obtained so far
14
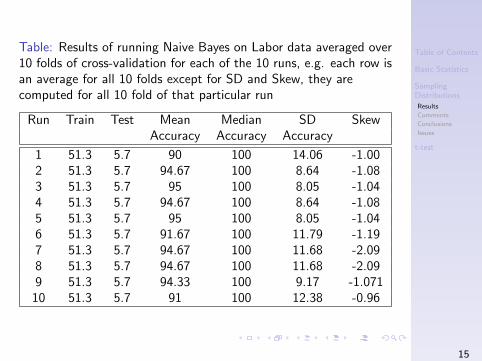
Table of Contents
Basic Statistics
SamplingDistributions
Results
Comments
Conclusions
Issues
t-test
Table: Results of running Naive Bayes on Labor data averaged over10 folds of cross-validation for each of the 10 runs, e.g. each row isan average for all 10 folds except for SD and Skew, they arecomputed for all 10 fold of that particular run
Run Train Test Mean Median SD SkewAccuracy Accuracy Accuracy
1 51.3 5.7 90 100 14.06 -1.002 51.3 5.7 94.67 100 8.64 -1.083 51.3 5.7 95 100 8.05 -1.044 51.3 5.7 94.67 100 8.64 -1.085 51.3 5.7 95 100 8.05 -1.046 51.3 5.7 91.67 100 11.79 -1.197 51.3 5.7 94.67 100 11.68 -2.098 51.3 5.7 94.67 100 11.68 -2.099 51.3 5.7 94.33 100 9.17 -1.07110 51.3 5.7 91 100 12.38 -0.96
15
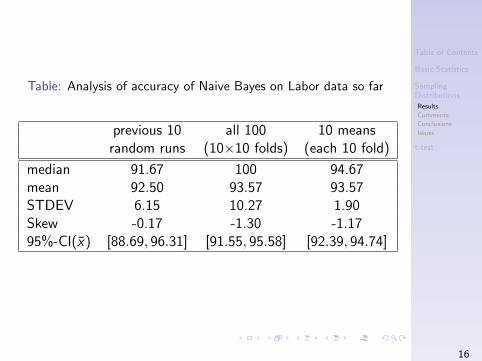
Table of Contents
Basic Statistics
SamplingDistributions
Results
Comments
Conclusions
Issues
t-test
Table: Analysis of accuracy of Naive Bayes on Labor data so far
previous 10 all 100 10 meansrandom runs (10×10 folds) (each 10 fold)
median 91.67 100 94.67mean 92.50 93.57 93.57STDEV 6.15 10.27 1.90Skew -0.17 -1.30 -1.1795%-CI(x̄) [88.69, 96.31] [91.55, 95.58] [92.39, 94.74]
16
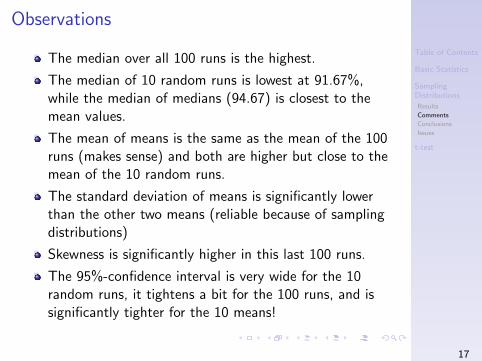
Table of Contents
Basic Statistics
SamplingDistributions
Results
Comments
Conclusions
Issues
t-test
Observations
The median over all 100 runs is the highest.
The median of 10 random runs is lowest at 91.67%,while the median of medians (94.67) is closest to themean values.
The mean of means is the same as the mean of the 100runs (makes sense) and both are higher but close to themean of the 10 random runs.
The standard deviation of means is significantly lowerthan the other two means (reliable because of samplingdistributions)
Skewness is significantly higher in this last 100 runs.
The 95%-confidence interval is very wide for the 10random runs, it tightens a bit for the 100 runs, and issignificantly tighter for the 10 means!
17
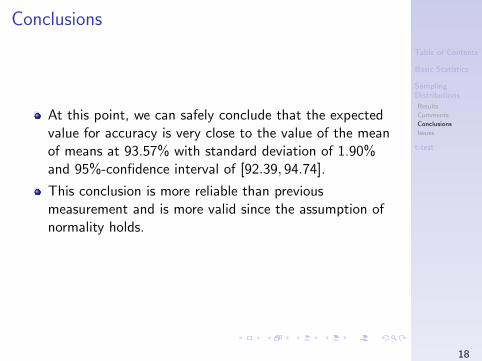
Table of Contents
Basic Statistics
SamplingDistributions
Results
Comments
Conclusions
Issues
t-test
Conclusions
At this point, we can safely conclude that the expectedvalue for accuracy is very close to the value of the meanof means at 93.57% with standard deviation of 1.90%and 95%-confidence interval of [92.39, 94.74].
This conclusion is more reliable than previousmeasurement and is more valid since the assumption ofnormality holds.
18
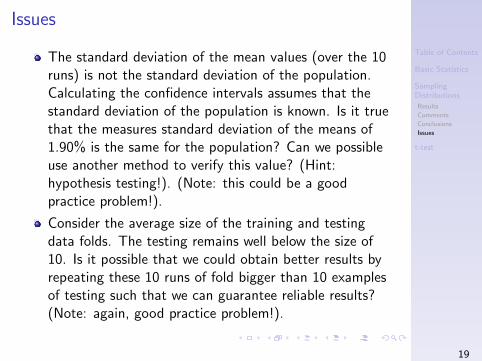
Table of Contents
Basic Statistics
SamplingDistributions
Results
Comments
Conclusions
Issues
t-test
Issues
The standard deviation of the mean values (over the 10runs) is not the standard deviation of the population.Calculating the confidence intervals assumes that thestandard deviation of the population is known. Is it truethat the measures standard deviation of the means of1.90% is the same for the population? Can we possibleuse another method to verify this value? (Hint:hypothesis testing!). (Note: this could be a goodpractice problem!).
Consider the average size of the training and testingdata folds. The testing remains well below the size of10. Is it possible that we could obtain better results byrepeating these 10 runs of fold bigger than 10 examplesof testing such that we can guarantee reliable results?(Note: again, good practice problem!).
19
Table of Contents
Basic Statistics
SamplingDistributions
t-test
Results
The problem
We are interested in knowing whether or not thedifference in accuracy obtained by Naive bayes classifierto that obtained by a decision tree (J48) is statisticallysignificant.
We run 20 times using random split of training andtesting
We record accuracis for both classifiers and obtain theirdifference for each run
20
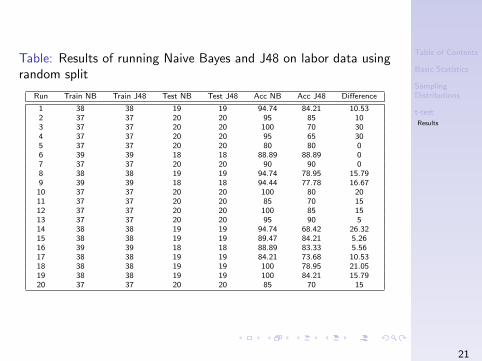
Table of Contents
Basic Statistics
SamplingDistributions
t-test
Results
Table: Results of running Naive Bayes and J48 on labor data usingrandom split
Run Train NB Train J48 Test NB Test J48 Acc NB Acc J48 Difference
1 38 38 19 19 94.74 84.21 10.532 37 37 20 20 95 85 103 37 37 20 20 100 70 304 37 37 20 20 95 65 305 37 37 20 20 80 80 06 39 39 18 18 88.89 88.89 07 37 37 20 20 90 90 08 38 38 19 19 94.74 78.95 15.799 39 39 18 18 94.44 77.78 16.6710 37 37 20 20 100 80 2011 37 37 20 20 85 70 1512 37 37 20 20 100 85 1513 37 37 20 20 95 90 514 38 38 19 19 94.74 68.42 26.3215 38 38 19 19 89.47 84.21 5.2616 39 39 18 18 88.89 83.33 5.5617 38 38 19 19 84.21 73.68 10.5318 38 38 19 19 100 78.95 21.0519 38 38 19 19 100 84.21 15.7920 37 37 20 20 85 70 15
21
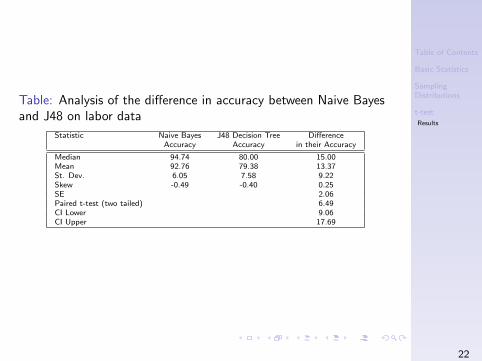
Table of Contents
Basic Statistics
SamplingDistributions
t-test
Results
Table: Analysis of the difference in accuracy between Naive Bayesand J48 on labor data
Statistic Naive Bayes J48 Decision Tree DifferenceAccuracy Accuracy in their Accuracy
Median 94.74 80.00 15.00Mean 92.76 79.38 13.37St. Dev. 6.05 7.58 9.22Skew -0.49 -0.40 0.25SE 2.06Paired t-test (two tailed) 6.49CI Lower 9.06CI Upper 17.69
22