Embed Size (px)
Citation preview

1
Chapter 13
Capital Budgeting: Decision Criteria
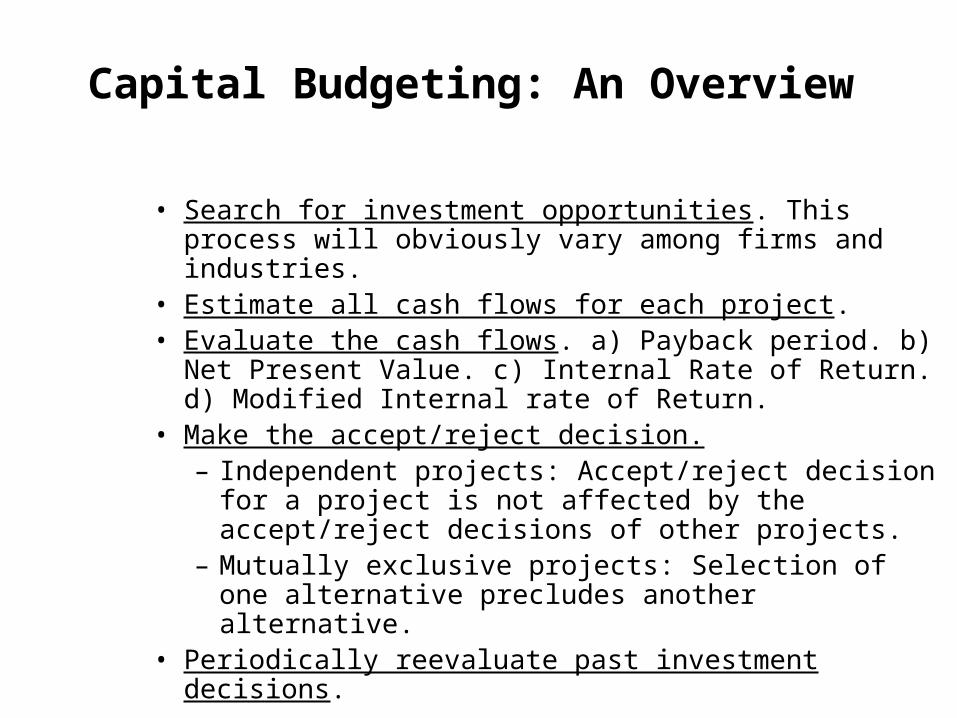
Capital Budgeting: An Overview
• Search for investment opportunities. This process will obviously vary among firms and industries.
• Estimate all cash flows for each project.• Evaluate the cash flows. a) Payback period. b) Net Present
Value. c) Internal Rate of Return. d) Modified Internal rate of Return.
• Make the accept/reject decision.– Independent projects: Accept/reject decision for a
project is not affected by the accept/reject decisions of other projects.
– Mutually exclusive projects: Selection of one alternative precludes another alternative.
• Periodically reevaluate past investment decisions.
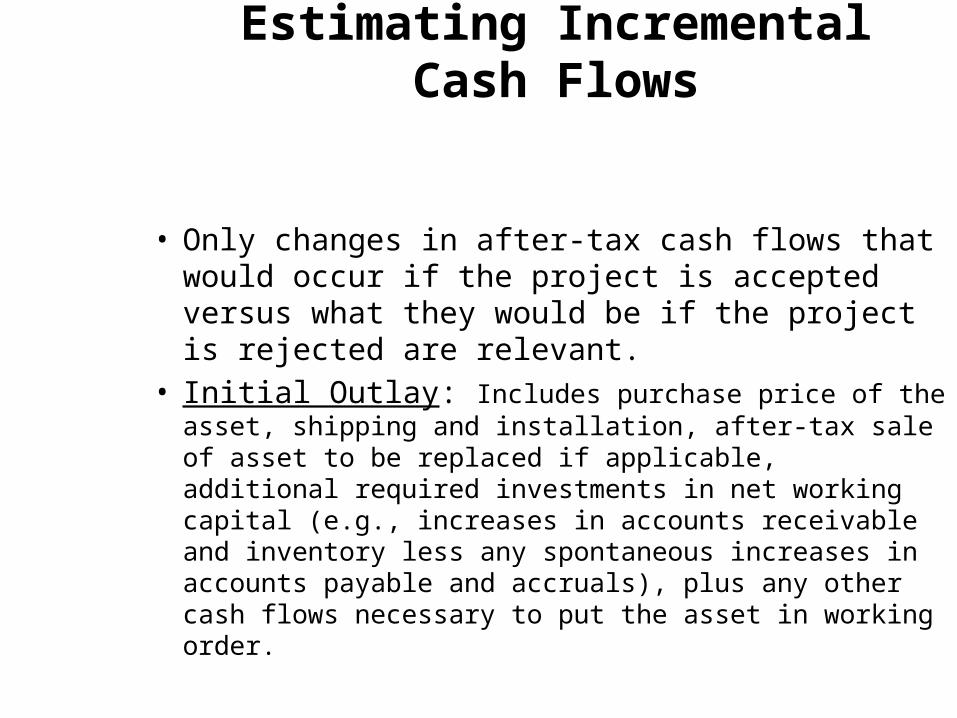
Estimating Incremental Cash Flows
• Only changes in after-tax cash flows that would occur if the project is accepted versus what they would be if the project is rejected are relevant.
• Initial Outlay: Includes purchase price of the asset, shipping and installation, after-tax sale of asset to be replaced if applicable, additional required investments in net working capital (e.g., increases in accounts receivable and inventory less any spontaneous increases in accounts payable and accruals), plus any other cash flows necessary to put the asset in working order.
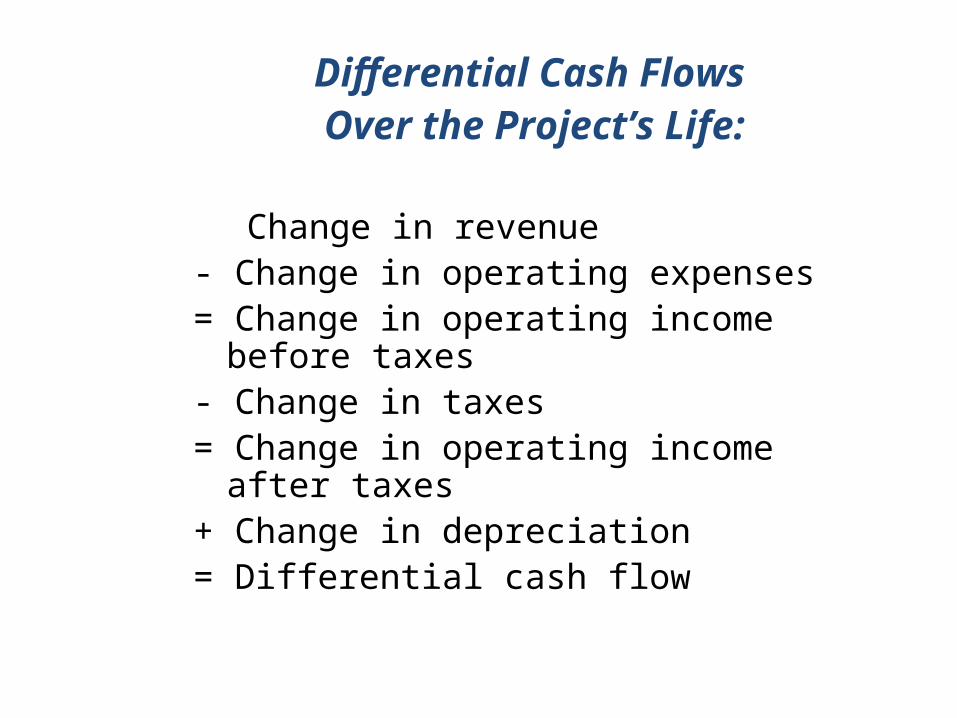
Differential Cash Flows Over the Project’s Life:
Change in revenue - Change in operating expenses= Change in operating income before taxes- Change in taxes= Change in operating income after taxes+ Change in depreciation= Differential cash flow
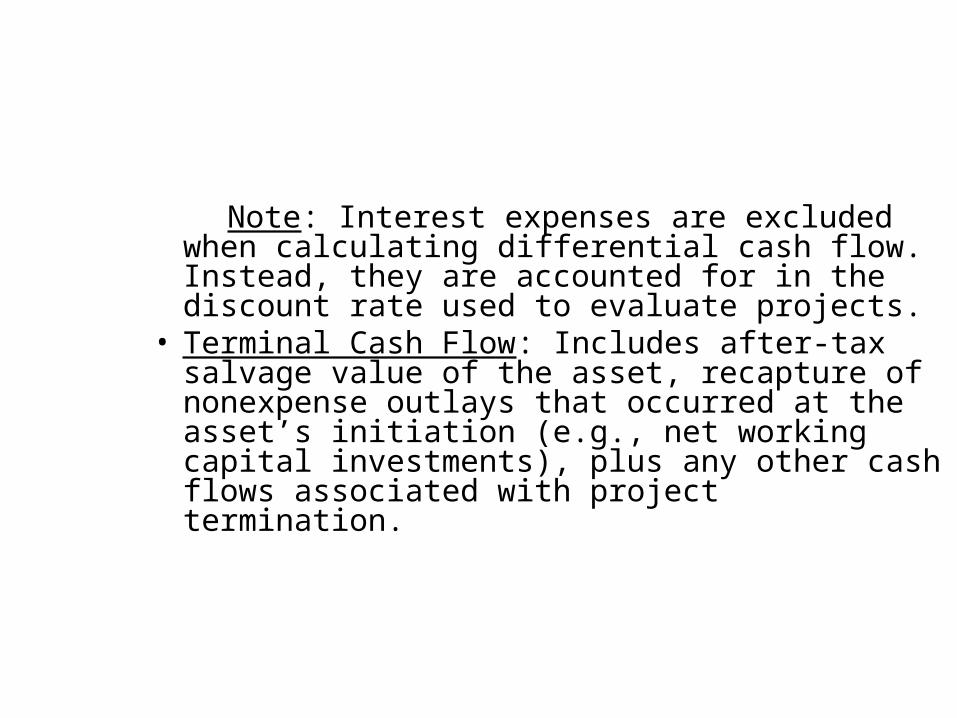
Note: Interest expenses are excluded when calculating differential cash flow. Instead, they are accounted for in the discount rate used to evaluate projects.
• Terminal Cash Flow: Includes after-tax salvage value of the asset, recapture of nonexpense outlays that occurred at the asset’s initiation (e.g., net working capital investments), plus any other cash flows associated with project termination.
6
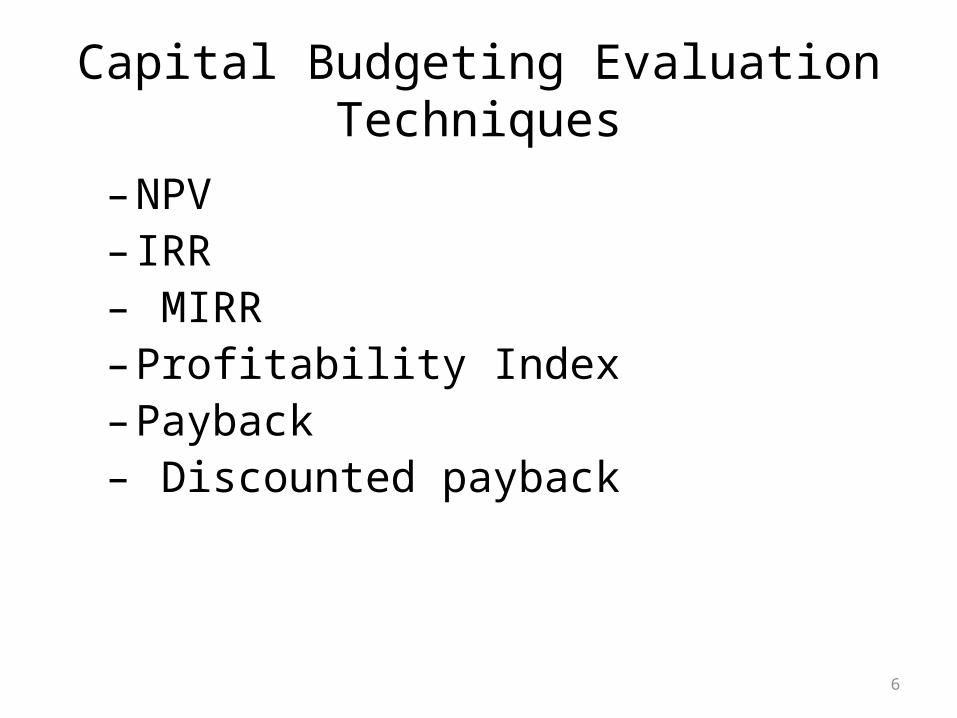
Capital Budgeting Evaluation Techniques
–NPV– IRR– MIRR–Profitability Index–Payback– Discounted payback
7
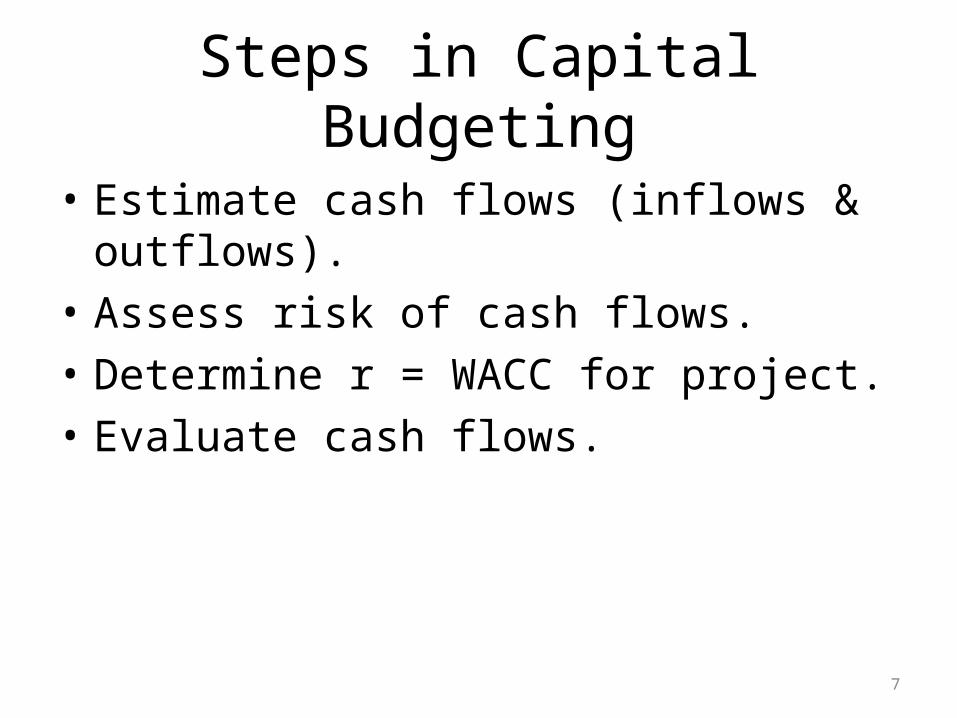
Steps in Capital Budgeting
• Estimate cash flows (inflows & outflows).• Assess risk of cash flows.• Determine r = WACC for project.• Evaluate cash flows.
8
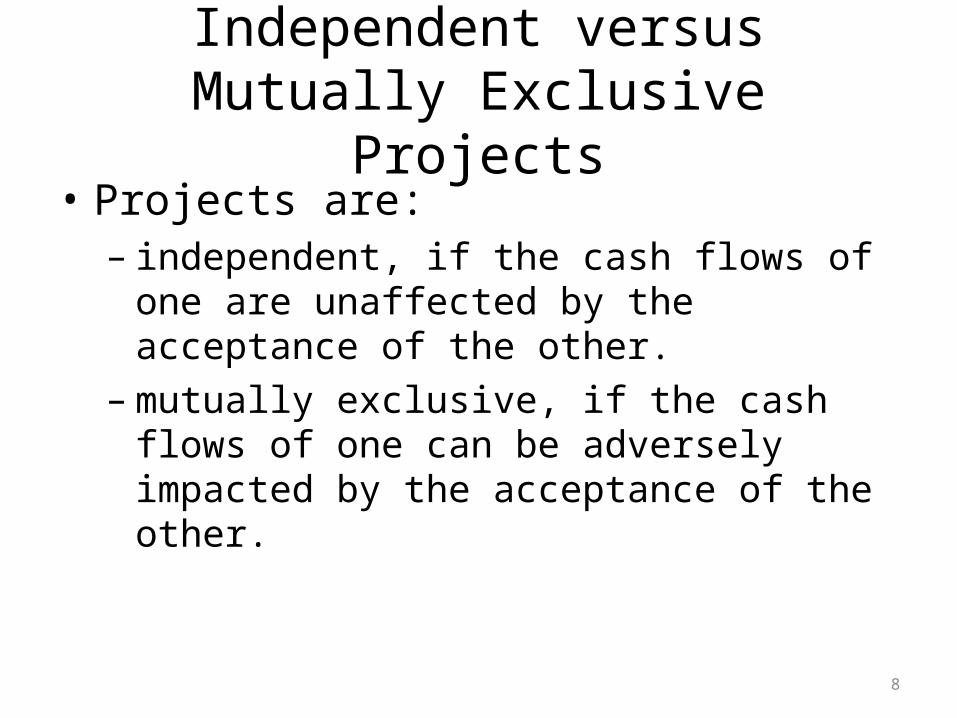
Independent versus Mutually Exclusive Projects
• Projects are:– independent, if the cash flows of one are
unaffected by the acceptance of the other.– mutually exclusive, if the cash flows of one can be
adversely impacted by the acceptance of the other.
9
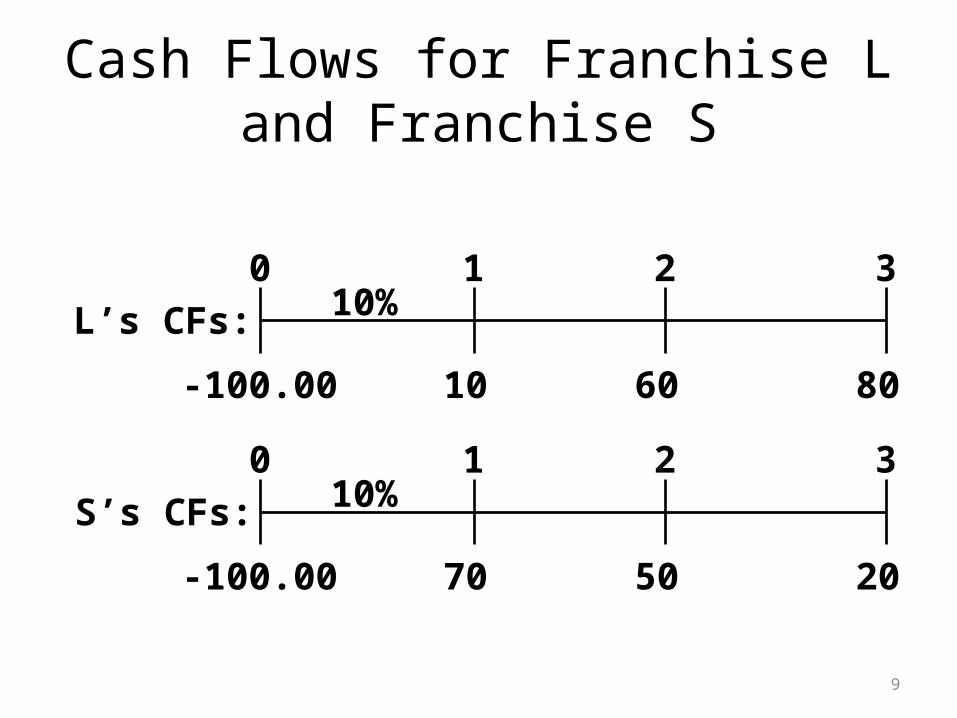
Cash Flows for Franchise L and Franchise S
10 8060
0 1 2 310%L’s CFs:
-100.00
70 2050
0 1 2 310%S’s CFs:
-100.00
10
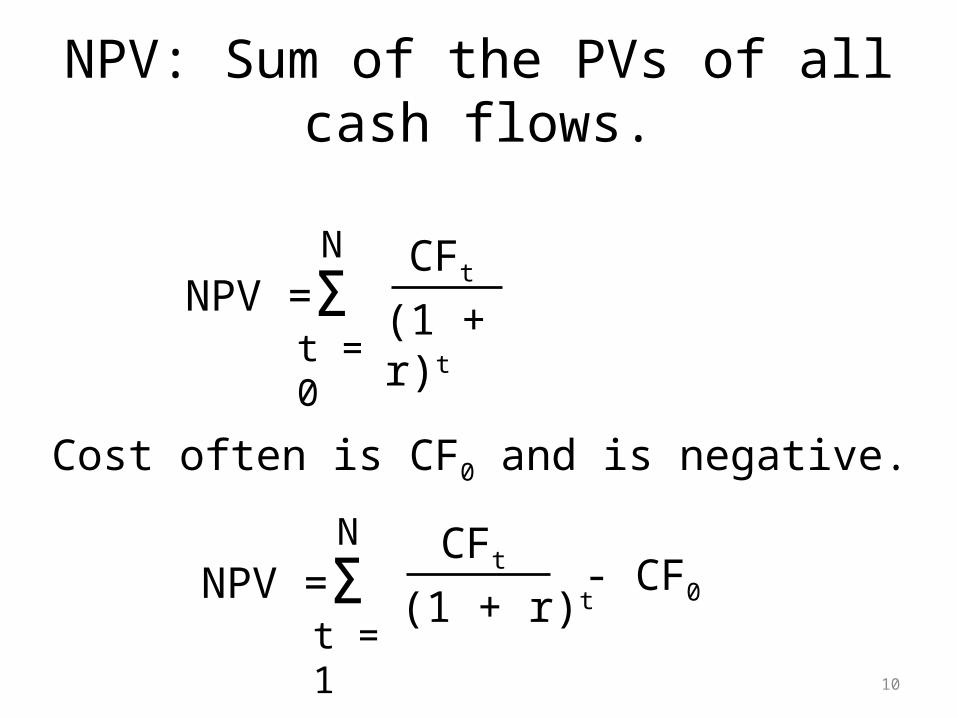
NPV: Sum of the PVs of all cash flows.
Cost often is CF0 and is negative.
NPV = ΣN
t = 0
CFt
(1 + r)t
NPV = ΣN
t = 1
CFt
(1 + r)t- CF0
11
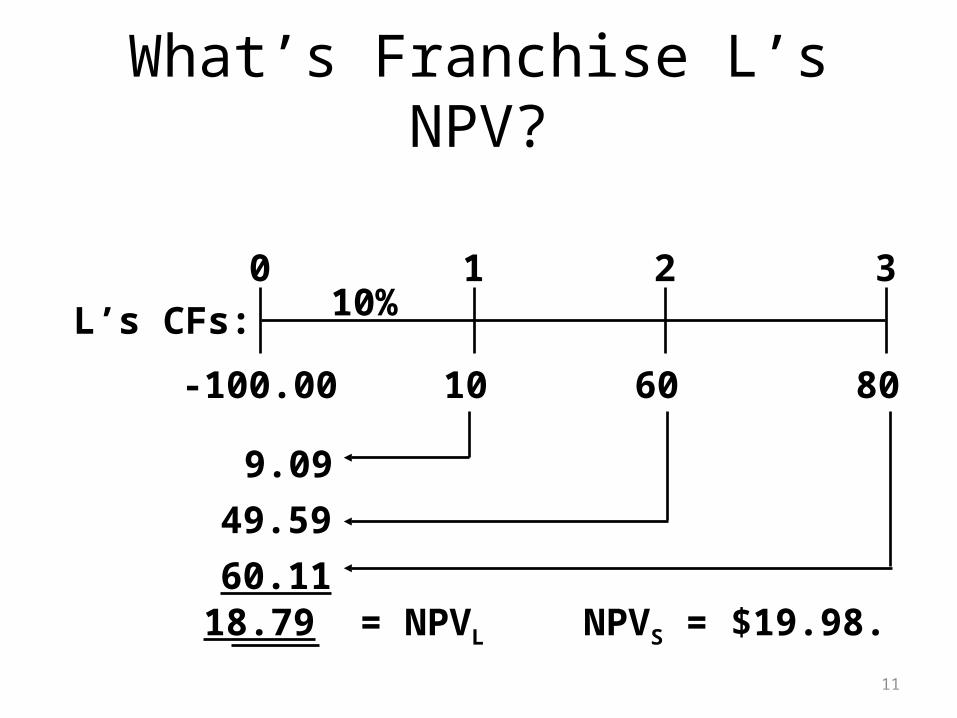
What’s Franchise L’s NPV?
10 8060
0 1 2 310%L’s CFs:
-100.00
9.09
49.59
60.1118.79 = NPVL NPVS = $19.98.
12
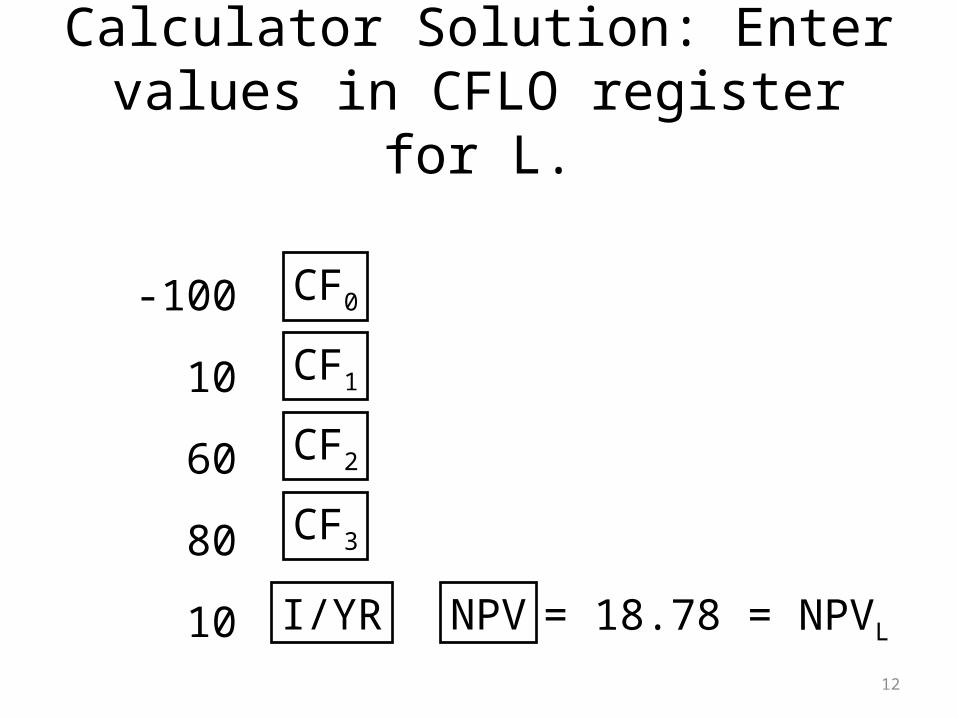
Calculator Solution: Enter values in CFLO register for L.
-100
10
60
80
10
CF0
CF1
NPV
CF2
CF3
I/YR = 18.78 = NPVL
13
Rationale for the NPV Method
• NPV = PV inflows – Cost
• This is net gain in wealth, so accept project if NPV > 0.
• Choose between mutually exclusive projects on basis of higher NPV. Adds most value.
14
Using NPV method, which franchise(s) should be accepted?
• If Franchise S and L are mutually exclusive, accept S because NPVs > NPVL .
• If S & L are independent, accept both; NPV > 0.
15
Internal Rate of Return: IRR
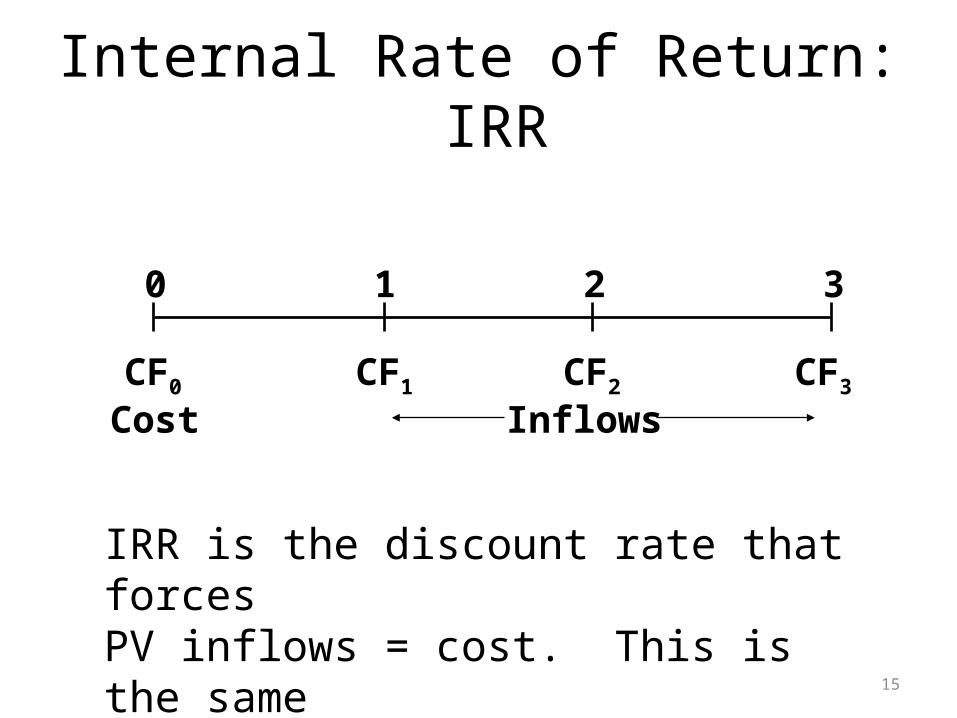
0 1 2 3
CF0 CF1 CF2 CF3
Cost Inflows
IRR is the discount rate that forcesPV inflows = cost. This is the sameas forcing NPV = 0.
16
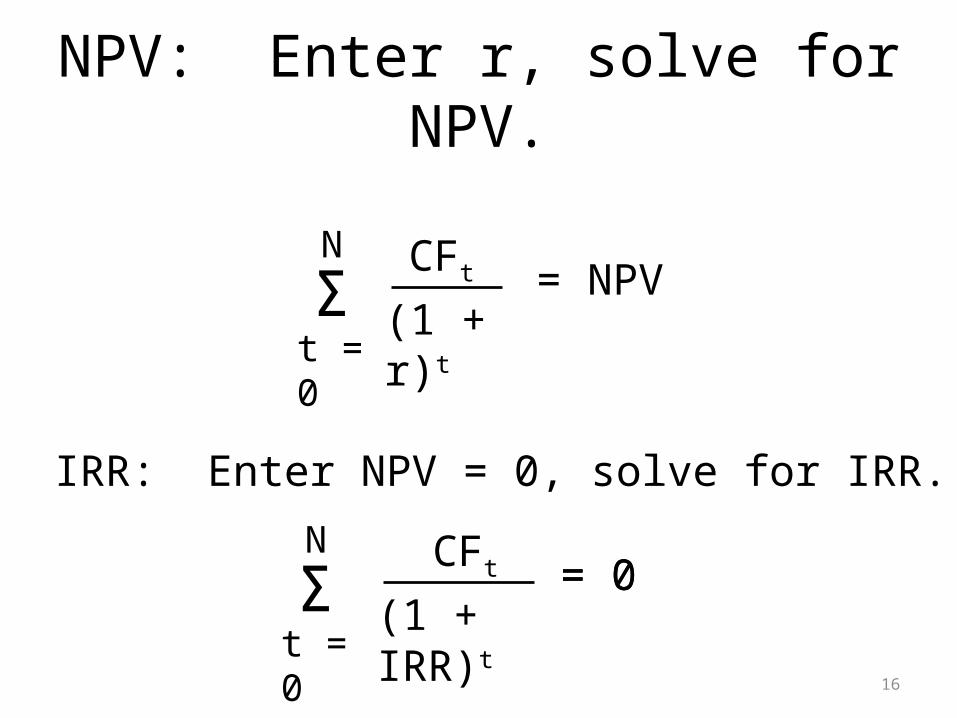
NPV: Enter r, solve for NPV.
IRR: Enter NPV = 0, solve for IRR.
= NPV ΣN
t = 0
CFt
(1 + r)t
= 0 ΣN
t = 0
CFt
(1 + IRR)t= 0
17
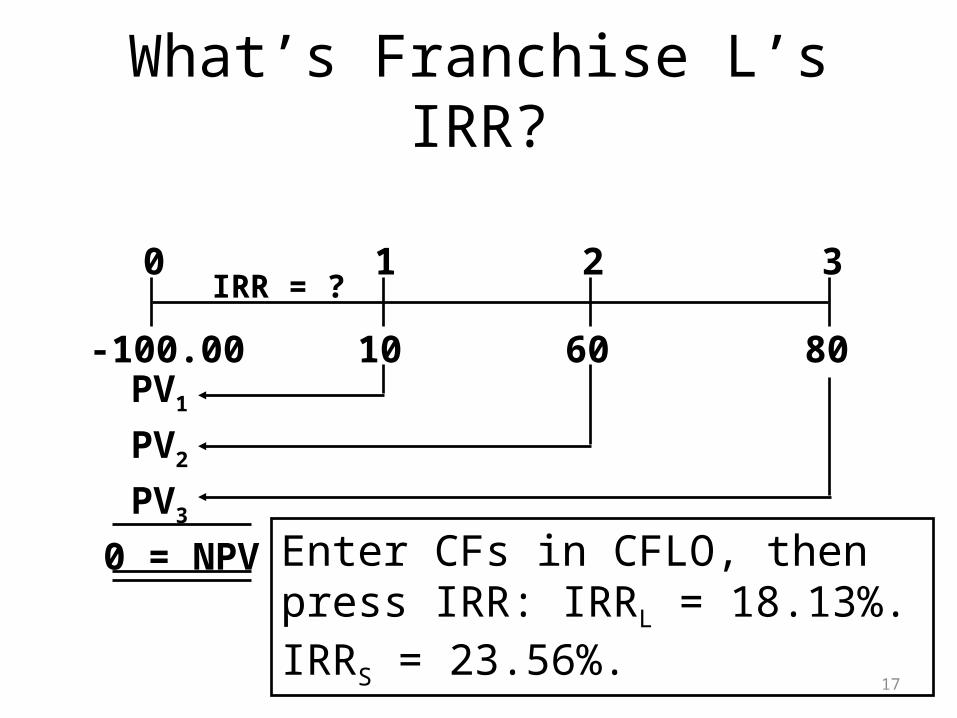
What’s Franchise L’s IRR?
10 8060
0 1 2 3IRR = ?
-100.00
PV3
PV2
PV1
0 = NPV Enter CFs in CFLO, then press IRR: IRRL = 18.13%. IRRS = 23.56%.
18
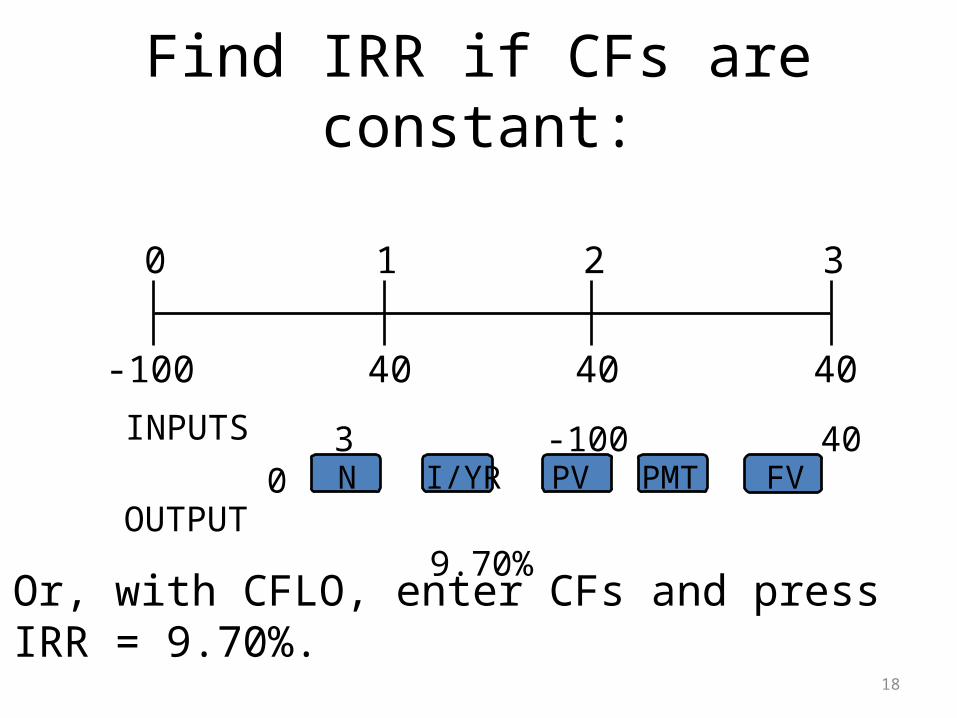
40 40 40
0 1 2 3
-100
Or, with CFLO, enter CFs and press IRR = 9.70%.
3 -100 40 0
9.70%
N I/YR PV PMT FV
INPUTS
OUTPUT
Find IRR if CFs are constant:
19
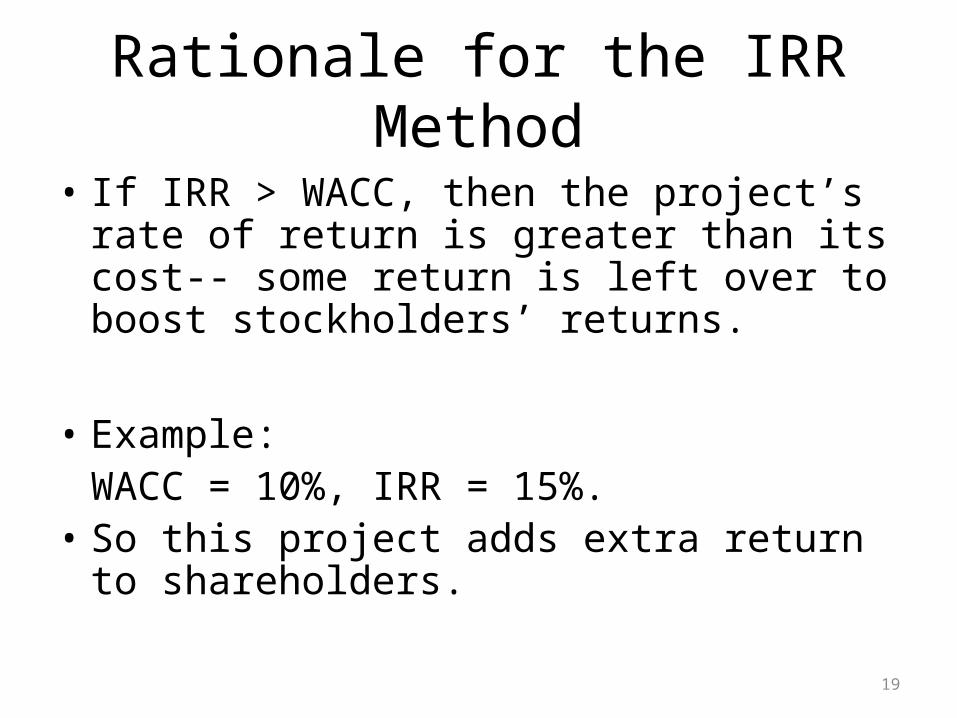
Rationale for the IRR Method
• If IRR > WACC, then the project’s rate of return is greater than its cost-- some return is left over to boost stockholders’ returns.
• Example:WACC = 10%, IRR = 15%.
• So this project adds extra return to shareholders.
20
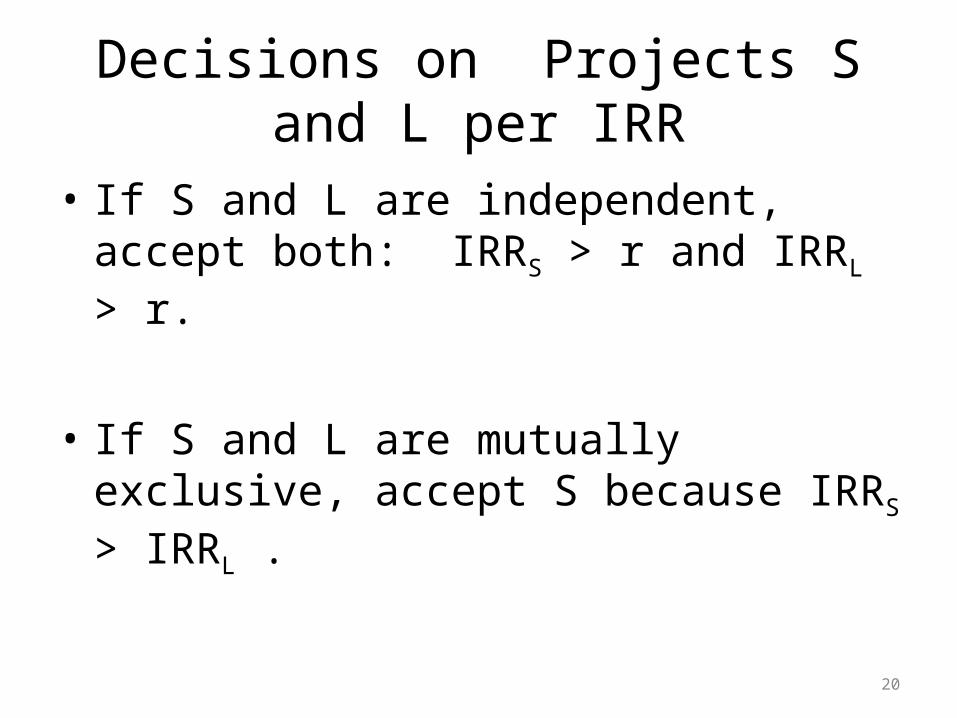
Decisions on Projects S and L per IRR
• If S and L are independent, accept both: IRRS > r and IRRL > r.
• If S and L are mutually exclusive, accept S because IRRS > IRRL .
21
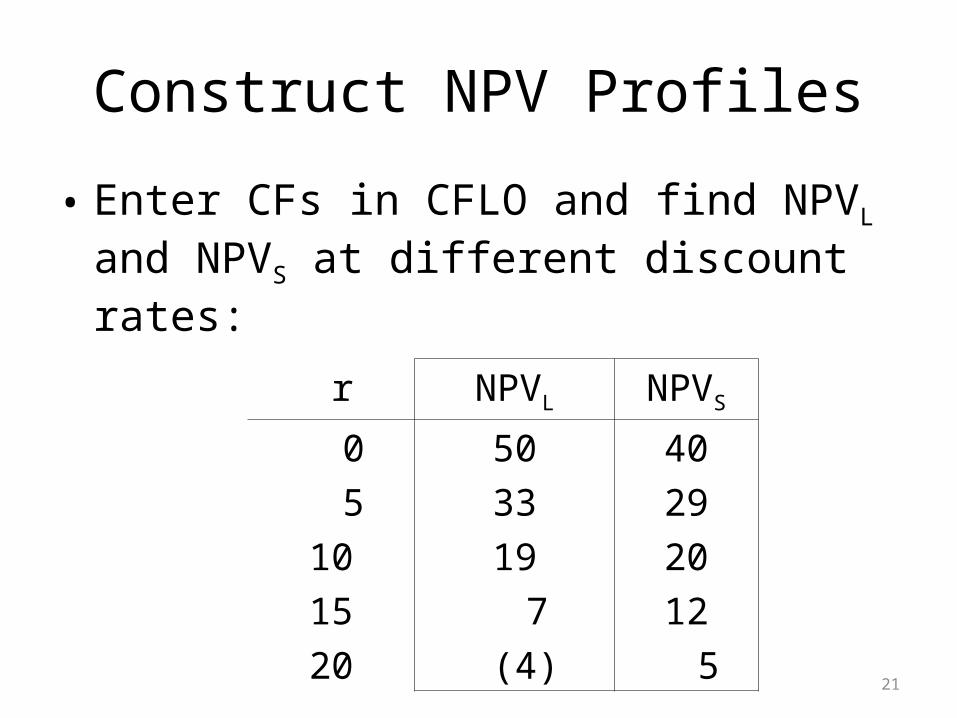
Construct NPV Profiles
• Enter CFs in CFLO and find NPVL and NPVS at different discount rates:
r NPVL NPVS
0 50 40
5 33 29
10 19 20
15 7 12
20 (4) 5
22
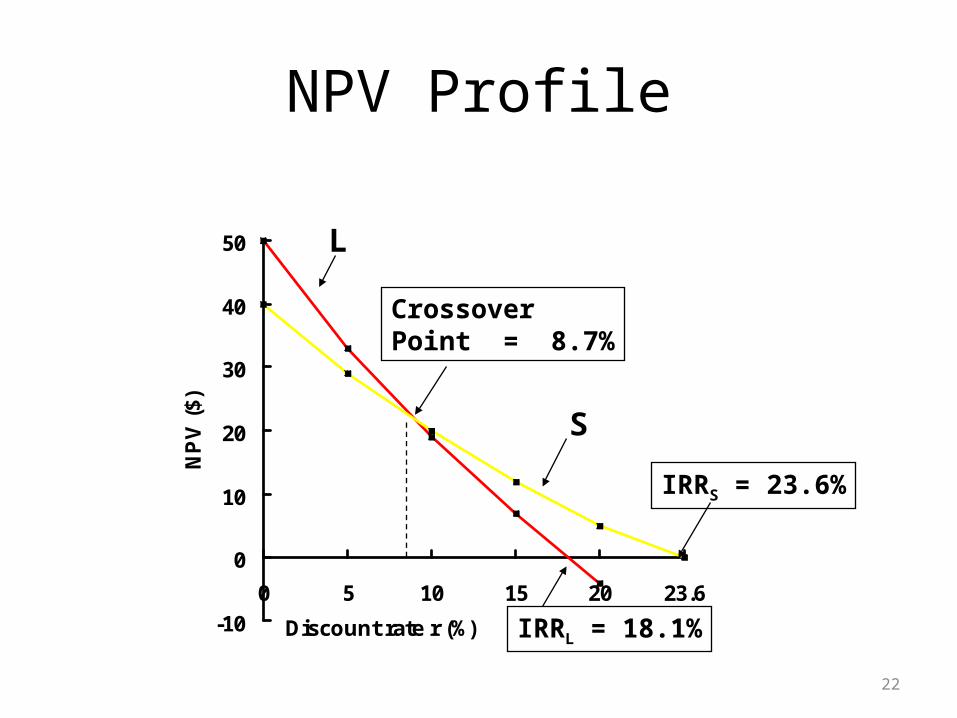
NPV Profile
-10
0
10
20
30
40
50
0 5 10 15 20 23.6
Discount rate r (%)
NP
V (
$)
IRRL = 18.1%
IRRS = 23.6%
Crossover Point = 8.7%
S
L
23
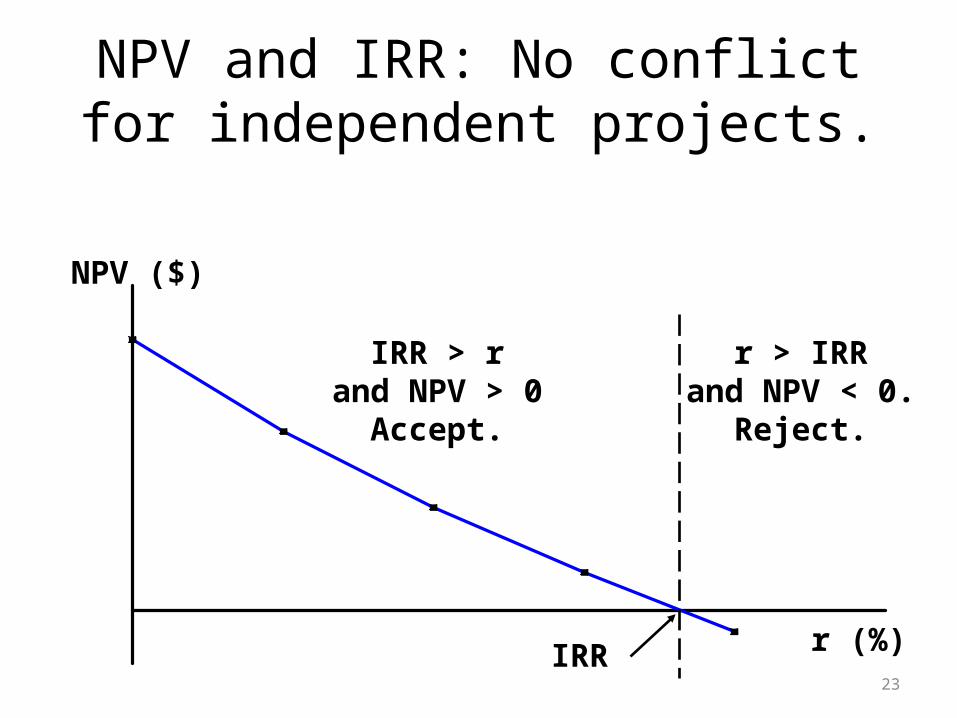
r > IRRand NPV < 0.
Reject.
NPV ($)
r (%)IRR
IRR > rand NPV > 0
Accept.
NPV and IRR: No conflict for independent projects.
24
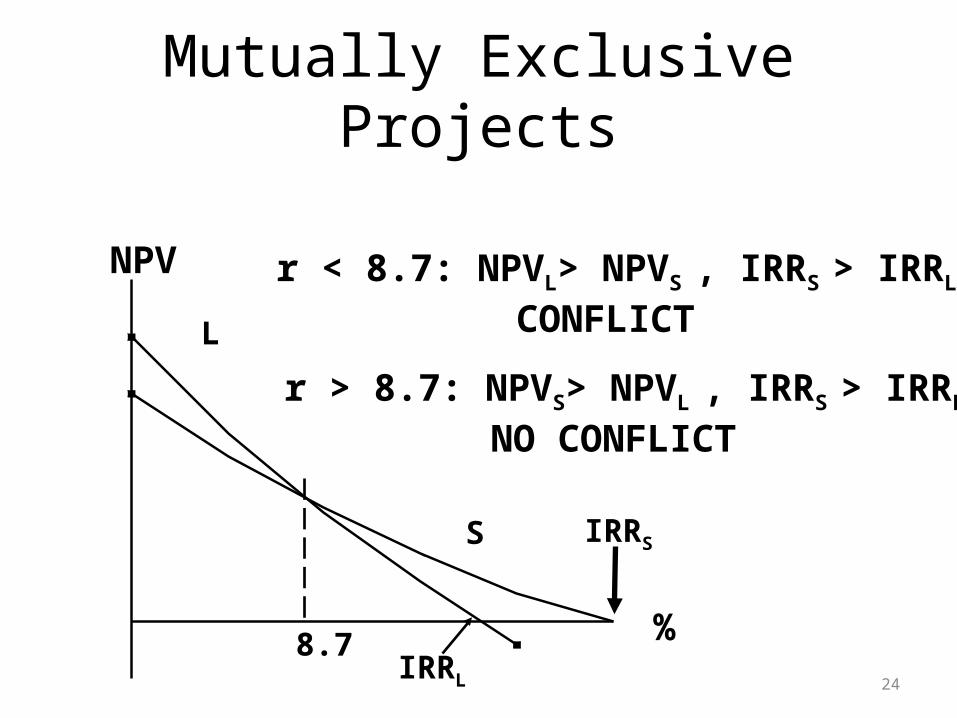
Mutually Exclusive Projects
8.7
NPV
%
IRRS
IRRL
L
S
r < 8.7: NPVL> NPVS , IRRS > IRRL
CONFLICT
r > 8.7: NPVS> NPVL , IRRS > IRRL
NO CONFLICT
25
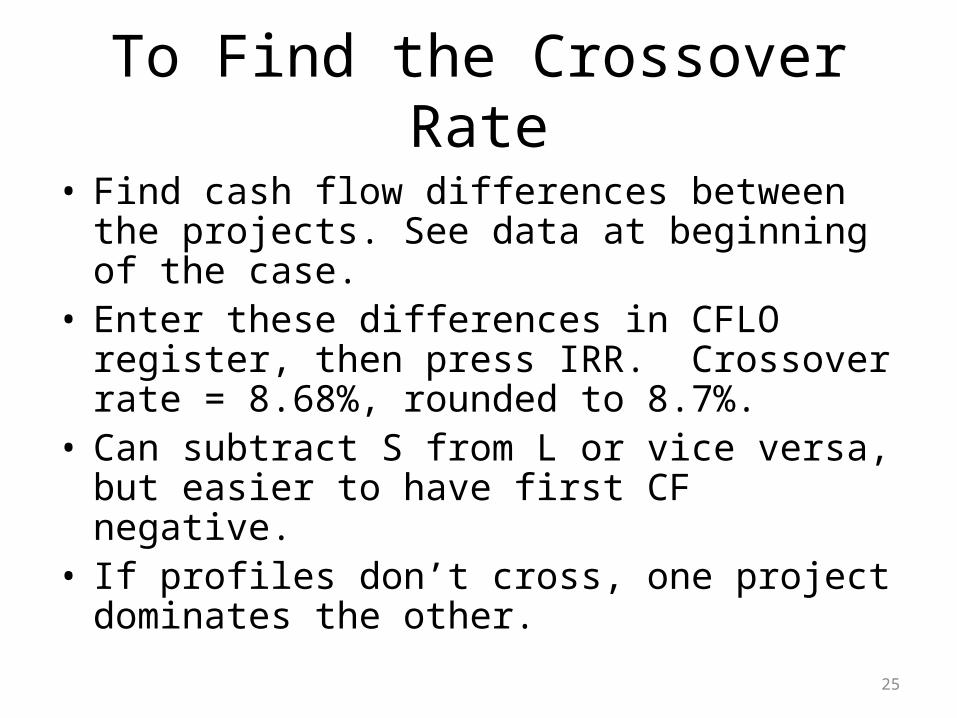
To Find the Crossover Rate
• Find cash flow differences between the projects. See data at beginning of the case.
• Enter these differences in CFLO register, then press IRR. Crossover rate = 8.68%, rounded to 8.7%.
• Can subtract S from L or vice versa, but easier to have first CF negative.
• If profiles don’t cross, one project dominates the other.
26
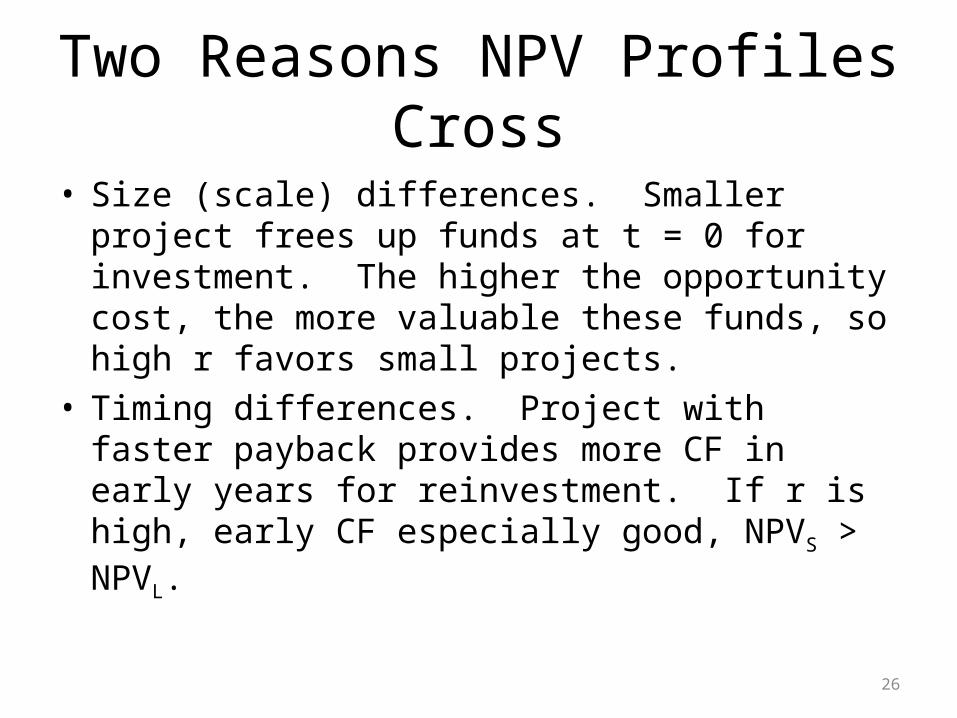
Two Reasons NPV Profiles Cross
• Size (scale) differences. Smaller project frees up funds at t = 0 for investment. The higher the opportunity cost, the more valuable these funds, so high r favors small projects.
• Timing differences. Project with faster payback provides more CF in early years for reinvestment. If r is high, early CF especially good, NPVS > NPVL.
27
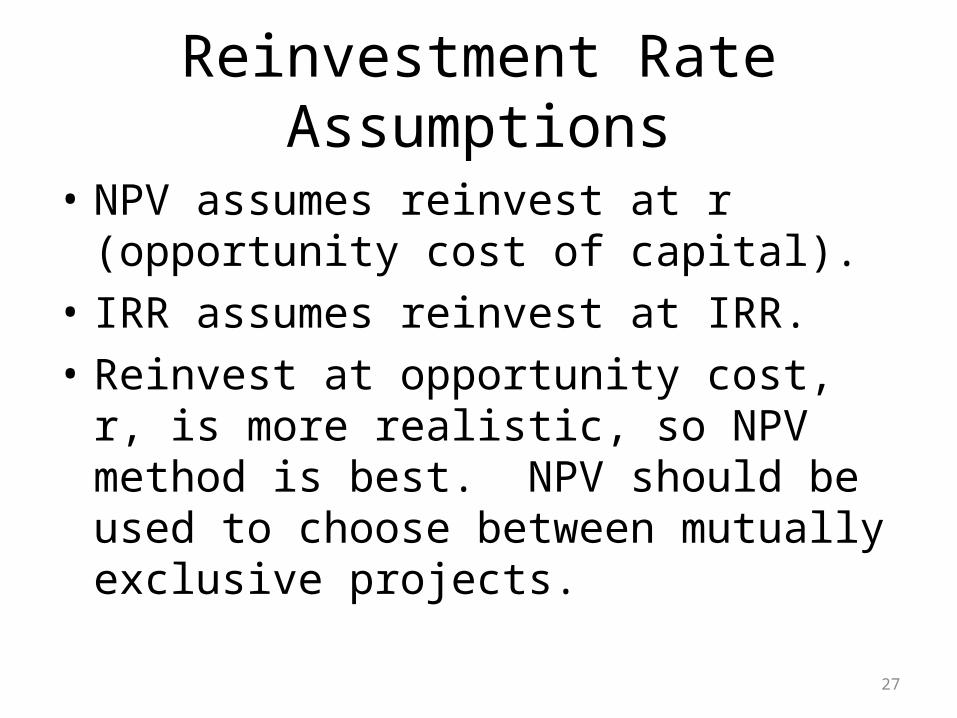
Reinvestment Rate Assumptions
• NPV assumes reinvest at r (opportunity cost of capital).
• IRR assumes reinvest at IRR.• Reinvest at opportunity cost, r, is more
realistic, so NPV method is best. NPV should be used to choose between mutually exclusive projects.
28
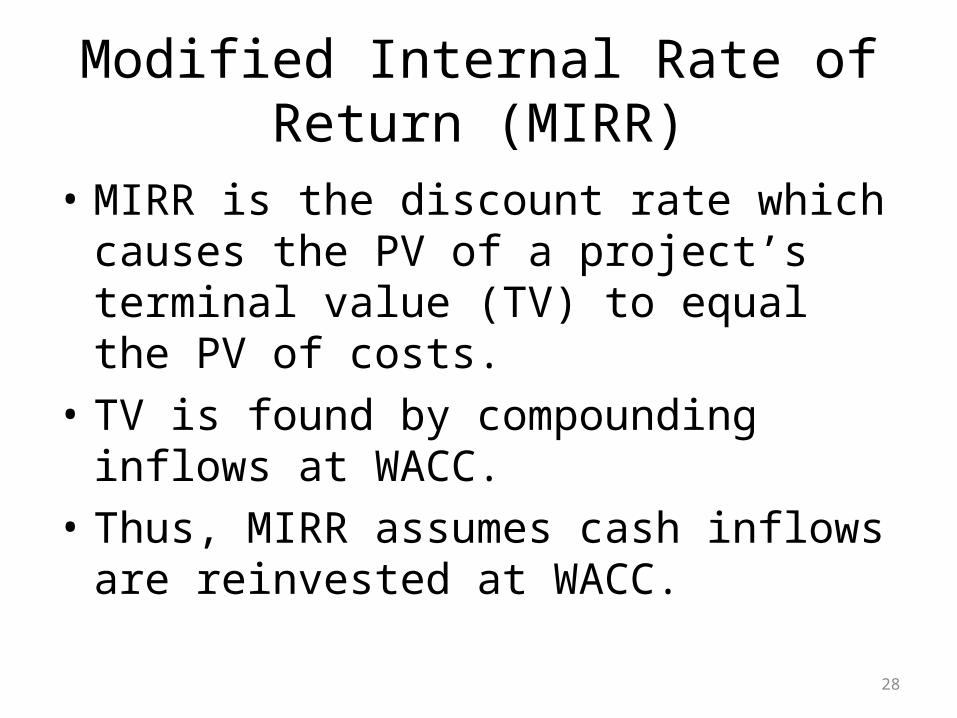
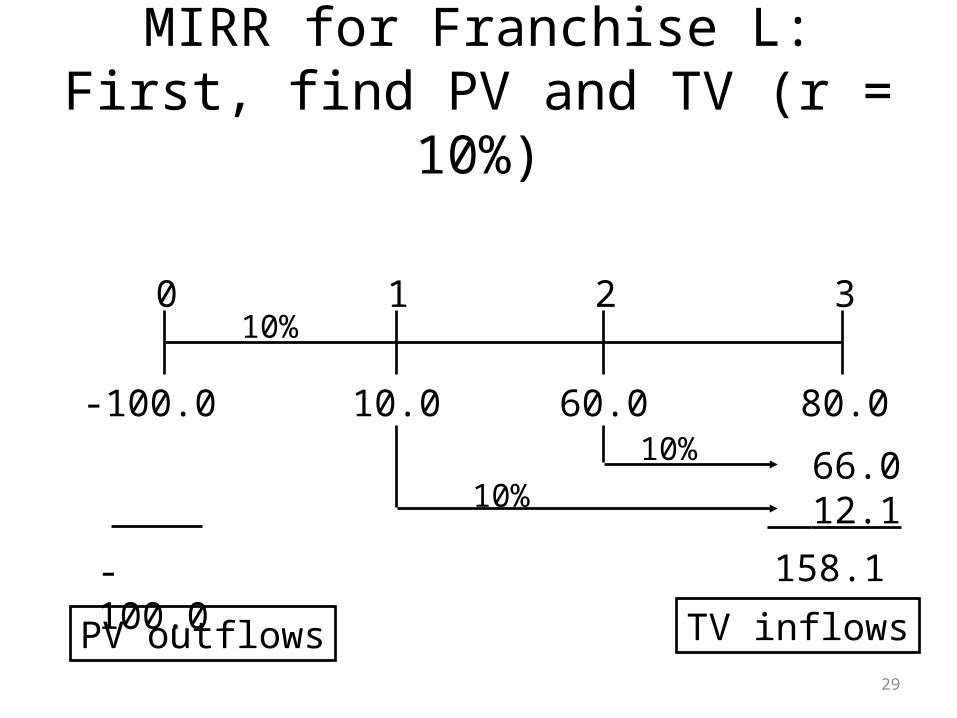
Modified Internal Rate of Return (MIRR)
• MIRR is the discount rate which causes the PV of a project’s terminal value (TV) to equal the PV of costs.
• TV is found by compounding inflows at WACC.• Thus, MIRR assumes cash inflows are
reinvested at WACC.
29
10.0 80.060.0
0 1 2 310%
66.0 12.1
158.1
-100.010%
10%
TV inflows
-100.0PV outflows
MIRR for Franchise L: First, find PV and TV (r = 10%)
30
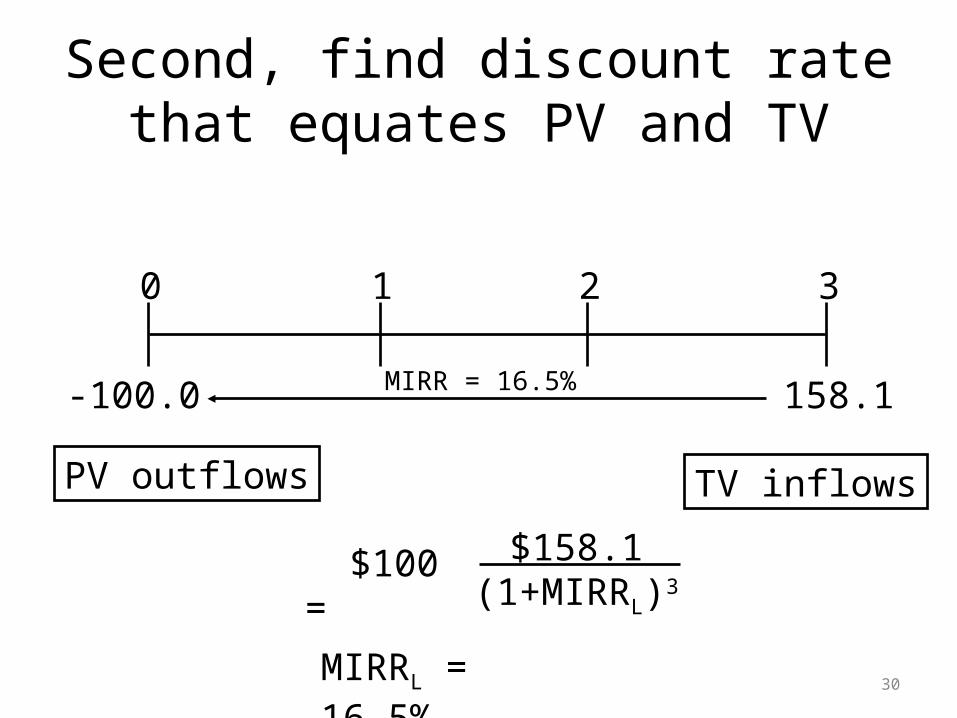
MIRR = 16.5% 158.1
0 1 2 3
-100.0
TV inflowsPV outflows
MIRRL = 16.5%
$100 =
$158.1(1+MIRRL)3
Second, find discount rate that equates PV and TV
31
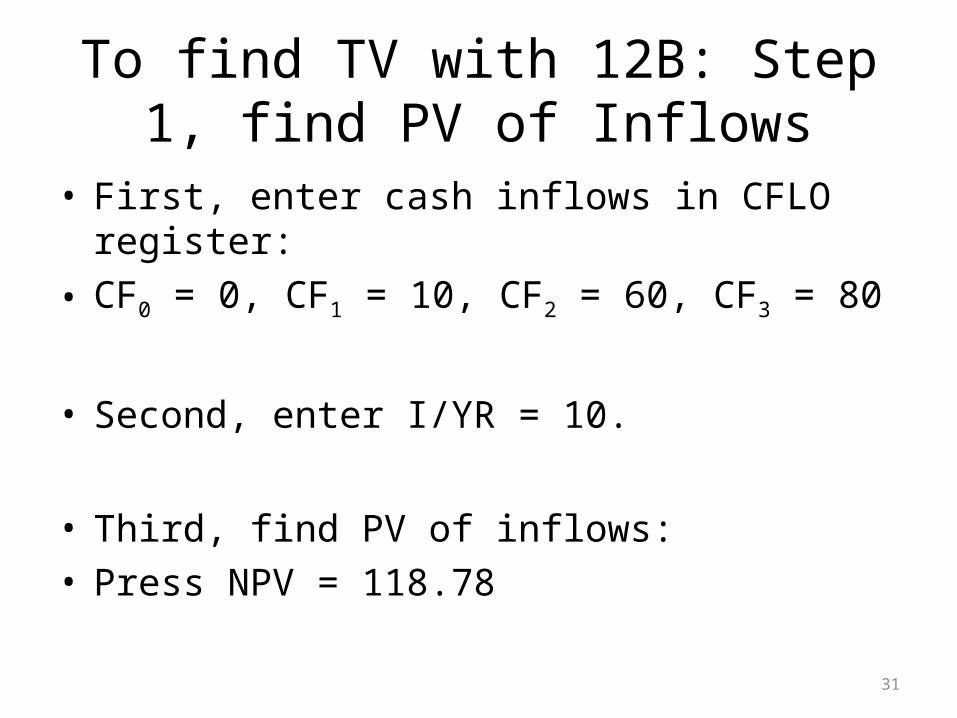
To find TV with 12B: Step 1, find PV of Inflows
• First, enter cash inflows in CFLO register:• CF0 = 0, CF1 = 10, CF2 = 60, CF3 = 80
• Second, enter I/YR = 10.
• Third, find PV of inflows:• Press NPV = 118.78
32
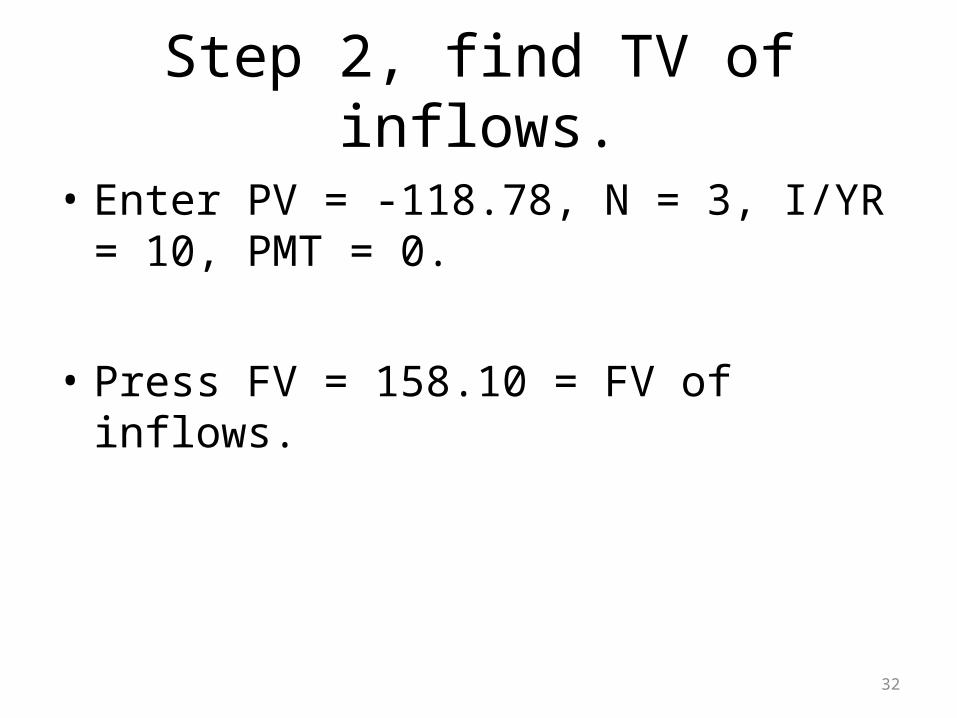
Step 2, find TV of inflows.
• Enter PV = -118.78, N = 3, I/YR = 10, PMT = 0.
• Press FV = 158.10 = FV of inflows.
33
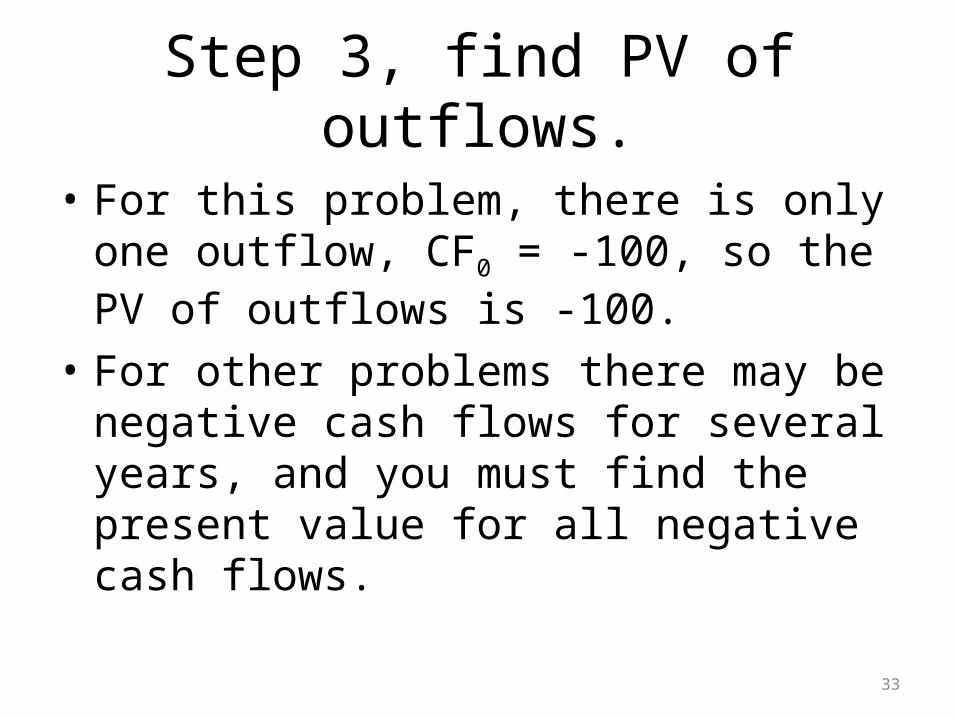
Step 3, find PV of outflows.
• For this problem, there is only one outflow, CF0 = -100, so the PV of outflows is -100.
• For other problems there may be negative cash flows for several years, and you must find the present value for all negative cash flows.
34
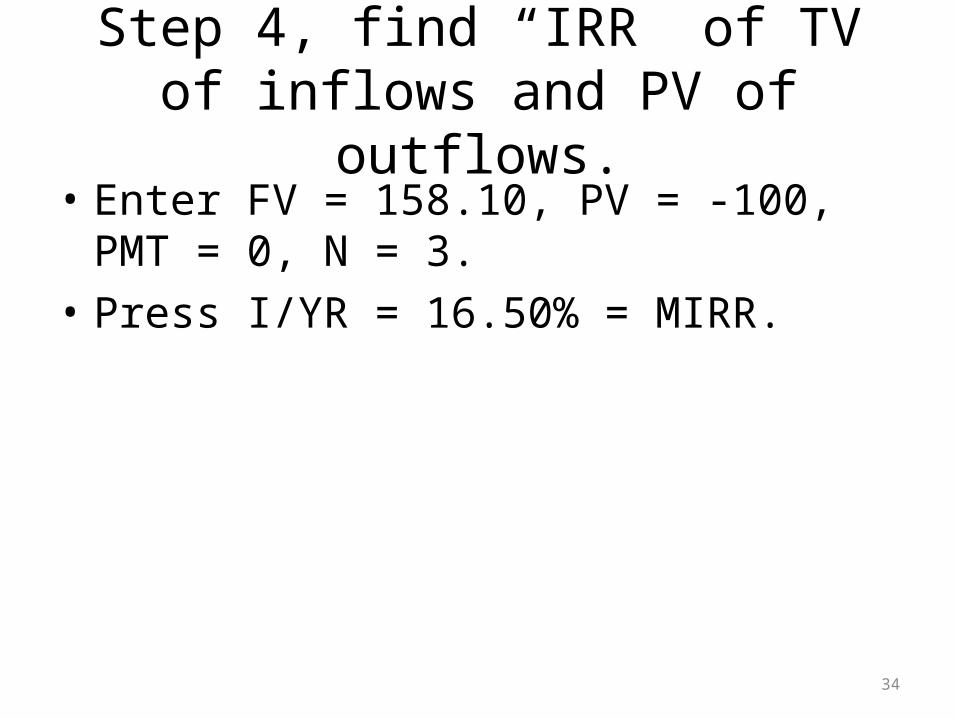
Step 4, find “IRR” of TV of inflows and PV of outflows.
• Enter FV = 158.10, PV = -100, PMT = 0, N = 3.• Press I/YR = 16.50% = MIRR.
35
Why use MIRR versus IRR?
• MIRR correctly assumes reinvestment at opportunity cost = WACC. MIRR also avoids the problem of multiple IRRs.
• Managers like rate of return comparisons, and MIRR is better for this than IRR.
36
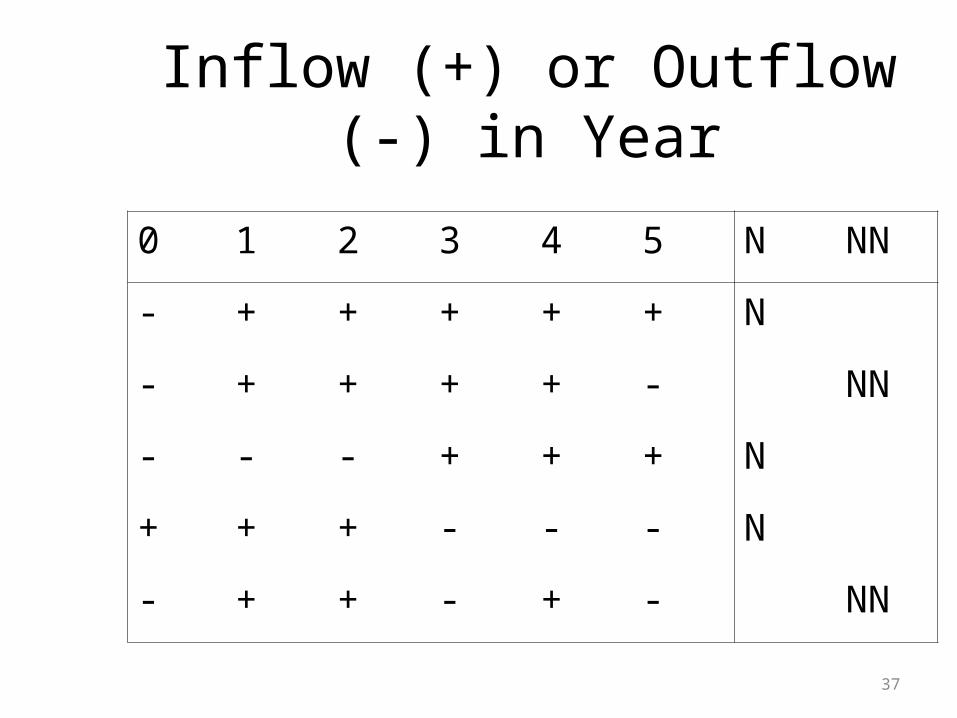
Normal vs. Nonnormal Cash Flows
• Normal Cash Flow Project:– Cost (negative CF) followed by a series of positive cash
inflows. – One change of signs.
• Nonnormal Cash Flow Project:– Two or more changes of signs.– Most common: Cost (negative CF), then string of positive
CFs, then cost to close project.– For example, nuclear power plant or strip mine.
37
Inflow (+) or Outflow (-) in Year
0 1 2 3 4 5 N NN
- + + + + + N
- + + + + - NN
- - - + + + N
+ + + - - - N
- + + - + - NN
38
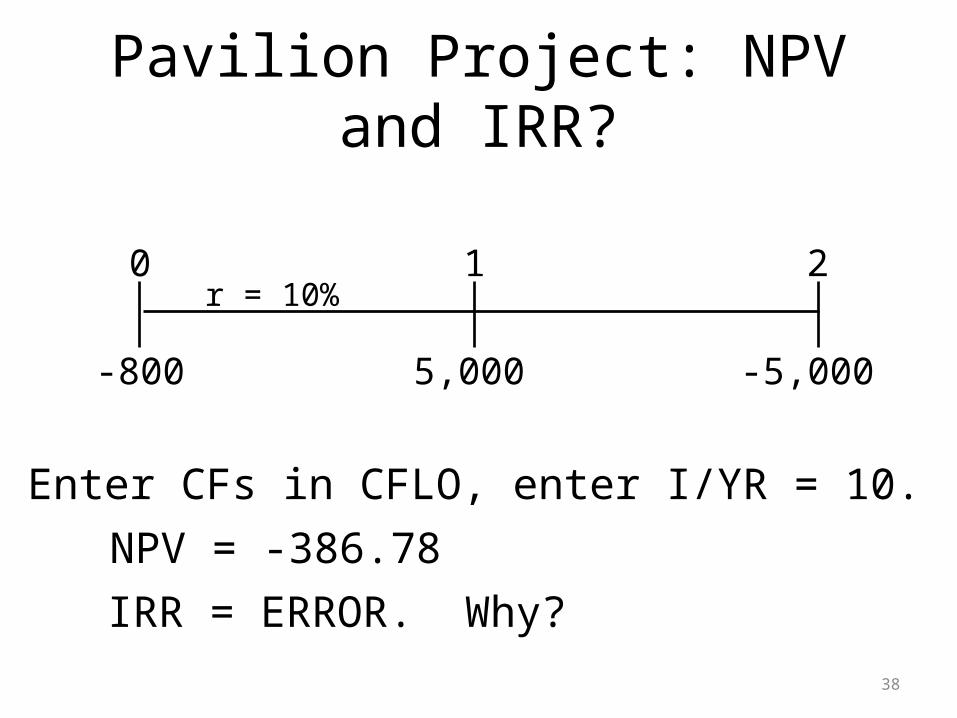
Pavilion Project: NPV and IRR?
5,000 -5,000
0 1 2r = 10%
-800
Enter CFs in CFLO, enter I/YR = 10.
NPV = -386.78
IRR = ERROR. Why?
39
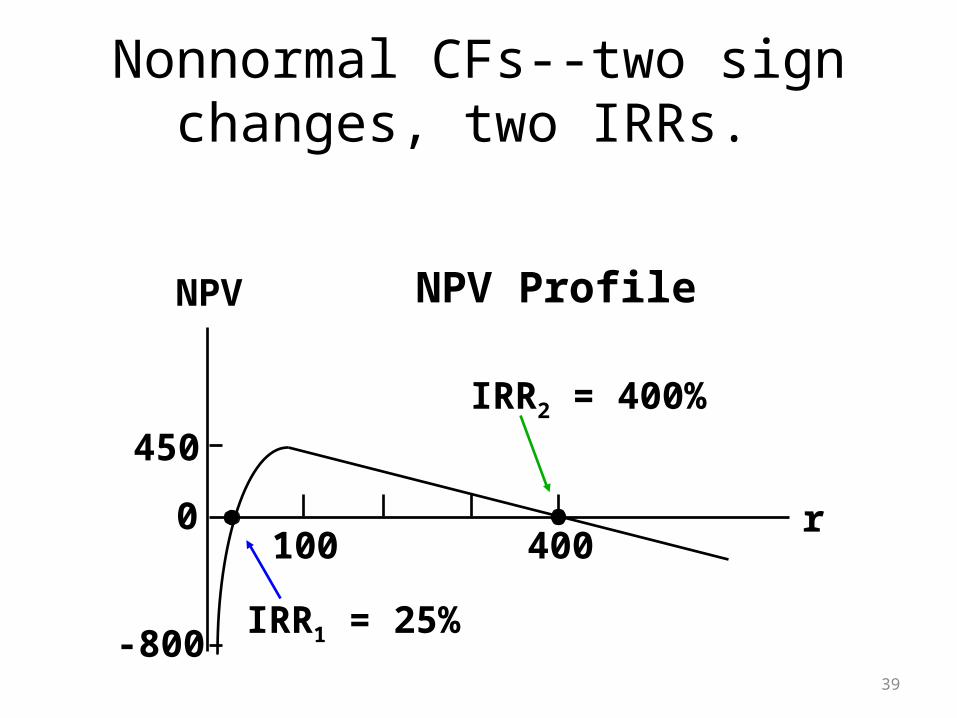
NPV Profile
450
-800
0400100
IRR2 = 400%
IRR1 = 25%
r
NPV
Nonnormal CFs--two sign changes, two IRRs.
40
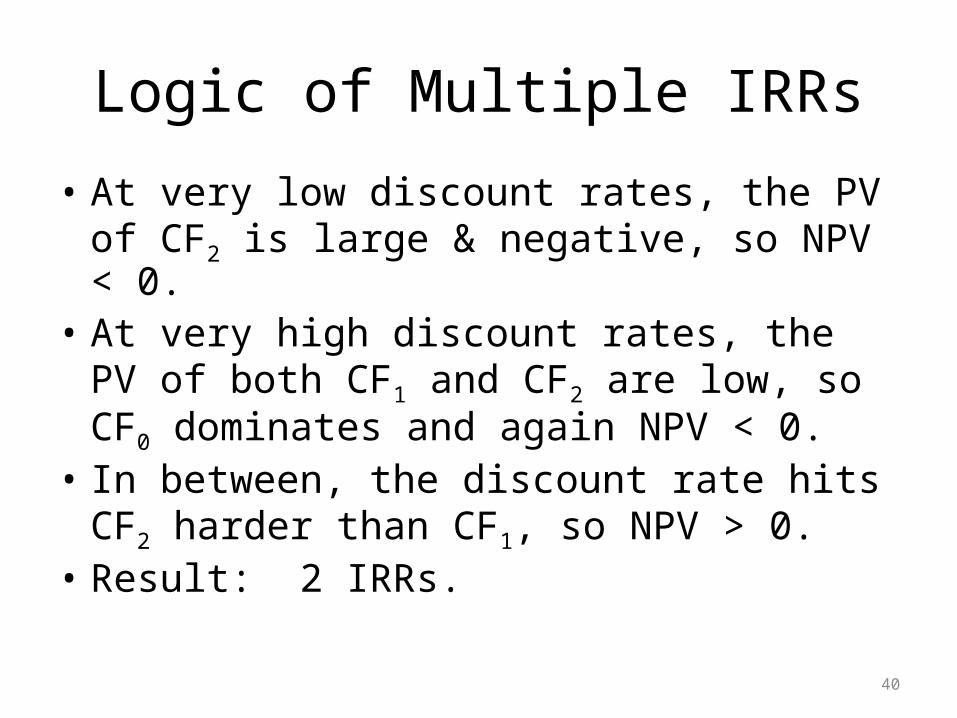
Logic of Multiple IRRs
• At very low discount rates, the PV of CF2 is large & negative, so NPV < 0.
• At very high discount rates, the PV of both CF1 and CF2 are low, so CF0 dominates and again NPV < 0.
• In between, the discount rate hits CF2 harder than CF1, so NPV > 0.
• Result: 2 IRRs.
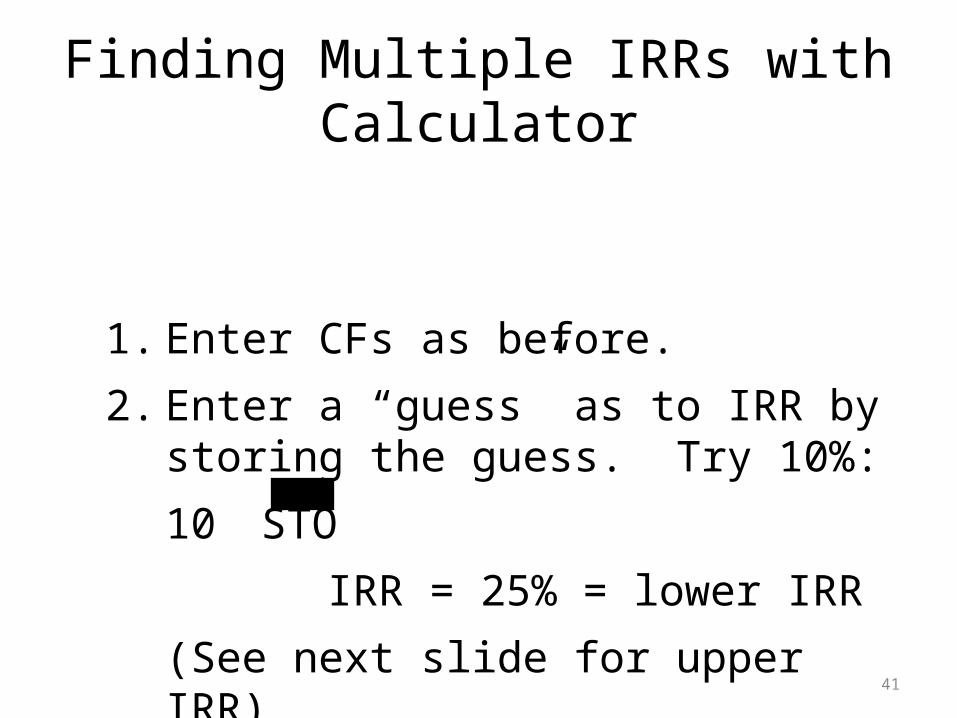
41
1. Enter CFs as before.
2. Enter a “guess” as to IRR by storing the guess. Try 10%:
10 STO
IRR = 25% = lower IRR
(See next slide for upper IRR)
Finding Multiple IRRs with Calculator
42
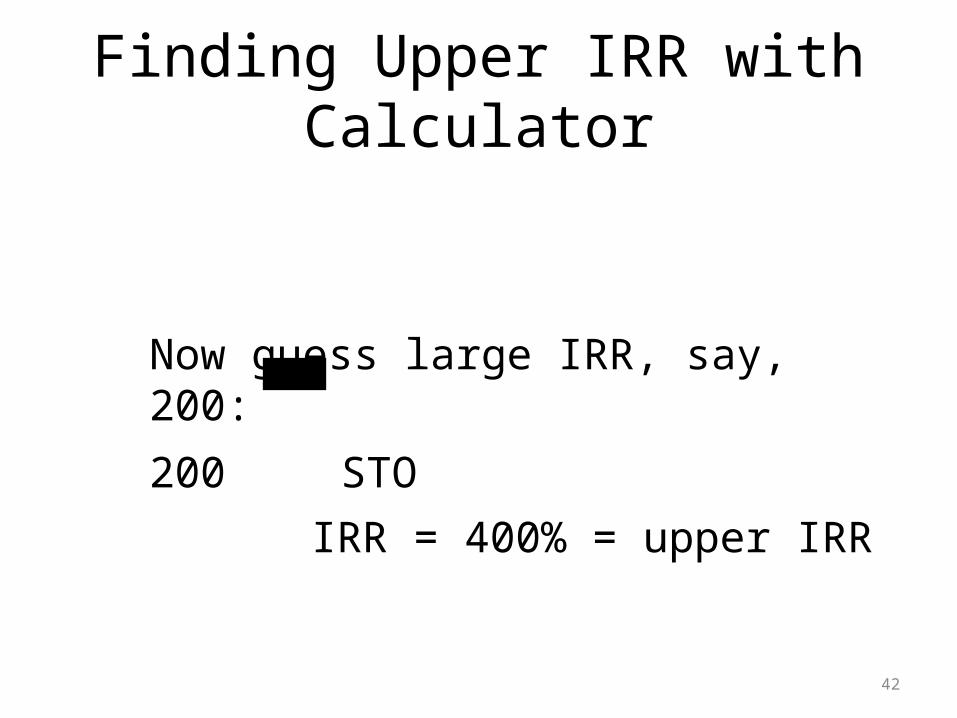
Now guess large IRR, say, 200:
200 STO
IRR = 400% = upper IRR
Finding Upper IRR with Calculator
43
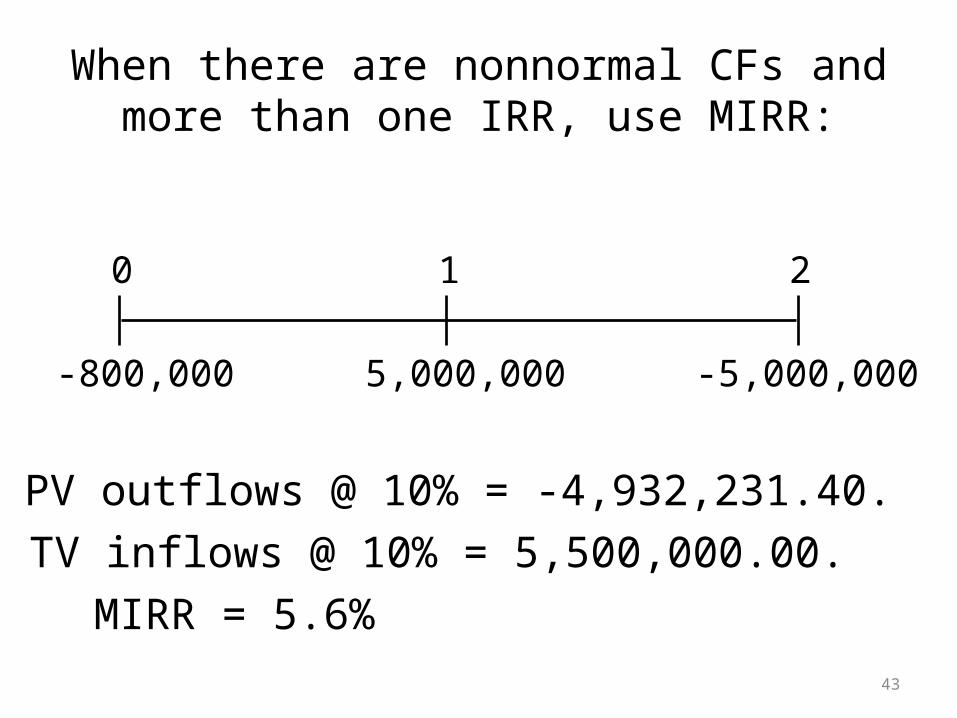
0 1 2
-800,000 5,000,000 -5,000,000
PV outflows @ 10% = -4,932,231.40.
TV inflows @ 10% = 5,500,000.00.
MIRR = 5.6%
When there are nonnormal CFs and more than one IRR, use MIRR:
44
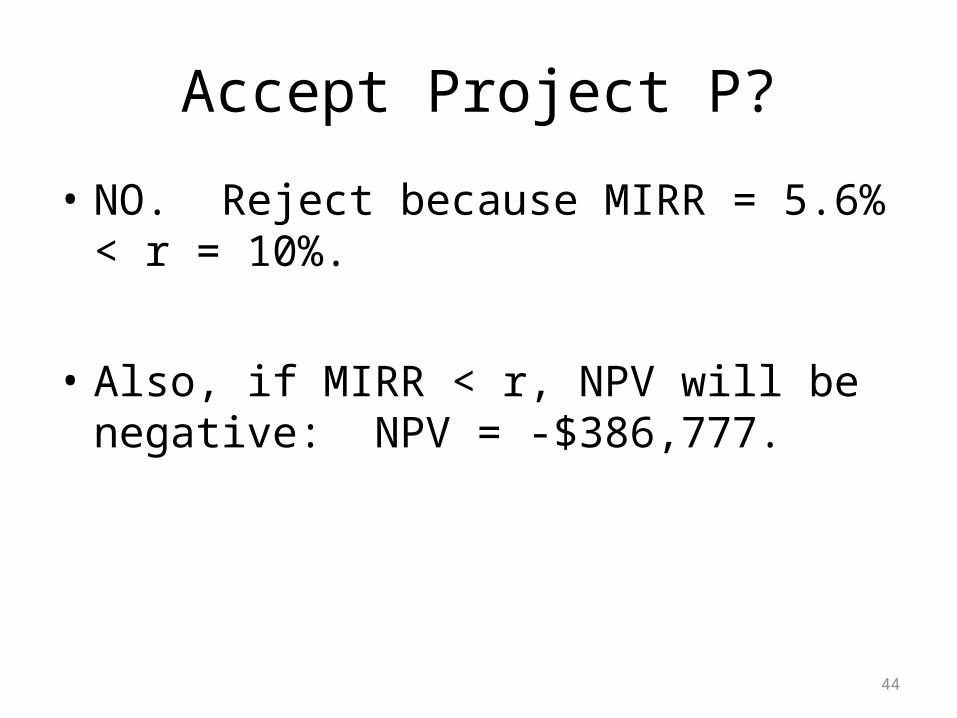
Accept Project P?
• NO. Reject because MIRR = 5.6% < r = 10%.
• Also, if MIRR < r, NPV will be negative: NPV = -$386,777.
45
Profitability Index
• The profitability index (PI) is the present value of future cash flows divided by the initial cost.
• It measures the “bang for the buck.”
46
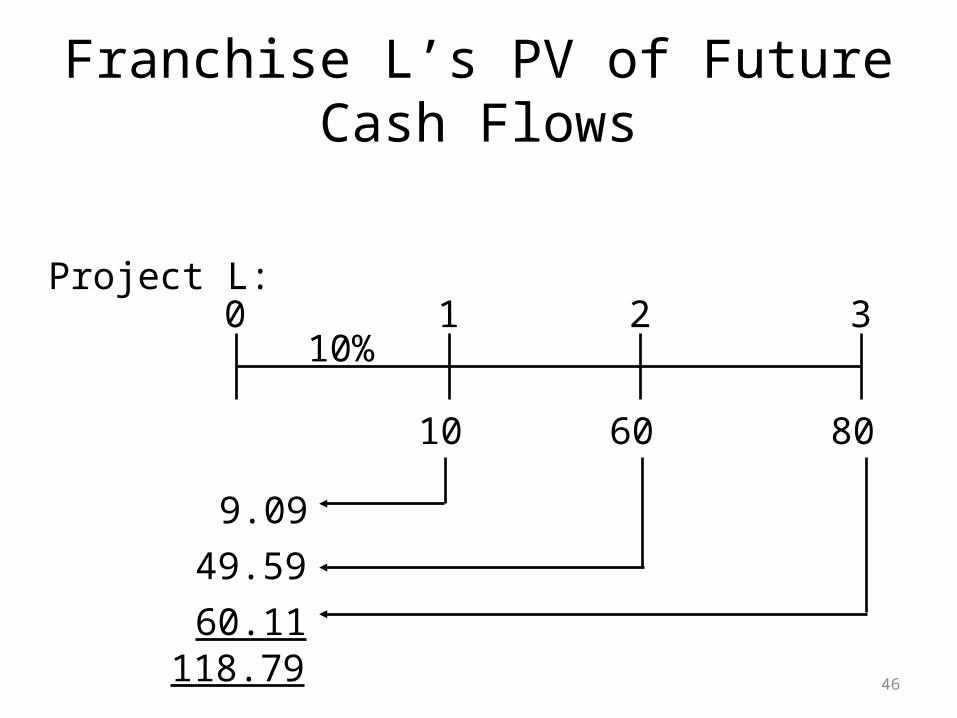
Franchise L’s PV of Future Cash Flows
10 8060
0 1 2 310%
Project L:
9.09
49.59
60.11118.79
47
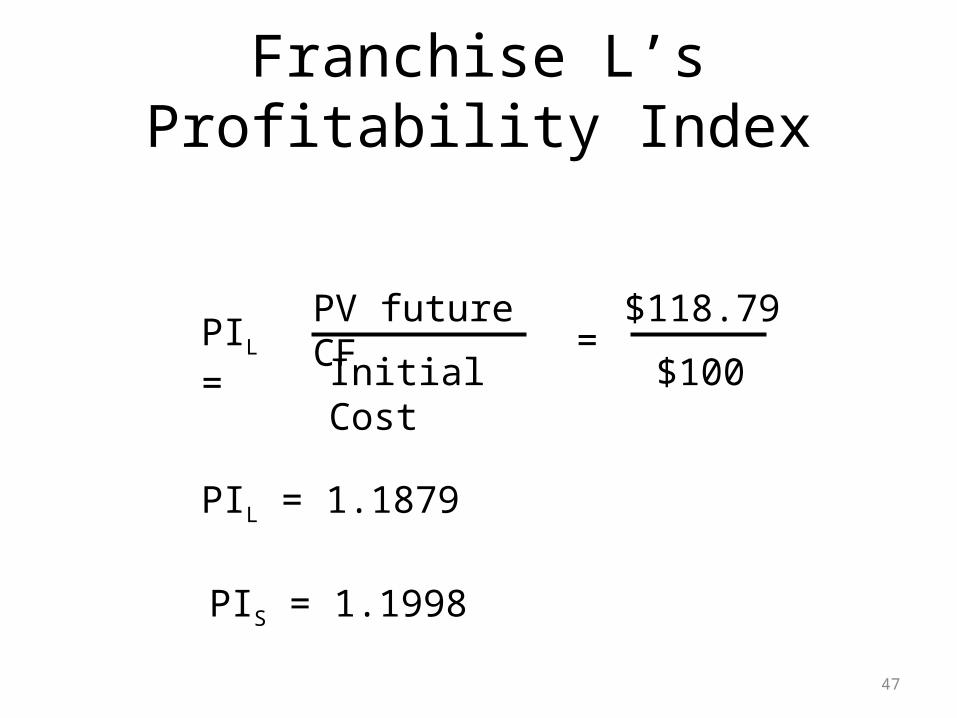
Franchise L’s Profitability Index
PIL =PV future CF
Initial Cost
$118.79=
PIL = 1.1879
$100
PIS = 1.1998
48
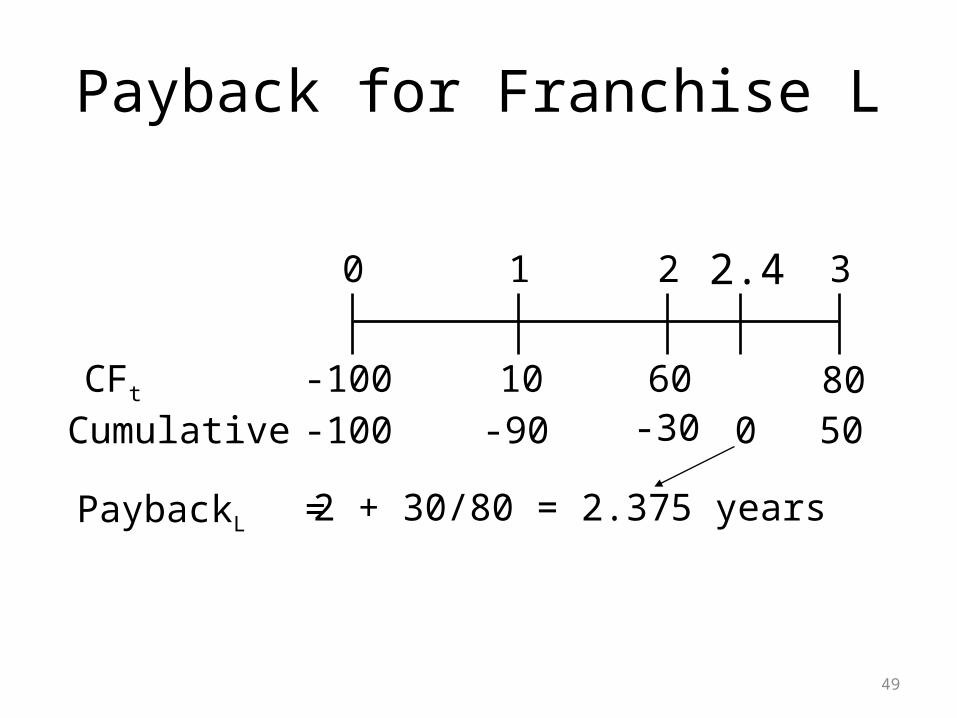
What is the payback period?
• The number of years required to recover a project’s cost,
• or how long does it take to get the business’s money back?
49
Payback for Franchise L
10 8060
0 1 2 3
-100
=
CFt
Cumulative -100 -90 -30 50
PaybackL 2 + 30/80 = 2.375 years
0
2.4
50
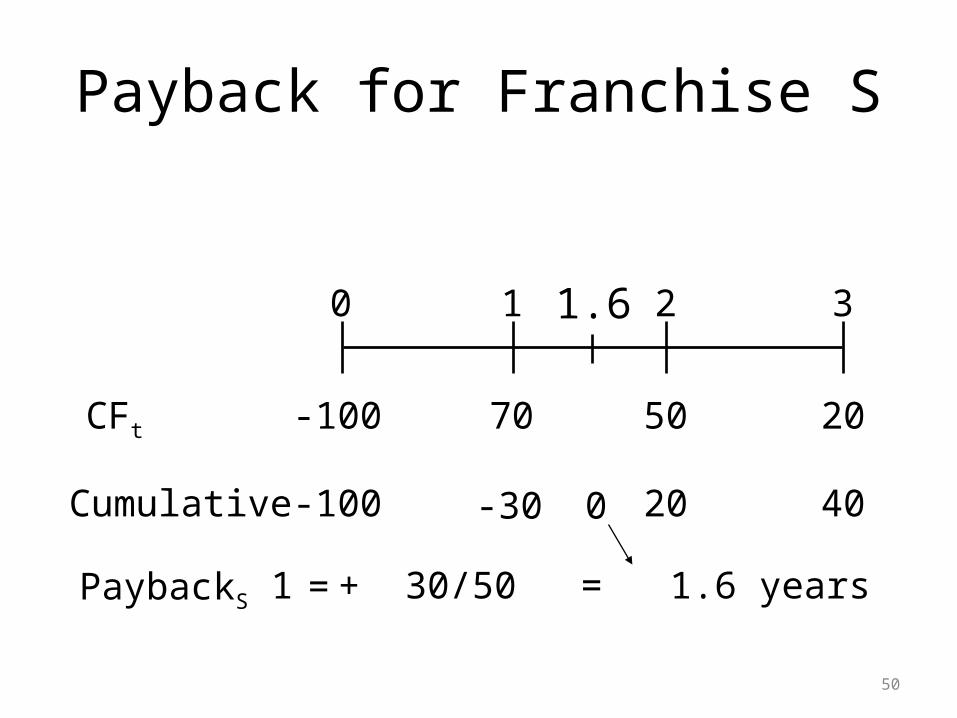
Payback for Franchise S
70 2050
0 1 2 3
-100CFt
Cumulative -100 -30 20 40
PaybackS 1 + 30/50 = 1.6 years
0
1.6
=
51
Strengths and Weaknesses of Payback
• Strengths:– Provides an indication of a project’s risk and
liquidity.– Easy to calculate and understand.
• Weaknesses: – Ignores the TVM.– Ignores CFs occurring after the payback period.
52
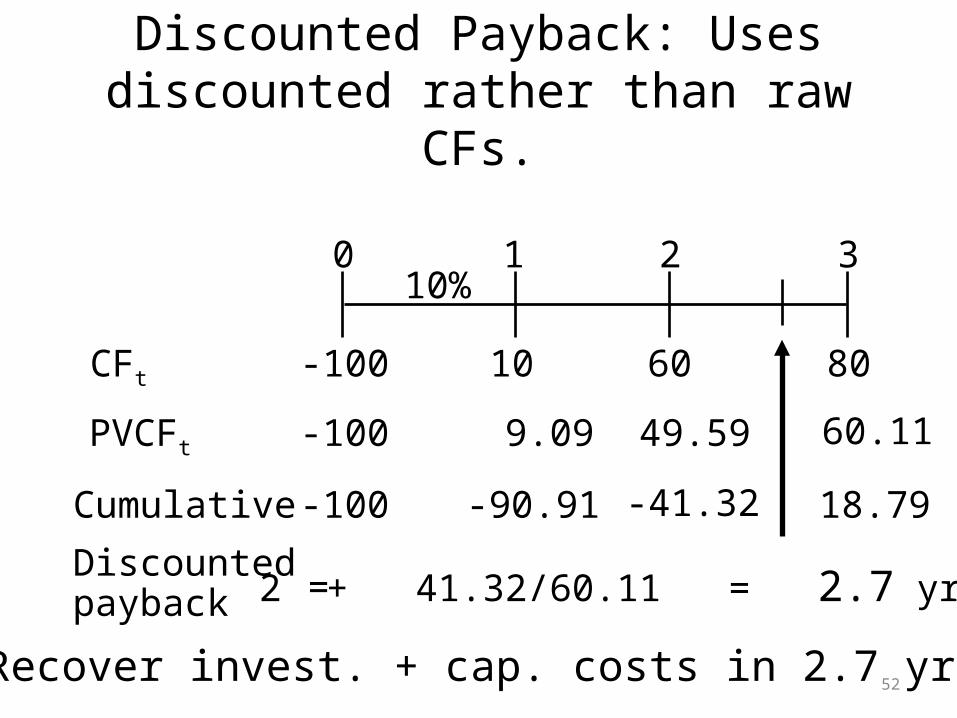
10 8060
0 1 2 3
CFt
Cumulative -100 -90.91 -41.32 18.79
Discountedpayback 2 + 41.32/60.11 = 2.7 yrs
PVCFt -100
-100
10%
9.09 49.59 60.11
=
Recover invest. + cap. costs in 2.7 yrs.
Discounted Payback: Uses discounted rather than raw CFs.
53
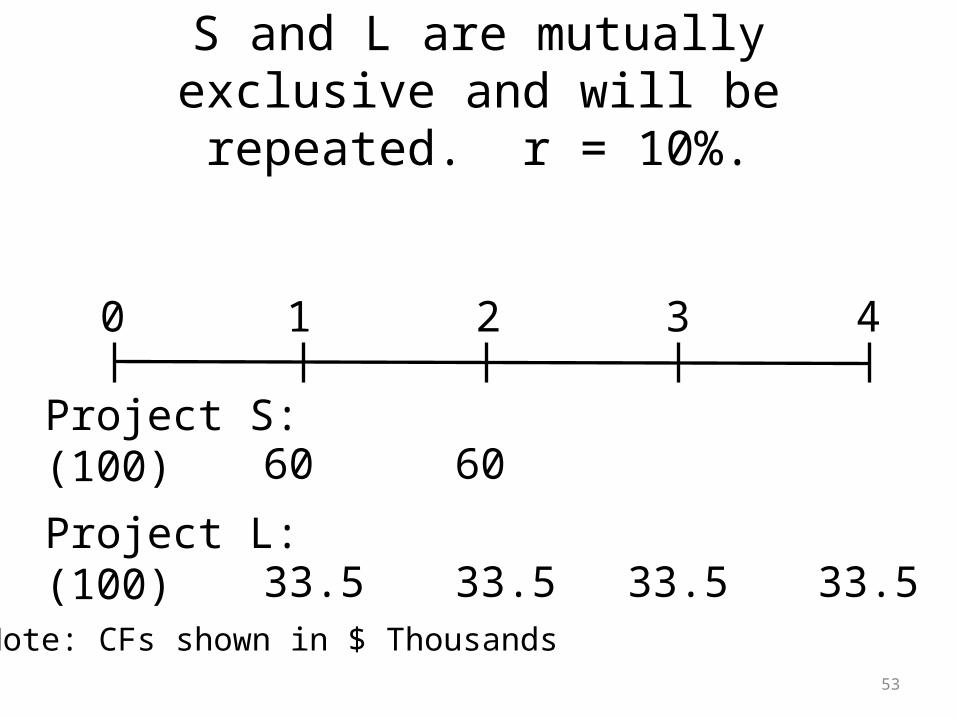
S and L are mutually exclusive and will be repeated. r = 10%.
0 1 2 3 4
Project S:(100)
Project L:(100)
60
33.5
60
33.5 33.5 33.5Note: CFs shown in $ Thousands
54
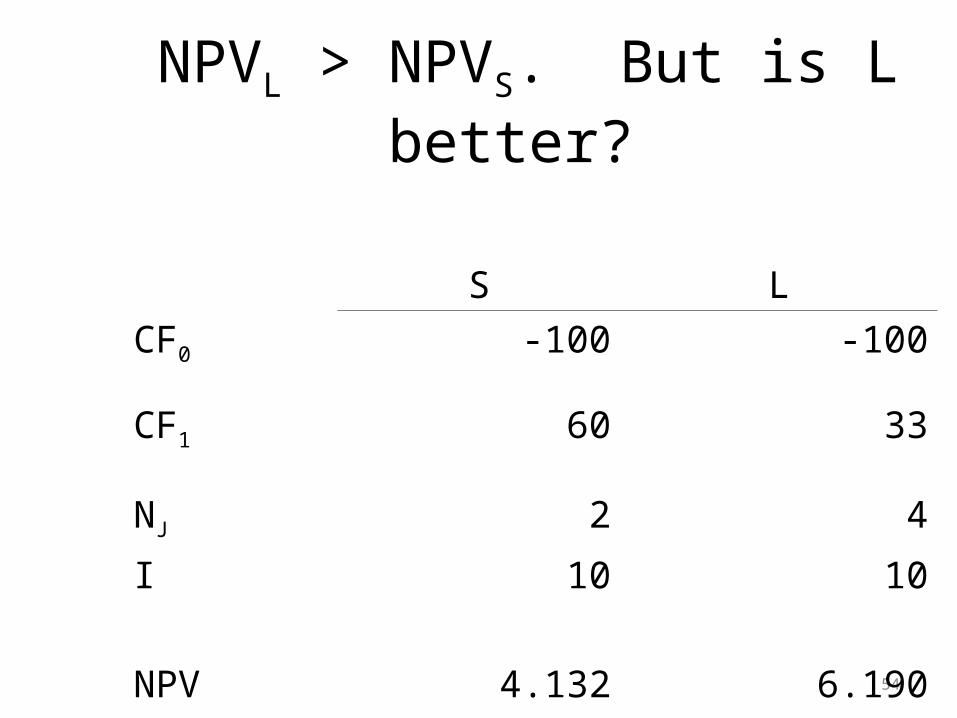
NPVL > NPVS. But is L better?
S L
CF0 -100 -100
CF1 60 33
NJ 2 4
I 10 10
NPV 4.132 6.190
55
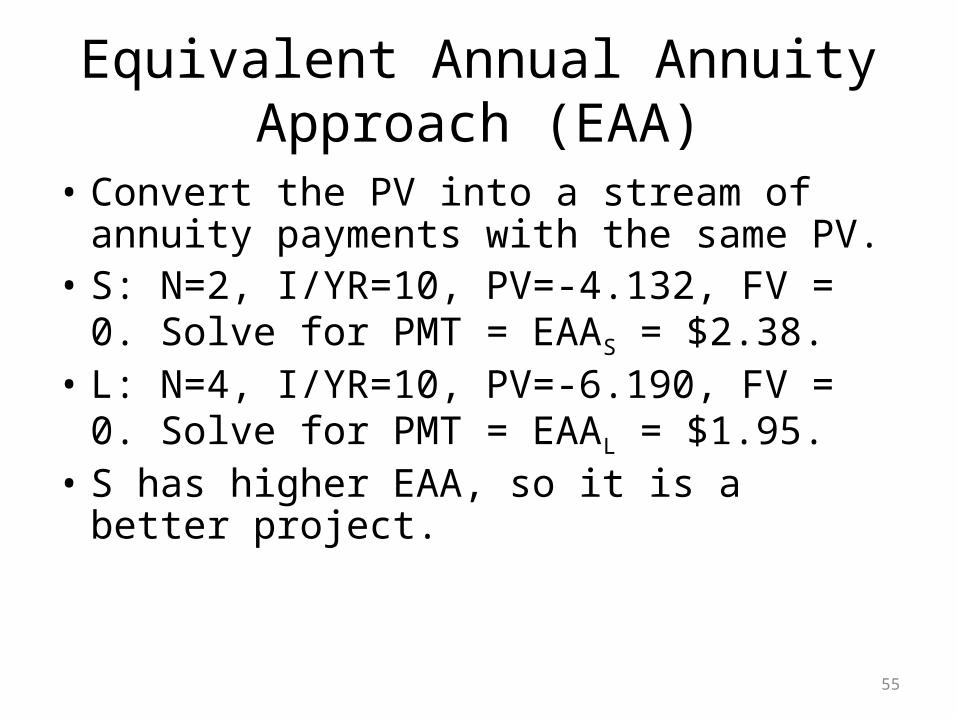
Equivalent Annual Annuity Approach (EAA)
• Convert the PV into a stream of annuity payments with the same PV.
• S: N=2, I/YR=10, PV=-4.132, FV = 0. Solve for PMT = EAAS = $2.38.
• L: N=4, I/YR=10, PV=-6.190, FV = 0. Solve for PMT = EAAL = $1.95.
• S has higher EAA, so it is a better project.
56
Put Projects on Common Basis
• Note that Project S could be repeated after 2 years to generate additional profits.
• Use replacement chain to put on common life.• Note: equivalent annual annuity analysis is
alternative method.
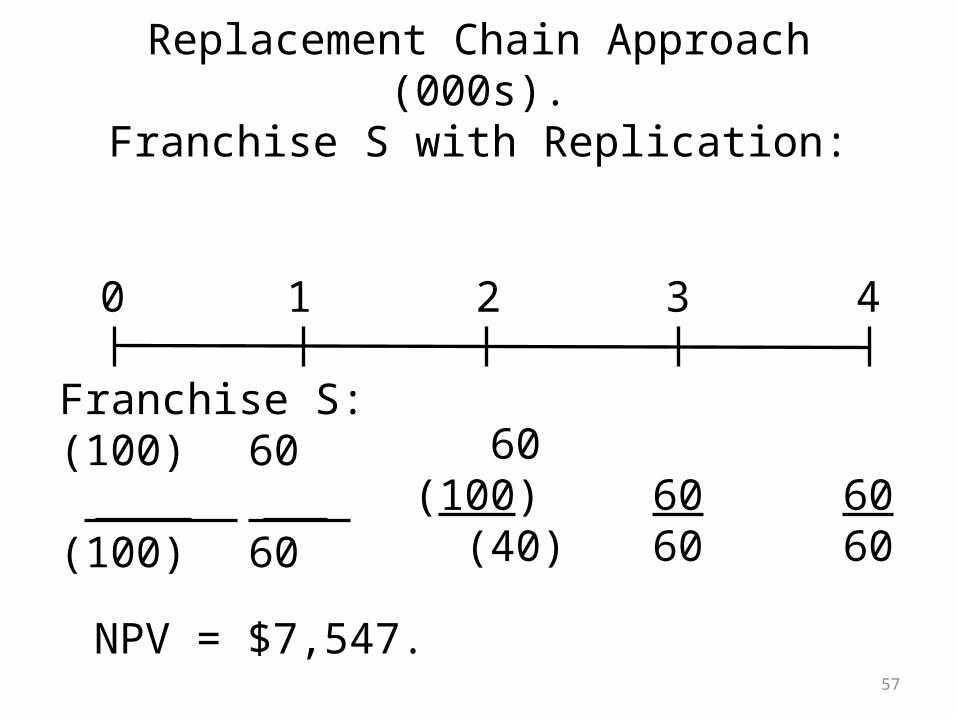
57
Replacement Chain Approach (000s).Franchise S with Replication:
NPV = $7,547.
0 1 2 3 4
Franchise S:(100) (100)
60 60
60(100) (40)
6060
6060
58
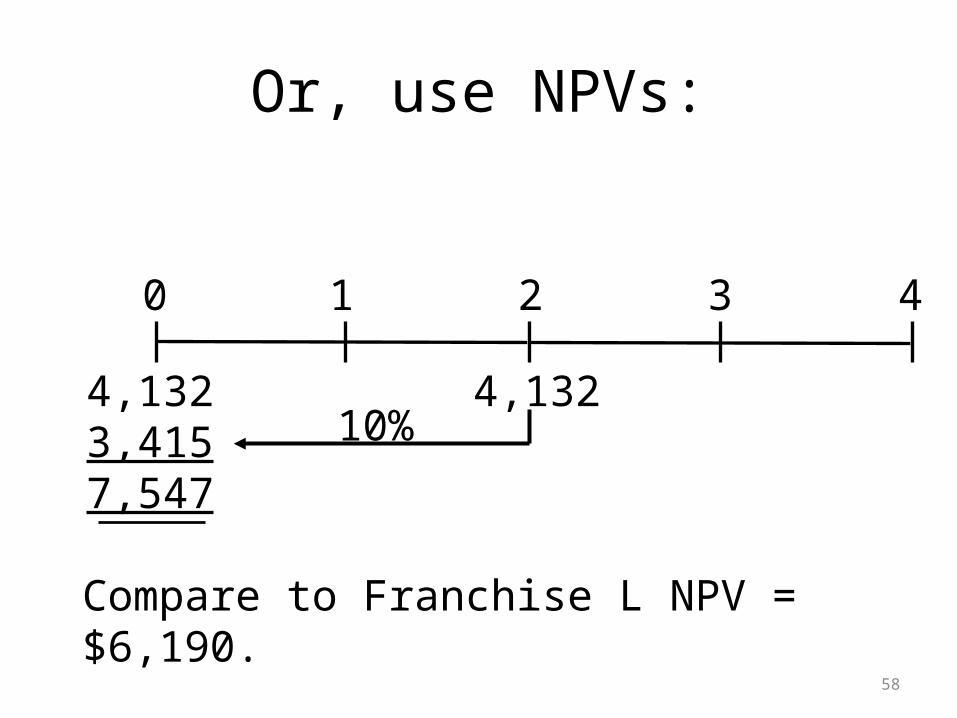
Compare to Franchise L NPV = $6,190.Compare to Franchise L NPV = $6,190.
0 1 2 3 4
4,1323,4157,547
4,13210%
Or, use NPVs:
59
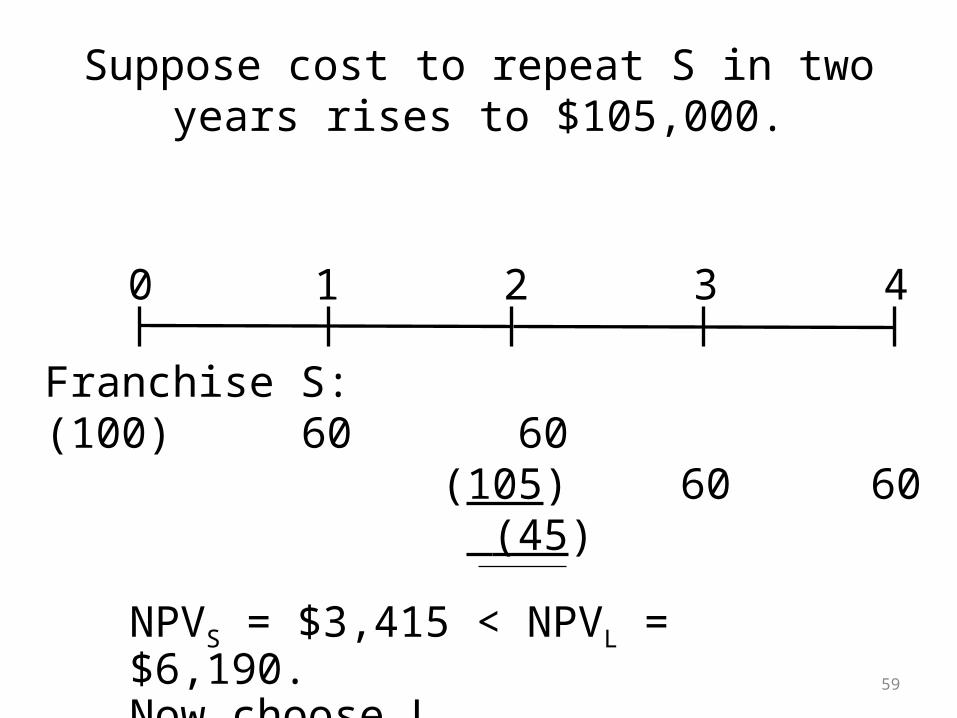
Suppose cost to repeat S in two years rises to $105,000.
NPVS = $3,415 < NPVL = $6,190.Now choose L.NPVS = $3,415 < NPVL = $6,190.Now choose L.
0 1 2 3 4
Franchise S:(100)
60 60(105) (45)
60 60
60
Economic Life versus Physical Life
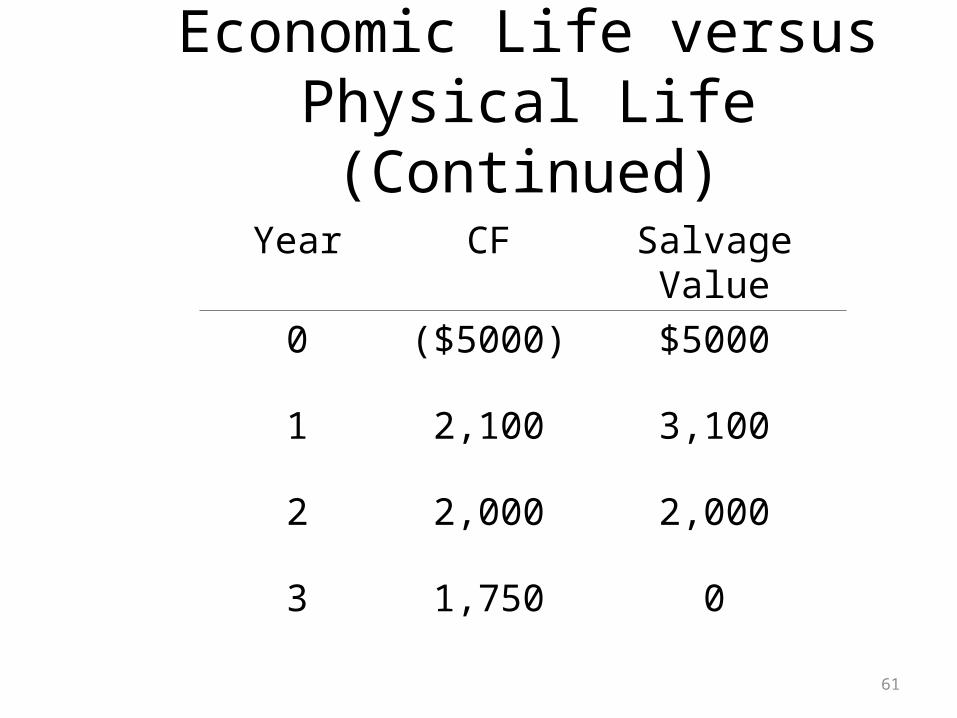
• Consider another project with a 3-year life.• If terminated prior to Year 3, the machinery
will have positive salvage value.• Should you always operate for the full physical
life?• See next slide for cash flows.
61
Economic Life versus Physical Life (Continued)
Year CF Salvage Value
0 ($5000) $5000
1 2,100 3,100
2 2,000 2,000
3 1,750 0
62
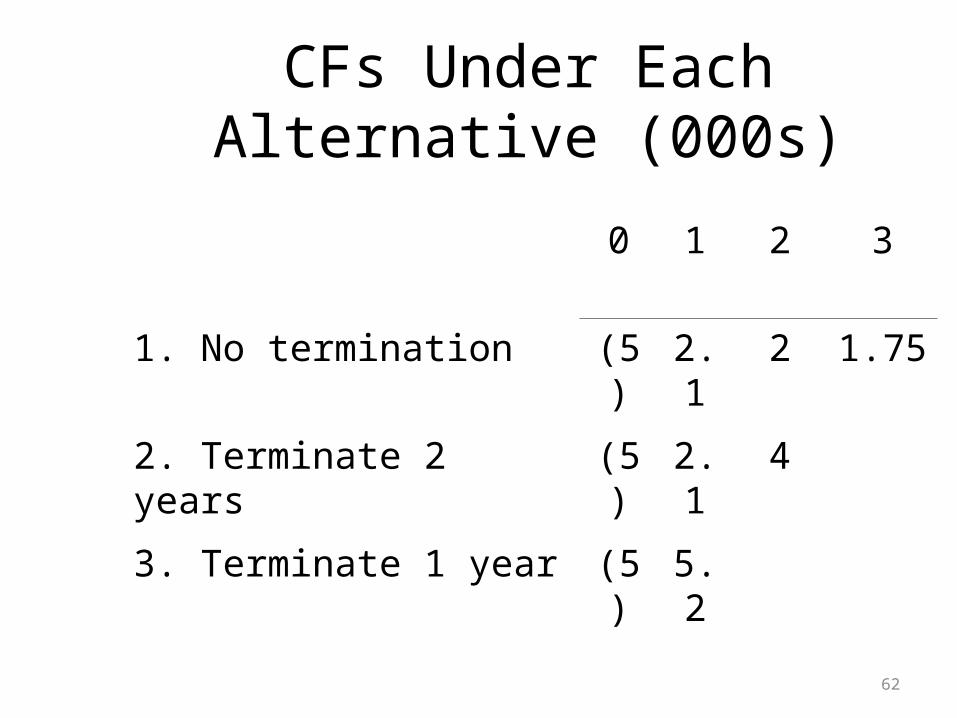
CFs Under Each Alternative (000s)
0 1 2 3
1. No termination (5) 2.1
2 1.75
2. Terminate 2 years (5) 2.1
4
3. Terminate 1 year (5) 5.2
63
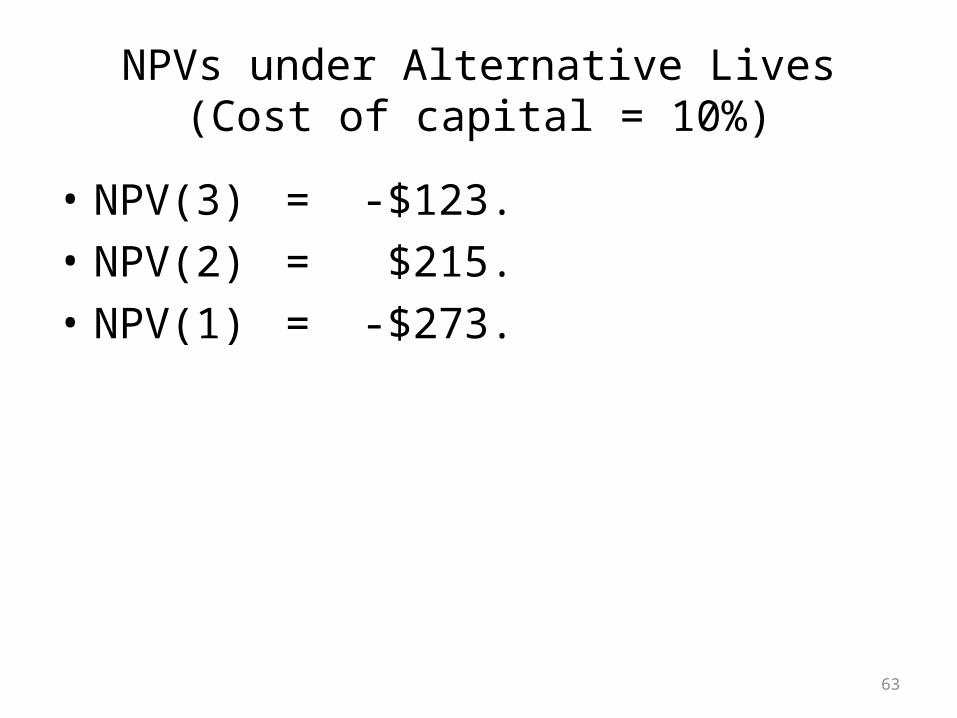
NPVs under Alternative Lives (Cost of capital = 10%)
• NPV(3) = -$123.• NPV(2) = $215.• NPV(1) = -$273.
64
Conclusions
• The project is acceptable only if operated for 2 years.
• A project’s engineering life does not always equal its economic life.