Embed Size (px)
Citation preview
1
1
Chapter 13: Spectroscopy
Methods of structure determination
• Nuclear Magnetic Resonances (NMR) Spectroscopy(Sections 13.3-13.19)
• Infrared (IR) Spectroscopy (Sections 13.20-13.22)• Ultraviolet-visible (UV-Vis) Spectroscopy (Section 13.23)• Mass (MS) spectrometry (not really spectroscopy)
(Section 13.24)
Molecular Spectroscopy: the interaction of electromagnetic radiation (light) with matter (organic compounds). Thisinteraction gives specific structural information.
2
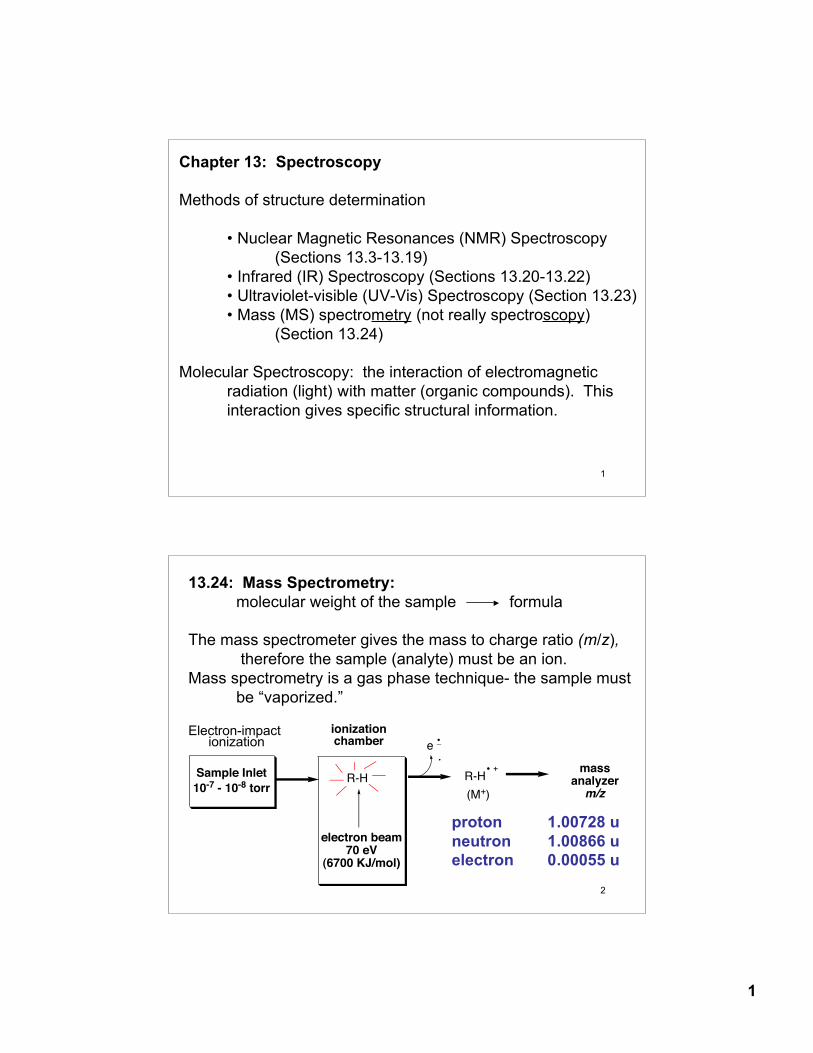
13.24: Mass Spectrometry: molecular weight of the sample formula
The mass spectrometer gives the mass to charge ratio (m/z), therefore the sample (analyte) must be an ion.
Mass spectrometry is a gas phase technique- the sample mustbe “vaporized.”
Electron-impact ionization
Sample Inlet
10-7 - 10-8 torrR-H
electron beam 70 eV
(6700 KJ/mol)
e_
R-H+ mass
analyzerm/z
ionization chamber
(M+)
proton 1.00728 uneutron 1.00866 uelectron 0.00055 u
2
3
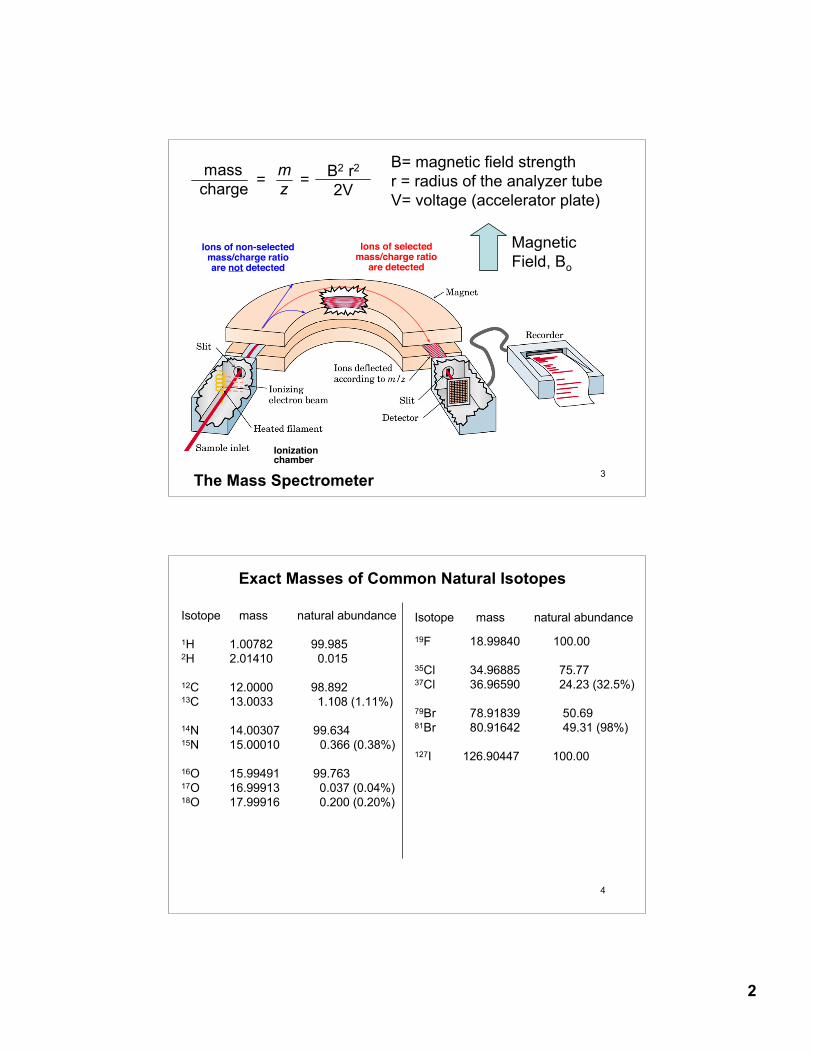
mass mcharge z= = B2 r2
2V
B= magnetic field strengthr = radius of the analyzer tubeV= voltage (accelerator plate)
The Mass Spectrometer
Ionizationchamber
Ions of selectedmass/charge ratio
are detected
Ions of non-selectedmass/charge ratioare not detected
Magnetic Field, Bo
4
Exact Masses of Common Natural Isotopes
Isotope mass natural abundance
1H 1.00782 99.9852H 2.01410 0.015
12C 12.0000 98.89213C 13.0033 1.108 (1.11%)
14N 14.00307 99.63415N 15.00010 0.366 (0.38%)
16O 15.99491 99.76317O 16.99913 0.037 (0.04%)18O 17.99916 0.200 (0.20%)
Isotope mass natural abundance
19F 18.99840 100.00
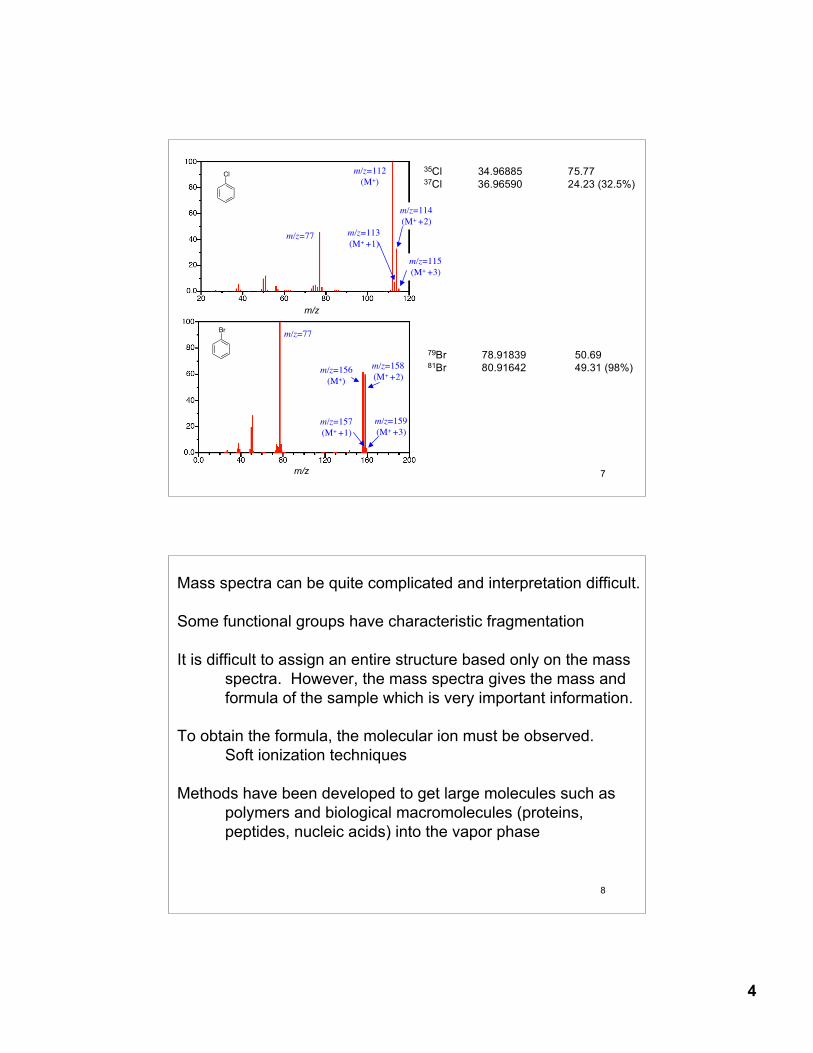
35Cl 34.96885 75.7737Cl 36.96590 24.23 (32.5%)
79Br 78.91839 50.6981Br 80.91642 49.31 (98%)
127I 126.90447 100.00
3
5
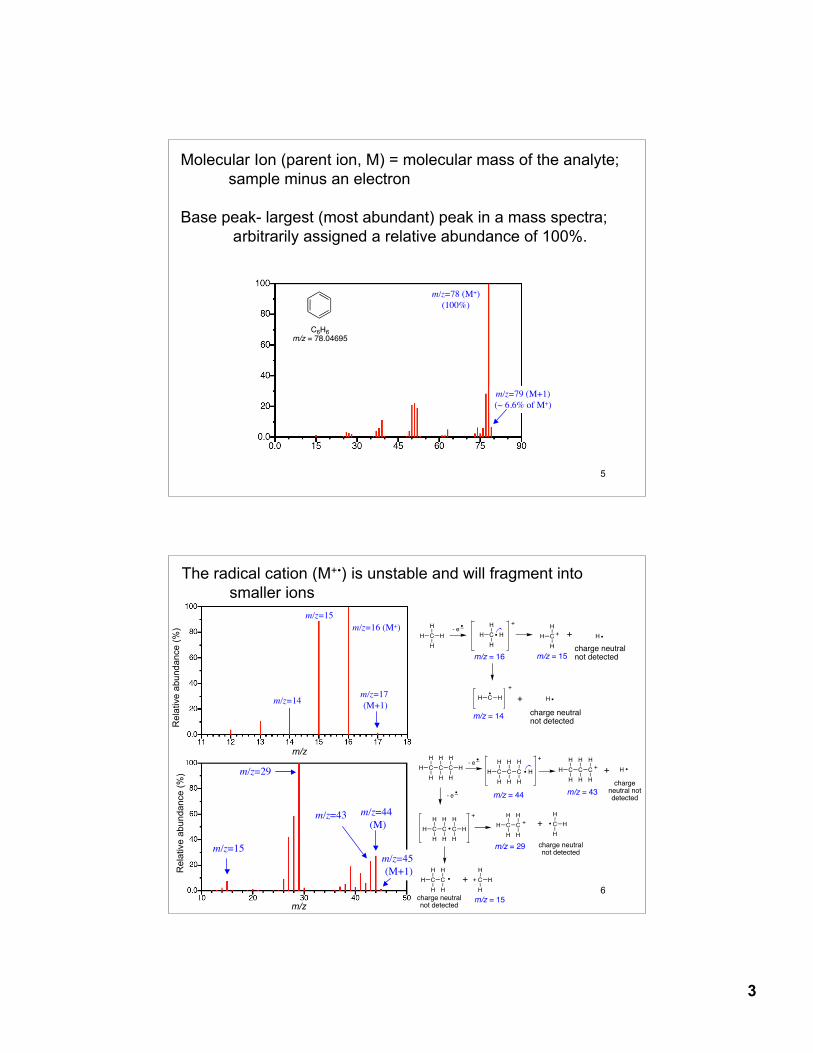
Molecular Ion (parent ion, M) = molecular mass of the analyte;sample minus an electron
Base peak- largest (most abundant) peak in a mass spectra; arbitrarily assigned a relative abundance of 100%.
C6H6
m/z = 78.04695
m/z=78 (M+)(100%)
m/z=79 (M+1)(~ 6.6% of M+)
6
The radical cation (M+•) is unstable and will fragment into smaller ions
Rel
ativ
e ab
unda
nce
(%) m/z=16 (M+)
m/z=15
m/z=14m/z=17 (M+1)
C
H
H
H + H+
m/z = 15charge neutralnot detected
CH
+
H H
charge neutralnot detected
m/z = 14
C
H
H
H H- e_
C
H
H
H H
+
m/z = 16
+
Rel
ativ
e ab
unda
nce
(%)
m/z
m/z
m/z=15
m/z=29
m/z=43
m/z=45 (M+1)
m/z=44 (M)
C
H
H
C C
H
H
H
H
H
HC
H
H
C C
H
H
H
H
H
H
+
C
H
H
C C
H
H
H
H
H+
H+
charge neutral notdetected
m/z = 43m/z = 44
C
H
H
C C
H
H
H
H
H
H
- e_
+
C
H
H
C
H
H
H+ C
H
H
H+
C
H
H
C
H
H
H + C
H
H
H+
m/z = 29
m/z = 15charge neutralnot detected
charge neutralnot detected
- e_
4
7m/z
m/z
Cl
Br
m/z=112(M+)
m/z=113(M+ +1)
m/z=114(M+ +2)
m/z=115(M+ +3)
m/z=77
35Cl 34.96885 75.7737Cl 36.96590 24.23 (32.5%)
79Br 78.91839 50.6981Br 80.91642 49.31 (98%)
m/z=77
m/z=156(M+)
m/z=158(M+ +2)
m/z=157(M+ +1)
m/z=159(M+ +3)
8
Mass spectra can be quite complicated and interpretation difficult.
Some functional groups have characteristic fragmentation
It is difficult to assign an entire structure based only on the mass spectra. However, the mass spectra gives the mass and formula of the sample which is very important information.
To obtain the formula, the molecular ion must be observed.Soft ionization techniques
Methods have been developed to get large molecules such as polymers and biological macromolecules (proteins, peptides, nucleic acids) into the vapor phase
5
9
13.25: Molecular Formula as a Clue to Structure
Nitrogen rule: In general, “small” organic molecules with anodd mass must have an odd number of nitrogens. Organic molecules with an even mass have zero or aneven number of nitrogens
If the mass can be determined accurately enough, then the molecular formula can be determined (high-resolution mass spectrometry)
Information can be obtained from the molecular formula:Degrees of unsaturation: the number of rings and/or
π-bonds in a molecule (Index of Hydrogen Deficiency)
10
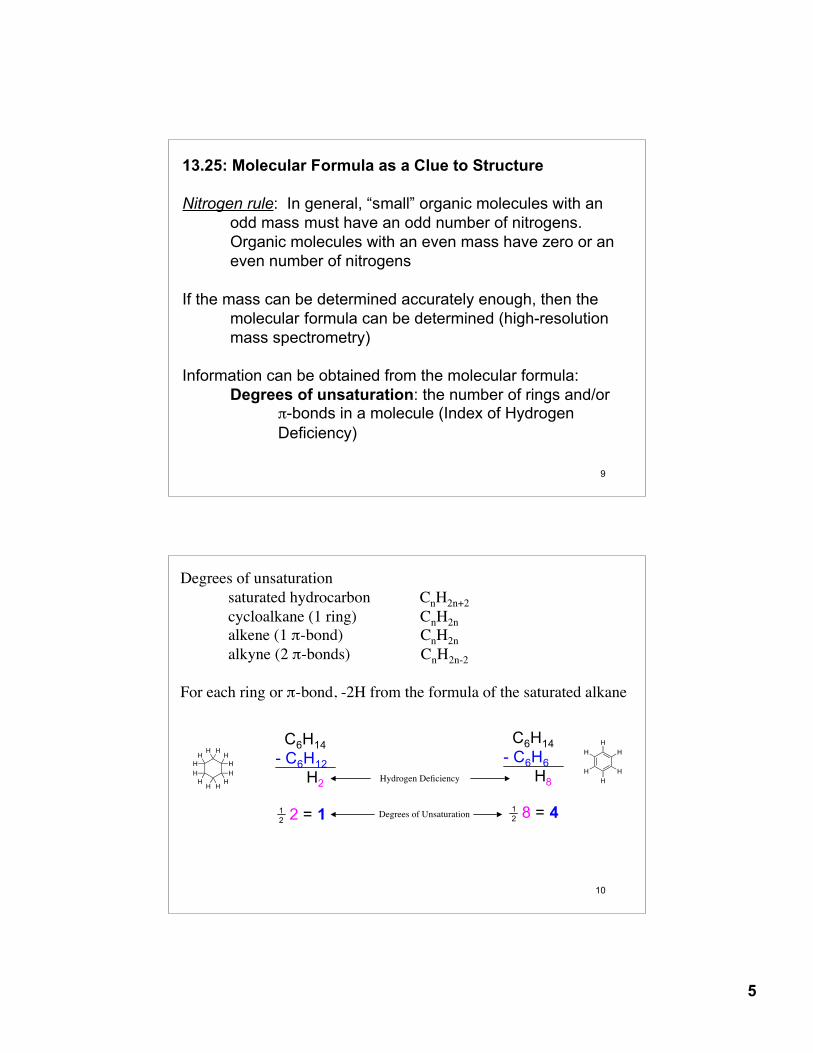
Degrees of unsaturationsaturated hydrocarbon CnH2n+2cycloalkane (1 ring) CnH2nalkene (1 π-bond) CnH2nalkyne (2 π-bonds) CnH2n-2
For each ring or π-bond, -2H from the formula of the saturated alkane
HH
H
H
H
H
H H
H
H
H
H
C6H14- C6H12 H2
2 = 112
C6H14- C6H6 H8
8 = 412
H
H
H
H
H
H
Hydrogen Deficiency
Degrees of Unsaturation
6
11
Correction for other elements:
For Group VII elements (halogens): subtract 1H from the H-deficiency for each halogen,
For Group VI elements (O and S): No correction is needed
For Group V elements (N and P): add 1H to the H-deficiency for each N or P
C12H4O2Cl4
C10H14N2
12
13.1: Principles of molecular spectroscopy:Electromagnetic radiation
λ = distance of one waveν = frequency: waves per unit time (sec-1, Hz)c = speed of light (3.0 x 10⁸ m • sec-1)h = Plank’s constant (6.63 x 10⁻³⁴ J • sec)
Electromagnetic radiation has the properties of a particle (photon) and a wave.
organicmolecule
(ground state)
light
hν
organicmolecule
(excited state)
organicmolecule
(ground state)
+ hνrelaxation
7
13
h•cλ
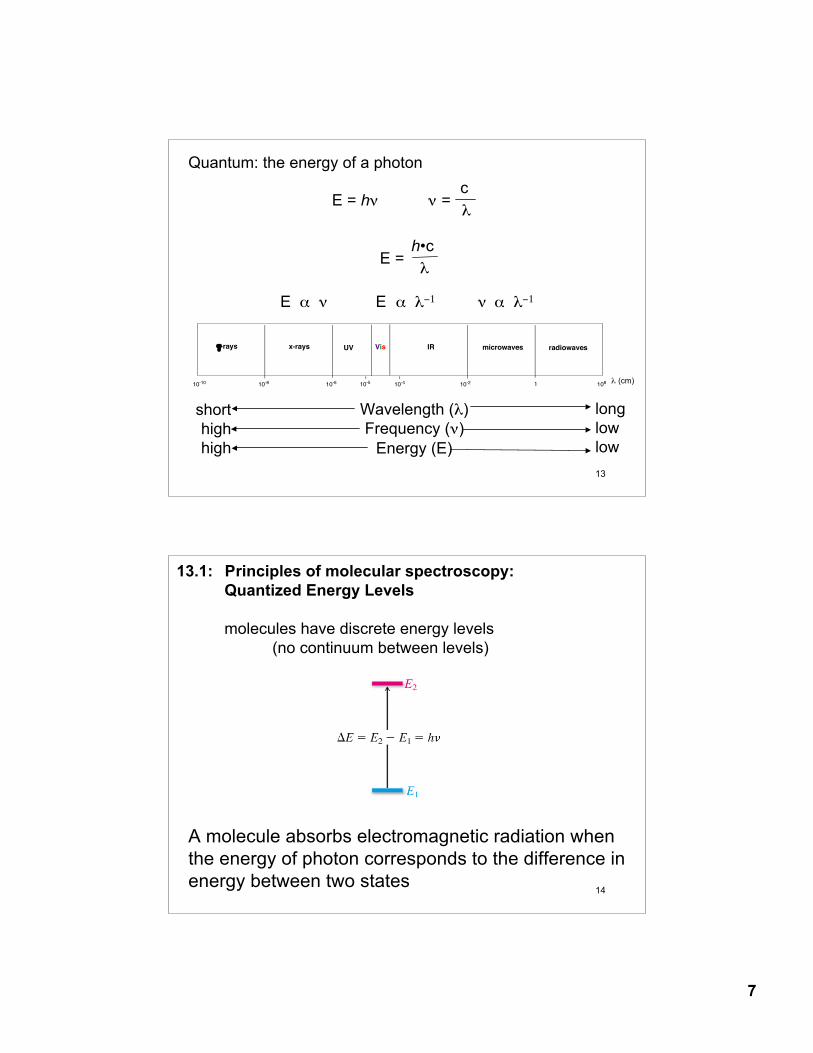
Quantum: the energy of a photon
E = hν ν =
E =
cλ
10-10
10-8
!-rays
10-6
x-rays
10-5
UV Vis
10-4
IR
10-2 1
microwaves radiowaves
108 λ (cm)
shorthighhigh
Wavelength (λ)Frequency (ν)
Energy (E)
longlowlow
E α ν E α λ−1 ν α λ−1
14
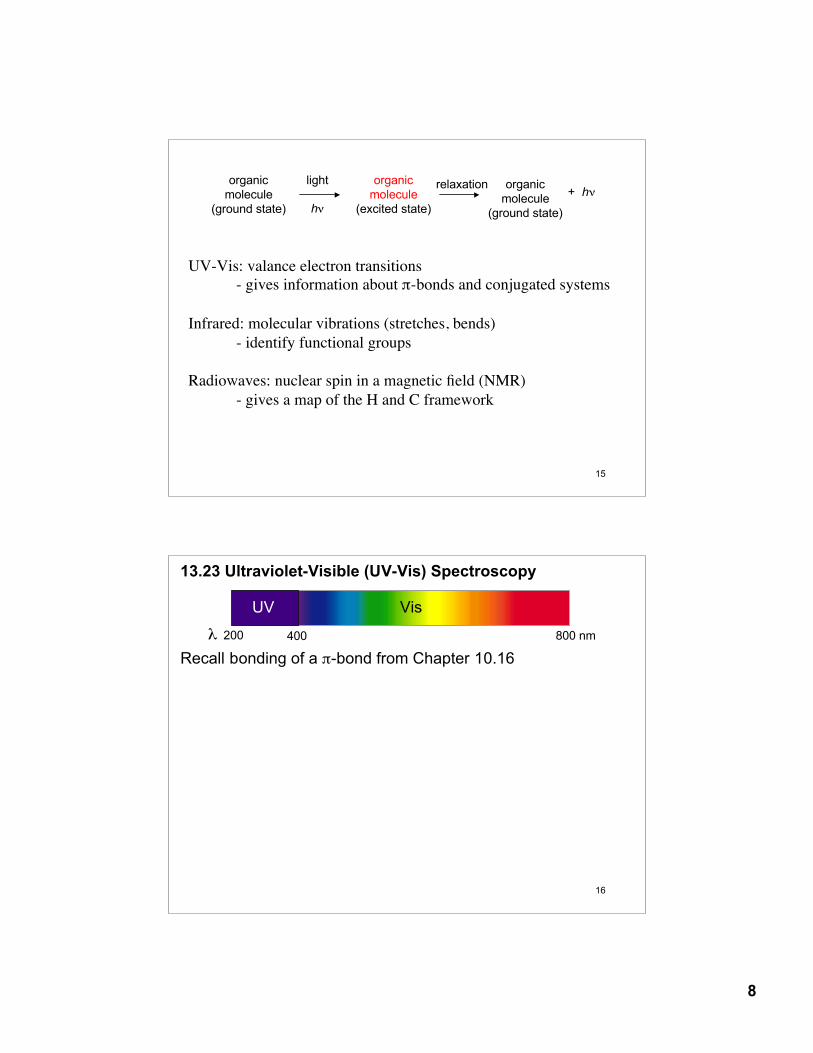
13.1: Principles of molecular spectroscopy:Quantized Energy Levels
molecules have discrete energy levels (no continuum between levels)
A molecule absorbs electromagnetic radiation when the energy of photon corresponds to the difference in energy between two states
8
15
UV-Vis: valance electron transitions - gives information about π-bonds and conjugated systems
Infrared: molecular vibrations (stretches, bends)- identify functional groups
Radiowaves: nuclear spin in a magnetic field (NMR)- gives a map of the H and C framework
organicmolecule
(ground state)
light
hν
organicmolecule
(excited state)
organicmolecule
(ground state)
+ hνrelaxation
16
13.23 Ultraviolet-Visible (UV-Vis) Spectroscopy
λ 200
UV
400 800 nm
Vis
Recall bonding of a π-bond from Chapter 10.16
9
17
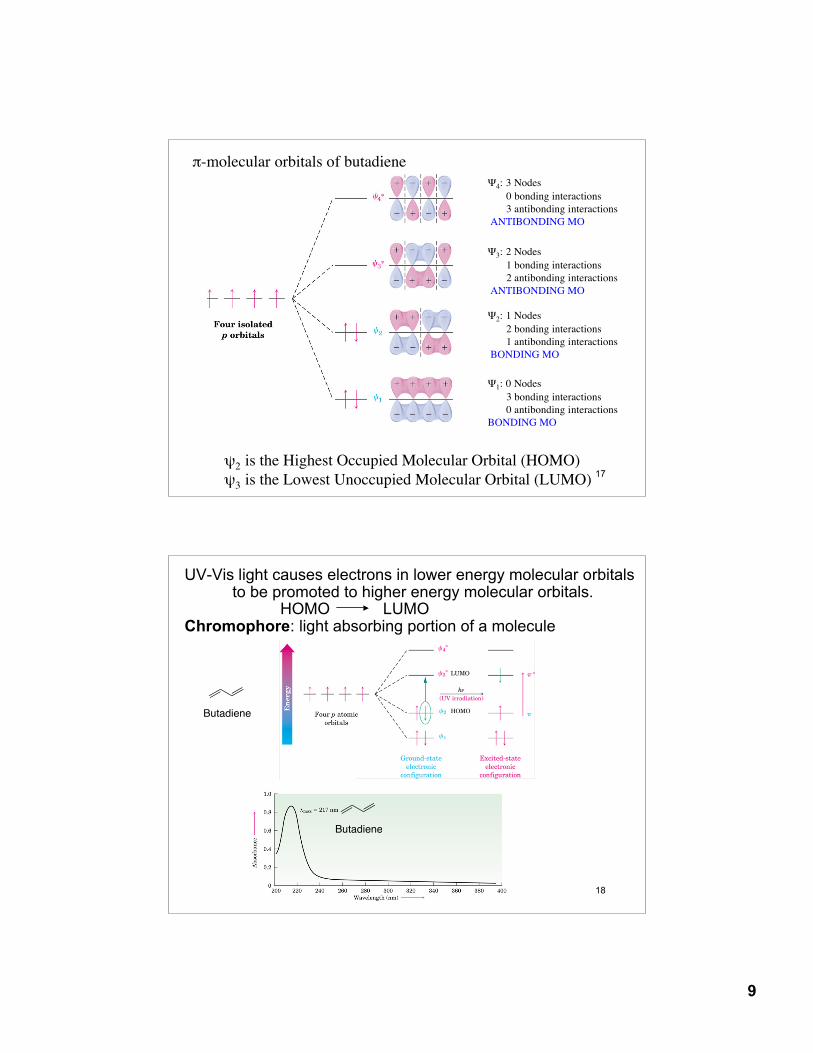
π-molecular orbitals of butadiene
Ψ1: 0 Nodes 3 bonding interactions 0 antibonding interactionsBONDING MO
Ψ2: 1 Nodes 2 bonding interactions 1 antibonding interactions BONDING MO
Ψ3: 2 Nodes 1 bonding interactions 2 antibonding interactions ANTIBONDING MO
Ψ4: 3 Nodes 0 bonding interactions 3 antibonding interactions ANTIBONDING MO
ψ2 is the Highest Occupied Molecular Orbital (HOMO)ψ3 is the Lowest Unoccupied Molecular Orbital (LUMO)
18
UV-Vis light causes electrons in lower energy molecular orbitalsto be promoted to higher energy molecular orbitals.
HOMO LUMOChromophore: light absorbing portion of a molecule
Butadiene
Butadiene
10
19
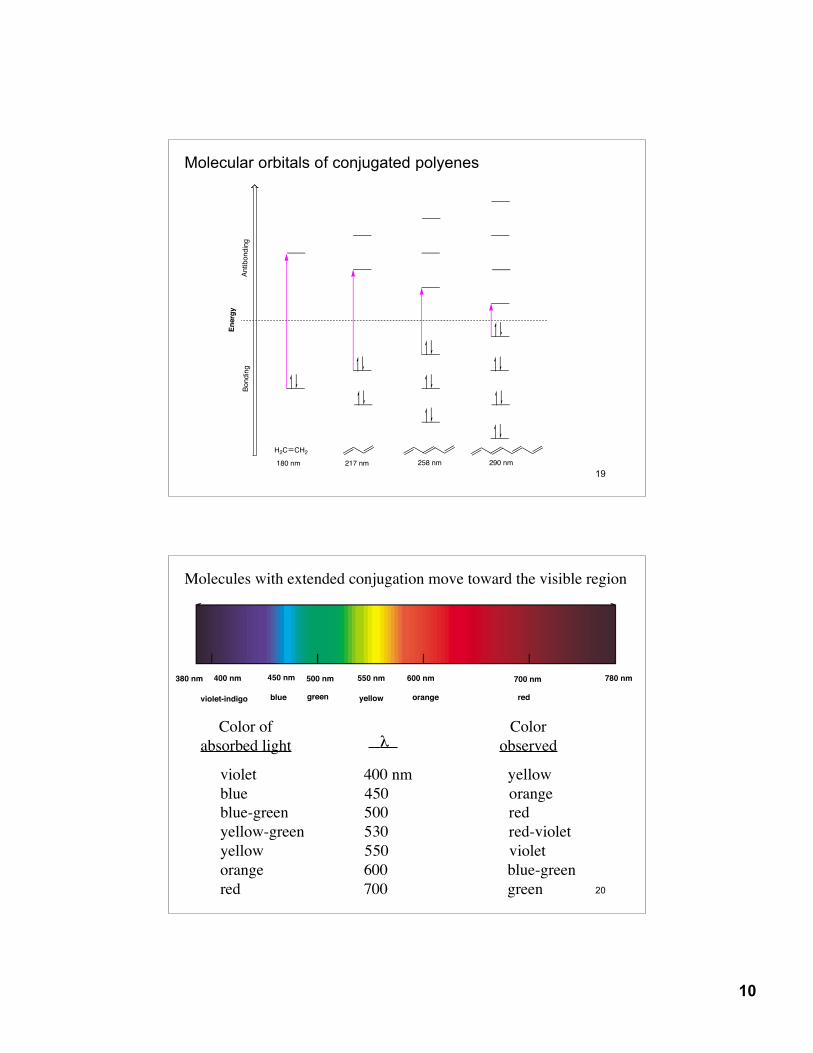
Molecular orbitals of conjugated polyenes
Bo
nd
ing
Antibo
nd
ing
Energy
H2C CH2
180 nm 217 nm 258 nm 290 nm
20
violet 400 nm yellowblue 450 orangeblue-green 500 redyellow-green 530 red-violetyellow 550 violetorange 600 blue-greenred 700 green
Color ofabsorbed light λ
Colorobserved
380 nm 780 nm400 nm 450 nm 500 nm 550 nm 600 nm 700 nm
redorangeyellowgreenblueviolet-indigo
Molecules with extended conjugation move toward the visible region
11
21
N
N
N
N Mg
O
CO2CH3
O
O
Chlorophyll
β-carotene
lycopene
OHO
OH
OH
O
OH
OH
OHO
OH
OH
OH
+
anthocyanin
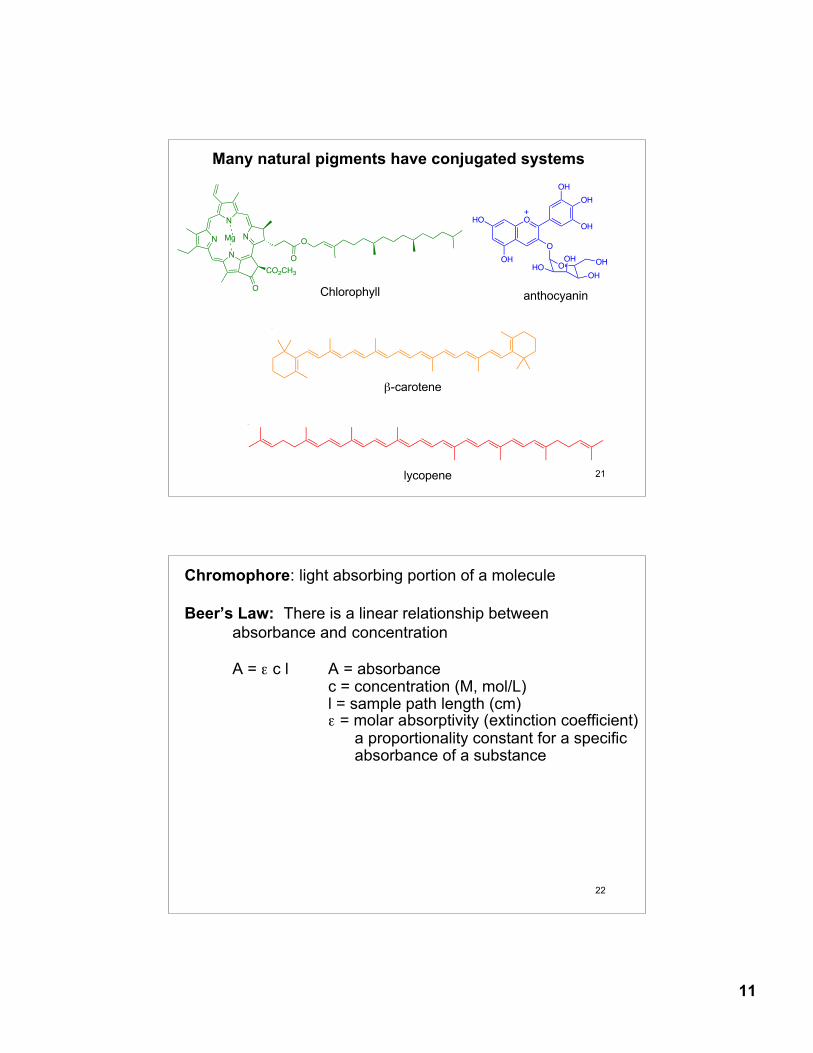
Many natural pigments have conjugated systems
22
Chromophore: light absorbing portion of a molecule
Beer’s Law: There is a linear relationship between absorbance and concentration
A = ε c l A = absorbancec = concentration (M, mol/L)l = sample path length (cm)ε = molar absorptivity (extinction coefficient) a proportionality constant for a specific absorbance of a substance
12
23
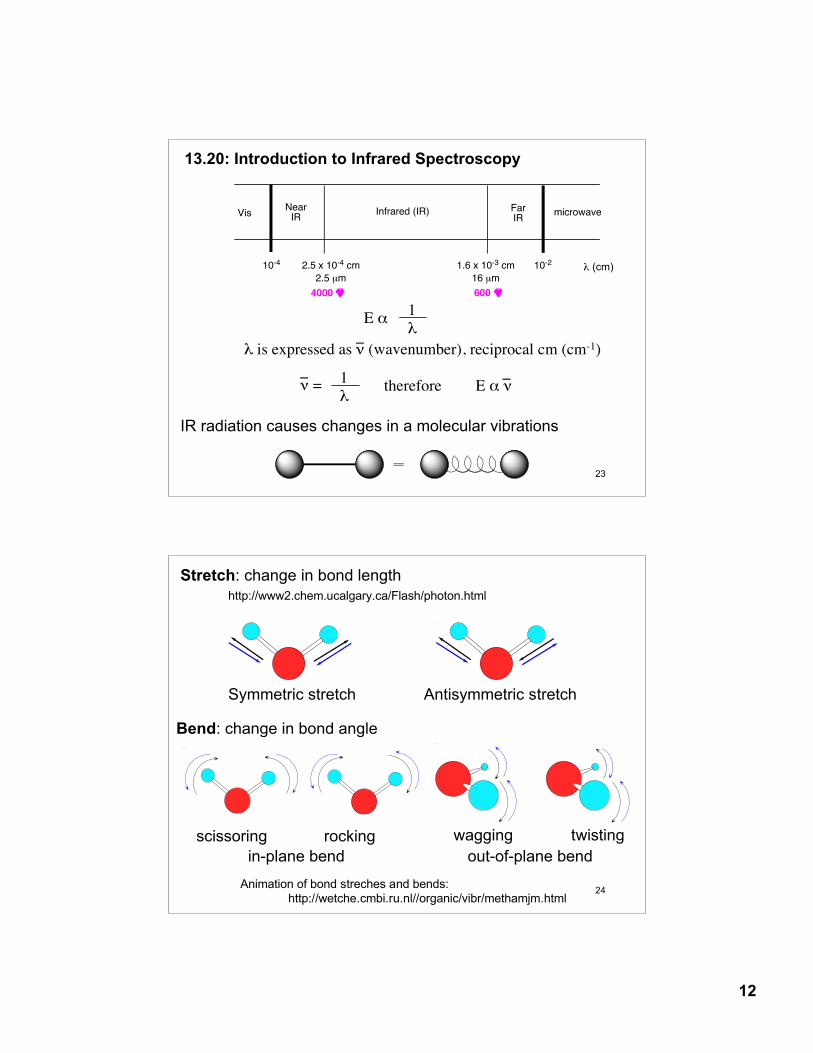
13.20: Introduction to Infrared Spectroscopy
E α 1λ
λ is expressed as ν (wavenumber), reciprocal cm (cm-1)_ ν = 1
λE α ν
_therefore
_
λ (cm)
VisNear
IRFarIR
Infrared (IR) microwave
2.5 x 10⁻⁴ cm
2.5 µm
1.6 x 10⁻³ cm
16 µm
10-4 10-2
!_
4000 !_
600
IR radiation causes changes in a molecular vibrations
24
Symmetric stretch Antisymmetric stretch
Stretch: change in bond lengthhttp://www2.chem.ucalgary.ca/Flash/photon.html
in-plane bend out-of-plane bendscissoring rocking wagging twisting
Bend: change in bond angle
>
>> >
>
>
>
>
>
>
>
> >
>
>
>
Animation of bond streches and bends: http://wetche.cmbi.ru.nl//organic/vibr/methamjm.html
13
25
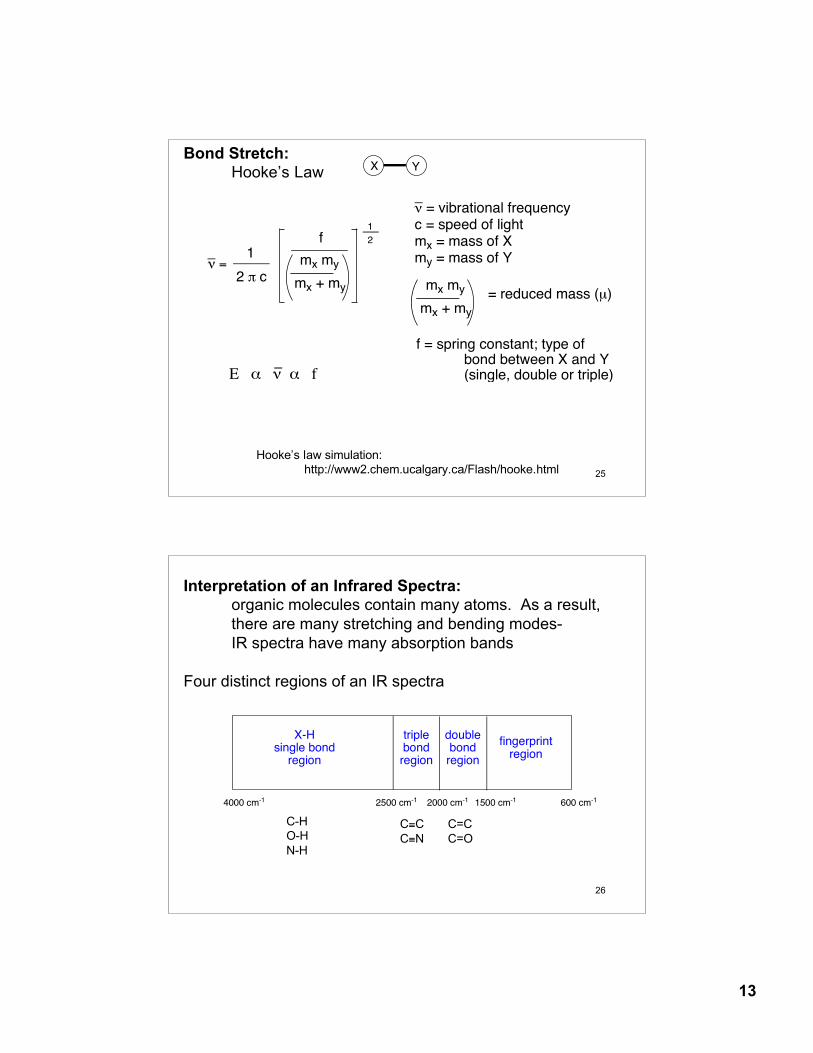
Bond Stretch:Hooke’s Law
! =_
2 " c
1mx my
mx + my
f1
2
X Y
! = vibrational frequencyc = speed of lightmx = mass of Xmy = mass of Y
_
mx my
mx + my
= reduced mass (µ)
f = spring constant; type of bond between X and Y (single, double or triple)E α ν α f
_
Hooke’s law simulation:http://www2.chem.ucalgary.ca/Flash/hooke.html
26
Interpretation of an Infrared Spectra:organic molecules contain many atoms. As a result, there are many stretching and bending modes- IR spectra have many absorption bands
Four distinct regions of an IR spectra
4000 cm-1 600 cm-11500 cm-1
fingerprintregion
doublebondregion
2000 cm-12500 cm-1
triplebondregion
X-Hsingle bond
region
C-HO-HN-H
C≡CC≡N
C=CC=O
14
27
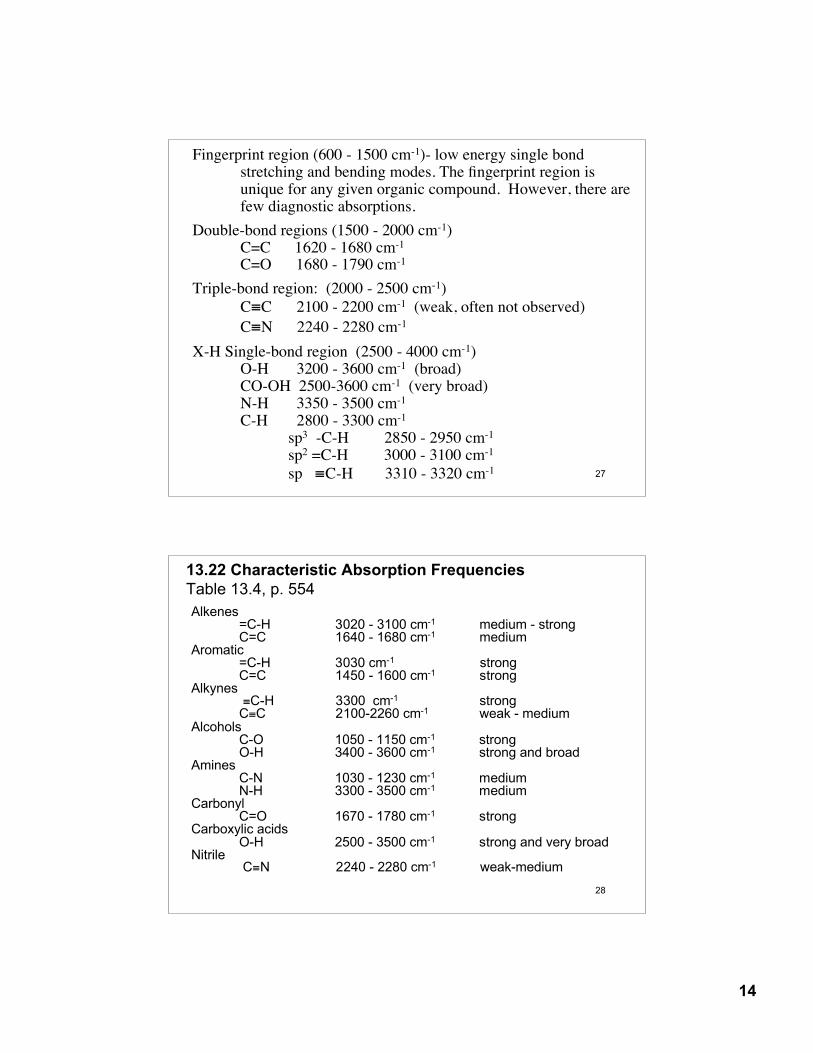
Fingerprint region (600 - 1500 cm-1)- low energy single bondstretching and bending modes. The fingerprint region is unique for any given organic compound. However, there arefew diagnostic absorptions.
Double-bond regions (1500 - 2000 cm-1)C=C 1620 - 1680 cm-1 C=O 1680 - 1790 cm-1
Triple-bond region: (2000 - 2500 cm-1)C≡C 2100 - 2200 cm-1 (weak, often not observed)C≡N 2240 - 2280 cm-1
X-H Single-bond region (2500 - 4000 cm-1)O-H 3200 - 3600 cm-1 (broad)CO-OH 2500-3600 cm-1 (very broad)N-H 3350 - 3500 cm-1
C-H 2800 - 3300 cm-1
sp3 -C-H 2850 - 2950 cm-1
sp2 =C-H 3000 - 3100 cm-1
sp ≡C-H 3310 - 3320 cm-1
28
Alkenes=C-H 3020 - 3100 cm-1 medium - strongC=C 1640 - 1680 cm-1 medium
Aromatic=C-H 3030 cm-1 strongC=C 1450 - 1600 cm-1 strong
Alkynes ≡C-H 3300 cm-1 strongC≡C 2100-2260 cm-1 weak - medium
AlcoholsC-O 1050 - 1150 cm-1 strongO-H 3400 - 3600 cm-1 strong and broad
AminesC-N 1030 - 1230 cm-1 mediumN-H 3300 - 3500 cm-1 medium
CarbonylC=O 1670 - 1780 cm-1 strong
Carboxylic acidsO-H 2500 - 3500 cm-1 strong and very broad
Nitrile C≡N 2240 - 2280 cm-1 weak-medium
13.22 Characteristic Absorption FrequenciesTable 13.4, p. 554
15
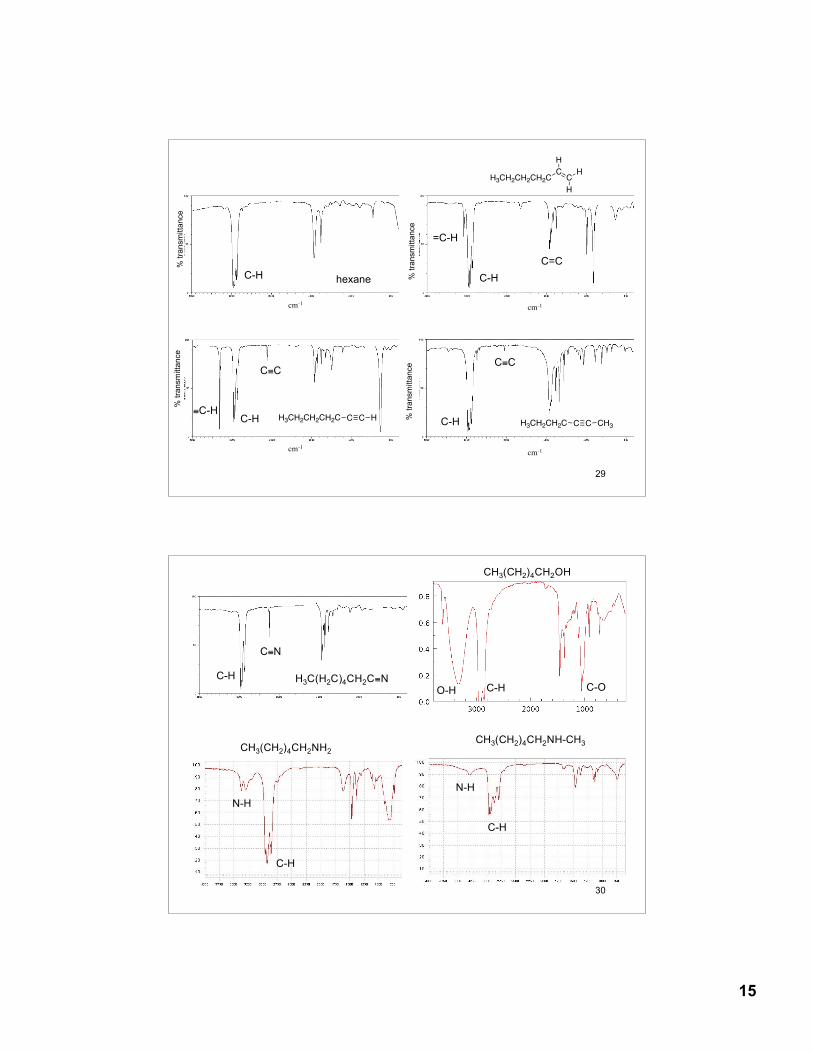
29
H3CH2CH2CH2C
H
CC
H
H%
tran
smitt
ance
% tr
ansm
ittan
ce
cm-1
C-H≡C-H
C≡C
C C HH3CH2CH2CH2C % tr
ansm
ittan
ce
cm-1
C-H
C≡C
C C CH3H3CH2CH2C
C-H hexane
cm-1
C-HC=C
=C-H
% tr
ansm
ittan
ce
cm-1
30
O-H C-H C-O
CH3(CH2)4CH2OH
CH3(CH2)4CH2NH2
N-H
C-H
CH3(CH2)4CH2NH-CH3
N-H
C-H
C-H
C≡N
H3C(H2C)4CH2C≡N
16
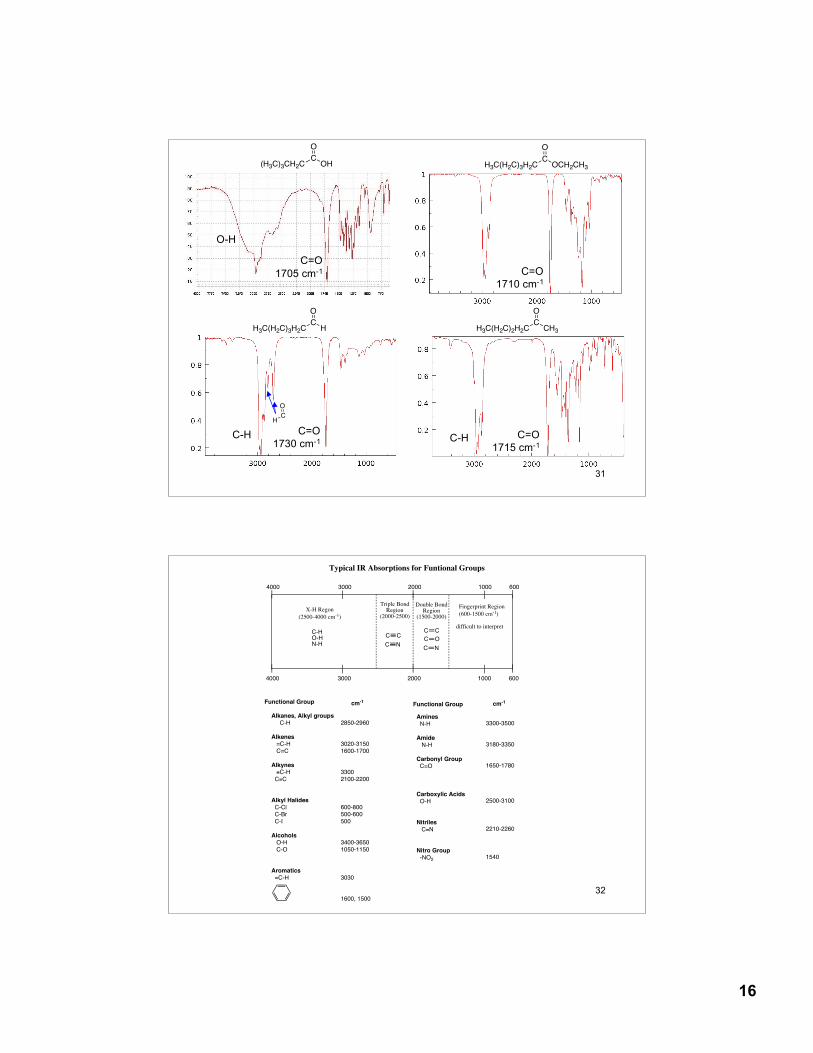
31
O
COCH2CH3H3C(H2C)3H2C
O
COH(H3C)3CH2C
O-H
C-HC=O
1730 cm-1
O
CHH3C(H2C)3H2C
C-H
O
CCH3H3C(H2C)2H2C
C=O1715 cm-1
C=O1710 cm-1
C=O1705 cm-1
O
CH
32
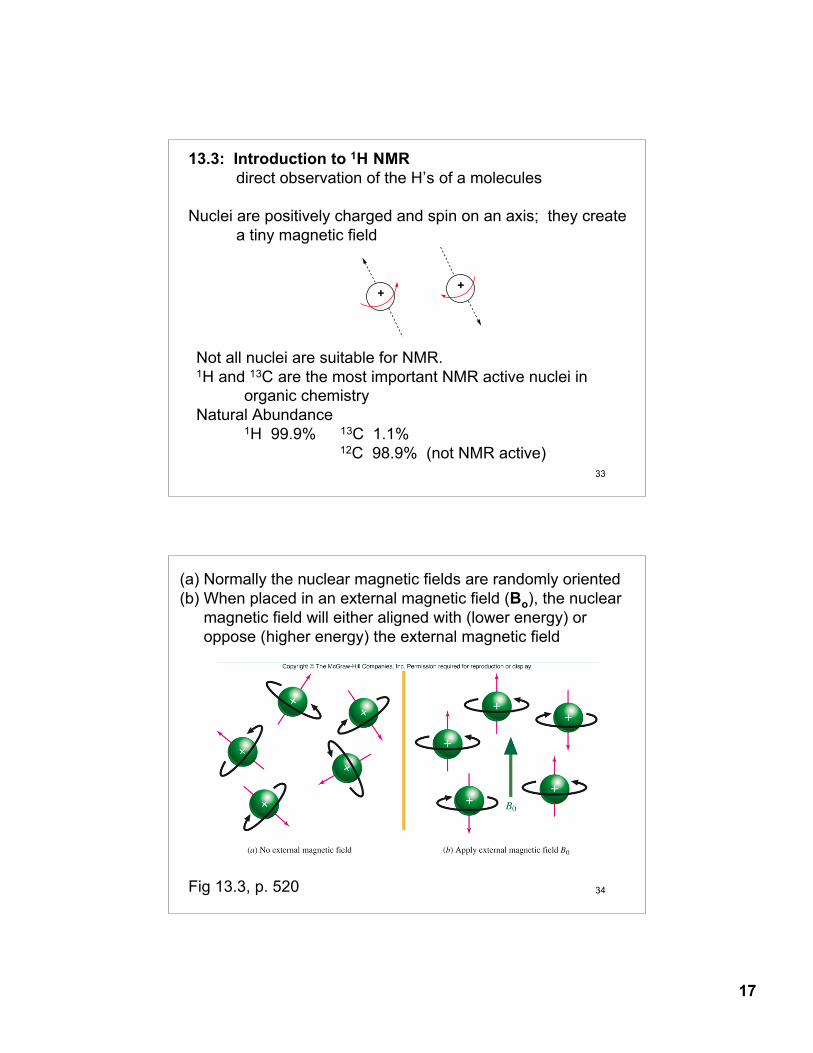
4000 6003000 2000 1000
4000 6003000 2000 1000
X-H Regon
(2500-4000 cm-1)
C-HO-HN-H
Triple BondRegion
(2000-2500)
C C
C N
Double BondRegion
(1500-2000)
Fingerprint Region
(600-1500 cm-1)
C O
C N
C Cdifficult to interpret
Alkanes, Alkyl groups C-H
Alkenes =C-H
C=C
Alkynes !C-H
C!C
Alkyl Halides C-Cl
C-Br
C-I
Alcohols O-H
C-O
Aromatics =C-H
2850-2960
3020-3150
1600-1700
3300
2100-2200
600-800
500-600
500
3400-3650
1050-1150
3030
1600, 1500
Amines N-H
Amide N-H
Carbonyl Group C=O
Carboxylic Acids O-H
Nitriles C!N
Nitro Group -NO2
3300-3500
3180-3350
1650-1780
2500-3100
2210-2260
1540
cm-1Functional Group cm-1
Typical IR Absorptions for Funtional Groups
Functional Group
17
33
13.3: Introduction to 1H NMRdirect observation of the H’s of a molecules
Nuclei are positively charged and spin on an axis; they createa tiny magnetic field
++
Not all nuclei are suitable for NMR. 1H and 13C are the most important NMR active nuclei in
organic chemistry Natural Abundance
1H 99.9% 13C 1.1%12C 98.9% (not NMR active)
34
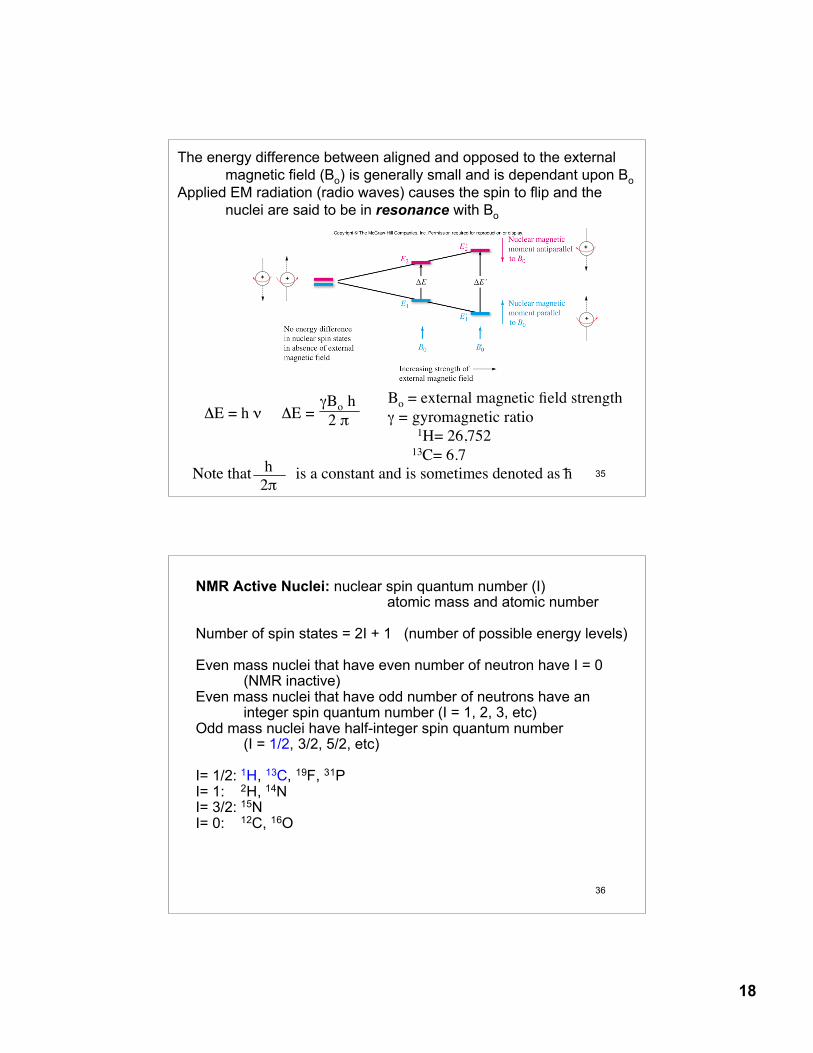
(a) Normally the nuclear magnetic fields are randomly oriented(b) When placed in an external magnetic field (Bo), the nuclear
magnetic field will either aligned with (lower energy) oroppose (higher energy) the external magnetic field
Fig 13.3, p. 520
18
35
The energy difference between aligned and opposed to the externalmagnetic field (Bo) is generally small and is dependant upon Bo
Applied EM radiation (radio waves) causes the spin to flip and the nuclei are said to be in resonance with Bo
ΔE = h ν ΔE =γBo h 2 π
Bo = external magnetic field strengthγ = gyromagnetic ratio
1H= 26,75213C= 6.7
Note that is a constant and is sometimes denoted as hh2π
+
+
+
+
36
NMR Active Nuclei: nuclear spin quantum number (I)atomic mass and atomic number
Number of spin states = 2I + 1 (number of possible energy levels)
Even mass nuclei that have even number of neutron have I = 0 (NMR inactive)
Even mass nuclei that have odd number of neutrons have an integer spin quantum number (I = 1, 2, 3, etc)
Odd mass nuclei have half-integer spin quantum number(I = 1/2, 3/2, 5/2, etc)
I= 1/2: 1H, 13C, 19F, 31PI= 1: 2H, 14NI= 3/2: 15NI= 0: 12C, 16O
19
37
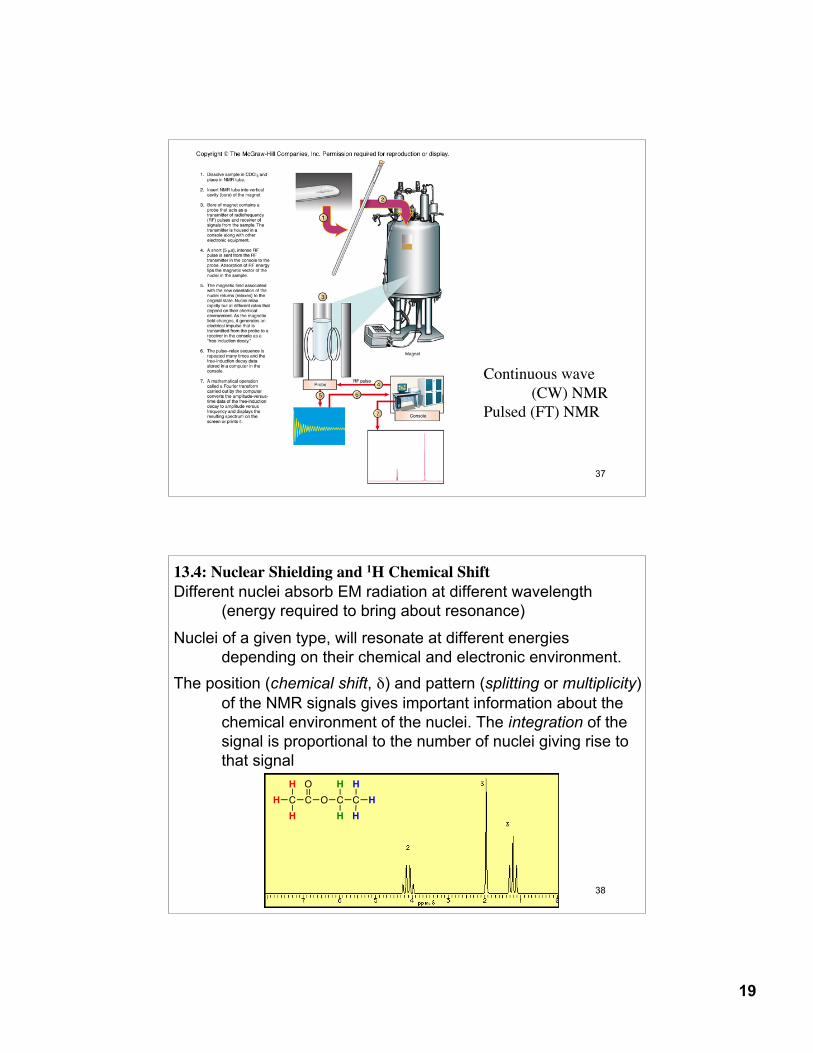
Continuous wave (CW) NMR
Pulsed (FT) NMR
38
13.4: Nuclear Shielding and 1H Chemical ShiftDifferent nuclei absorb EM radiation at different wavelength
(energy required to bring about resonance)
Nuclei of a given type, will resonate at different energies depending on their chemical and electronic environment.
The position (chemical shift, δ) and pattern (splitting or multiplicity) of the NMR signals gives important information about the chemical environment of the nuclei. The integration of thesignal is proportional to the number of nuclei giving rise tothat signal
C C
O
O C C
H
H H
H
H
H
H
H
20
39
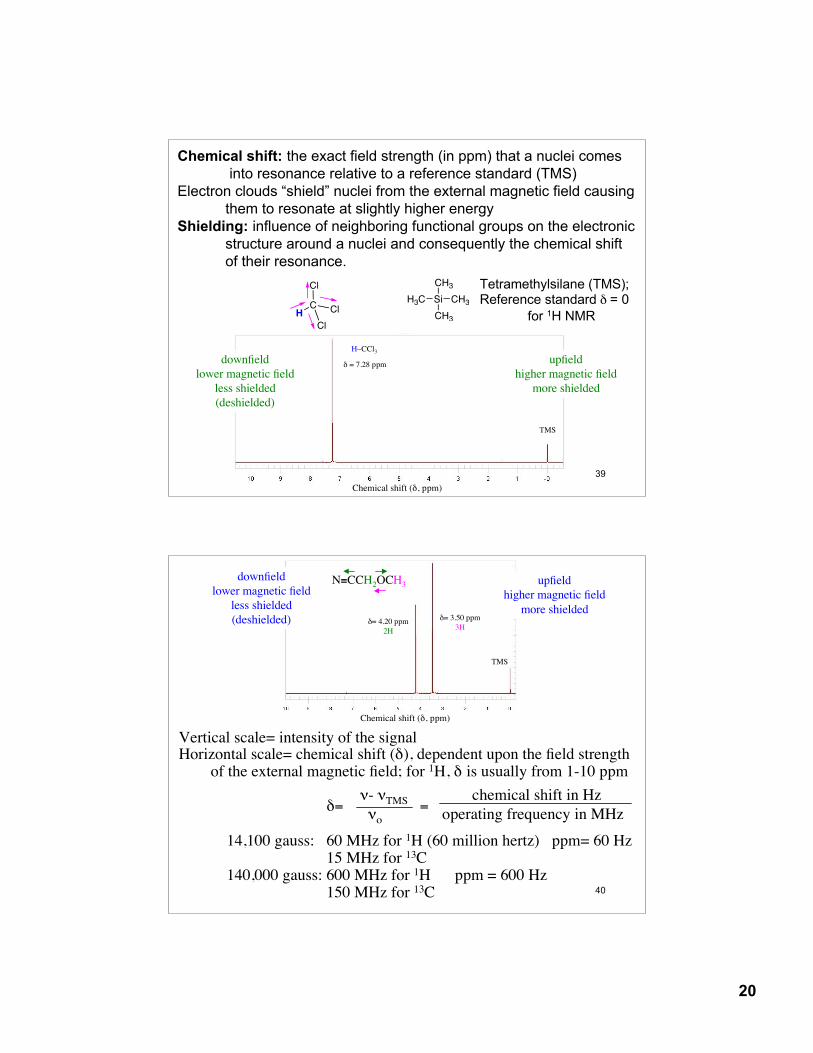
Chemical shift: the exact field strength (in ppm) that a nuclei comes into resonance relative to a reference standard (TMS)
Electron clouds “shield” nuclei from the external magnetic field causing them to resonate at slightly higher energy
Shielding: influence of neighboring functional groups on the electronic structure around a nuclei and consequently the chemical shiftof their resonance.
Si
CH3
CH3
CH3H3C
Tetramethylsilane (TMS);Reference standard δ = 0
for 1H NMR
δ = 7.28 ppm
H–CCl3
Chemical shift (δ, ppm)
downfieldlower magnetic field
less shielded(deshielded)
upfieldhigher magnetic field
more shielded
TMS
HC
Cl
Cl
Cl
40
Vertical scale= intensity of the signal Horizontal scale= chemical shift (δ), dependent upon the field strength of the external magnetic field; for 1H, δ is usually from 1-10 ppm
δ= =
14,100 gauss: 60 MHz for 1H (60 million hertz) ppm= 60 Hz 15 MHz for 13C
140,000 gauss: 600 MHz for 1H ppm = 600 Hz 150 MHz for 13C
ν- νTMS chemical shift in Hz νο operating frequency in MHz
upfieldhigher magnetic field
more shielded
downfieldlower magnetic field
less shielded(deshielded)
Chemical shift (δ, ppm)
TMS
N≡CCH2OCH3
δ= 3.50 ppm3H
δ= 4.20 ppm2H
21
41
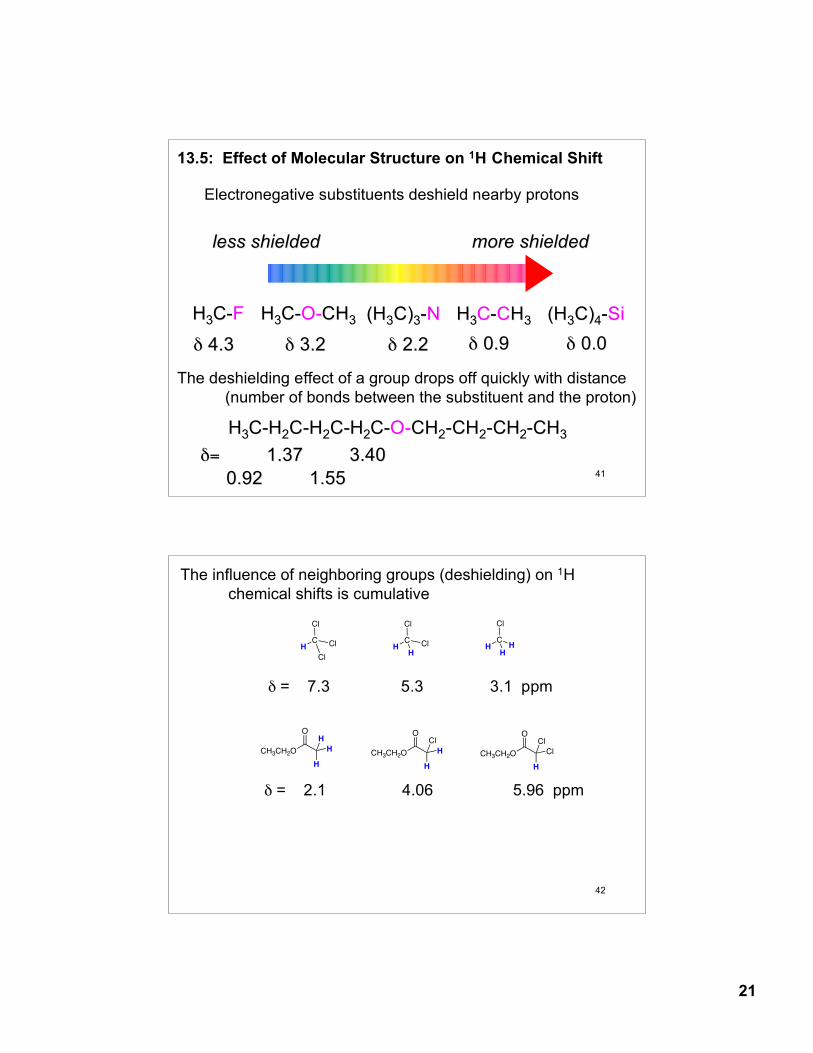
13.5: Effect of Molecular Structure on 1H Chemical Shift
less shieldedless shielded more shieldedmore shielded
HH33C-C-FF HH33C-C-O-O-CHCH33 (H(H33C)C)33--NN HH33CC--CCHH33 (H(H33C)C)44--SiSi
δδ 4.3 4.3 δδ 3.2 3.2 δδ 2.2 2.2 δδ 0.9 0.9 δδ 0.0 0.0
Electronegative substituents deshield nearby protons
HH33C-HC-H22C-HC-H22C-HC-H22C-C-O-O-CHCH22-CH-CH22-CH-CH22-CH-CH33
δ= δ= 1.371.37 3.403.40 0.920.92 1.55 1.55
The deshielding effect of a group drops off quickly with distance(number of bonds between the substituent and the proton)
42
The influence of neighboring groups (deshielding) on 1Hchemical shifts is cumulative
HC
Cl
Cl
ClHC
Cl
H
ClHC
Cl
H
H
δ = 7.3 5.3 3.1 ppm
CH3CH2O
H
H
H
O
CH3CH2O
H
H
ClO
CH3CH2O
H
Cl
ClO
δ = 2.1 4.06 5.96 ppm
22
43
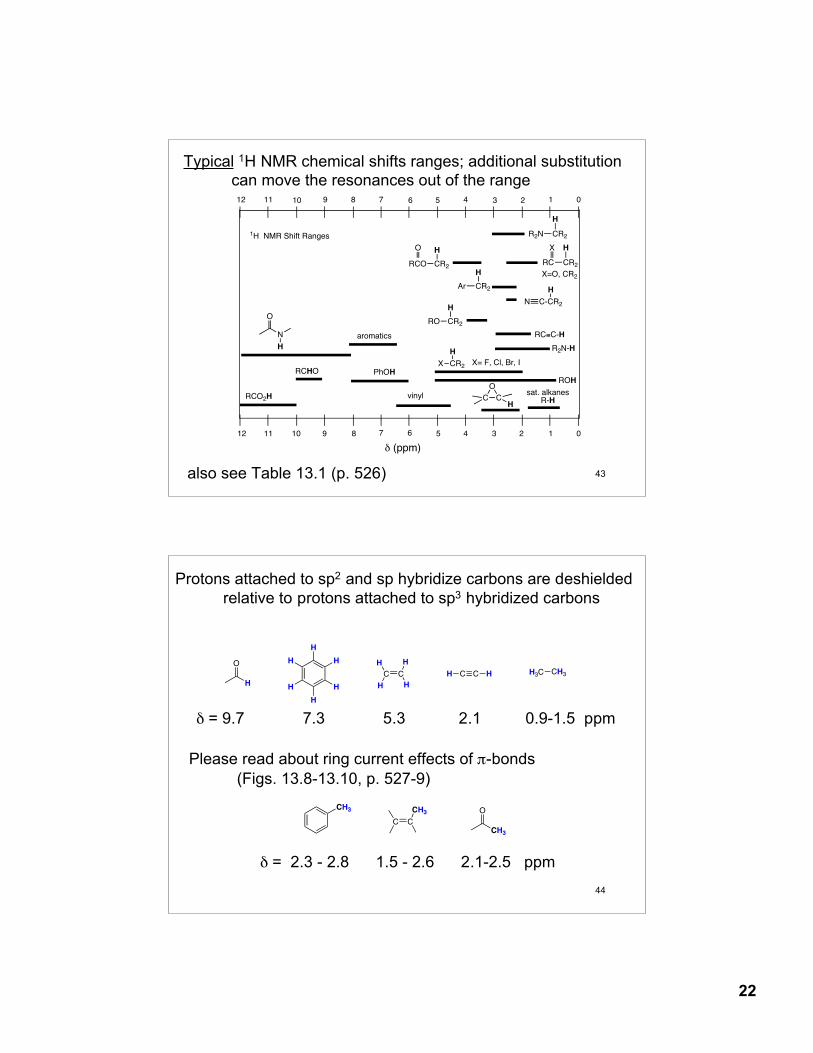
Typical 1H NMR chemical shifts ranges; additional substitutioncan move the resonances out of the range
also see Table 13.1 (p. 526)
0
0
123456
123456
789101112
12 1011 9 8 7
sat. alkanesR-H
aromatics RC!C-H
PhOHCR2X
H
X= F, Cl, Br, I
RC CR2
HX
X=O, CR2
CR2RCO
H
Ar CR2
H
O
1H NMR Shift Ranges
" (ppm)
vinyl
R2N CR2
H
C C
O
H
N
O
H
RCO2H
RCHOROH
R2N-H
N C-CR2
H
RO CR2
H
44
Protons attached to sp2 and sp hybridize carbons are deshielded relative to protons attached to sp3 hybridized carbons
H
H
H
H
H
H
C C C C
O
H
H3C CH3
H
H H
H
H H
δ = 9.7 7.3 5.3 2.1 0.9-1.5 ppm
Please read about ring current effects of π-bonds (Figs. 13.8-13.10, p. 527-9)
δ = 2.3 - 2.8 1.5 - 2.6 2.1-2.5 ppm
CH3
C C
CH3 O
CH3
23
45
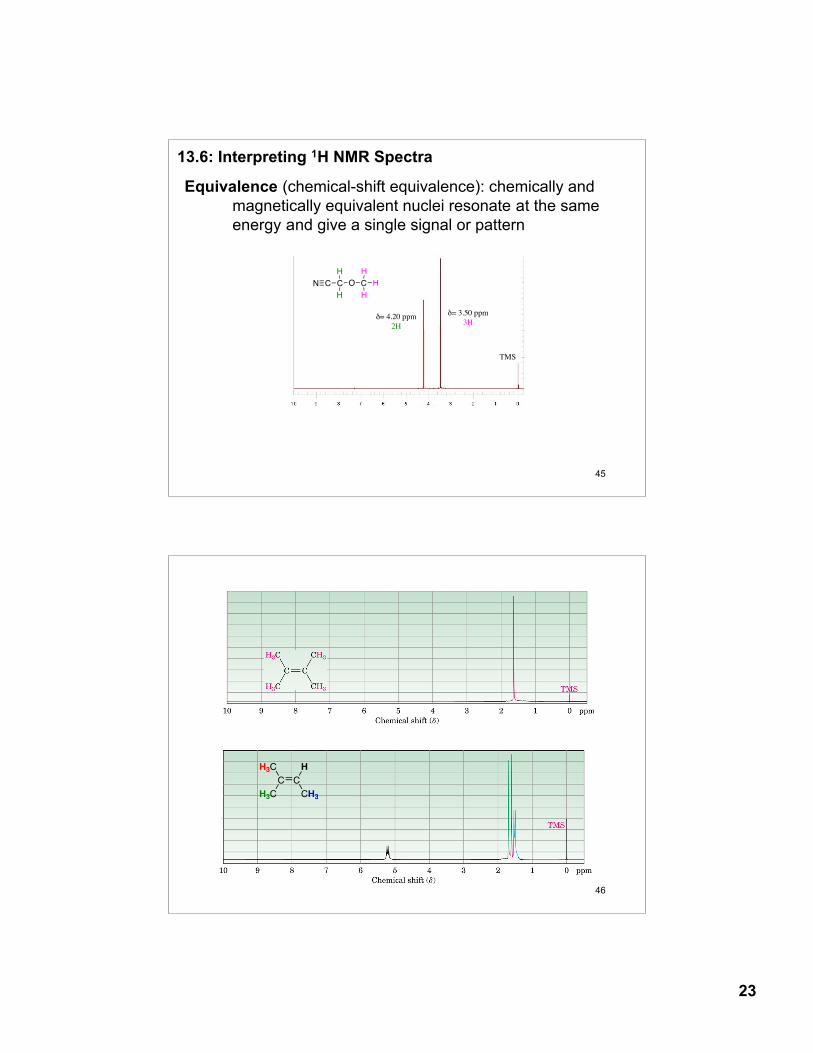
13.6: Interpreting 1H NMR Spectra
Equivalence (chemical-shift equivalence): chemically and magnetically equivalent nuclei resonate at the sameenergy and give a single signal or pattern
TMS
δ= 3.50 ppm3H
δ= 4.20 ppm2H
N C C
H
H
O C H
H
H
46
C C
H3C
H3C H
CH3
24
47
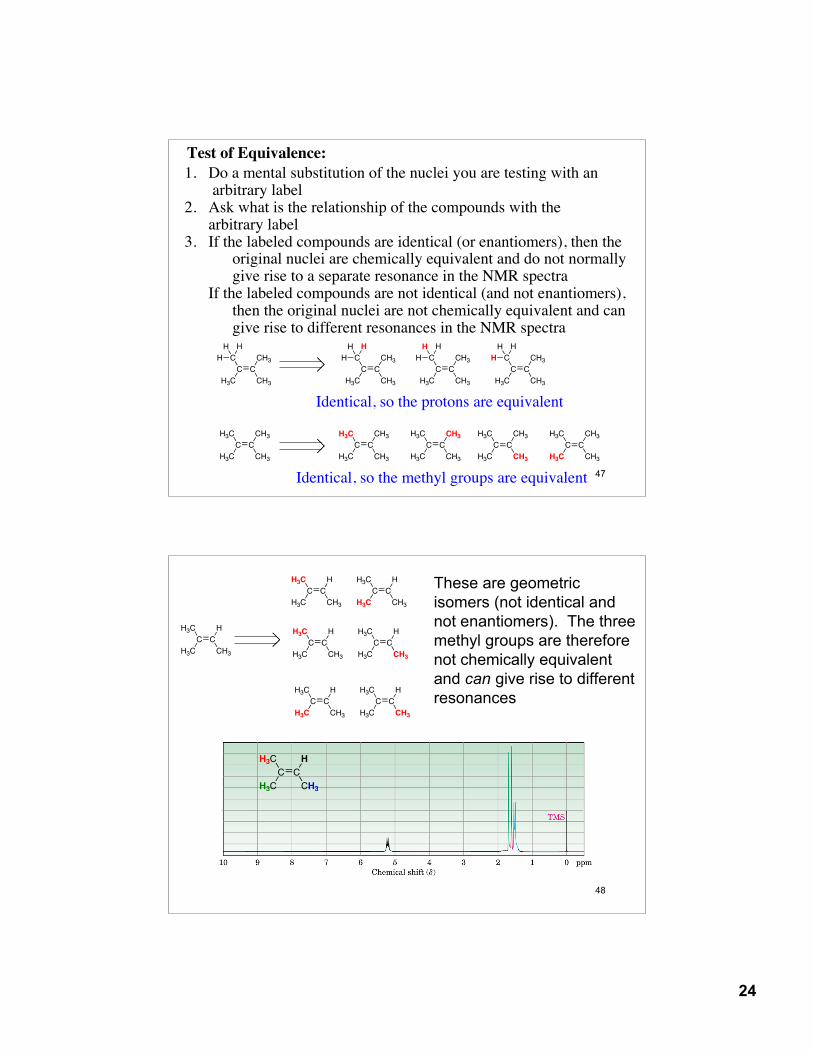
Test of Equivalence:1. Do a mental substitution of the nuclei you are testing with an
arbitrary label2. Ask what is the relationship of the compounds with the
arbitrary label3. If the labeled compounds are identical (or enantiomers), then the
original nuclei are chemically equivalent and do not normally give rise to a separate resonance in the NMR spectra
If the labeled compounds are not identical (and not enantiomers), then the original nuclei are not chemically equivalent and can give rise to different resonances in the NMR spectra
Identical, so the methyl groups are equivalent
Identical, so the protons are equivalent
C C
H3C
H3C CH3
CH3
C C
H3C
H3C CH3
CH3
C C
H3C
H3C CH3
CH3
C C
H3C
H3C CH3
CH3
C C
H3C
H3C CH3
CH3
C C
H3C
C CH3
CH3
H
H
H
C C
H3C
C CH3
CH3
H
H
H
C C
H3C
C CH3
CH3
H
H
H
C C
H3C
C CH3
CH3
H
H
H
48
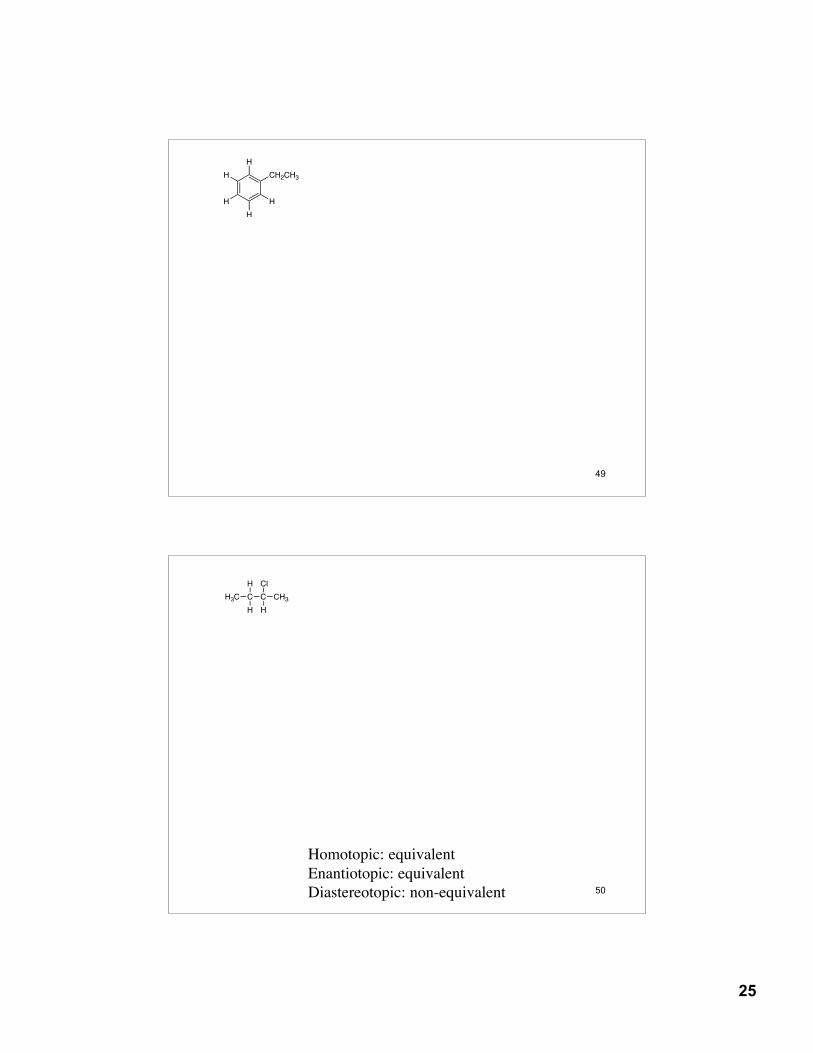
These are geometricisomers (not identical and not enantiomers). The threemethyl groups are thereforenot chemically equivalentand can give rise to differentresonances
C C
H3C
H3C H
CH3
C C
H3C
H3C H
CH3
C C
H3C
H3C H
CH3
C C
H3C
H3C H
CH3
C C
H3C
H3C H
CH3
C C
H3C
H3C H
CH3
C C
H3C
H3C H
CH3
C C
H3C
H3C H
CH3
25
49
CH2CH3
H
H
H
H
H
50
Homotopic: equivalentEnantiotopic: equivalentDiastereotopic: non-equivalent
H3C C C
H
H
Cl
H
CH3
26
51
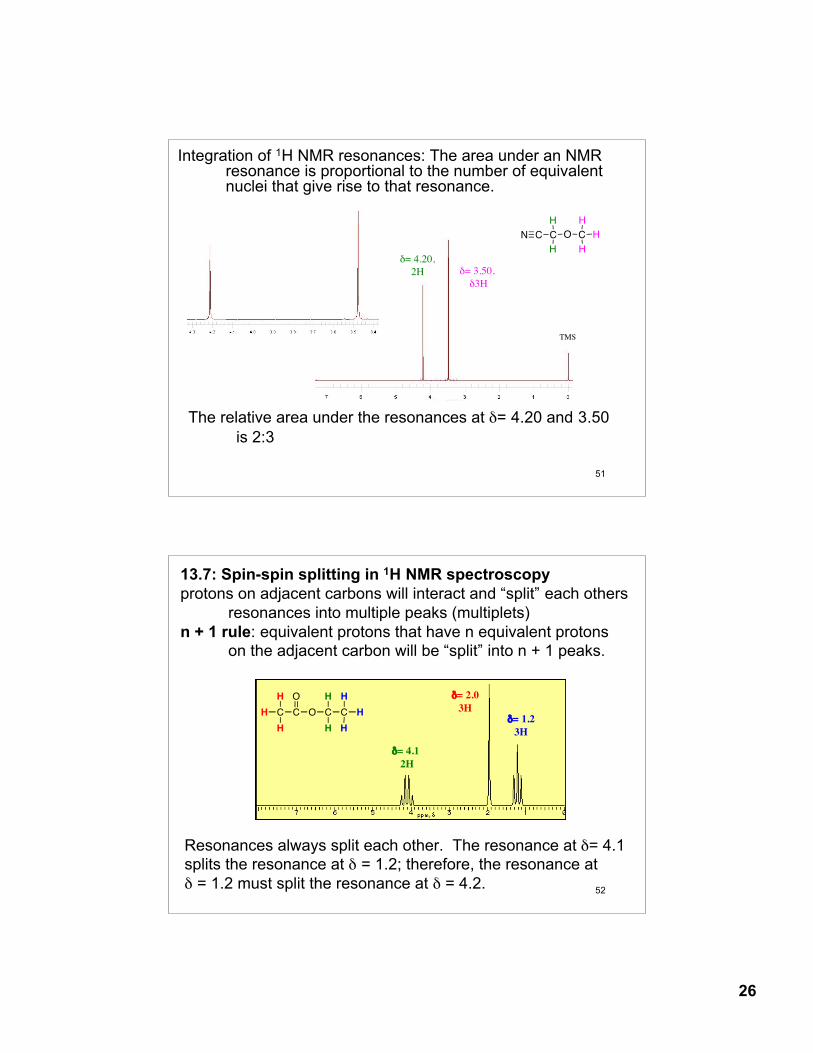
Integration of 1H NMR resonances: The area under an NMR resonance is proportional to the number of equivalent nuclei that give rise to that resonance.
The relative area under the resonances at δ= 4.20 and 3.50 is 2:3
TMS
δ= 3.50, δ3H
δ= 4.20,2H
N C C
H
H
O C H
H
H
52
13.7: Spin-spin splitting in 1H NMR spectroscopyprotons on adjacent carbons will interact and “split” each others
resonances into multiple peaks (multiplets)n + 1 rule: equivalent protons that have n equivalent protons
on the adjacent carbon will be “split” into n + 1 peaks.
δ= 4.1 2H
δ= 2.03H
δ= 1.23H
Resonances always split each other. The resonance at δ= 4.1 splits the resonance at δ = 1.2; therefore, the resonance at δ = 1.2 must split the resonance at δ = 4.2.
C C
O
O C C
H
H H
H
H
H
H
H
27
53
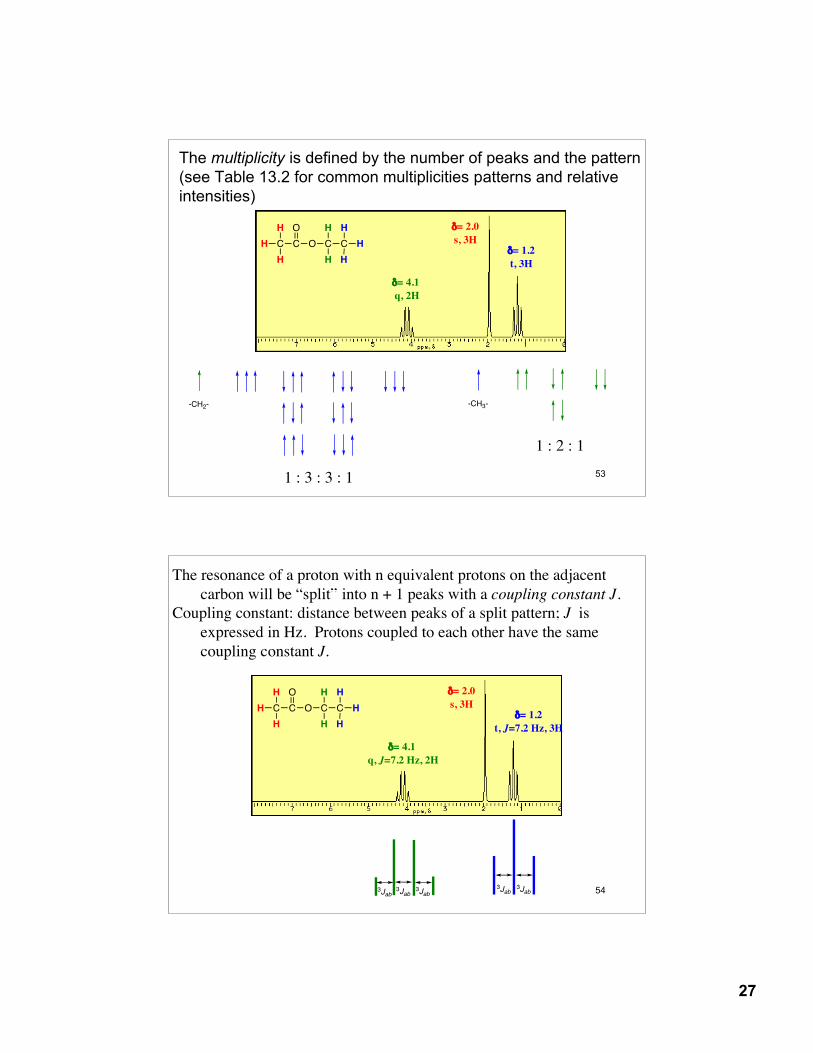
The multiplicity is defined by the number of peaks and the pattern(see Table 13.2 for common multiplicities patterns and relative intensities)
1 : 3 : 3 : 1
1 : 2 : 1
δ= 4.1 q, 2H
δ= 2.0s, 3H
δ= 1.2t, 3H
C C
O
O C C
H
H H
H
H
H
H
H
-CH2- -CH3-
54
The resonance of a proton with n equivalent protons on the adjacent carbon will be “split” into n + 1 peaks with a coupling constant J. Coupling constant: distance between peaks of a split pattern; J is expressed in Hz. Protons coupled to each other have the same coupling constant J.
δ= 4.1 q, J=7.2 Hz, 2H
δ= 2.0s, 3H
δ= 1.2t, J=7.2 Hz, 3H
C C
O
O C C
H
H H
H
H
H
H
H
3Jab3Jab
3Jab3Jab
3Jab
28
55
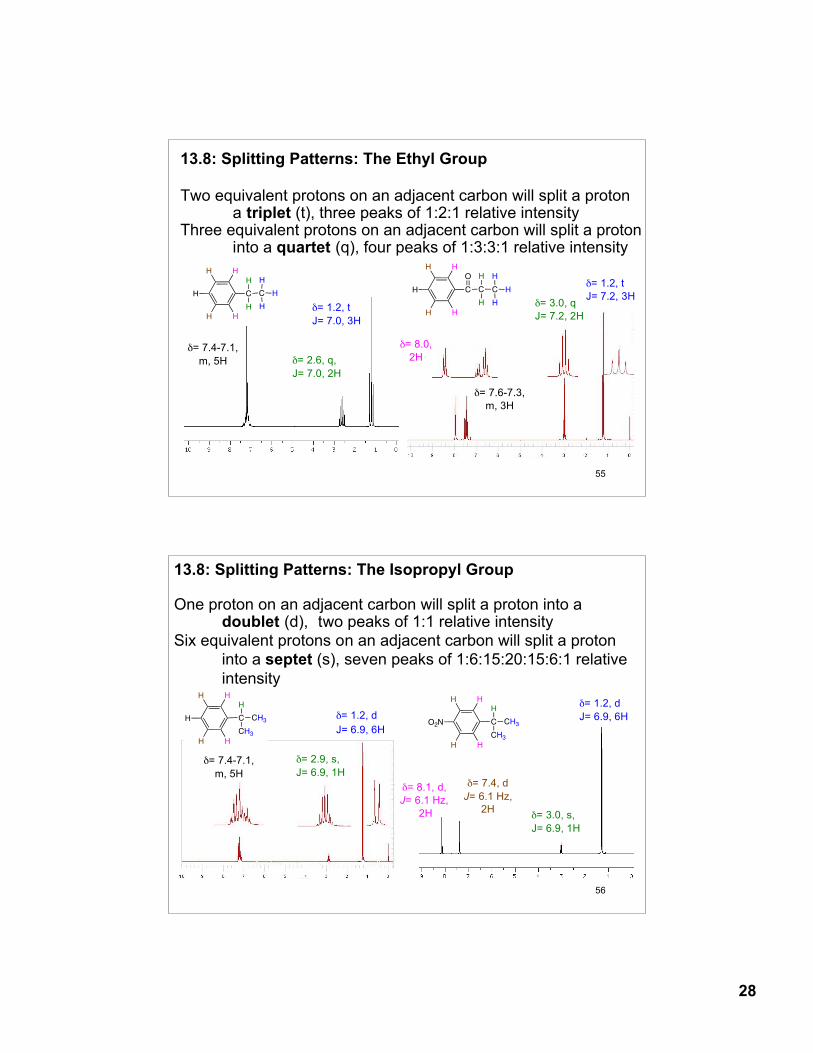
13.8: Splitting Patterns: The Ethyl Group
Two equivalent protons on an adjacent carbon will split a proton a triplet (t), three peaks of 1:2:1 relative intensity
Three equivalent protons on an adjacent carbon will split a proton into a quartet (q), four peaks of 1:3:3:1 relative intensity
C C
H
H
H
H
H
H
H
H
H
H
δ= 7.4-7.1,m, 5H δ= 2.6, q,
J= 7.0, 2H
δ= 1.2, tJ= 7.0, 3H
C
H
H
H
H
H C
H
H
H
H
HC
O
δ= 3.0, qJ= 7.2, 2H
δ= 1.2, tJ= 7.2, 3H
δ= 8.0,2H
δ= 7.6-7.3,m, 3H
56
13.8: Splitting Patterns: The Isopropyl Group
One proton on an adjacent carbon will split a proton into a doublet (d), two peaks of 1:1 relative intensity
Six equivalent protons on an adjacent carbon will split a proton into a septet (s), seven peaks of 1:6:15:20:15:6:1 relative intensity
C
H
H
H
H
O2N CH3
H
CH3
δ= 3.0, s,J= 6.9, 1H
δ= 1.2, dJ= 6.9, 6H
δ= 8.1, d,J= 6.1 Hz,
2H
δ= 7.4, dJ= 6.1 Hz,
2H
C
H
H
H
H
H CH3
H
CH3
δ= 2.9, s,J= 6.9, 1H
δ= 1.2, dJ= 6.9, 6H
δ= 7.4-7.1,m, 5H
29
57
COCH3
O
CH3C
CH3H3C
H
H
H
H
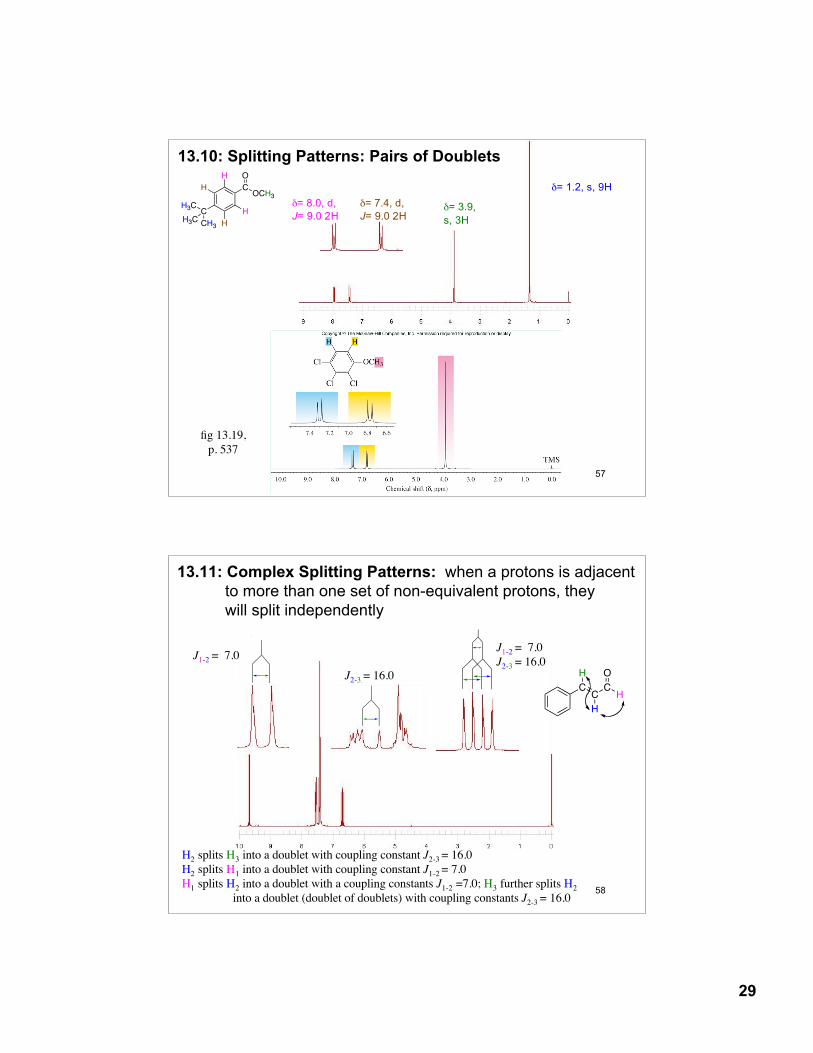
δ= 1.2, s, 9H
δ= 3.9, s, 3H
δ= 7.4, d, J= 9.0 2H
δ= 8.0, d,J= 9.0 2H
13.10: Splitting Patterns: Pairs of Doublets
fig 13.19,p. 537
58
13.11: Complex Splitting Patterns: when a protons is adjacent to more than one set of non-equivalent protons, they will split independently
CCCH
O
H
H
J1-2 = 7.0J2-3 = 16.0
J2-3 = 16.0J1-2 = 7.0
H2 splits H3 into a doublet with coupling constant J2-3 = 16.0H2 splits H1 into a doublet with coupling constant J1-2 = 7.0H1 splits H2 into a doublet with a coupling constants J1-2 =7.0; H3 further splits H2
into a doublet (doublet of doublets) with coupling constants J2-3 = 16.0
30
59
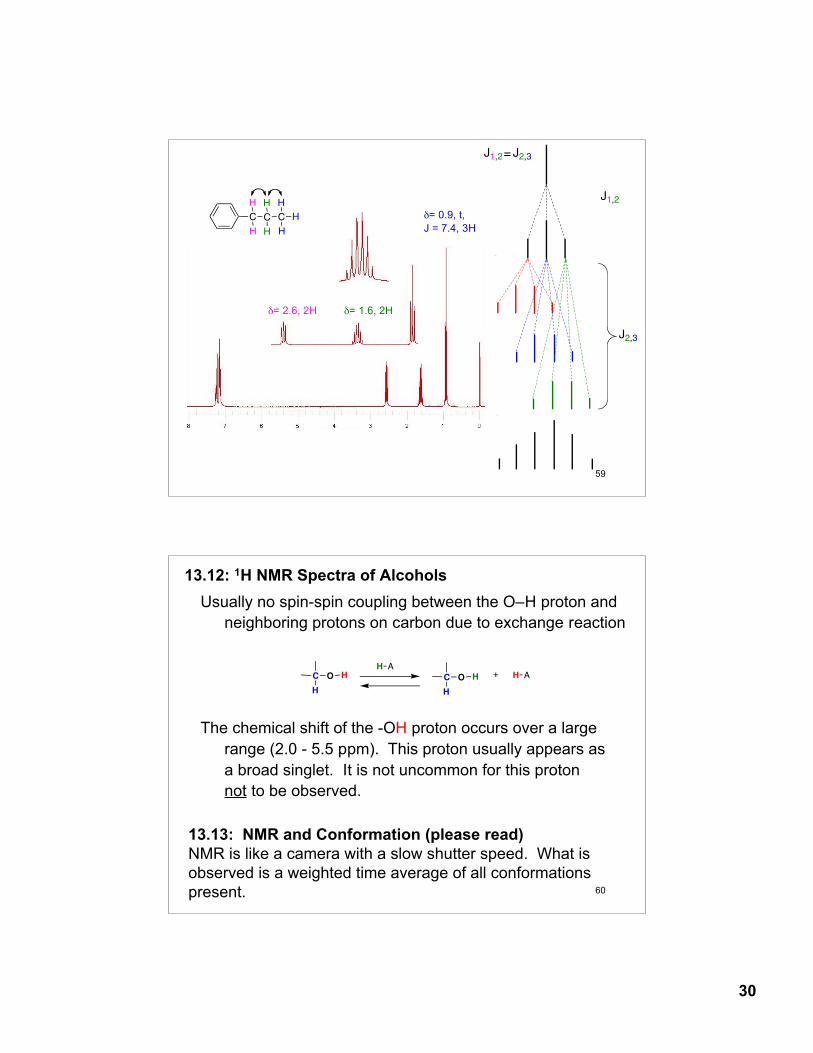
δ= 0.9, t, J = 7.4, 3H
δ= 1.6, 2H δ= 2.6, 2H
C
H
H
C
H
H
C
H
H
H
J1,2
J2,3
J1,2 J2,3=
60
Usually no spin-spin coupling between the O–H proton and neighboring protons on carbon due to exchange reaction
The chemical shift of the -OH proton occurs over a largerange (2.0 - 5.5 ppm). This proton usually appears asa broad singlet. It is not uncommon for this protonnot to be observed.
13.12: 1H NMR Spectra of Alcohols
C
H
O H
H A
C
H
O H H A+
13.13: NMR and Conformation (please read)NMR is like a camera with a slow shutter speed. What is observed is a weighted time average of all conformationspresent.
31
61
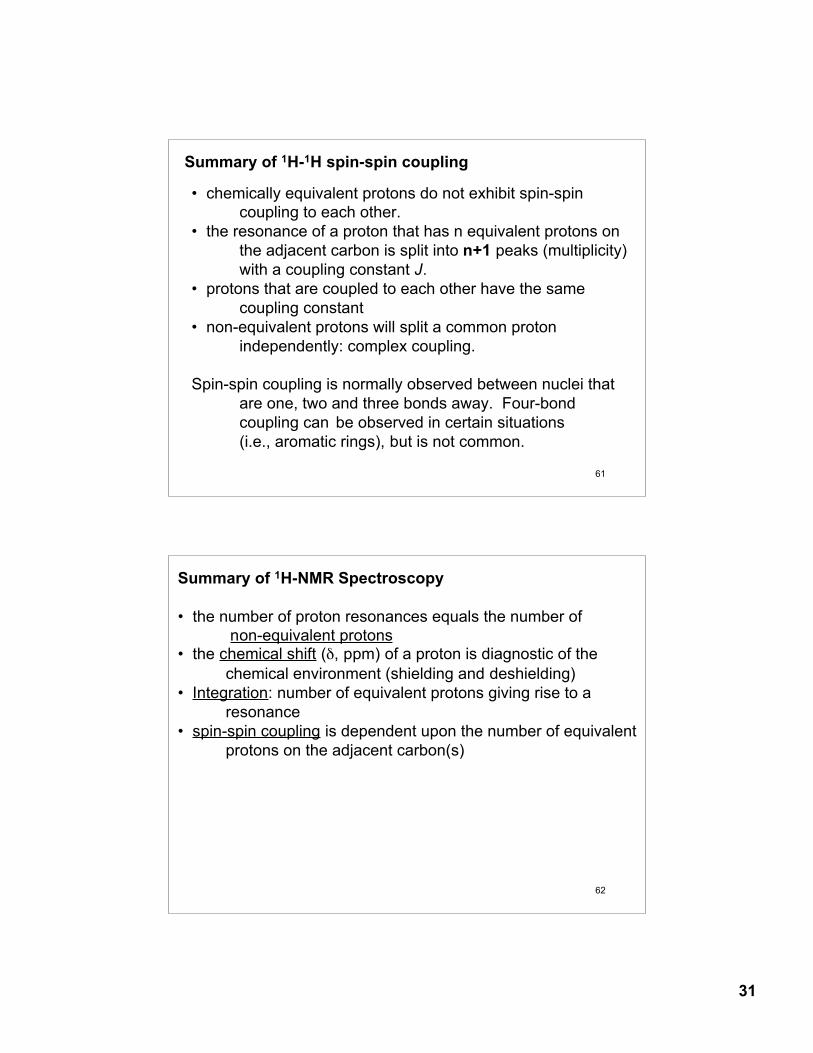
Summary of 1H-1H spin-spin coupling
• chemically equivalent protons do not exhibit spin-spincoupling to each other.
• the resonance of a proton that has n equivalent protons onthe adjacent carbon is split into n+1 peaks (multiplicity)with a coupling constant J.
• protons that are coupled to each other have the same coupling constant
• non-equivalent protons will split a common proton independently: complex coupling.
Spin-spin coupling is normally observed between nuclei thatare one, two and three bonds away. Four-bond coupling can be observed in certain situations (i.e., aromatic rings), but is not common.
62
Summary of 1H-NMR Spectroscopy
• the number of proton resonances equals the number of non-equivalent protons
• the chemical shift (δ, ppm) of a proton is diagnostic of the chemical environment (shielding and deshielding)
• Integration: number of equivalent protons giving rise to a resonance
• spin-spin coupling is dependent upon the number of equivalent protons on the adjacent carbon(s)
32
63
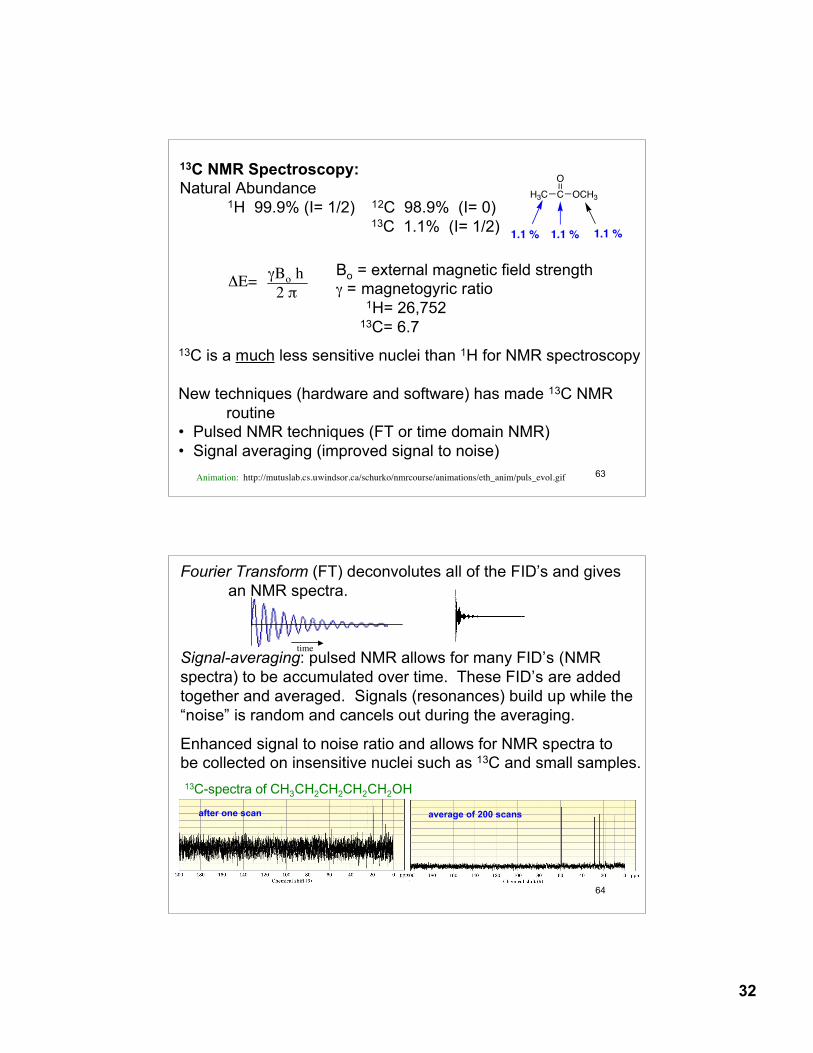
13C NMR Spectroscopy:Natural Abundance
1H 99.9% (I= 1/2) 12C 98.9% (I= 0)13C 1.1% (I= 1/2)
ΔE= γBo h 2 π
Bo = external magnetic field strengthγ = magnetogyric ratio
1H= 26,75213C= 6.7
13C is a much less sensitive nuclei than 1H for NMR spectroscopy
New techniques (hardware and software) has made 13C NMR routine
• Pulsed NMR techniques (FT or time domain NMR)• Signal averaging (improved signal to noise)
O
CH3C OCH3
1.1 % 1.1 % 1.1 %
Animation: http://mutuslab.cs.uwindsor.ca/schurko/nmrcourse/animations/eth_anim/puls_evol.gif
64
Fourier Transform (FT) deconvolutes all of the FID’s and givesan NMR spectra.
Signal-averaging: pulsed NMR allows for many FID’s (NMR spectra) to be accumulated over time. These FID’s are added together and averaged. Signals (resonances) build up while the “noise” is random and cancels out during the averaging.
Enhanced signal to noise ratio and allows for NMR spectra to be collected on insensitive nuclei such as 13C and small samples.13C-spectra of CH3CH2CH2CH2CH2OH
average of 200 scansafter one scan
time
33
65
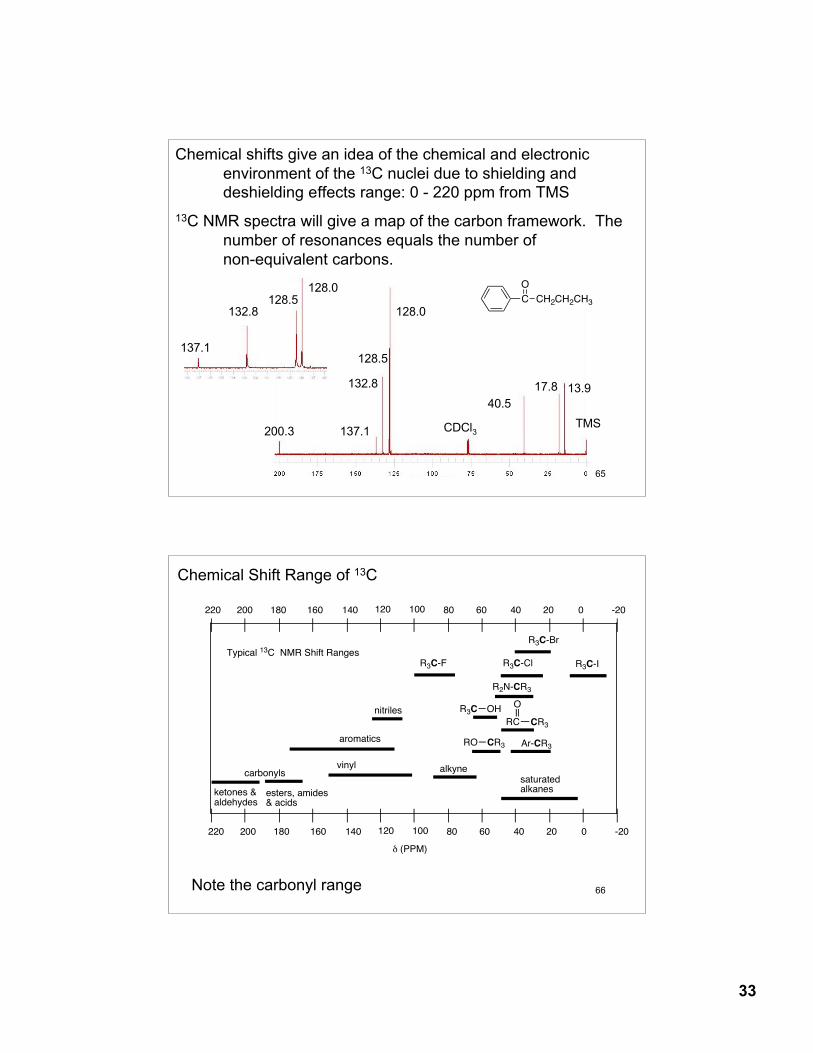
Chemical shifts give an idea of the chemical and electronic environment of the 13C nuclei due to shielding and deshielding effects range: 0 - 220 ppm from TMS
13C NMR spectra will give a map of the carbon framework. The number of resonances equals the number ofnon-equivalent carbons.
200.3 137.1
132.8
128.5
128.0
17.840.5
13.9
TMSCDCl3
C
O
CH2CH2CH3
137.1
132.8128.5
128.0
66
Chemical Shift Range of 13C
Note the carbonyl range
-20020406080100120140160180200220
-20020406080100120140160180200220
saturated alkanes
carbonylsvinyl
aromatics
nitriles
CR3RO
alkyne
OHR3C
R3C-F R3C-Cl R3C-I
R3C-Br
RC CR3
O
! (PPM)
Typical 13C NMR Shift Ranges
esters, amides& acids
ketones &aldehydes
Ar-CR3
R2N-CR3
34
67
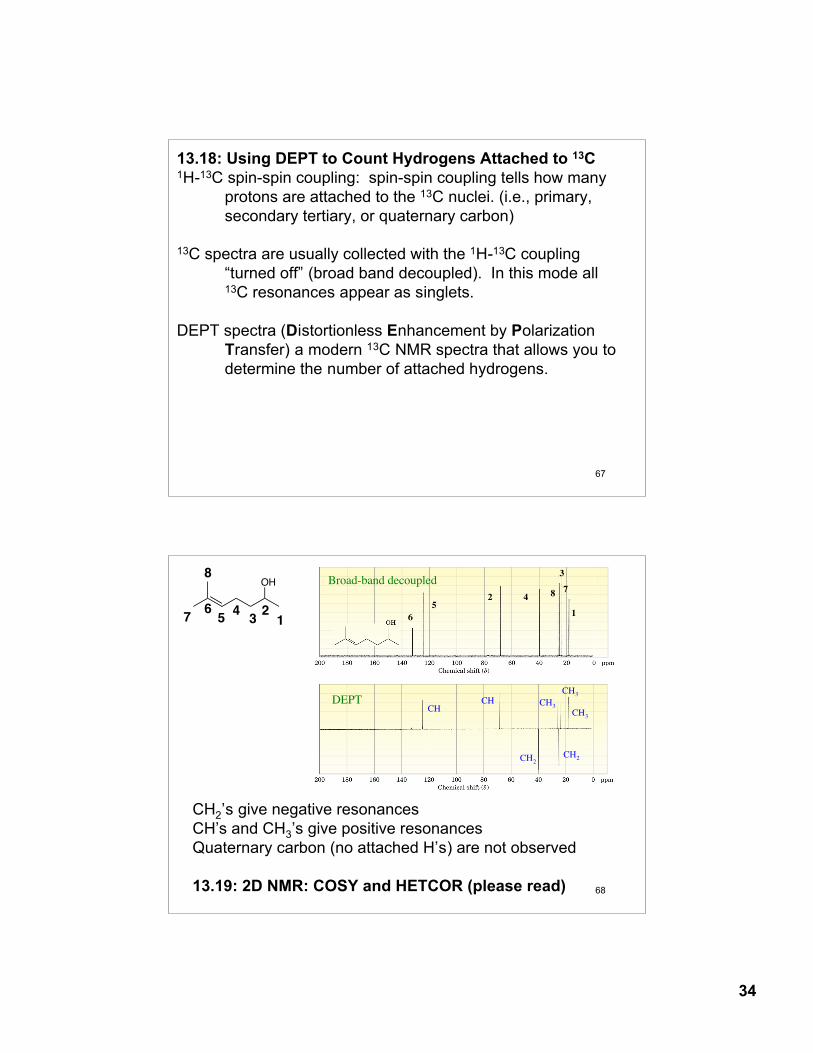
13.18: Using DEPT to Count Hydrogens Attached to 13C1H-13C spin-spin coupling: spin-spin coupling tells how many
protons are attached to the 13C nuclei. (i.e., primary, secondary tertiary, or quaternary carbon)
13C spectra are usually collected with the 1H-13C coupling “turned off” (broad band decoupled). In this mode all 13C resonances appear as singlets.
DEPT spectra (Distortionless Enhancement by Polarization Transfer) a modern 13C NMR spectra that allows you to determine the number of attached hydrogens.
68
CH3CH3
CH3
CH2CH2
Broad-band decoupled
DEPT
OH
12
34
56
7
8
65
2 4
1
78
3
CHCH
CH2’s give negative resonancesCH’s and CH3’s give positive resonancesQuaternary carbon (no attached H’s) are not observed
13.19: 2D NMR: COSY and HETCOR (please read)
35
69
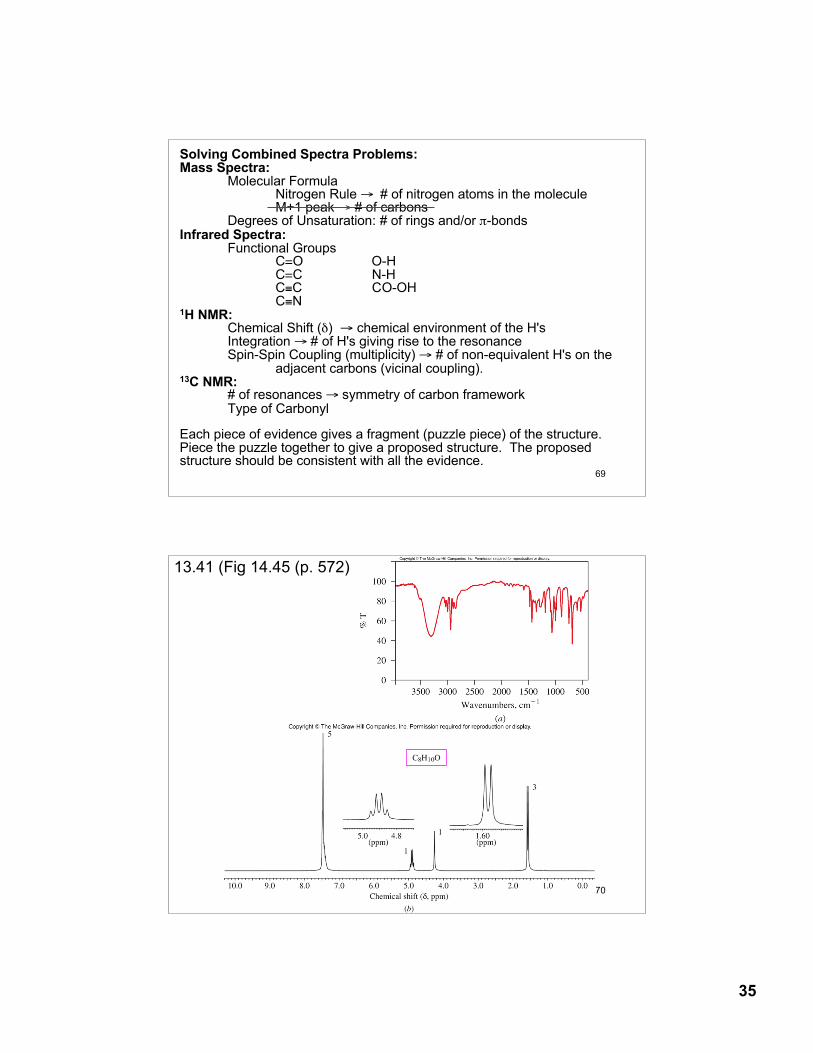
Solving Combined Spectra Problems:Mass Spectra:
Molecular FormulaNitrogen Rule → # of nitrogen atoms in the moleculeM+1 peak → # of carbons
Degrees of Unsaturation: # of rings and/or π-bondsInfrared Spectra:
Functional GroupsC=O O-HC=C N-HC≡C CO-OHC≡N
1H NMR:Chemical Shift (δ) → chemical environment of the H'sIntegration → # of H's giving rise to the resonanceSpin-Spin Coupling (multiplicity) → # of non-equivalent H's on the
adjacent carbons (vicinal coupling).13C NMR:
# of resonances → symmetry of carbon frameworkType of Carbonyl
Each piece of evidence gives a fragment (puzzle piece) of the structure. Piece the puzzle together to give a proposed structure. The proposed structure should be consistent with all the evidence.
70
13.41 (Fig 14.45 (p. 572)
36
71
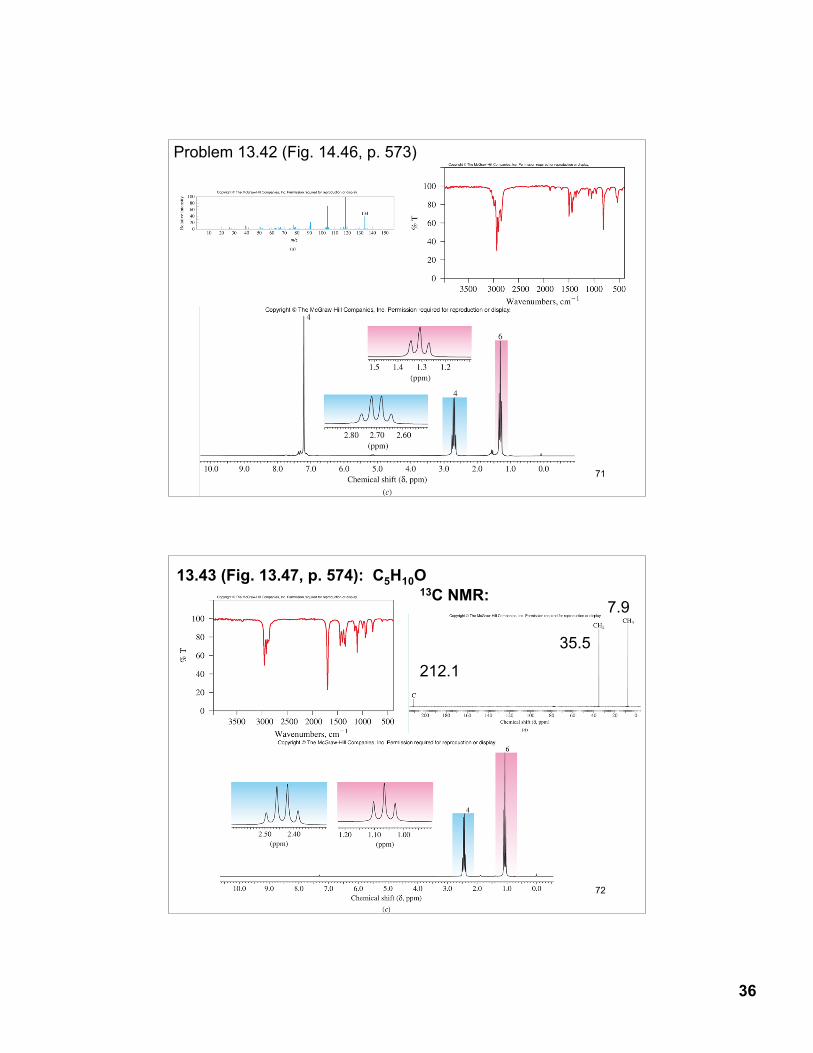
Problem 13.42 (Fig. 14.46, p. 573)
72
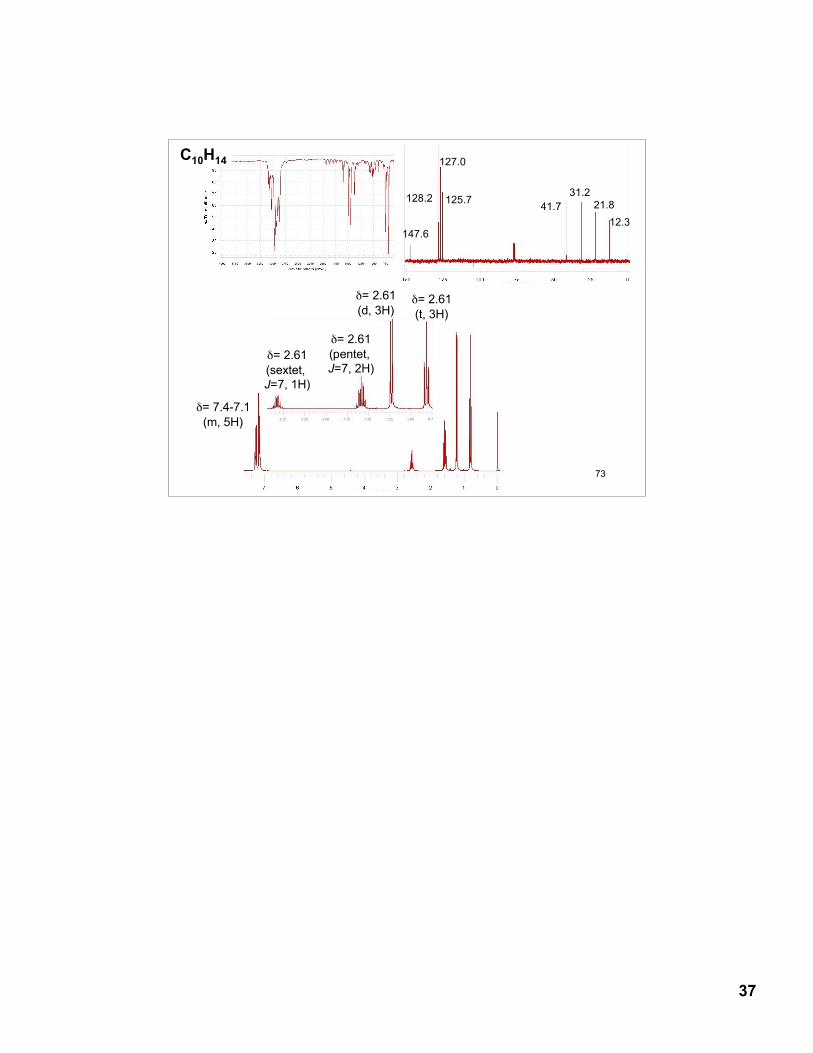
13.43 (Fig. 13.47, p. 574): C5H10O13C NMR:
212.1
35.5
7.9
37
73
δ= 7.4-7.1(m, 5H)
δ= 2.61(sextet, J=7, 1H)
δ= 2.61(pentet, J=7, 2H)
δ= 2.61(d, 3H)
δ= 2.61(t, 3H)
C10H14
147.6
128.2
127.0
125.7 41.731.2
21.812.3


![SIMULTANEOUS DETERMINATION OF METFORMIN AND …€¦ · UV spectrophotometric methods such as absorption correction spectroscopy [15], difference spectroscopy [16] and second derivative](https://img.pdfslide.net/doc/110x75/5ecdad5e67c3df2536342b57/simultaneous-determination-of-metformin-and-uv-spectrophotometric-methods-such-as.jpg)