Embed Size (px)
Citation preview
1
Climate Change & Biodiversity
2
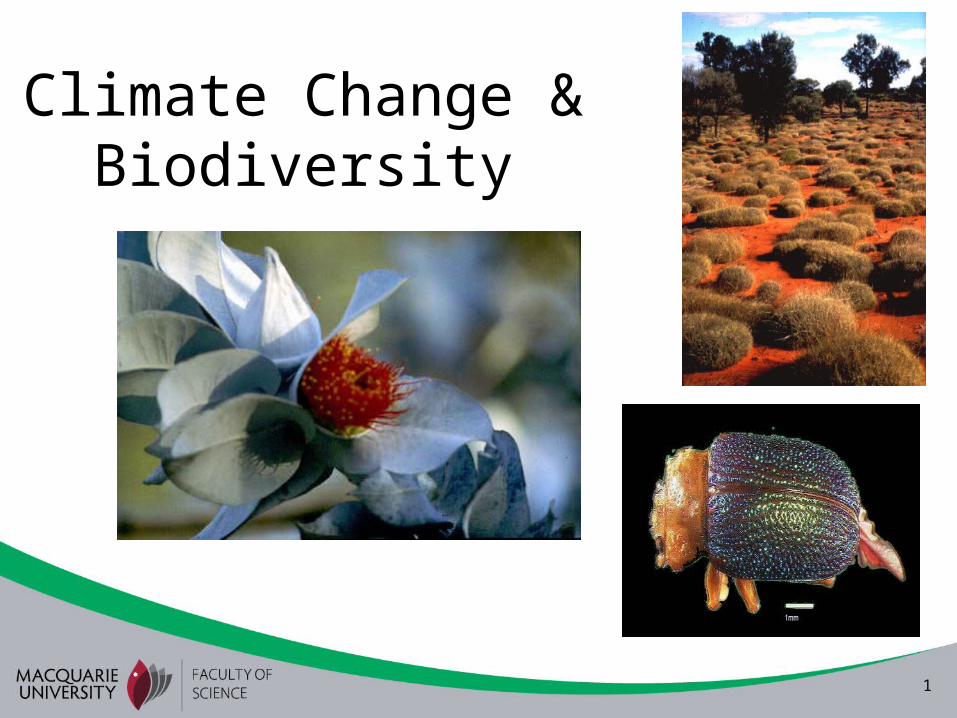
CO2 and global temperature
3
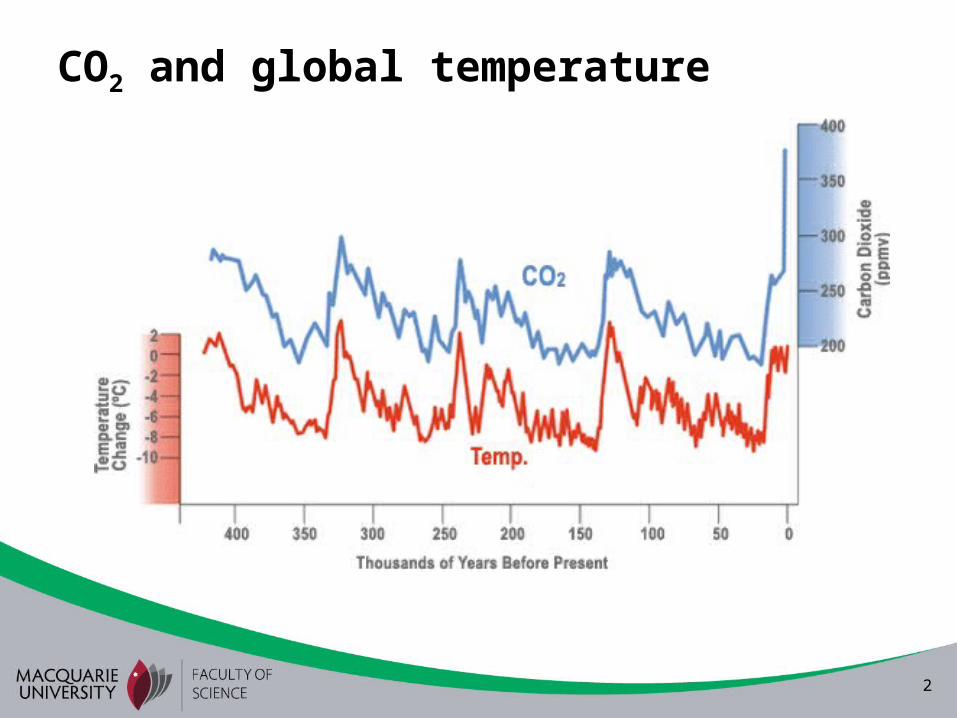
Carbon dioxide and temperature last 1000 years
200
250
300
350
02004006008001000years before 2000 AD
CO
2 (
pp
m)
-0.5
0.0
0.5
1.0te
mp
era
ture
(o C
) Cape Grim and South PoleLaw Dome ice corestemperature change
• CO2 increased 35% since industrial revolution• Exceeds natural range over past 650,000 yrs• 0.8oC increase in global average temperature since 1906• Rate of warming doubled in past 50 years
• 1990s warmest decade, 1980s second warmest
4
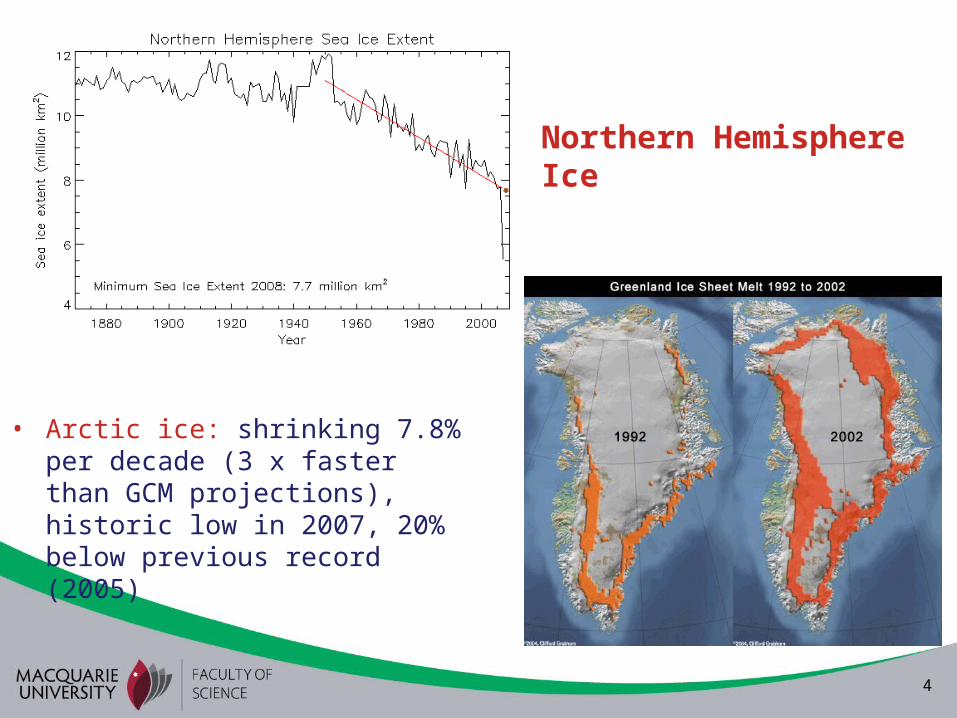
Northern Hemisphere Ice
• Arctic ice: shrinking 7.8% per decade (3 x faster than GCM projections), historic low in 2007, 20% below previous record (2005)
5
6
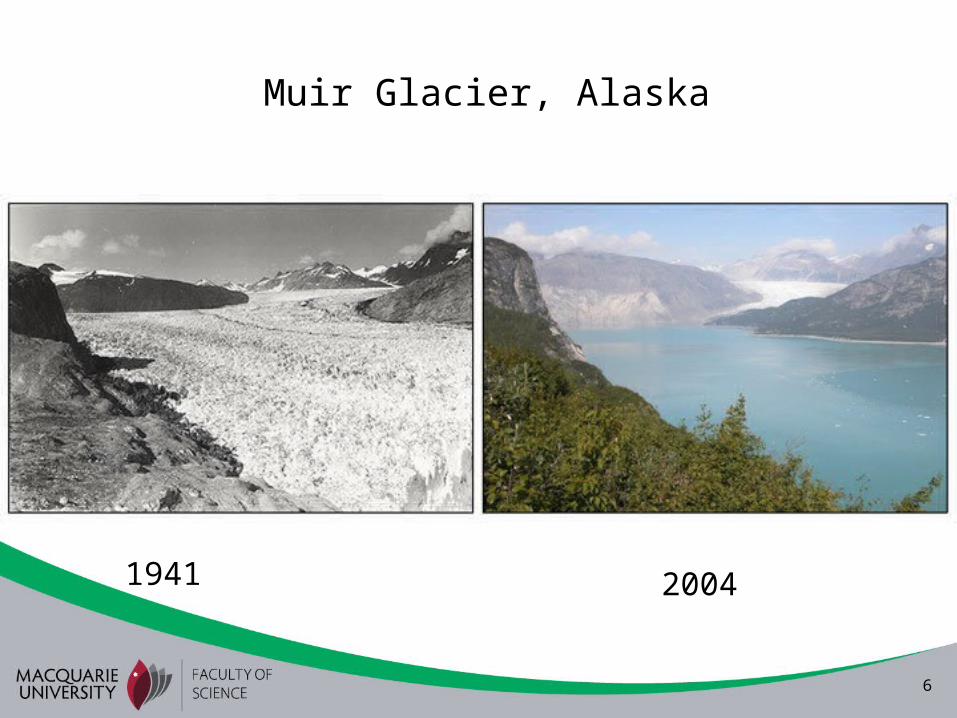
Muir Glacier, Alaska
1941 2004
7
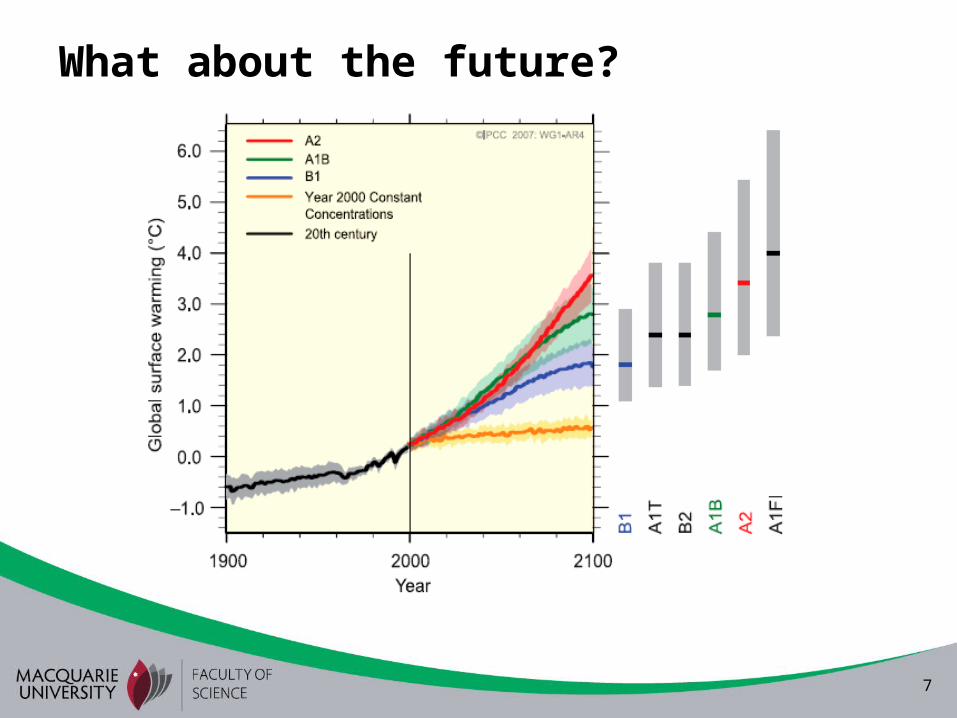
What about the future?
8
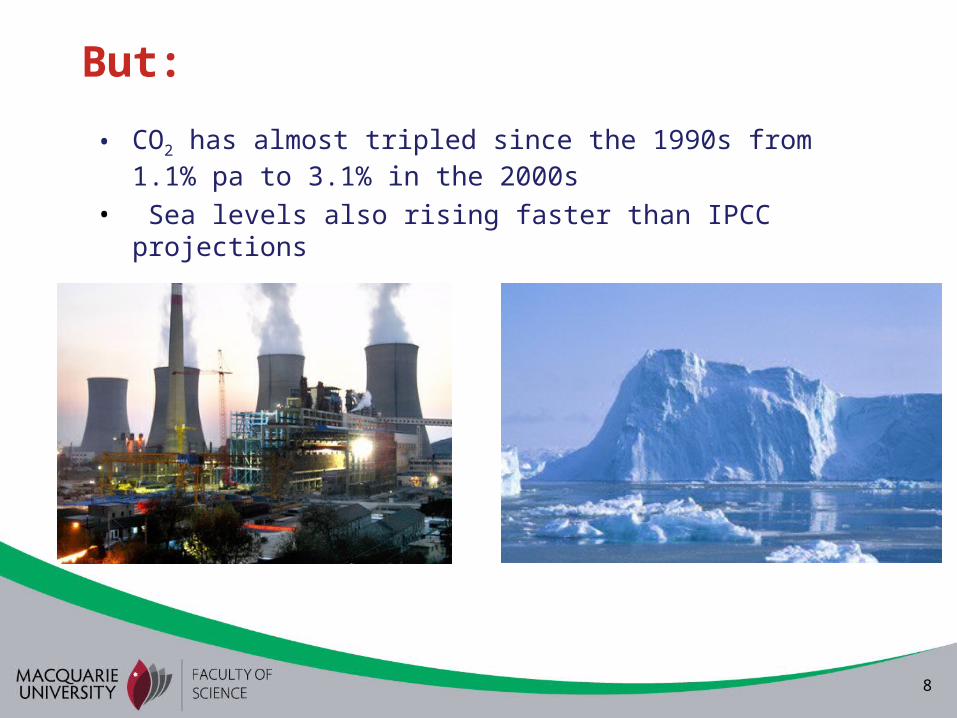
But:
• CO2 has almost tripled since the 1990s from 1.1% pa to 3.1% in the 2000s
• Sea levels also rising faster than IPCC projections
9
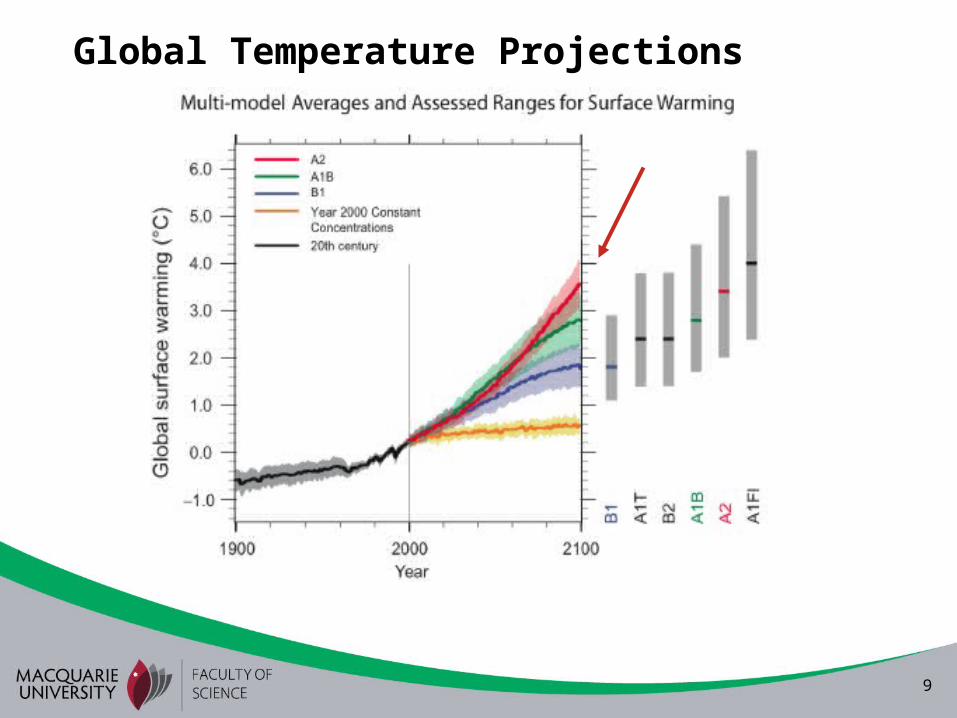
Global Temperature Projections
10
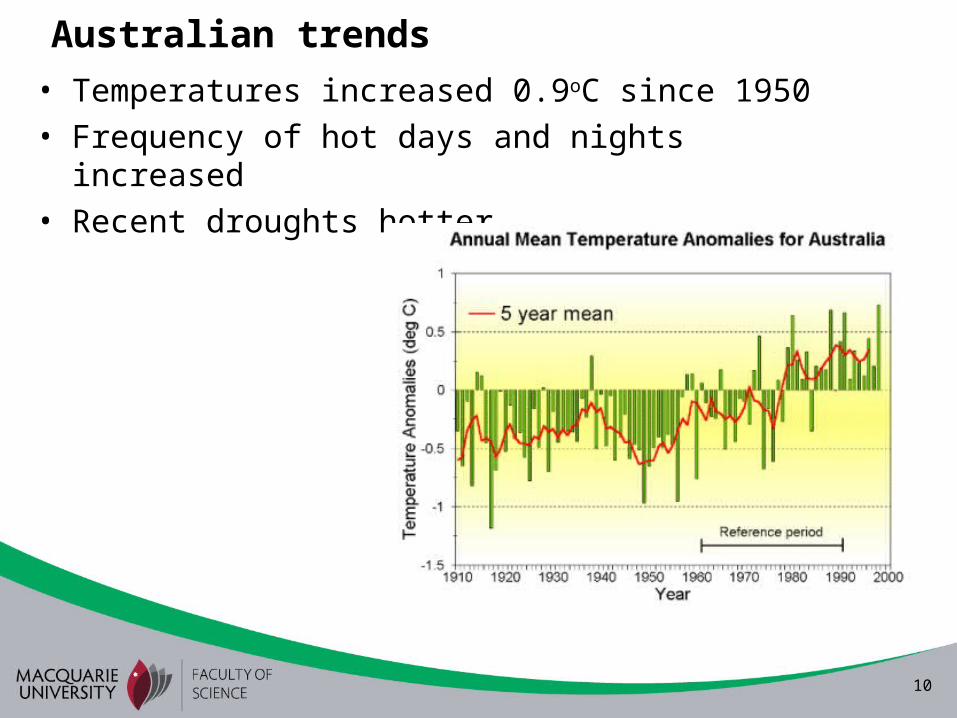
• Temperatures increased 0.9oC since 1950• Frequency of hot days and nights increased• Recent droughts hotter
Australian trends
11
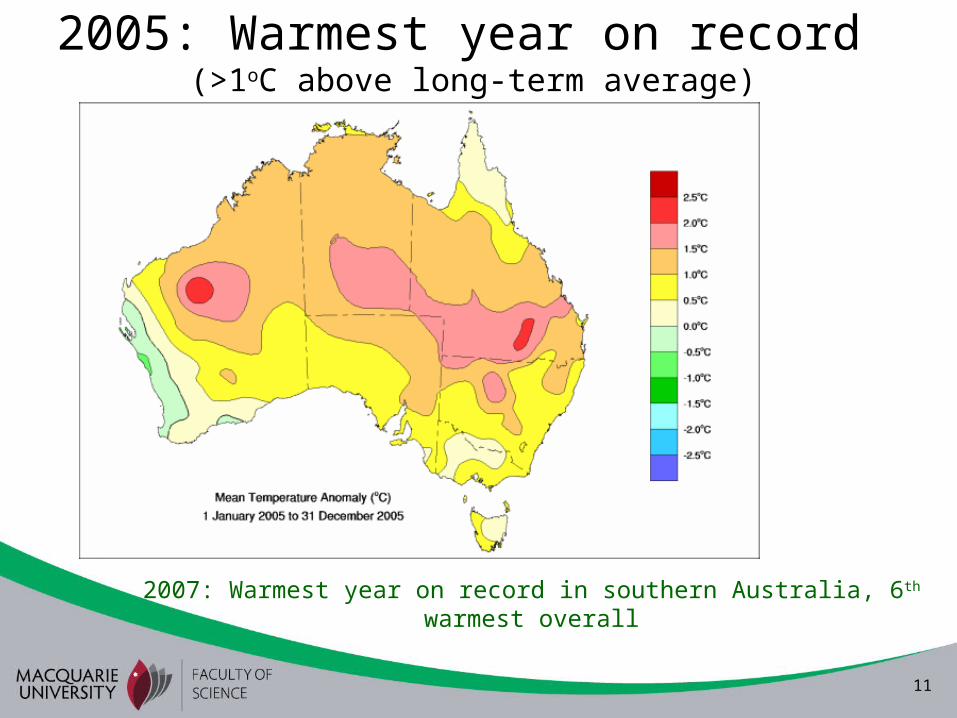
2005: Warmest year on record (>1oC above long-term average)
2007: Warmest year on record in southern Australia, 6th warmest overall
12
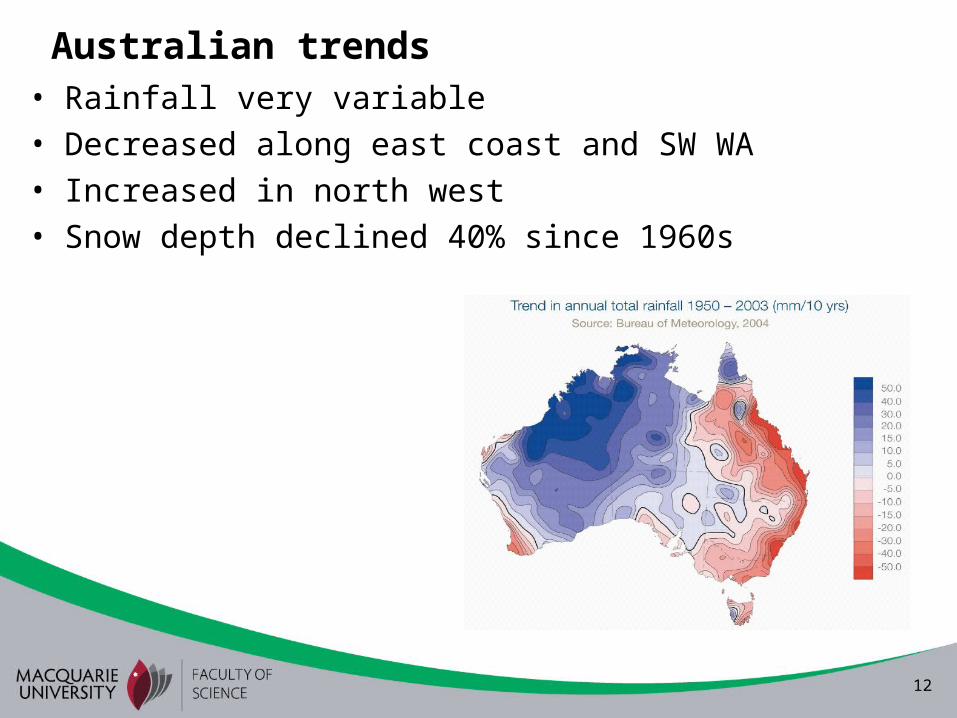
• Rainfall very variable• Decreased along east coast and SW WA• Increased in north west• Snow depth declined 40% since 1960s
Australian trends
13
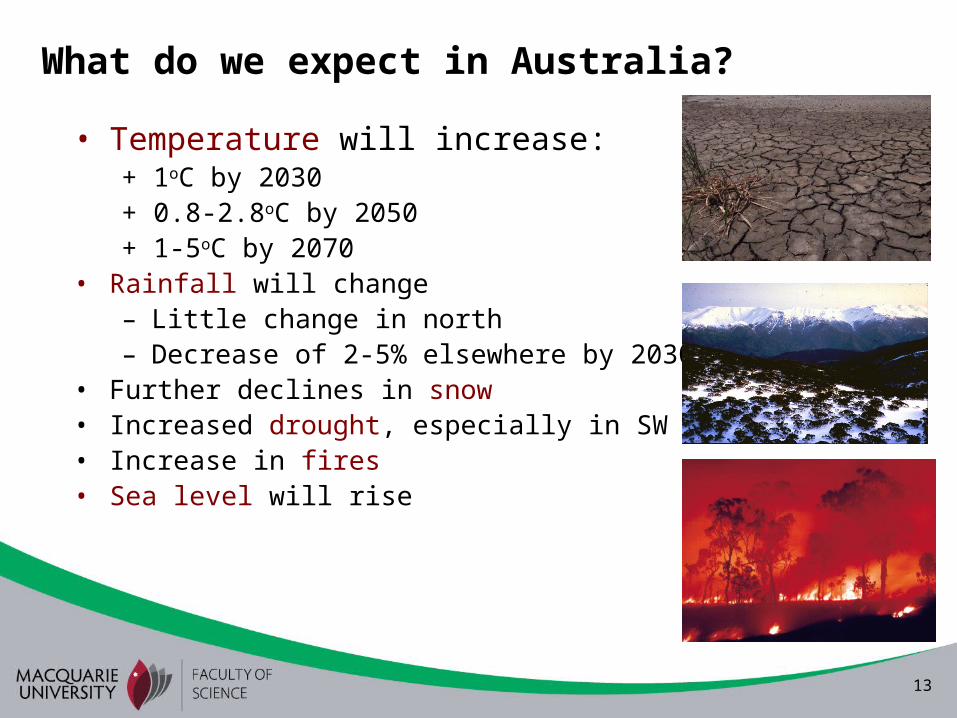
• Temperature will increase:+ 1oC by 2030+ 0.8-2.8oC by 2050+ 1-5oC by 2070
• Rainfall will change– Little change in north– Decrease of 2-5% elsewhere by 2030
• Further declines in snow• Increased drought, especially in SW• Increase in fires• Sea level will rise
What do we expect in Australia?
14
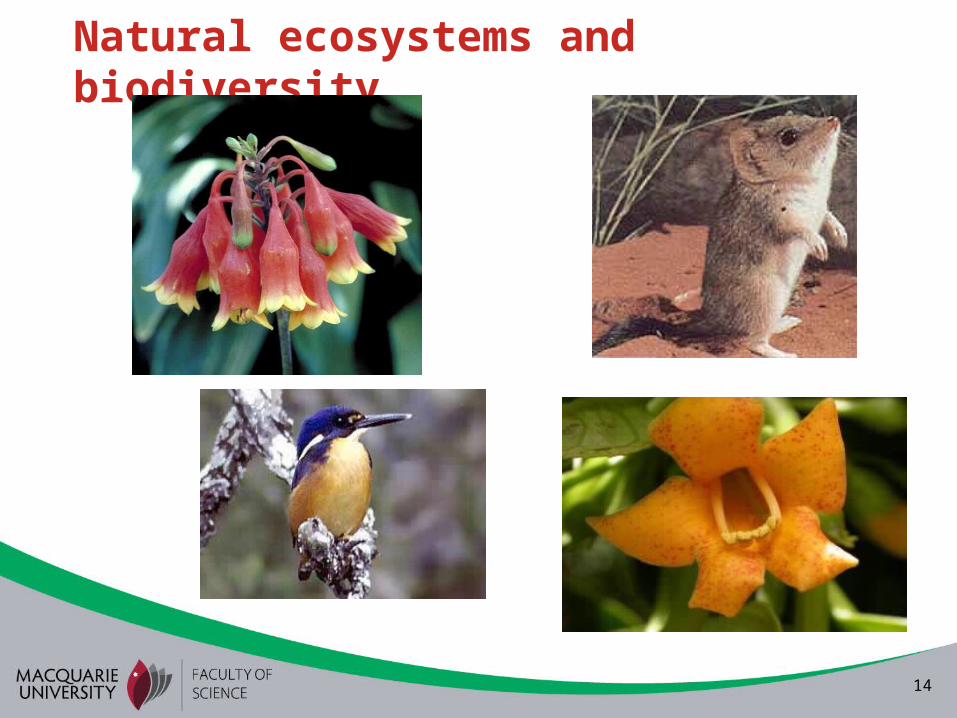
Natural ecosystems and biodiversity
15
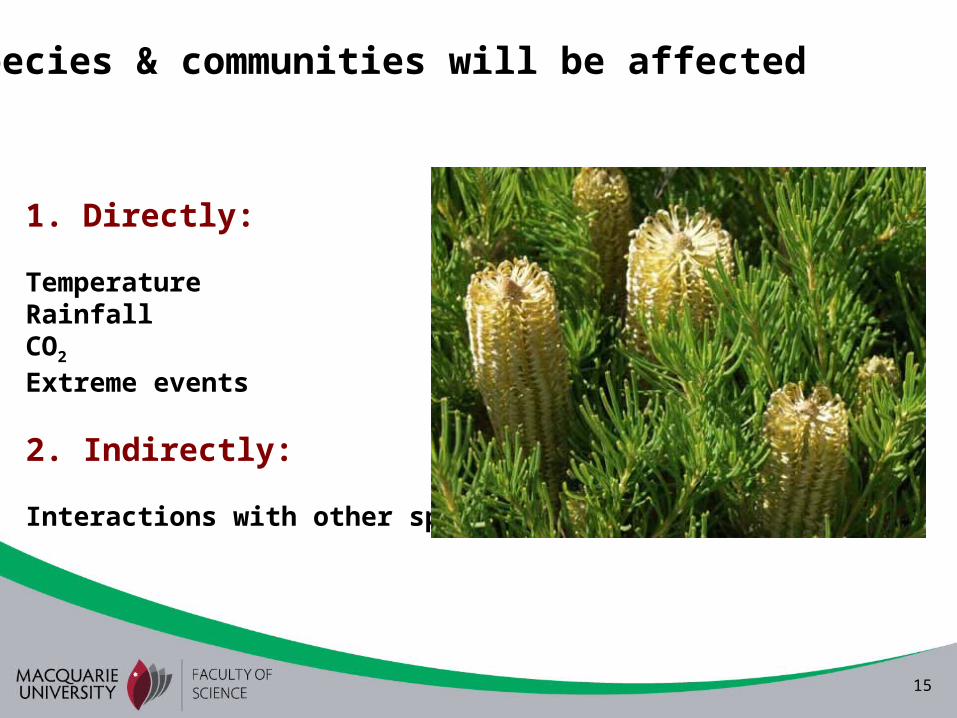
1. Directly:
TemperatureRainfallCO2
Extreme events
2. Indirectly:
Interactions with other species
Species & communities will be affected
16
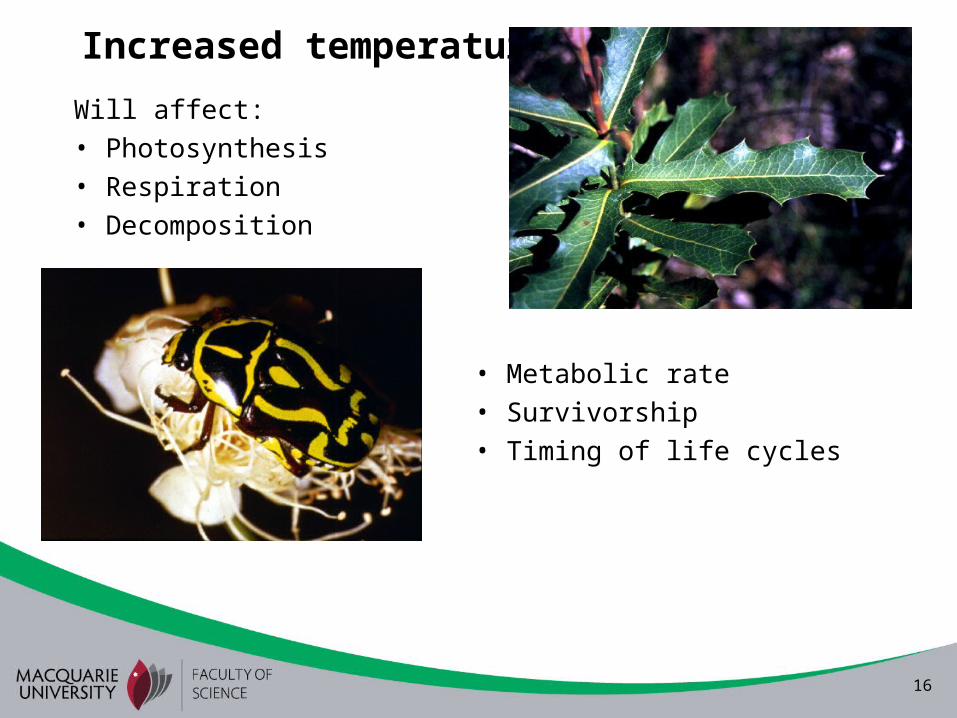
Increased temperature
Will affect:• Photosynthesis• Respiration• Decomposition
• Metabolic rate• Survivorship• Timing of life cycles
17
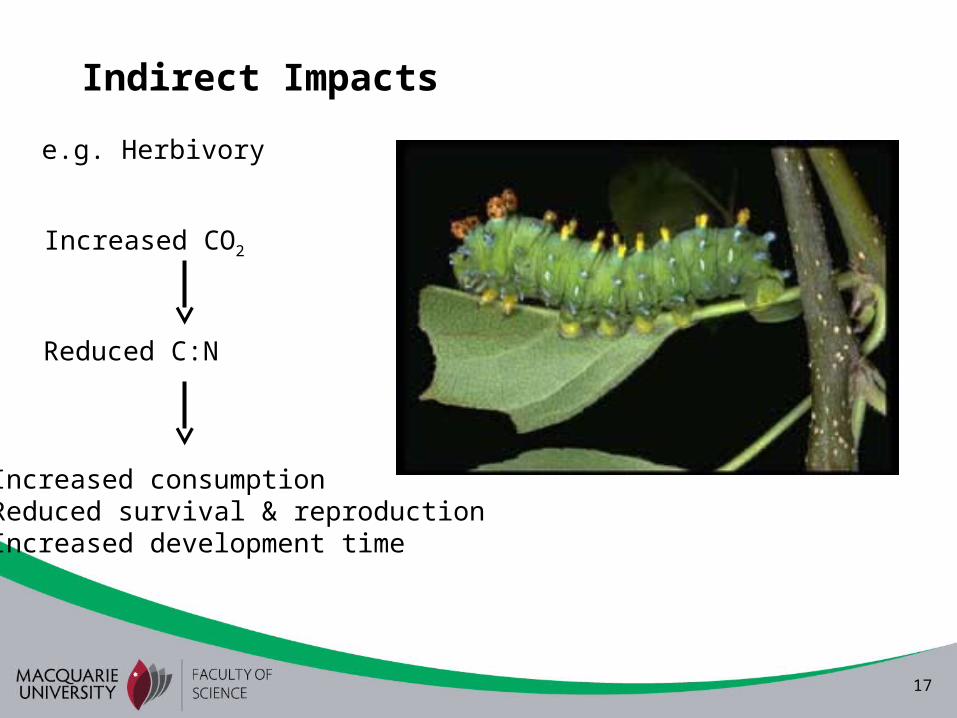
Indirect Impacts
e.g. Herbivory
Reduced C:N
• Increased consumption• Reduced survival & reproduction• Increased development time
Increased CO2
18
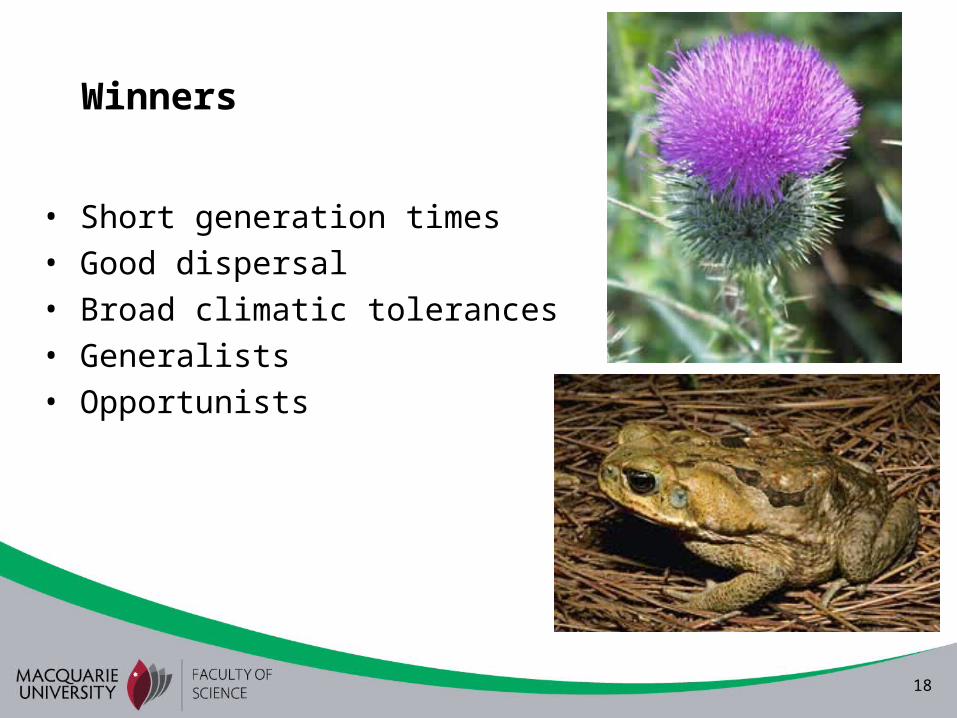
Winners
• Short generation times• Good dispersal• Broad climatic tolerances• Generalists• Opportunists
19
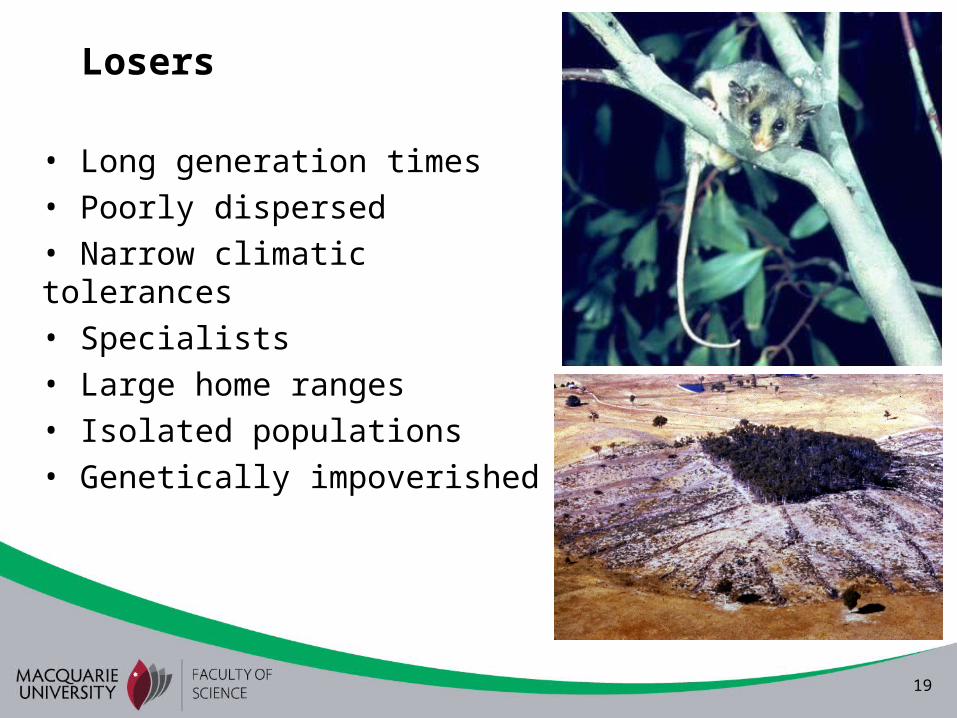
Losers
• Long generation times• Poorly dispersed• Narrow climatic tolerances• Specialists• Large home ranges• Isolated populations• Genetically impoverished
20
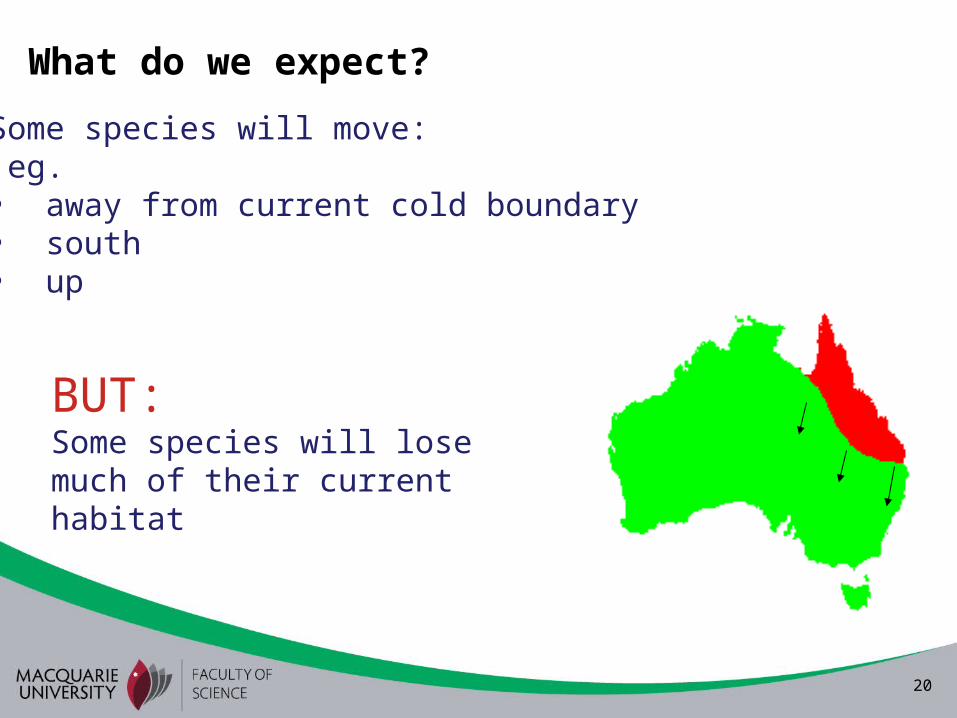
What do we expect?
Some species will move: eg.• away from current cold boundary• south• up
BUT:Some species will lose much of their current habitat
21
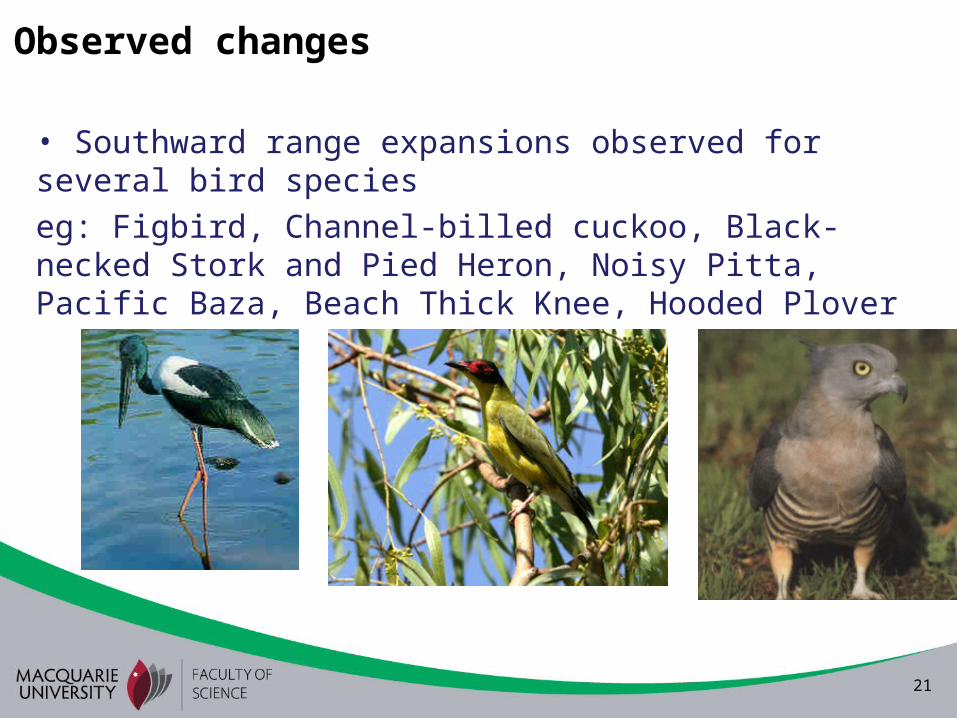
• Southward range expansions observed for several bird species
eg: Figbird, Channel-billed cuckoo, Black-necked Stork and Pied Heron, Noisy Pitta, Pacific Baza, Beach Thick Knee, Hooded Plover
Observed changes
22
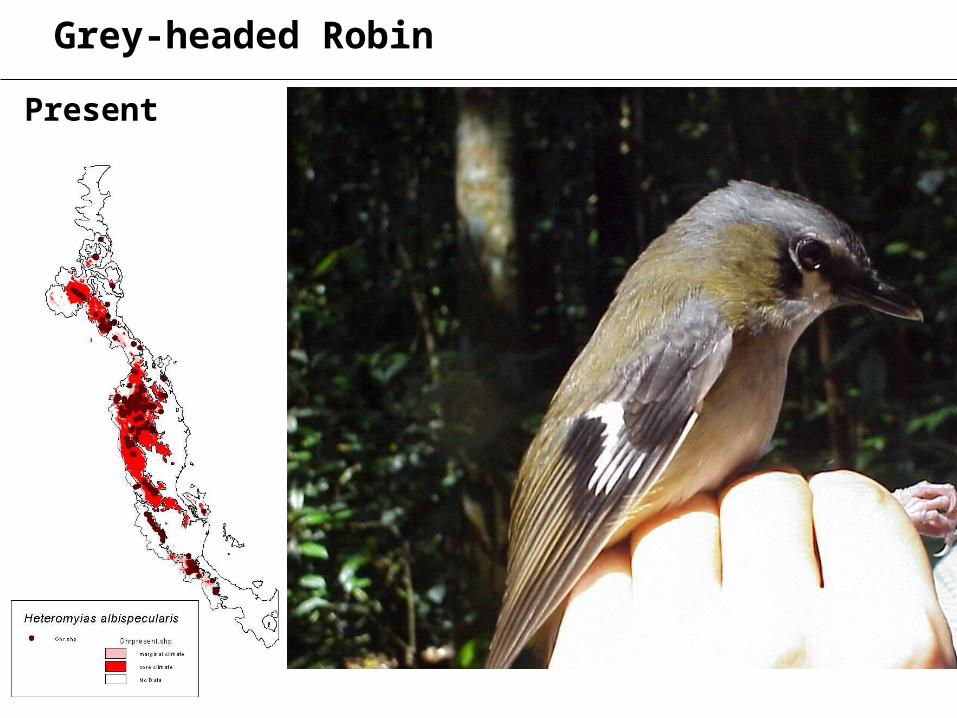
+ 1 deg.
86%
+ 3.5 deg.
7%
Grey-headed Robin
Present
23
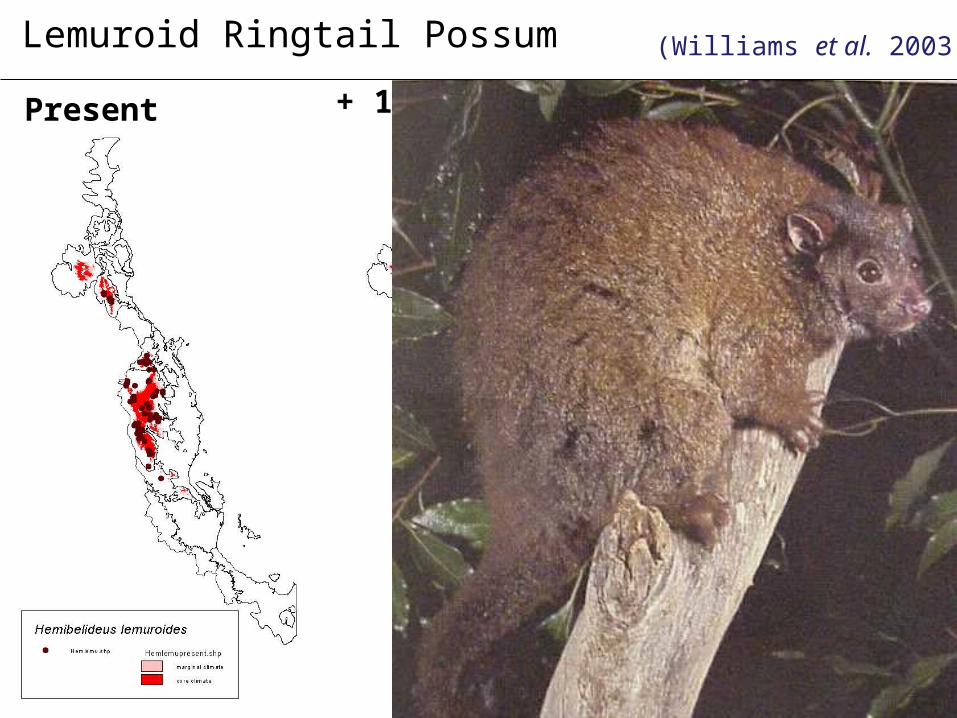
+ 1 deg.
46%
+ 3.5 deg.
0%
Lemuroid Ringtail Possum
Present
(Williams et al. 2003)
24
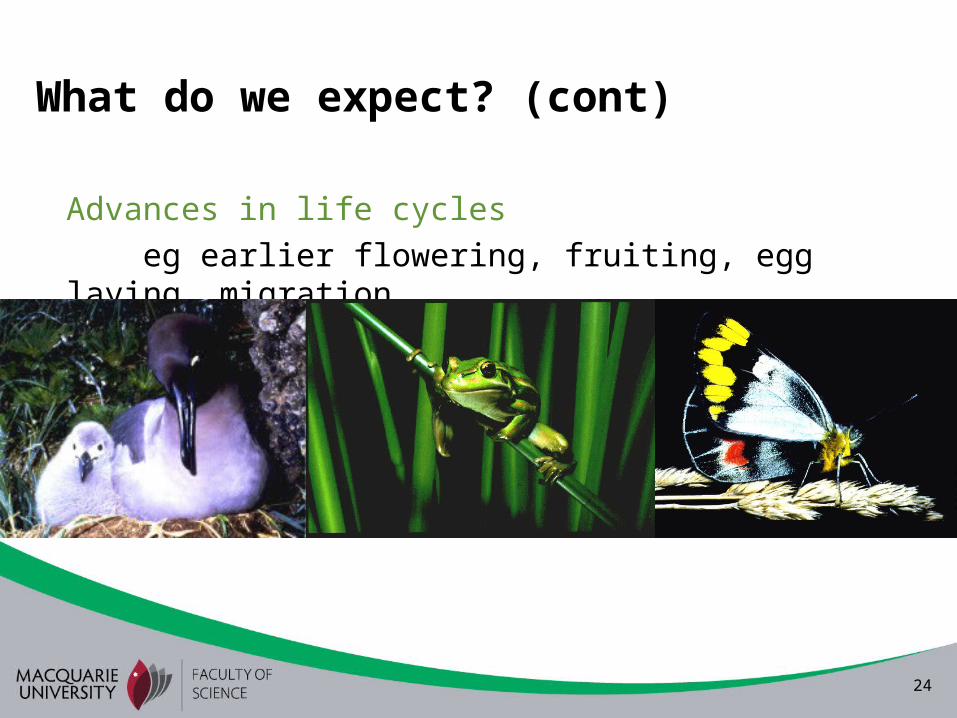
What do we expect? (cont)
Advances in life cycles
eg earlier flowering, fruiting, egg laying, migration
25
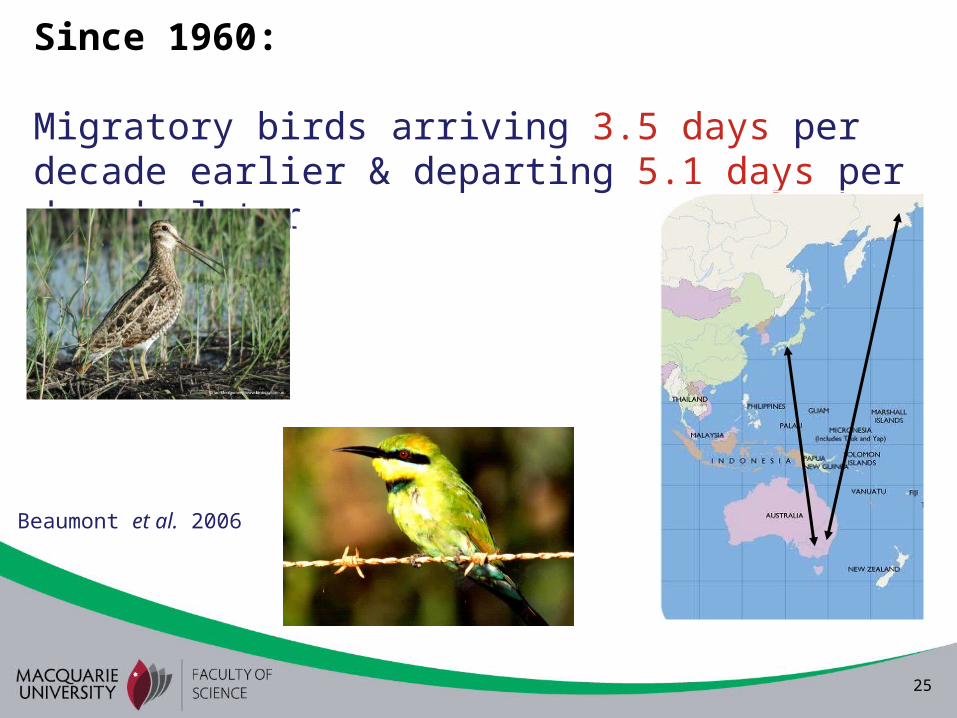
Since 1960:
Migratory birds arriving 3.5 days per decade earlier & departing 5.1 days per decade later
Beaumont et al. 2006
26
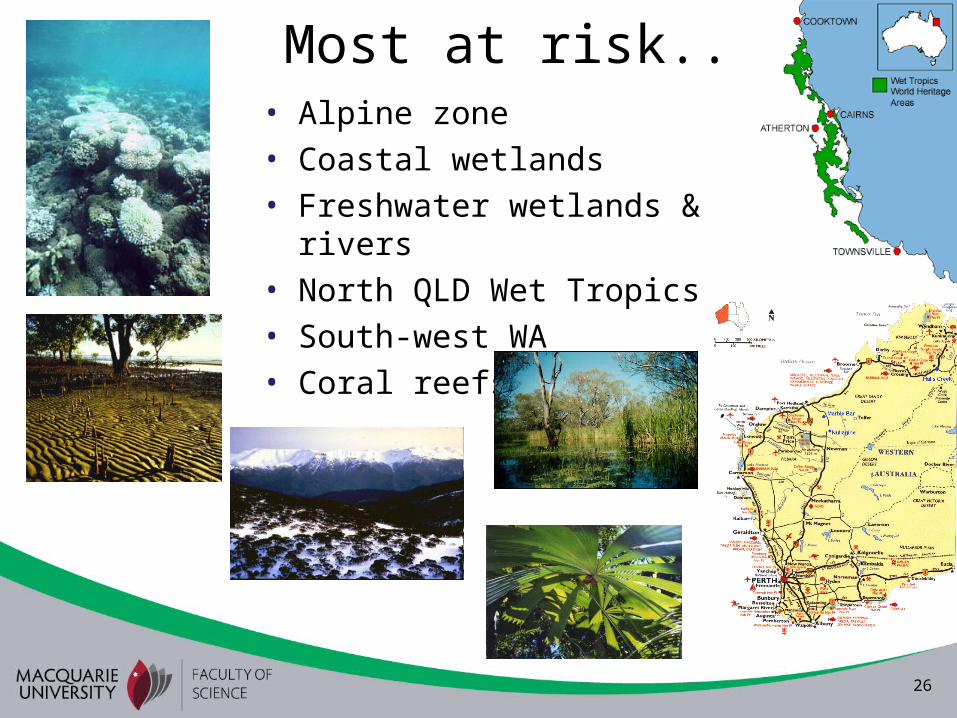
• Alpine zone• Coastal wetlands• Freshwater wetlands & rivers• North QLD Wet Tropics• South-west WA • Coral reefs
Most at risk..
27
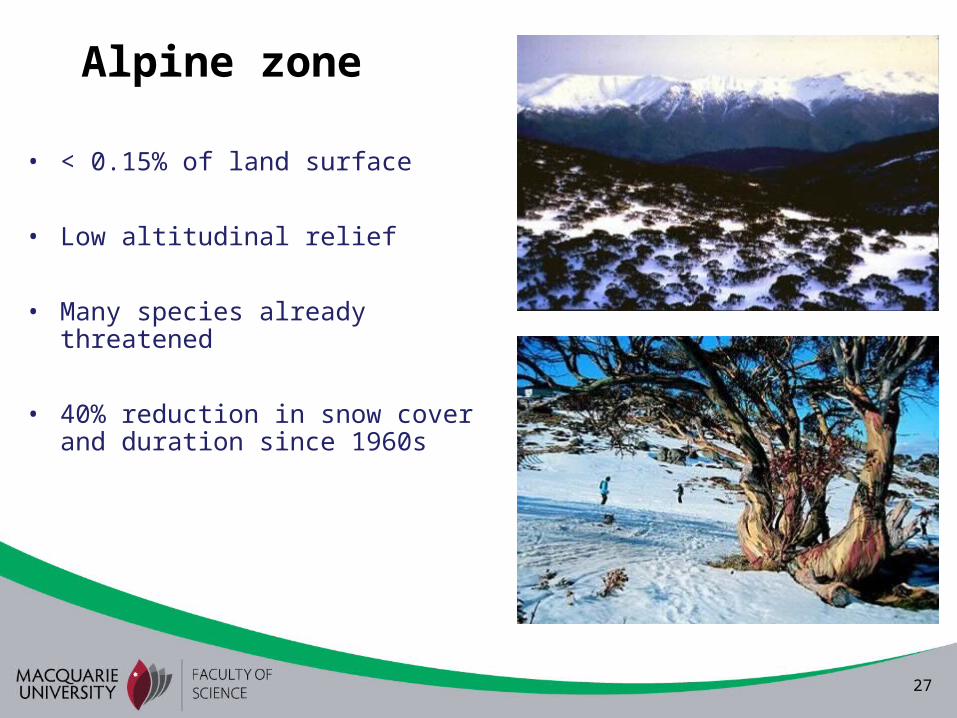
Alpine zone
• < 0.15% of land surface
• Low altitudinal relief
• Many species already threatened
• 40% reduction in snow cover and duration since 1960s
28
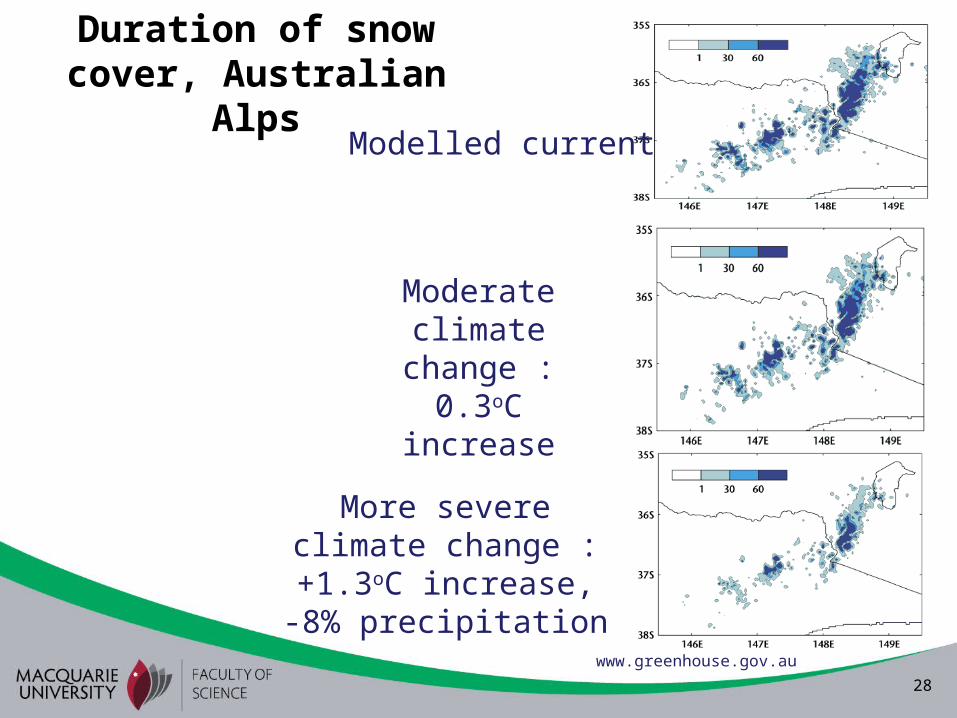
Duration of snow cover, Australian Alps
Modelled current
Moderate climate change : 0.3oC
increase
More severe climate change : +1.3oC increase, -8% precipitation
www.greenhouse.gov.au
29
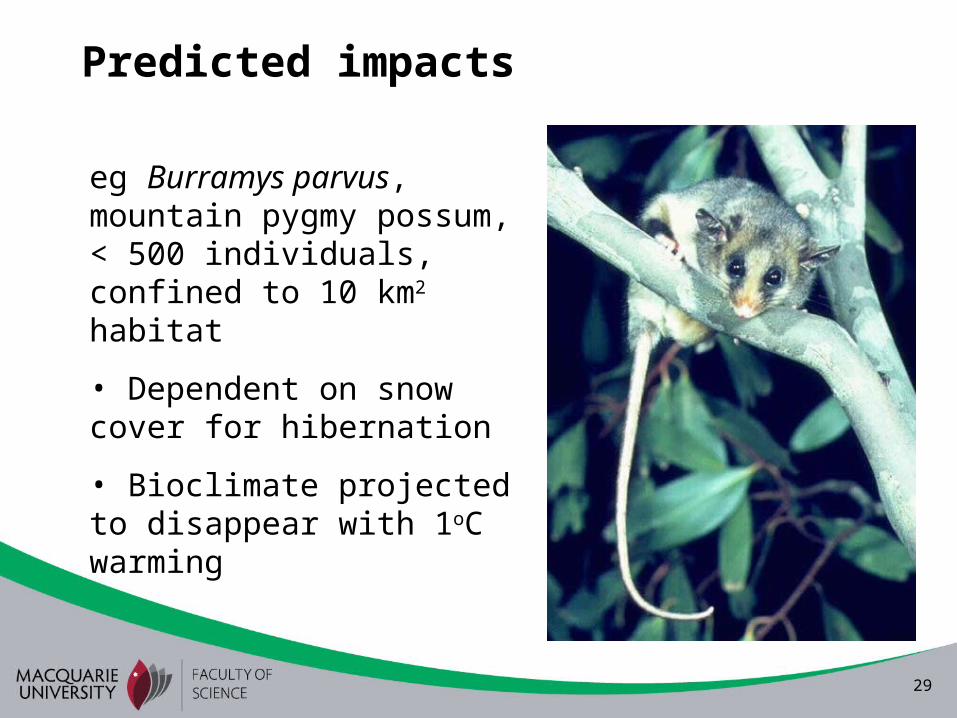
Predicted impacts
eg Burramys parvus, mountain pygmy possum, < 500 individuals, confined to 10 km2 habitat
• Dependent on snow cover for hibernation
• Bioclimate projected to disappear with 1oC warming
30
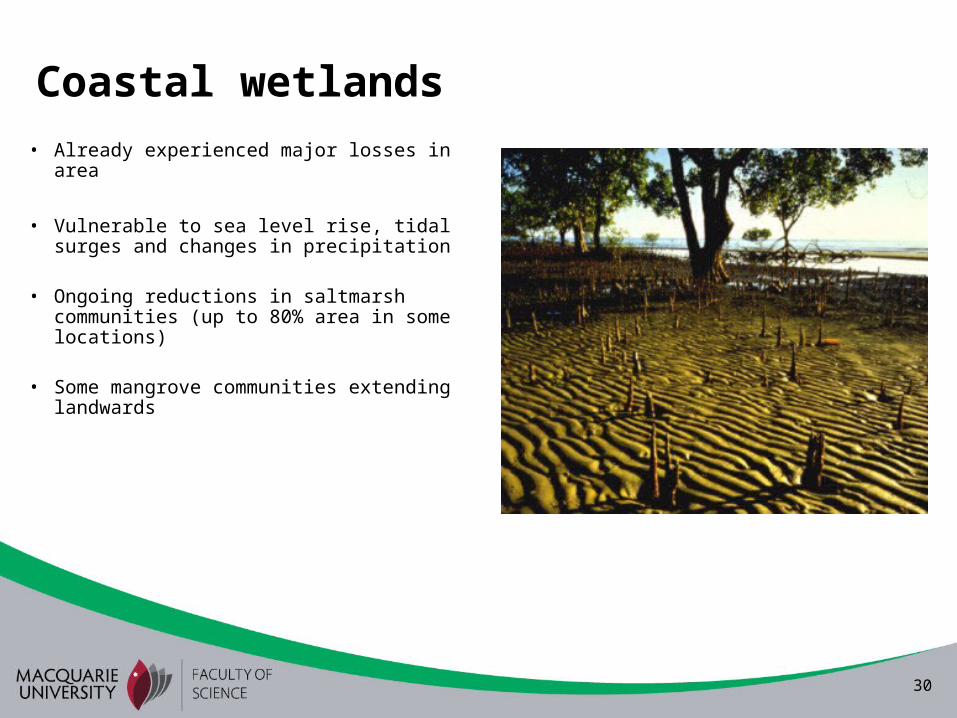
Coastal wetlands
• Already experienced major losses in area
• Vulnerable to sea level rise, tidal surges and changes in precipitation
• Ongoing reductions in saltmarsh communities (up to 80% area in some locations)
• Some mangrove communities extending landwards
31
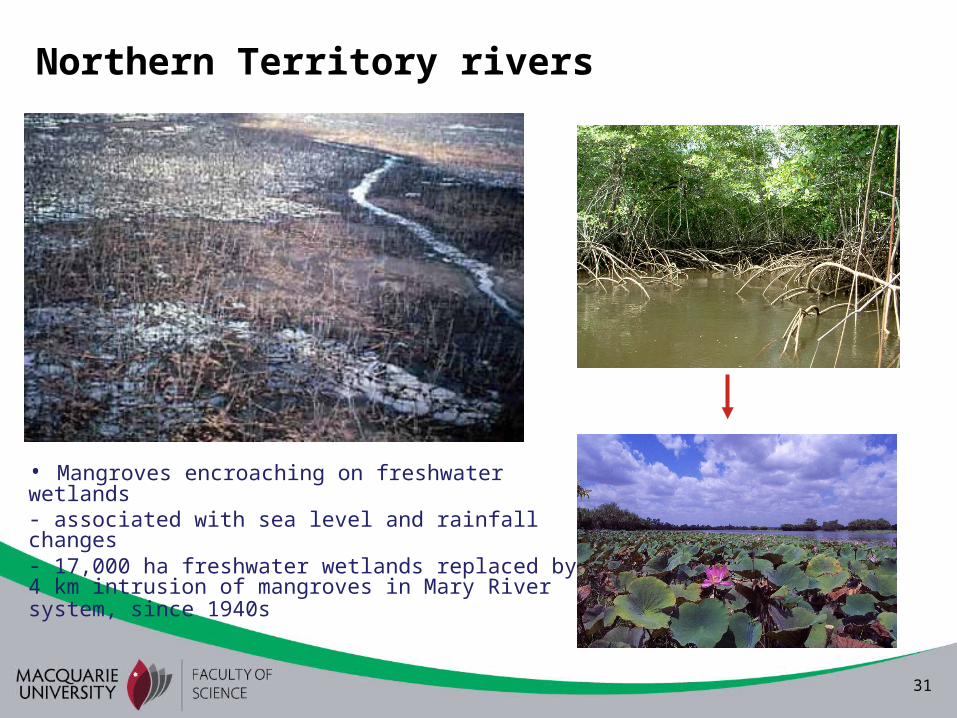
• Mangroves encroaching on freshwater wetlands- associated with sea level and rainfall changes- 17,000 ha freshwater wetlands replaced by 4 km intrusion of mangroves in Mary River system, since 1940s
Northern Territory rivers
32
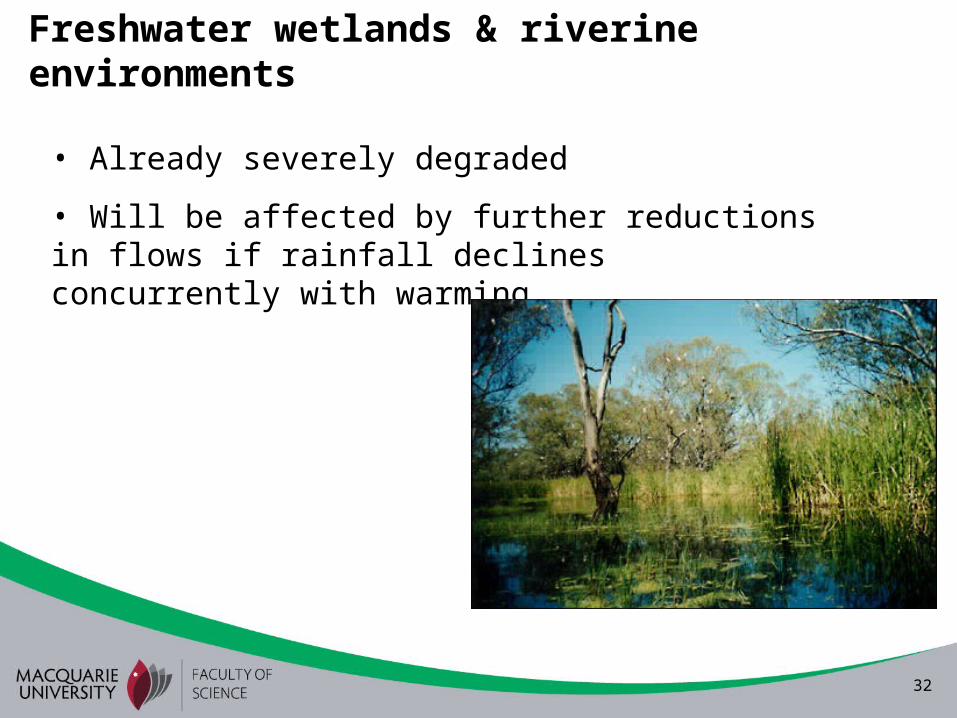
Freshwater wetlands & riverine environments
• Already severely degraded
• Will be affected by further reductions in flows if rainfall declines concurrently with warming
33
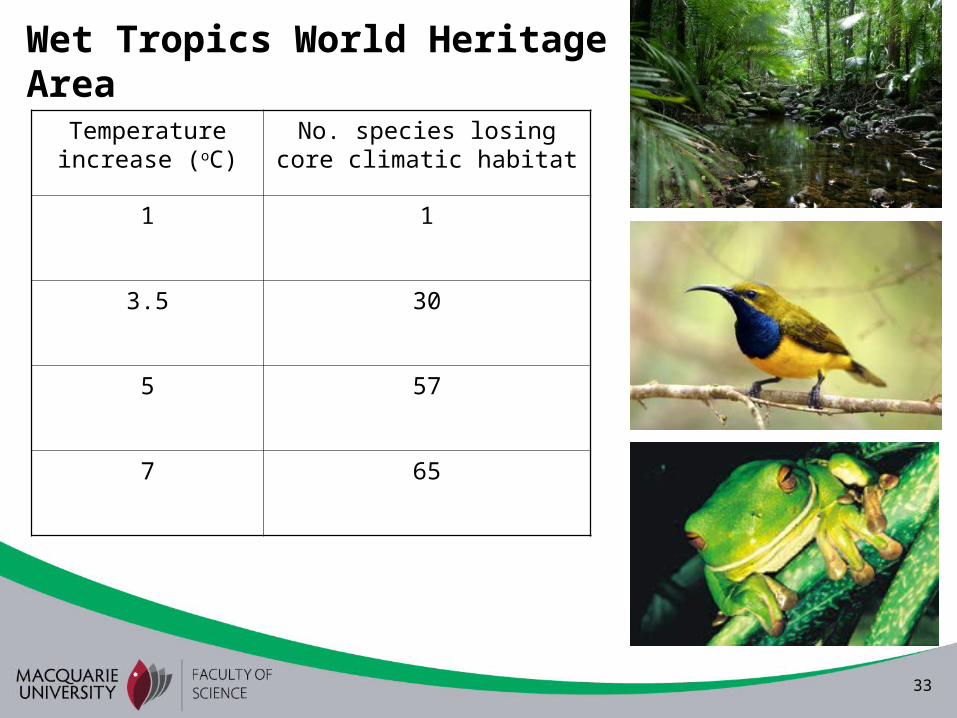
Wet Tropics World Heritage Area
Temperature increase (oC)
No. species losing core climatic habitat
1 1
3.5 30
5 57
7 65
34
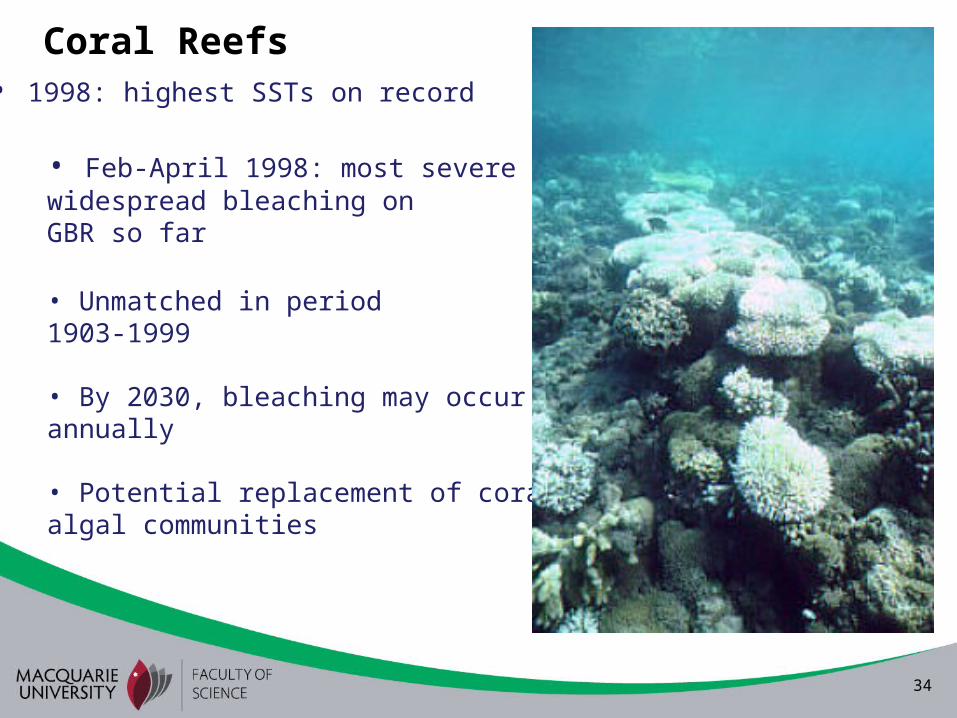
Coral Reefs• 1998: highest SSTs on record
• Feb-April 1998: most severe & widespread bleaching onGBR so far
• Unmatched in period 1903-1999
• By 2030, bleaching may occur annually
• Potential replacement of coral by algal communities
35
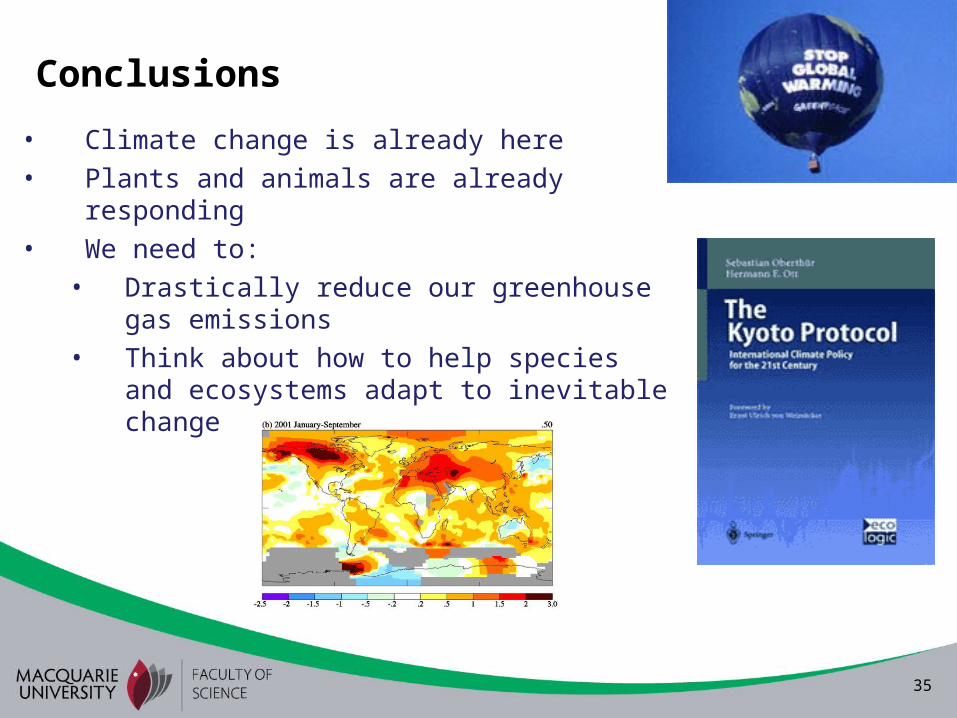
Conclusions
• Climate change is already here• Plants and animals are already responding• We need to:
• Drastically reduce our greenhouse gas emissions
• Think about how to help species and ecosystems adapt to inevitable change
36