Embed Size (px)
Citation preview
1 Community Infrastructure Plan 2020 - 2036
Community Infrastructure Plan
2020-2036
2 Draft - Community Infrastructure Plan 2020 - 2036
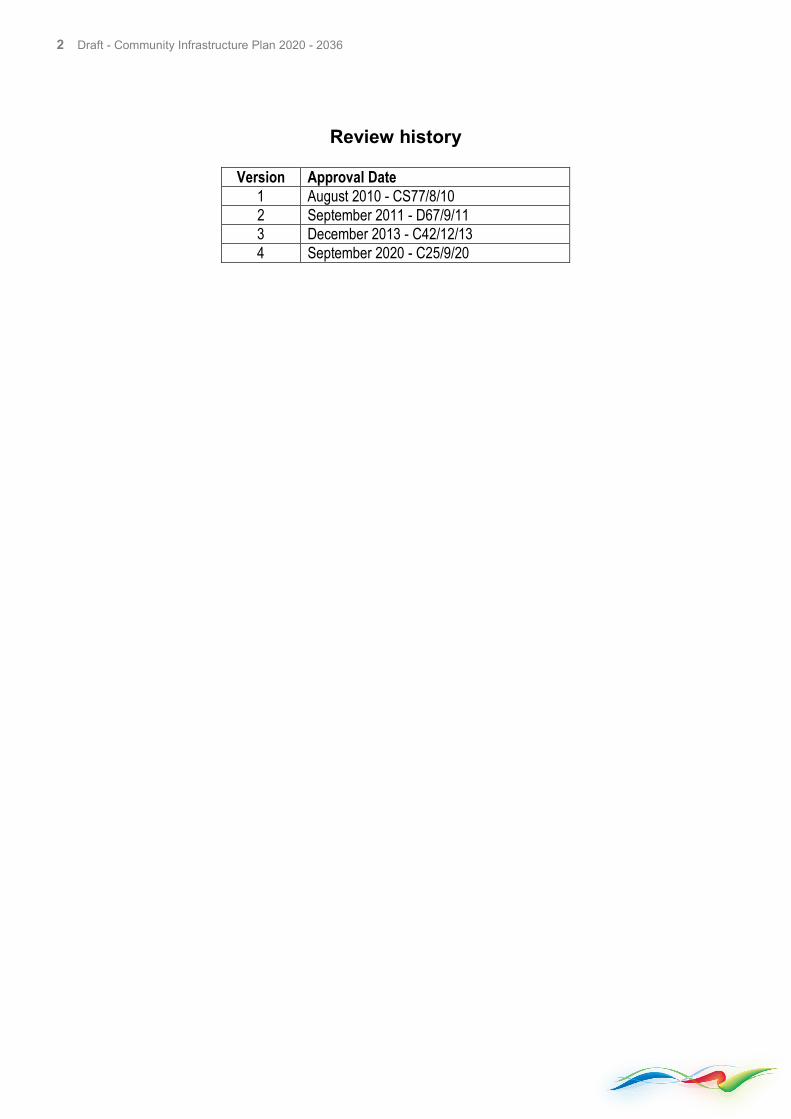
Review history
Version Approval Date 1 August 2010 - CS77/8/10 2 September 2011 - D67/9/11 3 December 2013 - C42/12/13 4 September 2020 - C25/9/20
3 Draft - Community Infrastructure Plan 2020 - 2036
Introduction .................................................................................................................................... 5
Strategic Alignment ..................................................................................................................... 6
Corporate Business Plan – Long Term Financial Plan .......................................................................... 6
Strategic Community Plan 2016-2031 .............................................................................................................. 6
State Planning Policy 3.6 ......................................................................................................................................... 7
Guiding Principles ........................................................................................................................ 9
Community Infrastructure Catchment Areas ....................................................................... 9
Hierarchy of Provision .............................................................................................................. 12
Key demographic data and trends........................................................................................ 13
City Wide Forecast Population and Households .................................................................................... 15
Community Trends and Drivers ........................................................................................................................ 18
Key Participation Trends .................................................................................................................................. 18
National Physical Activity Trends ............................................................................................................... 19
National Arts and Cultural Trends .............................................................................................................. 20
State Physical Activity Trends ...................................................................................................................... 20
State Arts and Cultural Trends ..................................................................................................................... 21
Local Sport, Recreation, Arts and Cultural Trends .......................................................................... 21
Industry Trends Influencing Community Infrastructure ................................................................ 22
Thirty Minute City .................................................................................................................................................. 22
Smart Cities .............................................................................................................................................................. 22
New Urbanism ......................................................................................................................................................... 22
Accessible, Multi-functional Open Space .............................................................................................. 22
Community Building Design and Management .................................................................................. 23
Co-location of Community Infrastructure .............................................................................................. 23
Environmental Conservation ......................................................................................................................... 24
Alternative Funding Approaches................................................................................................................. 24
Need/Demand Indicators ......................................................................................................... 25
Assumptions ................................................................................................................................................................. 25
Thresholds for Provision ...................................................................................................................................... 25
Benchmarks and criteria ....................................................................................................................................... 25
Non City of Armadale Community Infrastructure ................................................................................... 26
Inclusion of projects in the CIP ......................................................................................................................... 26
Armadale Regional Recreation Reserve ...................................................................................................... 26
Catchment Based Community Infrastructure Requirements ........................................ 28
North West Catchment Demographic Snapshot ..................................................................................... 28
4 Draft - Community Infrastructure Plan 2020 - 2036
North West Catchment Map ................................................................................................................................. 29
North West Catchment Community Infrastructure Schedule ......................................................... 30
South West Catchment Demographic Snapshot .................................................................................... 31
South West Catchment Map ................................................................................................................................ 32
South West Catchment Community Infrastructure Schedule ........................................................ 33
North Mid Catchment Demographic Snapshot ........................................................................................ 35
North Mid Catchment Map .................................................................................................................................... 36
North Mid Catchment Community Infrastructure Schedule ............................................................ 37
South Mid Catchment Demographic Snapshot ....................................................................................... 38
South Mid Catchment Map ................................................................................................................................... 39
South Mid Catchment Community Infrastructure Schedule ............................................................ 40
East Catchment Demographic Snapshot .................................................................................................... 41
East Catchment Map ................................................................................................................................................ 42
East Catchment Community Infrastructure Schedule ......................................................................... 43
References and source data .................................................................................................. 44
5 Draft - Community Infrastructure Plan 2020 - 2036
Introduction The City of Armadale’s (the City) population is rapidly growing and is expected to reach 141,177 by 2036. Beyond 2036, the City is expected to grow to a population of approximately 160,000. The City holds a primary role for the provision of community buildings and public open space to accommodate organised and social sporting, recreational and leisure activities. In order to ensure that residents have equitable access to fit-for-purpose, sustainable community infrastructure the City undertakes the regeneration of existing facilities in older more established areas, and provides new facilities in growth areas as communities become established. The City’s Community Infrastructure Plan (CIP) provides an evidence based framework to assist Council in making decisions about the level of provision of community facilities throughout the City over time. The CIP aligns with the City’s key strategic documents and informs the City’s Corporate Business Plan and Long Term Financial Plan. The City’s CIP focusses on major community facilities such as community centres including libraries, sporting and recreational playing fields and associated buildings. These are the basic community infrastructure requirements that will help facilitate community participation, connection and a healthy lifestyle. In addition to the key projects as outlined in the CIP, Council considers other more locally focused community facilities such as dog parks, youth spaces, community gardens and men’s sheds. These are also important in bringing the community together. In some instances these elements would form part of a major project such as the redevelopment of a community hub or they may stand alone but they are not listed as specific projects in the CIP. From time to time, Council may consider other types of specific use facilities such as major performing arts centres, seniors’ centres or youth centres. Any major projects developed following Council deliberations and decisions will then be included in the CIP. The CIP is a critical document in securing external funding for community infrastructure projects. It is designed to align with the State Planning Policy no.6 – Development Contributions for Infrastructure (SPP 3.6) which provides the opportunity to collect development contributions towards community infrastructure. The CIP also provides an evidence base for other external funding submissions. The timing of delivery of CIP projects is based on population triggers and the availability of funds, and is reviewed annually as part of the City’s budgeting process. The CIP should be reviewed regularly to ensure that it remains aligned with key strategic documents such as the City’s Strategic Community Plan or relevant state planning policies as well as taking into account major shifts in growth and demographics. The CIP uses the most current demographic data; this may be the 2016 Census or where available from more recent data sets.
6 Draft - Community Infrastructure Plan 2020 - 2036
Strategic Alignment Corporate Business Plan – Long Term Financial Plan The CIP informs the City’s Corporate Business Plan and Long Term Financial Plan, both of which are reviewed annually by Council. While the CIP informs Council’s decision making process, it is at the point of setting the annual budget and Corporate Business Plan that decisions regarding the timing of projects and the allocation of funding are made.
Strategic Community Plan 2016-2031 The City’s Strategic Community Plan 2016-2031 sets a shared community vision and identifies long term objectives and priorities designed to strengthen and build on the City’s unique assets. These objectives and priorities guide the City’s policies and actions which are then linked directly to operational functions to meet the needs of the current and future population. The objectives and priorities which specifically relate and inform the CIP are listed in Table 1: Table 1: Strategic Community Plan 2016-2031
Community Outcomes Strategies 1.1 A strong sense of community spirit
1.1.1 Provide opportunities to connect individuals to each other and the wider community 1.1.2 Build inter-dependent and resilient community groups 1.1.3 Value and celebrate our diversity and heritage 1.1.4 Foster local pride
1.2 Active community life that is safe and health
1.2.1 Recognise, value and support everyone 1.2.2 Provide opportunities to improve health outcomes for everyone 1.2.3 Encourage initiatives to improve perceptions of safety
1.3 The community has the services and facilities it needs
1.3.1 Plan for services and facilities in existing and emerging communities
1.4 The community is engaged and understood
1.4.1 Consult the community in diverse ways 1.4.2 Identify our strengths, challenges and opportunities
Environment Outcomes Strategies 2.1 The Natural Environment is valued and conserved
2.1.1 Preserve and improve natural areas 2.1.2 Manage the interface between natural areas and the built environment 2.1.3 Ensure that developers are sensitive to pre-existing environmental values
2.2 Attractive and Functional Public Places
2.2.1 Deliver attractive and functional streetscapes, open spaces, City buildings and facilities 2.2.2 Protect and enhance the character of the City’s spaces 2.2.3 Revitalise existing neighbourhoods whilst retaining the character of places
Leadership Outcomes Strategies 4.1 Visionary Civic leadership and sound Governance
4.1.2 Make decisions that are sound, transparent and strategic
4.2 An innovative and progressive organisation
4.2.2 Implement business plans and practices that improve service delivery
4.4 Effective Communication 4.4.2 Ensure effective communication with the community and stakeholders
7 Draft - Community Infrastructure Plan 2020 - 2036
State Planning Policy 3.6 The CIP has been prepared with consideration of the principles for development contributions as outlined in the Western Australian Planning Commission (WAPC) State Planning Policy 3.6 – Development Contributions for Infrastructure (SPP.3.6). The CIP allows for the determination of potential developer contributions and the identification of required community infrastructure provision. Clause 5.5 of SPP 3.6 requires that where a local government is seeking contributions for community infrastructure it must prepare a capital expenditure plan (at least 5 years out), which identifies the capital costs of facilities and the revenue sources (including capital grants) and programs for provision. Informing documents The CIP is informed by and is aligned with the following City of Armadale plans, strategies and studies and also with relevant external policies, and documents.
8 Community Infrastructure Plan 2020 - 2036
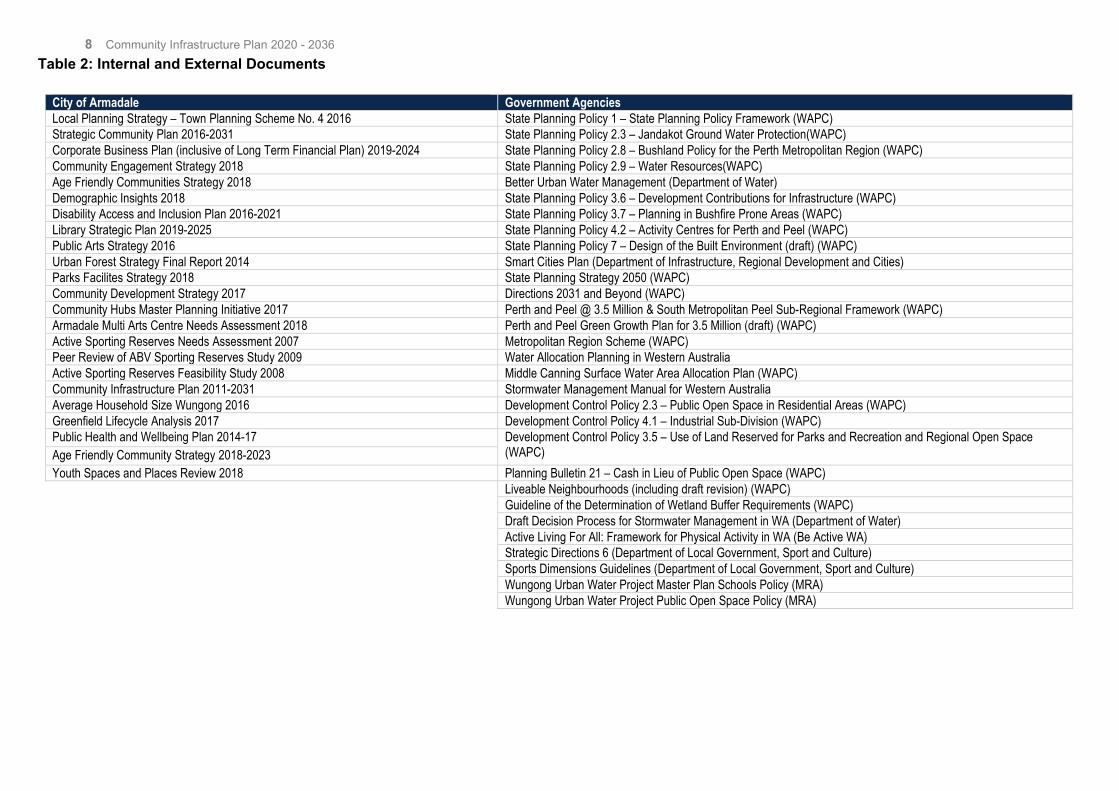
Table 2: Internal and External Documents
City of Armadale Government Agencies Local Planning Strategy – Town Planning Scheme No. 4 2016 State Planning Policy 1 – State Planning Policy Framework (WAPC) Strategic Community Plan 2016-2031 State Planning Policy 2.3 – Jandakot Ground Water Protection(WAPC) Corporate Business Plan (inclusive of Long Term Financial Plan) 2019-2024 State Planning Policy 2.8 – Bushland Policy for the Perth Metropolitan Region (WAPC) Community Engagement Strategy 2018 State Planning Policy 2.9 – Water Resources(WAPC) Age Friendly Communities Strategy 2018 Better Urban Water Management (Department of Water) Demographic Insights 2018 State Planning Policy 3.6 – Development Contributions for Infrastructure (WAPC) Disability Access and Inclusion Plan 2016-2021 State Planning Policy 3.7 – Planning in Bushfire Prone Areas (WAPC) Library Strategic Plan 2019-2025 State Planning Policy 4.2 – Activity Centres for Perth and Peel (WAPC) Public Arts Strategy 2016 State Planning Policy 7 – Design of the Built Environment (draft) (WAPC) Urban Forest Strategy Final Report 2014 Smart Cities Plan (Department of Infrastructure, Regional Development and Cities) Parks Facilites Strategy 2018 State Planning Strategy 2050 (WAPC) Community Development Strategy 2017 Directions 2031 and Beyond (WAPC) Community Hubs Master Planning Initiative 2017 Perth and Peel @ 3.5 Million & South Metropolitan Peel Sub-Regional Framework (WAPC) Armadale Multi Arts Centre Needs Assessment 2018 Perth and Peel Green Growth Plan for 3.5 Million (draft) (WAPC) Active Sporting Reserves Needs Assessment 2007 Metropolitan Region Scheme (WAPC) Peer Review of ABV Sporting Reserves Study 2009 Water Allocation Planning in Western Australia Active Sporting Reserves Feasibility Study 2008 Middle Canning Surface Water Area Allocation Plan (WAPC) Community Infrastructure Plan 2011-2031 Stormwater Management Manual for Western Australia Average Household Size Wungong 2016 Development Control Policy 2.3 – Public Open Space in Residential Areas (WAPC) Greenfield Lifecycle Analysis 2017 Development Control Policy 4.1 – Industrial Sub-Division (WAPC) Public Health and Wellbeing Plan 2014-17 Development Control Policy 3.5 – Use of Land Reserved for Parks and Recreation and Regional Open Space
(WAPC) Age Friendly Community Strategy 2018-2023 Youth Spaces and Places Review 2018 Planning Bulletin 21 – Cash in Lieu of Public Open Space (WAPC) Liveable Neighbourhoods (including draft revision) (WAPC) Guideline of the Determination of Wetland Buffer Requirements (WAPC) Draft Decision Process for Stormwater Management in WA (Department of Water) Active Living For All: Framework for Physical Activity in WA (Be Active WA) Strategic Directions 6 (Department of Local Government, Sport and Culture) Sports Dimensions Guidelines (Department of Local Government, Sport and Culture) Wungong Urban Water Project Master Plan Schools Policy (MRA) Wungong Urban Water Project Public Open Space Policy (MRA)
9 Community Infrastructure Plan 2020 - 2036
Guiding Principles The planning of new and redeveloped community infrastructure considers the following guiding principles. Due to localised considerations or other influencing factors it is not always possible or appropriate to adhere to these rigidly, however they provide a sound basis for the planning process. Table 3: Community Infrastructure Guiding Principles
Principle One Create diverse and flexible spaces that maximise use and community access through the utilisation of the community hub model.
Principle Two Design community infrastructure that enhances built form and provides an integrated, safe and enjoyable environment for communities.
Principle Three Ensure an equitable range of community infrastructure of different sizes and functions are accessible to all of the City’s residents.
Principle Four Create sustainable community infrastructure which is responsive over time and meets current and future community needs.
Principle Five Provide facilities in accordance with good practice asset management principles that ensure an appropriate balance between community infrastructure full lifecycle cost and community benefit.
Principle Six Maximise benefit to community from capital investment by achieving an efficient use of resources through cost-effective design and operation.
Principle Seven
Provide the opportunity for fair, open and collaborative community consultation when planning community infrastructure.
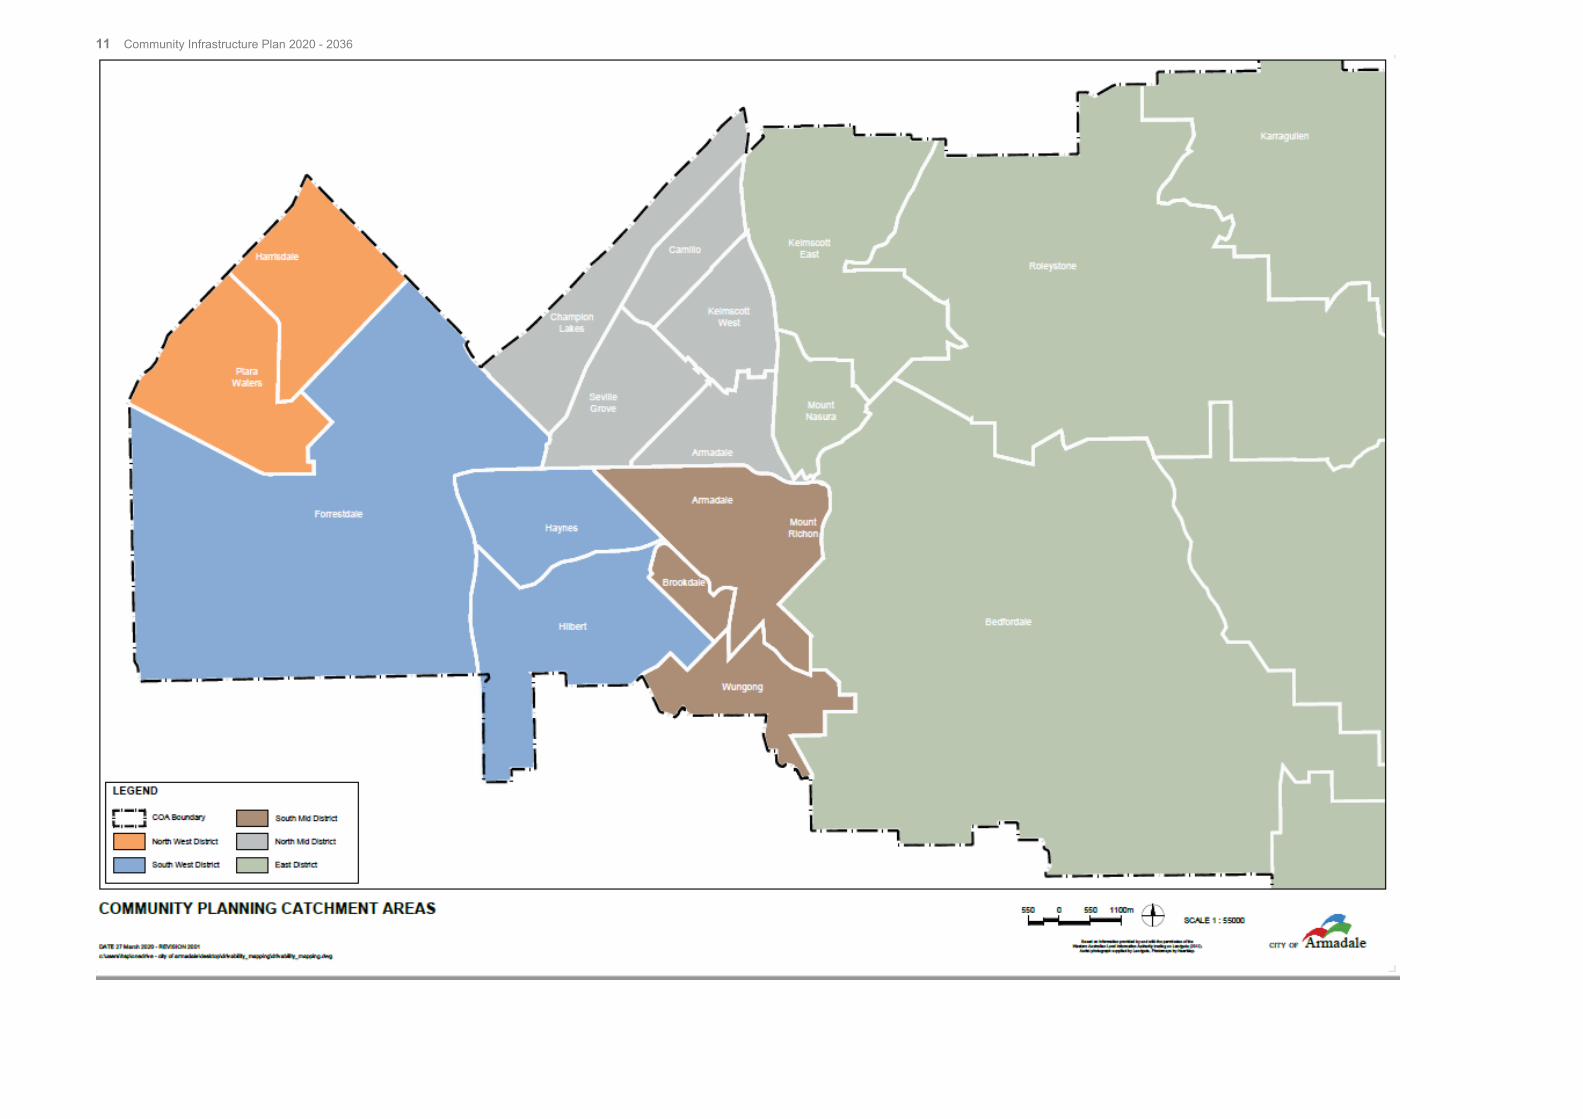
Community Infrastructure Catchment Areas Up until 2006, the City experienced a relatively stable population growth however the release of land in the western growth corridor of Armadale has seen a dramatic increase in the numbers of people moving into the City. The City’s population is increasing at twice the rate of Greater Perth and is forecast to exceed 140,000 persons by 2036. The rezoning of undeveloped land primarily used for agricultural purposes to urban has resulted in significant increases in the population. Areas of strong growth, all of which experienced recent greenfield development, include Harrisdale, Piara Waters, Champion Lakes, Hilbert and Haynes. In addition to this greenfield development driving an increased population, it is anticipated that 6497 more people dwellings will become established in the City due to infill by 2036, which will increase the population by 17,996 in older established areas of the City. Together, greenfield and infill development create a unique challenge where new community infrastructure is required in new urban settings and greater demand is placed on existing and ageing community infrastructure in older established areas where infill is occurring. The City consists of nineteen suburbs and localities and for the purposes of community infrastructure planning these suburbs are naturally aggregated into distinct catchment areas (as shown in Table 4). The catchment areas have been established based on location, land use, major access barriers such as Albany Highway, Armadale Road, train lines etc. Source data: - Community Infrastructure Catchment Areas
• Id. Consulting, 2017. Forecast Population • City of Armadale, 2016. Local Planning Strategy • Id. Consulting, 2017. Average Household Size 2036
10 Draft - Community Infrastructure Plan 2020 - 2036
The City’s suburbs have been broken down into the following catchment areas:
• North West: Harrisdale and Piara Waters; • South West: Forrestdale, Hilbert and Haynes; • North Mid: Champion Lakes, Camillo, Seville Grove, Kelmscott West and
Armadale North; • South Mid: Brookdale, Wungong, Armadale South and Mt Richon • East: Kelmscott East, Mt Nasura, Roleystone, Karragullen and Bedfordale
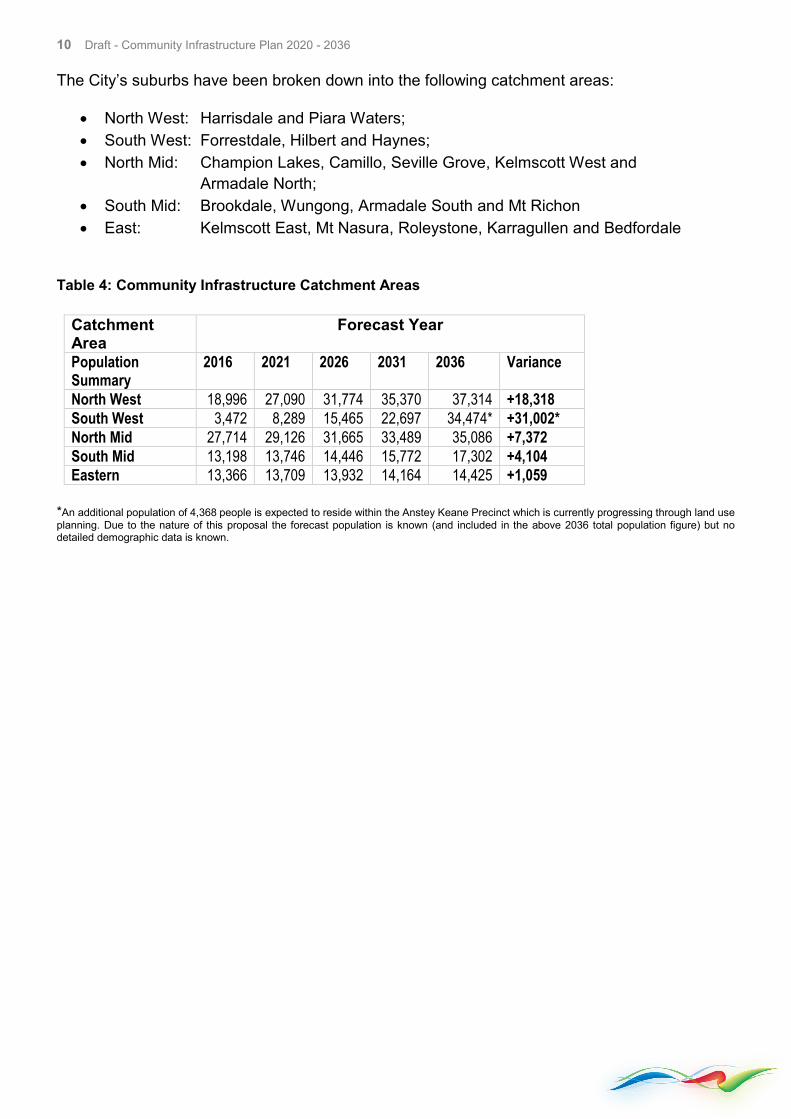
Table 4: Community Infrastructure Catchment Areas
Catchment Area
Forecast Year
Population Summary
2016 2021 2026 2031 2036 Variance
North West 18,996 27,090 31,774 35,370 37,314 +18,318 South West 3,472 8,289 15,465 22,697 34,474* +31,002* North Mid 27,714 29,126 31,665 33,489 35,086 +7,372 South Mid 13,198 13,746 14,446 15,772 17,302 +4,104 Eastern 13,366 13,709 13,932 14,164 14,425 +1,059
*An additional population of 4,368 people is expected to reside within the Anstey Keane Precinct which is currently progressing through land use planning. Due to the nature of this proposal the forecast population is known (and included in the above 2036 total population figure) but no detailed demographic data is known.
11 Community Infrastructure Plan 2020 - 2036

12 Community Infrastructure Plan 2020 - 2036
Hierarchy of Provision A hierarchy of provision provides an indication of the equity for distinct catchments throughout the City. This enables communities with access to a good range of community infrastructure. Different types of community infrastructure will be provided at various hierarchy levels, with larger infrastructure serving a wider population and smaller infrastructure catering for local needs. The catchment areas for community infrastructure are typically determined on a population, distance or drivability catchment. For areas which are isolated, a distance catchment can be more applicable as compared to areas of high density within contained areas where population catchments are more appropriate to determine the level of community infrastructure required. The hierarchy as used by the City and shown in the following table is consistent with that used throughout the sector; Table 5: Community Infrastructure Hierarchy Levels
Regional Infrastructure
Distance Catchment: Services the entire Armadale municipality, as well as bordering Cities and Shire Population Catchment: 1:100 000 – 150 000+ Service: Regional level community infrastructure supports key strategic targets such as health, community, education and training, and culture and physical activity. Regional level infrastructure can incorporate specialist facilities that are required only at a regional level such as a performing arts centre and elite sport facilities. Due to the significant reach of this infrastructure, it is generally planned and substantially funded at federal and state government level, with some local government participation. The provision of regional community infrastructure must take into account the provision of similar regional facilities at a broader level than the City of Armadale.
Sub-Regional Infrastructure
Distance Catchment: Approximately 10km catchment. Services a number of districts, typically with a population of 70 000 or more. Population Catchment: 1:70 000 – 100 000 Service: Sub-regional community infrastructure supports larger scale facilities which address wide ranging community need. This infrastructure would generally be planned at a local government level but may be developed through partnerships with state government or land developers. This hierarchy level is included in order to address the challenge of providing adequate community infrastructure for major population concentrations throughout the City, such as the forecasted growth areas of Hilbert and Haynes. The sub-regional classification enables provision where regional level community infrastructure may not be as easily accessed by the significant growth population but the population exceeds the capacity for district provision to be adequate.
District Infrastructure
Distance Catchment: Approximately 3-10km catchment. Services several neighbourhoods which are typically bordered by urban or natural barriers Population Catchment: 1: 25 000-70 000 Service: District level community infrastructure is typically planned at a local government level and services a number of suburbs. District level infrastructure is typically located in a hub model where people travelling to a district community infrastructure hub can access a range of services in one trip. Infrastructure may attract significant funding from state government, particularly where the infrastructure services a significant portion of the municipal area and accommodates delivery of key community services.
Neighbourhood Infrastructure
Distance Catchment: Approximately 1-3km catchment. Services surrounding community Population Catchment: 1: 10 000 – 25 000
13 Draft - Community Infrastructure Plan 2020 - 2036
Service: Neighbourhood level community infrastructure supports local social, sport and recreation, health and support services with potential links to services provided at regional and district level facilities. Infrastructure is typically planned by local government in partnership with land developers and community organisations.
Local Infrastructure
Distance Catchment: Specific distance dependent on type of community infrastructure. Services immediate residential population. Population Catchment: 1: <10 000 – dependent on type of community infrastructure Service: Local level community infrastructure is provided for the immediate neighbourhood and should be designed for short stay trips. The planning and development of local infrastructure is typically the responsibility of land developers and ongoing management and maintenance undertaken by local government.
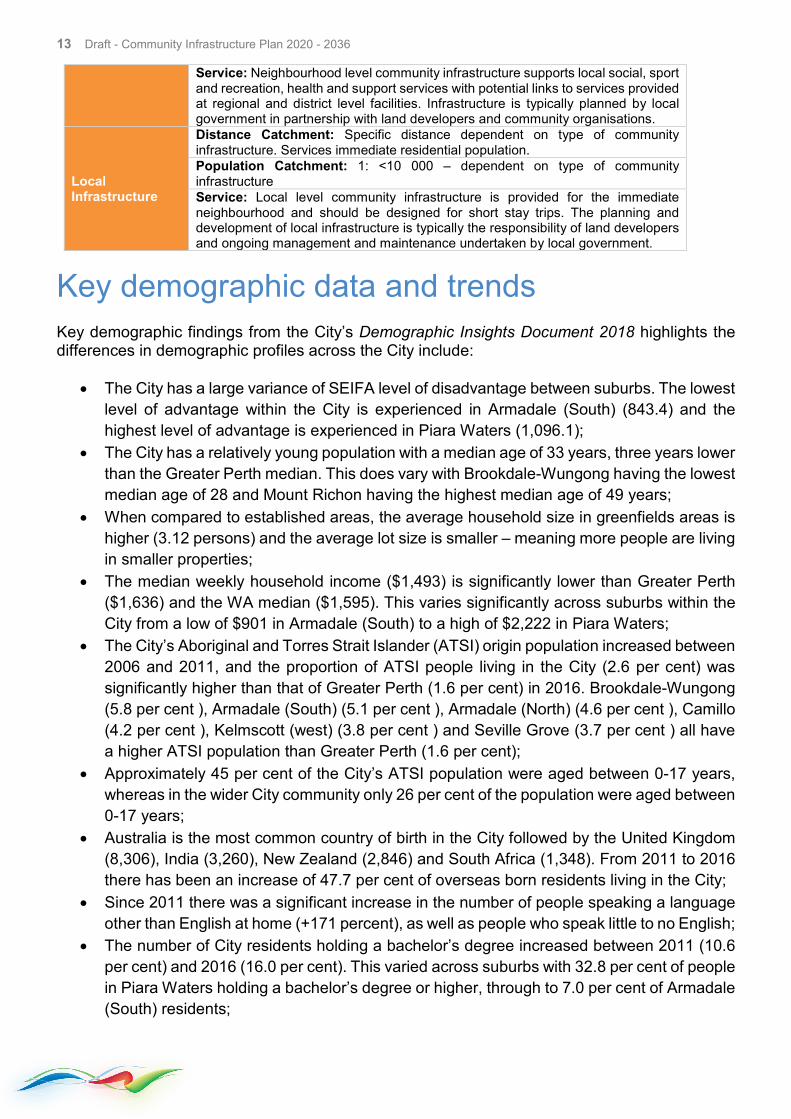
Key demographic data and trends Key demographic findings from the City’s Demographic Insights Document 2018 highlights the differences in demographic profiles across the City include:
• The City has a large variance of SEIFA level of disadvantage between suburbs. The lowest level of advantage within the City is experienced in Armadale (South) (843.4) and the highest level of advantage is experienced in Piara Waters (1,096.1);
• The City has a relatively young population with a median age of 33 years, three years lower than the Greater Perth median. This does vary with Brookdale-Wungong having the lowest median age of 28 and Mount Richon having the highest median age of 49 years;
• When compared to established areas, the average household size in greenfields areas is higher (3.12 persons) and the average lot size is smaller – meaning more people are living in smaller properties;
• The median weekly household income ($1,493) is significantly lower than Greater Perth ($1,636) and the WA median ($1,595). This varies significantly across suburbs within the City from a low of $901 in Armadale (South) to a high of $2,222 in Piara Waters;
• The City’s Aboriginal and Torres Strait Islander (ATSI) origin population increased between 2006 and 2011, and the proportion of ATSI people living in the City (2.6 per cent) was significantly higher than that of Greater Perth (1.6 per cent) in 2016. Brookdale-Wungong (5.8 per cent ), Armadale (South) (5.1 per cent ), Armadale (North) (4.6 per cent ), Camillo (4.2 per cent ), Kelmscott (west) (3.8 per cent ) and Seville Grove (3.7 per cent ) all have a higher ATSI population than Greater Perth (1.6 per cent);
• Approximately 45 per cent of the City’s ATSI population were aged between 0-17 years, whereas in the wider City community only 26 per cent of the population were aged between 0-17 years;
• Australia is the most common country of birth in the City followed by the United Kingdom (8,306), India (3,260), New Zealand (2,846) and South Africa (1,348). From 2011 to 2016 there has been an increase of 47.7 per cent of overseas born residents living in the City;
• Since 2011 there was a significant increase in the number of people speaking a language other than English at home (+171 percent), as well as people who speak little to no English;
• The number of City residents holding a bachelor’s degree increased between 2011 (10.6 per cent) and 2016 (16.0 per cent). This varied across suburbs with 32.8 per cent of people in Piara Waters holding a bachelor’s degree or higher, through to 7.0 per cent of Armadale (South) residents;
14 Draft - Community Infrastructure Plan 2020 - 2036
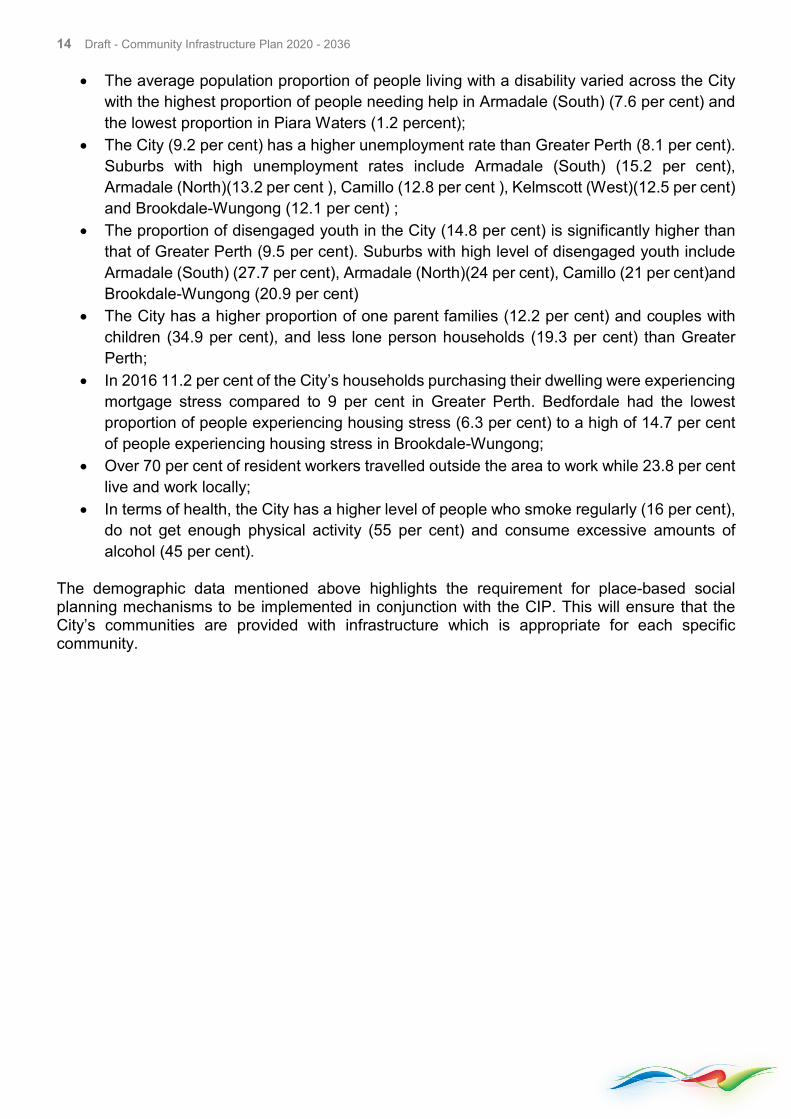
• The average population proportion of people living with a disability varied across the City with the highest proportion of people needing help in Armadale (South) (7.6 per cent) and the lowest proportion in Piara Waters (1.2 percent);
• The City (9.2 per cent) has a higher unemployment rate than Greater Perth (8.1 per cent). Suburbs with high unemployment rates include Armadale (South) (15.2 per cent), Armadale (North)(13.2 per cent ), Camillo (12.8 per cent ), Kelmscott (West)(12.5 per cent) and Brookdale-Wungong (12.1 per cent) ;
• The proportion of disengaged youth in the City (14.8 per cent) is significantly higher than that of Greater Perth (9.5 per cent). Suburbs with high level of disengaged youth include Armadale (South) (27.7 per cent), Armadale (North)(24 per cent), Camillo (21 per cent)and Brookdale-Wungong (20.9 per cent)
• The City has a higher proportion of one parent families (12.2 per cent) and couples with children (34.9 per cent), and less lone person households (19.3 per cent) than Greater Perth;
• In 2016 11.2 per cent of the City’s households purchasing their dwelling were experiencing mortgage stress compared to 9 per cent in Greater Perth. Bedfordale had the lowest proportion of people experiencing housing stress (6.3 per cent) to a high of 14.7 per cent of people experiencing housing stress in Brookdale-Wungong;
• Over 70 per cent of resident workers travelled outside the area to work while 23.8 per cent live and work locally;
• In terms of health, the City has a higher level of people who smoke regularly (16 per cent), do not get enough physical activity (55 per cent) and consume excessive amounts of alcohol (45 per cent).
The demographic data mentioned above highlights the requirement for place-based social planning mechanisms to be implemented in conjunction with the CIP. This will ensure that the City’s communities are provided with infrastructure which is appropriate for each specific community.
15 Draft - Community Infrastructure Plan 2020 - 2036
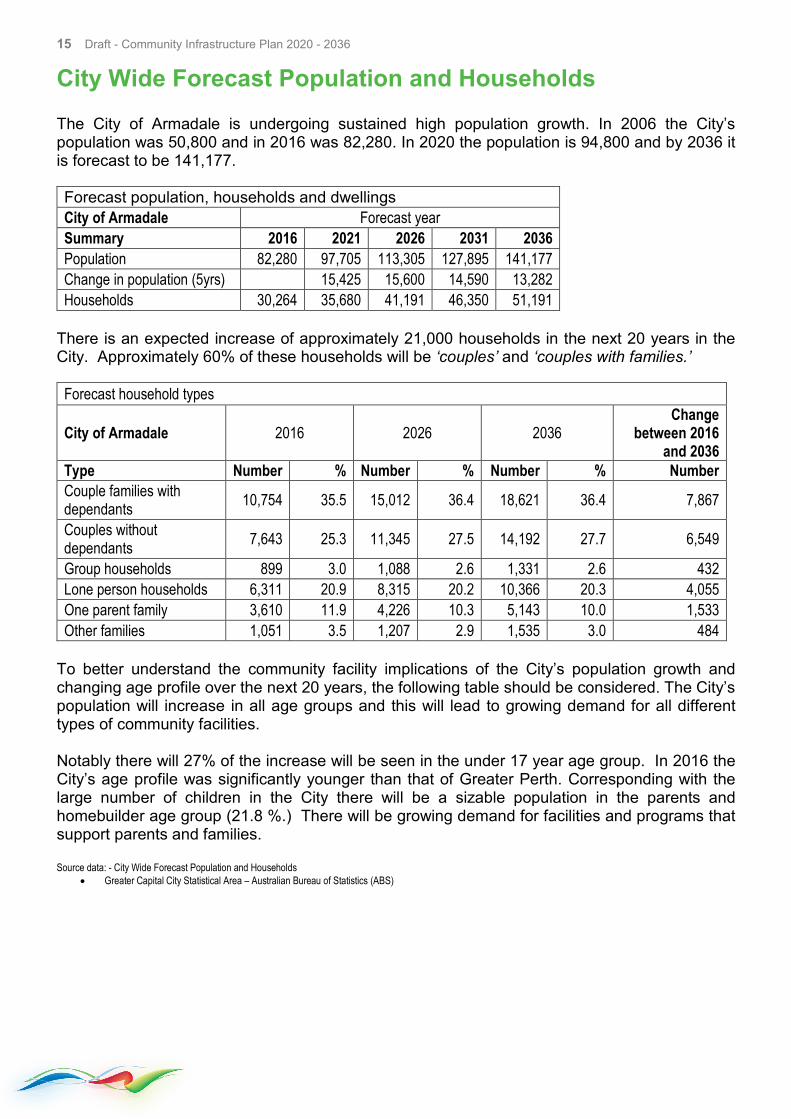
City Wide Forecast Population and Households The City of Armadale is undergoing sustained high population growth. In 2006 the City’s population was 50,800 and in 2016 was 82,280. In 2020 the population is 94,800 and by 2036 it is forecast to be 141,177. Forecast population, households and dwellings City of Armadale Forecast year Summary 2016 2021 2026 2031 2036 Population 82,280 97,705 113,305 127,895 141,177 Change in population (5yrs) 15,425 15,600 14,590 13,282 Households 30,264 35,680 41,191 46,350 51,191
There is an expected increase of approximately 21,000 households in the next 20 years in the City. Approximately 60% of these households will be ‘couples’ and ‘couples with families.’
Forecast household types
City of Armadale 2016 2026 2036 Change
between 2016 and 2036
Type Number % Number % Number % Number Couple families with dependants 10,754 35.5 15,012 36.4 18,621 36.4 7,867
Couples without dependants 7,643 25.3 11,345 27.5 14,192 27.7 6,549
Group households 899 3.0 1,088 2.6 1,331 2.6 432 Lone person households 6,311 20.9 8,315 20.2 10,366 20.3 4,055 One parent family 3,610 11.9 4,226 10.3 5,143 10.0 1,533 Other families 1,051 3.5 1,207 2.9 1,535 3.0 484
To better understand the community facility implications of the City’s population growth and changing age profile over the next 20 years, the following table should be considered. The City’s population will increase in all age groups and this will lead to growing demand for all different types of community facilities. Notably there will 27% of the increase will be seen in the under 17 year age group. In 2016 the City’s age profile was significantly younger than that of Greater Perth. Corresponding with the large number of children in the City there will be a sizable population in the parents and homebuilder age group (21.8 %.) There will be growing demand for facilities and programs that support parents and families. Source data: - City Wide Forecast Population and Households
• Greater Capital City Statistical Area – Australian Bureau of Statistics (ABS)
16 Draft - Community Infrastructure Plan 2020 - 2036
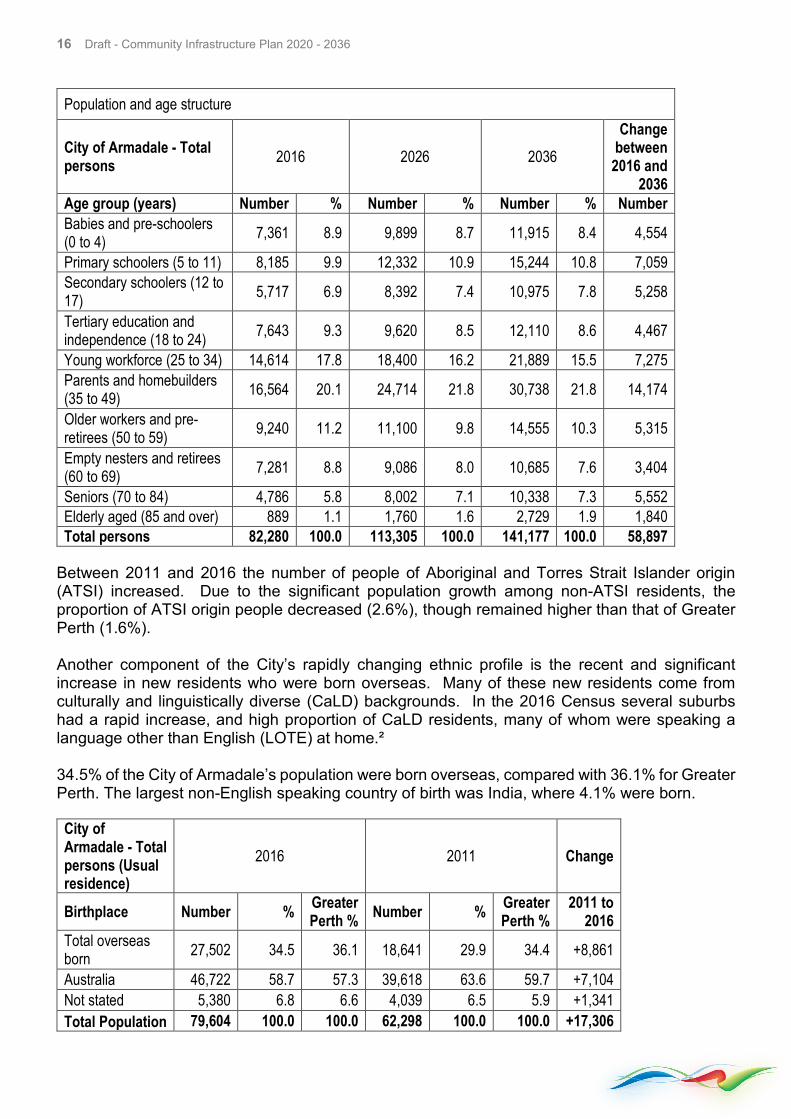
Population and age structure
City of Armadale - Total persons 2016 2026 2036
Change between
2016 and 2036
Age group (years) Number % Number % Number % Number Babies and pre-schoolers (0 to 4) 7,361 8.9 9,899 8.7 11,915 8.4 4,554
Primary schoolers (5 to 11) 8,185 9.9 12,332 10.9 15,244 10.8 7,059 Secondary schoolers (12 to 17) 5,717 6.9 8,392 7.4 10,975 7.8 5,258
Tertiary education and independence (18 to 24) 7,643 9.3 9,620 8.5 12,110 8.6 4,467
Young workforce (25 to 34) 14,614 17.8 18,400 16.2 21,889 15.5 7,275 Parents and homebuilders (35 to 49) 16,564 20.1 24,714 21.8 30,738 21.8 14,174
Older workers and pre-retirees (50 to 59) 9,240 11.2 11,100 9.8 14,555 10.3 5,315
Empty nesters and retirees (60 to 69) 7,281 8.8 9,086 8.0 10,685 7.6 3,404
Seniors (70 to 84) 4,786 5.8 8,002 7.1 10,338 7.3 5,552 Elderly aged (85 and over) 889 1.1 1,760 1.6 2,729 1.9 1,840 Total persons 82,280 100.0 113,305 100.0 141,177 100.0 58,897
Between 2011 and 2016 the number of people of Aboriginal and Torres Strait Islander origin (ATSI) increased. Due to the significant population growth among non-ATSI residents, the proportion of ATSI origin people decreased (2.6%), though remained higher than that of Greater Perth (1.6%). Another component of the City’s rapidly changing ethnic profile is the recent and significant increase in new residents who were born overseas. Many of these new residents come from culturally and linguistically diverse (CaLD) backgrounds. In the 2016 Census several suburbs had a rapid increase, and high proportion of CaLD residents, many of whom were speaking a language other than English (LOTE) at home.² 34.5% of the City of Armadale’s population were born overseas, compared with 36.1% for Greater Perth. The largest non-English speaking country of birth was India, where 4.1% were born.
City of Armadale - Total persons (Usual residence)
2016 2011 Change
Birthplace Number % Greater Perth % Number % Greater
Perth % 2011 to
2016 Total overseas born 27,502 34.5 36.1 18,641 29.9 34.4 +8,861
Australia 46,722 58.7 57.3 39,618 63.6 59.7 +7,104 Not stated 5,380 6.8 6.6 4,039 6.5 5.9 +1,341 Total Population 79,604 100.0 100.0 62,298 100.0 100.0 +17,306
17 Draft - Community Infrastructure Plan 2020 - 2036
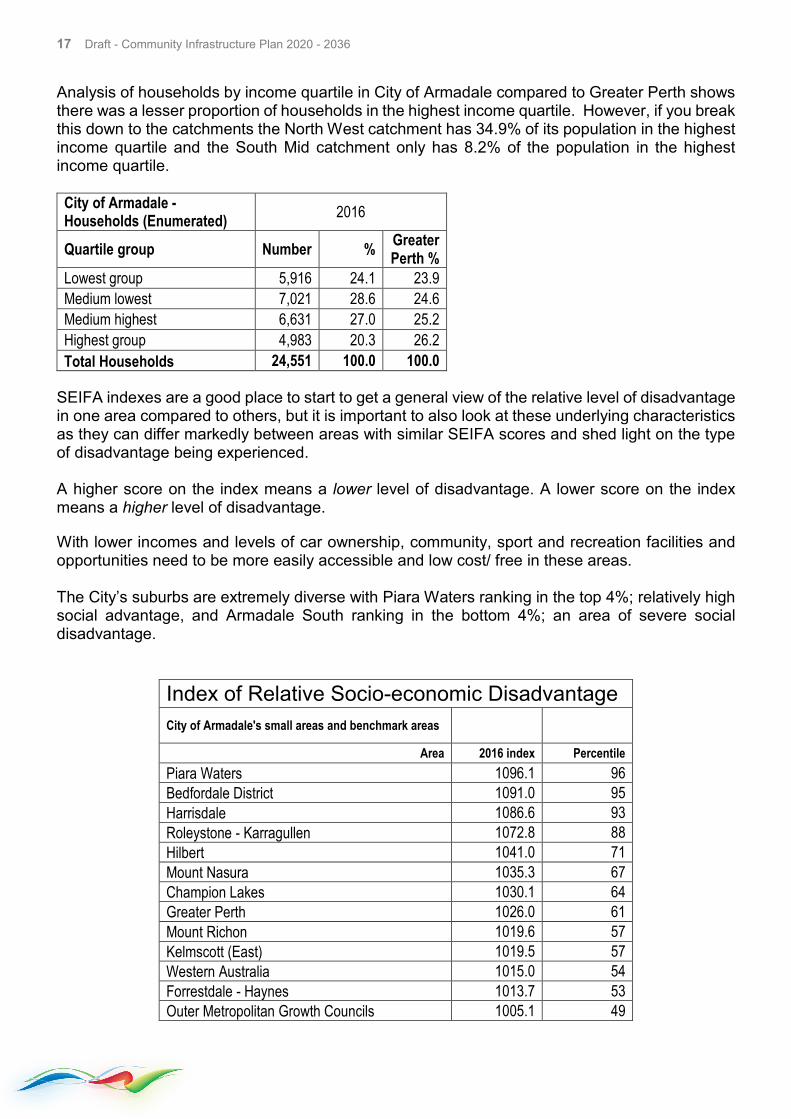
Analysis of households by income quartile in City of Armadale compared to Greater Perth shows there was a lesser proportion of households in the highest income quartile. However, if you break this down to the catchments the North West catchment has 34.9% of its population in the highest income quartile and the South Mid catchment only has 8.2% of the population in the highest income quartile.
City of Armadale - Households (Enumerated) 2016
Quartile group Number % Greater Perth %
Lowest group 5,916 24.1 23.9 Medium lowest 7,021 28.6 24.6 Medium highest 6,631 27.0 25.2 Highest group 4,983 20.3 26.2 Total Households 24,551 100.0 100.0
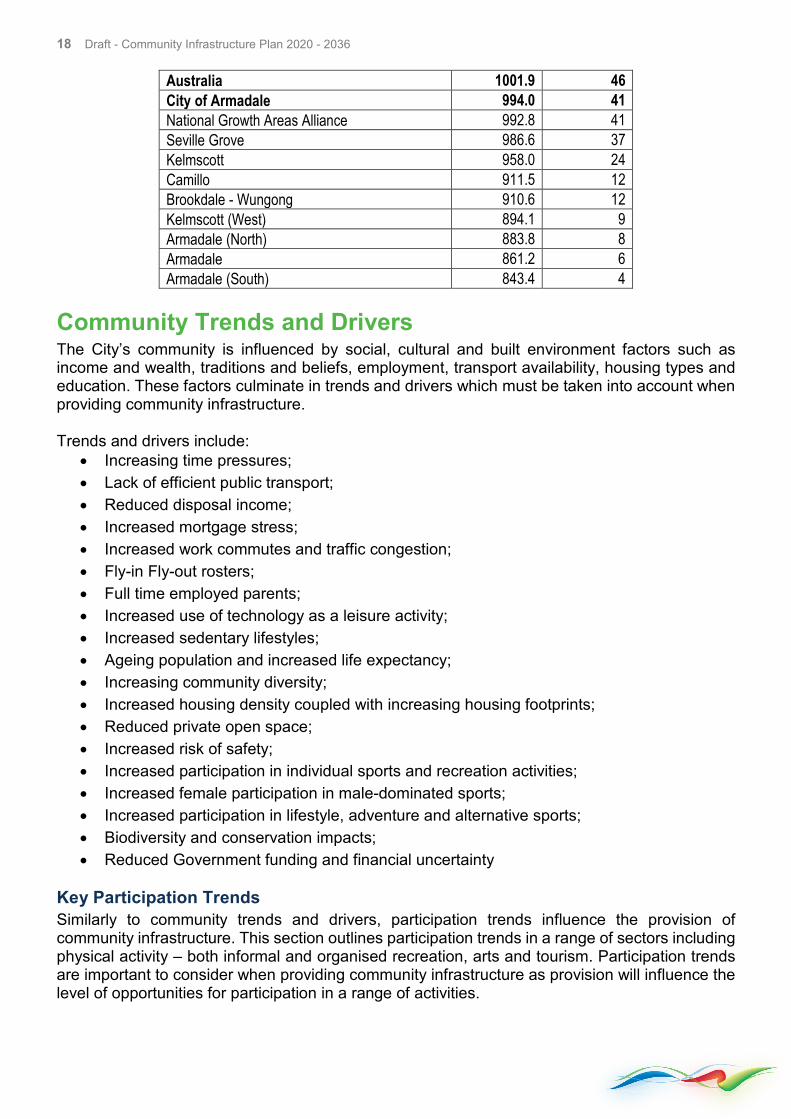
SEIFA indexes are a good place to start to get a general view of the relative level of disadvantage in one area compared to others, but it is important to also look at these underlying characteristics as they can differ markedly between areas with similar SEIFA scores and shed light on the type of disadvantage being experienced. A higher score on the index means a lower level of disadvantage. A lower score on the index means a higher level of disadvantage. With lower incomes and levels of car ownership, community, sport and recreation facilities and opportunities need to be more easily accessible and low cost/ free in these areas. The City’s suburbs are extremely diverse with Piara Waters ranking in the top 4%; relatively high social advantage, and Armadale South ranking in the bottom 4%; an area of severe social disadvantage.
Index of Relative Socio-economic Disadvantage City of Armadale's small areas and benchmark areas
Area 2016 index Percentile
Piara Waters 1096.1 96 Bedfordale District 1091.0 95 Harrisdale 1086.6 93 Roleystone - Karragullen 1072.8 88 Hilbert 1041.0 71 Mount Nasura 1035.3 67 Champion Lakes 1030.1 64 Greater Perth 1026.0 61 Mount Richon 1019.6 57 Kelmscott (East) 1019.5 57 Western Australia 1015.0 54 Forrestdale - Haynes 1013.7 53 Outer Metropolitan Growth Councils 1005.1 49
18 Draft - Community Infrastructure Plan 2020 - 2036
Australia 1001.9 46 City of Armadale 994.0 41 National Growth Areas Alliance 992.8 41 Seville Grove 986.6 37 Kelmscott 958.0 24 Camillo 911.5 12 Brookdale - Wungong 910.6 12 Kelmscott (West) 894.1 9 Armadale (North) 883.8 8 Armadale 861.2 6 Armadale (South) 843.4 4
Community Trends and Drivers The City’s community is influenced by social, cultural and built environment factors such as income and wealth, traditions and beliefs, employment, transport availability, housing types and education. These factors culminate in trends and drivers which must be taken into account when providing community infrastructure. Trends and drivers include:
• Increasing time pressures; • Lack of efficient public transport; • Reduced disposal income; • Increased mortgage stress; • Increased work commutes and traffic congestion; • Fly-in Fly-out rosters; • Full time employed parents; • Increased use of technology as a leisure activity; • Increased sedentary lifestyles; • Ageing population and increased life expectancy; • Increasing community diversity; • Increased housing density coupled with increasing housing footprints; • Reduced private open space; • Increased risk of safety; • Increased participation in individual sports and recreation activities; • Increased female participation in male-dominated sports; • Increased participation in lifestyle, adventure and alternative sports; • Biodiversity and conservation impacts; • Reduced Government funding and financial uncertainty
Key Participation Trends Similarly to community trends and drivers, participation trends influence the provision of community infrastructure. This section outlines participation trends in a range of sectors including physical activity – both informal and organised recreation, arts and tourism. Participation trends are important to consider when providing community infrastructure as provision will influence the level of opportunities for participation in a range of activities.
19 Draft - Community Infrastructure Plan 2020 - 2036
National Physical Activity Trends • In 2014-15, around half (56 per cent) of Australians aged 18- 64 years participated in
sufficient physical activity, whereas nearly one in three (30 per cent) were insufficiently active and 15 per cent were inactive;
• Adult physical activity levels decline with age, with more 18-24 year olds (59 per cent of males and 48 per cent of females) taking part in enough physical activity to benefit their health, compared with only 30 per cent of males and 20 per cent of females aged 75 or over;
• Females of all ages, generally have lower physical activity rates than males; • Rates of sedentary levels of physical activity decline as the level of disadvantage
decreases; • Two thirds (66 per cent) of those living in the most advantaged areas participated in non-
organised activities compared with 40 per cent of those living in the most disadvantaged areas, while the participation rates for organised sport were 35 per cent and 20 per cent;
• In 2011-12, walking for exercise attracted the largest number of both male and female participants. However, a much larger percentage of women participated in walking for exercise than men (30 per cent compared with 17 per cent).
• In 2011-12, participation of 18-24 year olds in non-organised sport and physical recreation participation was significantly higher than organised participation;
• The total participation rate for sport and physical recreation has remained similar over time, although there was a decrease in organised participation from 28 per cent in 2005-06 to 26 per cent in 2009-10;
• Persons aged 15-17 years had the highest participation rate for organised sport and physical recreation (58 per cent). This was also the only age group where the proportion of people participating was higher for organised activities compared with non-organised activities;
• In older age groups, participation rates for non-organised sport and physical recreation ranged from 40 per cent for those aged 65 years and over, to 58 per cent of those aged 35-44 years;
• In 2011-12, children aged 5-17 years participated in an average of one and a half hours (91 minutes) of physical activity per day, with just over 60 per cent averaging at least one hour per day;
• Approximately two thirds (66 per cent) of all children aged between 9-11 years participated in organised sport, higher than the participation rates of those aged 5-8 years and 12-14 years (56 per cent and 60 per cent respectively). More males (949,000) participated than females (727,000);
• Participation in organised sport was higher for children born in Australia (61 per cent) compared with those born overseas (52 per cent) and higher for children in couple families (64 per cent) compared with those living in one-parent families (48 per cent);
• Children’s participation in more active recreational activities has increased since 2009, with the proportion of children skateboarding, rollerblading or riding a scooter rising from 49 per cent to 54 per cent, and the proportion of children bike riding increasing from 60 per cent to 64 per cent;
• In general, children’s physical activity decreases and screen-based activity increases as they get older.
20 Draft - Community Infrastructure Plan 2020 - 2036
Based on the above physical participation data, community infrastructure is required to provide people with the opportunity to engage in both formal and informal physical activity. National Arts and Cultural Trends
• More than a quarter (27 per cent or 4.9 million people) of the 18.5 million persons aged 15 years and over living in Australia in 2013/14 participated in at least one selected cultural activity during 2014. The participation rate in 2010/11 was also 27 per cent;
• Cultural participation rates tended to decrease with age; people aged 25-34 had a participation rate of 28 per cent and people aged 65 years and over had a participation rate of 23 per cent;
• People aged 15-17 years were most likely to attend at least one cultural venue and event, with an attendance rate of 95 per cent;
• Full and part-time employed people had significantly higher attendance rates at cultural venues and events than people who were unemployed or not in the labour force;
• In 2013-14 public libraries had more than 8.6 million registered members (37 per cent of the nations’ population), and many more Australians who are not members used libraries for study, reading, internet access and to participate in library programs and activities.
• Unemployed people had the highest library attendance rate, with 48 per cent having visited a national, state or local library in 2014, compared with 31 per cent of employed people;
• Since 2003, the most popular leisure activity for children has been watching television, DVDs or videos (around 98 per cent);
• In 2009, dancing was the most popular organised cultural activity for girls, but the least popular with boys. For boys, the most popular organised cultural activity was playing a musical instrument.
• In 2012, children spent more time watching television, DVDs or videos than any of the other selected recreational activities. A higher proportion of males were involved in skateboarding, rollerblading or riding a scooter (60 per cent) and bike riding (70 per cent) than females (47 per cent and 57 per cent respectively), while more females were involved in recreational art and craft (54 per cent) and reading for pleasure (77 per cent) than males (33 per cent and 65 per cent respectively).
State Physical Activity Trends • In Western Australia, health, fitness and enjoyment are the main reasons for participation
in sport and recreation. The primary reasons for non-participation are insufficient time due to work or study and lack of interest in sport or physical activity;
• In 2012, the total sport and recreation (both organised and non-organised) participation by West Australians aged 15-24 year age group was 90.2 per cent, 64.8 per cent for 45-54 year olds and 55.5 per cent for persons aged 65+ years;
• The most popular physical activity was walking followed by aerobics/fitness and swimming;16
The Western Australian population, in line with other States, has a higher participation rate of informal physical activity than formal physical activity.
21 Draft - Community Infrastructure Plan 2020 - 2036
State Arts and Cultural Trends • More than a quarter (26 per cent or 459,600 people) of the population aged 15 years and
over living in Western Australia participated in at least one cultural activity in 2012. The rate of participation in Western Australia is consistent with the national rate;
• Across all age groups, women had a higher cultural participation rate (30 per cent) than men (21 per cent);
• Playing a musical instrument was the most popular organised cultural activity with 16 per cent of children in Western Australia involved. By comparison, 15 per cent were involved in dancing, 6 per cent in organised art and craft, and 4 per cent were involved in singing and drama;
• In 2012, almost half of all girls (46 per cent) in Western Australia participated in at least one organised cultural activity compared with less than a quarter of boys (23 per cent); and
• More than half (59 per cent) had visited a public library, whilst 43 per cent visited a museum or art gallery and 40 per cent attended a performing arts event.
Western Australian arts and cultural trends align with those of other Australian States. Local Sport, Recreation, Arts and Cultural Trends
• The City has 74 organised sporting clubs who utilise open space and community buildings as their home base;
• Typically clubs in growth areas have a larger membership base than those within established areas of the City;
• On average the City’s sporting clubs have 106 members, equating to approximately 8,162 total organised sporting club members across the City;
• 21 different types of organised sport are played in the City, AFL is the most popular (11 clubs), followed by cricket (10 clubs), soccer (8 clubs), equestrian clubs (6 clubs), little athletics (6 clubs), diamond sports (5 clubs) and water sports (5 clubs);
• There is an increasing prevalence of social sport being undertaken in the City - typically these are migrant groups playing sports they would play in their country of origin;
• Not including organized sporting groups, 185 groups utilise the City’s 63 community buildings, 66 of these groups are community organisations and 43 are commercial organisations;
• Of the community organisations providing services within the City, the most prevalent are family health service (10), religious groups (9), scouts/guides (8), residents groups (5), arts and crafts (4) and education assistance (4).
• Seven different commercial services are run from the City’s community buildings including martial arts (14), fitness (12), children’s activities (7), pilates and yoga (6), performing arts (3), dance (2) and out of hours school care (1);
• Almost 1,000 people visit a City library per day; • In the 2016/17 financial year approximately 4,100 new library memberships were created
and 350,000 people visited at least one of the City’s libraries. Over 500 regular and special library sessions were held with over 11,000 attendees. 98,000 sessions of public computers and Wi-Fi were recorded.
22 Draft - Community Infrastructure Plan 2020 - 2036
The City’s community infrastructure is well utilised by organised groups who provide a significant amount of activities and services for the community to engage in. The CIP acknowledges the importance of providing a variety of community infrastructure which is adaptable and flexible to cater for the different requirements of groups and changing preferences. The CIP advocates for the provision of shared use facilities enabling a greater number of groups to access spaces to conduct activities for communities. Industry Trends Influencing Community Infrastructure The following industry trends influence how community infrastructure is provided. These industry trends are heavily influenced by social, environmental and built environment factors as well as physical activity, arts and cultural participation trends. Thirty Minute City The Thirty Minute City approach addresses connectivity through the concept that no matter where you live, you can easily access the places you need to visit on a daily basis. The concept of a Thirty Minute City incorporates Marchetti’s constant into urban planning objectives. Marchetti’s constant theorises that people have a natural daily travel threshold of around an hour, or thirty minutes in one direction. The idea is to plan for cities where residents can access employment, schools, shopping, services and recreational facilities within thirty minutes of home. Smart Cities A smart city uses technology and data to drive economic activity, accelerate innovation and better manage energy, resources and services. Smart cities are people focused and aim to improve people’s experiences of the city so that it better meets their needs. Collecting, analysing and intelligently using data is core to the concept of a smart city as this data drives the insight and action to better manage and plan city resources and services. New Urbanism New Urbanism is embedded into Western Australia’s planning framework and advocates for a compact, pedestrian-friendly, mixed-use liveable community which promotes walking. New Urbanism encourages the co-location of daily needs requirements as well as a greater mix of shared and complementary land uses allowing for multiple activities to be undertaken, and different daily needs to be met in the one location. Locating open space and community buildings in proximity to local activity centres results in reduced travel times which have the potential to impact on opportunities for people to increase physical activity. Accessible, Multi-functional Open Space Historically the provision of open space was one dimensional with open space having only one function – either recreation, nature or sporting. Since the 1990s research indicates a greater community demand for more multi-functional open space. This approach to make parks more inclusive for whole communities has been well documented, and a number of researchers have suggested that the adaption of these spaces is likely to increase the number of people using these spaces to engage in physical activity. Research has shown that neighbourhoods with greater access to public open space within 400m are associated with a high participation rate of physical activity. Research also indicates that the more inviting and enjoyable public open space is, the more likely people are to frequent the open space therefore having a greater impact on individual physical activity.
23 Draft - Community Infrastructure Plan 2020 - 2036
Community Building Design and Management Community building design and management trends are typically centred on improving the function and sustainability of buildings: Key trends include:
• Co-locating health, fitness and community buildings with other leisure based activities, in order to improve financial and service sustainability;
• Building design considers community safety through the utilisation of Crime Prevention Through Environmental Design (CPTED);
• Greater consideration of people with a disability, especially those who require accessible facilities above the required building code;
• Flexible building designs are able to cater for multiple uses and are responsive to changing demands over time;
• Improved storage in multi-use buildings to cater for a greater number of users; • Consideration of adequate car parking and effective and efficient pedestrian/cycle
networks to buildings; • Demand for female friendly (unisex change rooms), family change rooms, social spaces
and baby change facilities. This is critical, particularly when considering the development of multi-functional buildings for wider community use;
• Community buildings must be influenced by social needs and not delivered through a typical ‘cookie cutter design;
• The utilisation of environmental sustainable design (ESD).
The open space and community building design and location criteria within the CIP take the above trends into account. It should be noted that while ESD should be integrated into community building design, the balance between the cost of ESD and its effectiveness should be considered. A higher level of ESD should be incorporated in community buildings at a district and regional level, as typically these buildings have a greater return on investment for ESD mechanisms. Co-location of Community Infrastructure Historically, community infrastructure has been provided in an isolated approach resulting in duplication, underutilisation or a lack of accessibility. New Urbanism (which encourages co-location), together with decreased land availability and increasing costs has influenced the trend of co-locating community infrastructure into community hubs. The City defines community hubs as a cluster of community facilities or a single multi-purpose facility accommodating a variety of services that provide a space for local community groups and organisations to meet and participate in a range of activities, programs, services and events. Benefits of community hubs include:
• Less infrastructure duplication; • Greater maximisation of community buildings and associated services; • Creation of destinations which accommodate multiple activities and transactions; • Reduced operating costs; • Increased usage and revenue; • Shared capital costs; • Improved relationships between community groups and organisations resulting in greater
community cohesion.
24 Draft - Community Infrastructure Plan 2020 - 2036
Environmental Conservation Public awareness of environmental and conservation issues is increasing with greater value placed on open space and environmental asset protection. A challenge for local governments is responding to the changing environment in an effective manner. Major factors include:
• Reduced rainfall and increased frequency of drought conditions; • Increased prevalence of heat island effect; • Increased amount of extreme events (flood, heatwaves and bushfires); • Hotter, drier conditions resulting in a higher level of evaporation from open spaces and a
deterioration of surface quality; • Reduced groundwater recharge and reduced groundwater availability for self-supply; • Increased of heatwaves is leading to a greater risk of injury, disease and death; and • Damage to buildings and infrastructure due to heat stress and reduced moisture in the soil.
Alternative Funding Approaches Alternative funding approaches have been supported through State Government Policy which assists Local Governments in having the financial capacity to provide community infrastructure to meet current and future community needs. Alternative funding approaches which can be utilised by local governments for the provision of community infrastructure include:
• Developer Contributions; • Department of Education and Local Government Shared Use Facilities; and • Public Private Partnerships. • Integrating revenue generating commercial and non-commercial activities into community
buildings where appropriate
Source data: - Community Trends and Drivers • Department of Sport and Recreation, 2016. Strategic Directions from the Western Australian Sport and Recreation Industry 2016-2020 • CSIRO, 2013. The Future of Australian Sport: Megatrends Shaping the Sports Sector Over Coming Decades • VicHealth, 2016. Evidence Summary Physical Activity and Sedentary Behaviour • Australian Bureau of Statistics, 2013. Participation in Selected Sports and Physical Recreation Activities • Australian Bureau of Statistics, 2013.Perpectives on Sport • Australian Bureau of Statistics, 2013. Australian Health Survey • Australian Bureau of Statistics, 2013. Children’s Participation in Cultural and Leisure Activities • Australian Bureau of Statistics, 2015. Participation in Selected Cultural Activities 2013/2014 • Australian Bureau of Statistics, 2015. Attendance at Selected Cultural Venues and Events 2013/2014 • Australian Library and Information Association, 2010. National Vision and Framework 2010-2015 • Australian Bureau of Statistics, 2012. Children’s Participation in Cultural and Leisure Activities • Australian Bureau of Statistics, 2013. Arts and Culture: State and Territory Profiles • City of Armadale 2018, City User Groups – Sporting, Community and Commercial Users of City Owned and Non-City Assets • City of Armadale 2017, Leased Facility and Regular Hirers Usage • City of Armadale 2016, Library Strategic and Development Plan Review and Update • Department of Prime Minister and Cabinet, 2016. Smart Cities Plan. • City of Adelaide, 2018. What is a Smart City? • Foster, Hooper, Knuiman, Bull and Giles-Corti, 2016. Are liveable neighbourhoods safer neighbourhoods? Testing the rhetoric on new urbanism and safety from crime in
Perth, WA • Hooper, Boruff, Beesley, Badland and Giles-Corti, 2018. Testing spatial measures of public open space planning standards with walking and physical activity health
outcomes: Findings from the Australian national livability study. • Department of Environment and Energy, 2018. Climate Change Impacts in Australia.
25 Draft - Community Infrastructure Plan 2020 - 2036
Need/Demand Indicators Assumptions The following assumptions underpin the CIP:
• Population data is based upon data compiled by profile.id using Australian Bureau of Statistics, Census of Population and Housing 2011 and 2016;
• Population projections are based on id. Forecast 2036 data which provides a medium term outlook.
Future revisions of the CIP will utilise forecasts beyond 2036 as appropriate. Continued monitoring and review of the CIP is important to ensure that the provision levels and desired outcomes remain relevant for the City’s community. The CIP should take into account the most current census data to enable accurate forecasting.
Thresholds for Provision Thresholds inform when community infrastructure should be delivered. This is important to ensure that residents in new growth areas have access to community facilities in the early stages of development, when they are needed most. The timing for whole or part construction should be based on the following broad thresholds:
• When 30 per cent of the forecast lots have been created in the catchment, local and neighbourhood level facilities will, at a minimum, be in the design phase; and
• When 50 per cent of the forecast lots have been created in the catchment, district facilities will, at a minimum, be in the design phase.
• In the instance where growth far exceeds forecasts in new development areas where there is no existing community infrastructure, the development of core community infrastructure such as community centres/sports pavilions and sports playing fields should be prioritised. It is important that new communities in isolated development areas have access to community infrastructure to assist in develop a sense of belonging and community cohesion. In some cases, facilities may be built in two stages; the first to serve the local catchment, and the second to serve the wider catchment.
Benchmarks and criteria The provision of community infrastructure as set out in the next section of the CIP aligns with sector based benchmarking, research into good practice and alignment with relevant state government policy. In particular, the following source documents have been used;
• Liveable Neighbourhoods (WAPC, 2015); • Classification Framework for Public Open Space (Department of Sport and Recreation,
2012); • Benchmarks for Community Infrastructure (Parks and Leisure Australia, 2012); • Community Infrastructure Plan (City of Armadale2013).
In addition, the benchmarks and criteria have been compared with those utilised by the following local governments:
• City of Kwinana;
26 Draft - Community Infrastructure Plan 2020 - 2036
• City of Rockingham; • City of Swan.
Non City of Armadale Community Infrastructure Organisations other that the City also provide facilities to encourage community participation and for the delivery of some community services. These organisations include churches, family centres, schools and other non-government agencies. In determining the City’s provision of facilities, consideration is given to any non-City facilities to complement existing provision and avoid duplication.
Inclusion of projects in the CIP All projects included in the CIP have been considered and endorsed by Council. The schedules in the following section of the CIP indicate relevant council decisions relating to CIP projects. Where gaps in facility provision have been identified, Council considers the implications of provision and options available to the City and makes determinations about potential inclusion of new facilities or major redevelopment of older facilities in the CIP. It is important to note that the guiding principles, benchmarks and criteria referred to in the CIP are a guide to assist with Council’s decision making process. From time to time there will be localised conditions or other strategic reasons for deviating from a general standard level of provision.
Armadale Regional Recreation Reserve A site of approximately 40ha has been identified in the Wungong Urban development area for the purpose of a recreation reserve. The reserve is envisaged to serve the dual functions of;
• Assisting in meeting the demand for sporting infrastructure generated by the Wungong Urban development.
• Providing regional level facilities for a range of sports and activities to serve a catchment within and beyond the City’s boundaries.
This first function relates to the ‘Wungong District Playing Fields’ project included in the South West Community Infrastructure Catchment Area schedule as shown on page 33 of this document. This project is for four playing fields and two sporting pavilions and is an integral part of the Wungong Urban development which includes the suburbs of Haynes, Hilbert and parts of Wungong. Funding for this project is anticipated through the Wungong Urban Development Contribution scheme. However, the level and availability of funding has yet to be determined and will only be known once the current review of the Wungong Urban Development Contribution Scheme and the current review of State Planning Policy 3.6 – Development Contributions for Infrastructure, have been completed. The district component of the 4 playing fields makes up approximately 30% of the overall ARRR site. The greater regional function will serve an area beyond the City’s boundaries and is envisaged to contain facilities for a wide range of sporting and leisure activities. This project is currently unfunded and is included in the City’s Advocacy Strategy for the purpose of identifying potential

27 Draft - Community Infrastructure Plan 2020 - 2036
funding and operational partners. It is likely that a project of the scale of the Armadale Regional Recreation Reserve will be delivered in stages as demand for facilities grows and as funding becomes available.
28 Community Infrastructure Plan 2020 - 2036
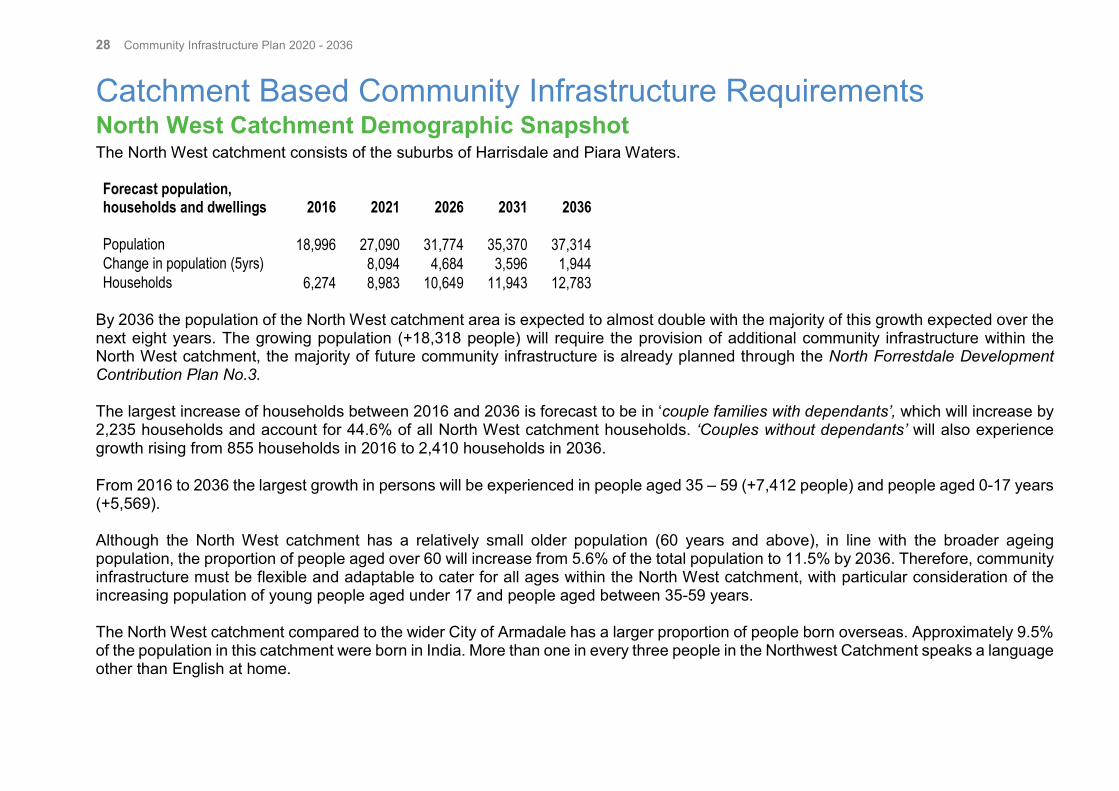
Catchment Based Community Infrastructure Requirements North West Catchment Demographic Snapshot The North West catchment consists of the suburbs of Harrisdale and Piara Waters. Forecast population, households and dwellings
2016 2021 2026 2031 2036
Population 18,996 27,090 31,774 35,370 37,314 Change in population (5yrs) 8,094 4,684 3,596 1,944 Households 6,274 8,983 10,649 11,943 12,783
By 2036 the population of the North West catchment area is expected to almost double with the majority of this growth expected over the next eight years. The growing population (+18,318 people) will require the provision of additional community infrastructure within the North West catchment, the majority of future community infrastructure is already planned through the North Forrestdale Development Contribution Plan No.3. The largest increase of households between 2016 and 2036 is forecast to be in ‘couple families with dependants’, which will increase by 2,235 households and account for 44.6% of all North West catchment households. ‘Couples without dependants’ will also experience growth rising from 855 households in 2016 to 2,410 households in 2036. From 2016 to 2036 the largest growth in persons will be experienced in people aged 35 – 59 (+7,412 people) and people aged 0-17 years (+5,569). Although the North West catchment has a relatively small older population (60 years and above), in line with the broader ageing population, the proportion of people aged over 60 will increase from 5.6% of the total population to 11.5% by 2036. Therefore, community infrastructure must be flexible and adaptable to cater for all ages within the North West catchment, with particular consideration of the increasing population of young people aged under 17 and people aged between 35-59 years. The North West catchment compared to the wider City of Armadale has a larger proportion of people born overseas. Approximately 9.5% of the population in this catchment were born in India. More than one in every three people in the Northwest Catchment speaks a language other than English at home.

29 Draft - Community Infrastructure Plan 2020 - 2036
North West Catchment Map
30 Draft - Community Infrastructure Plan 2020 - 2036
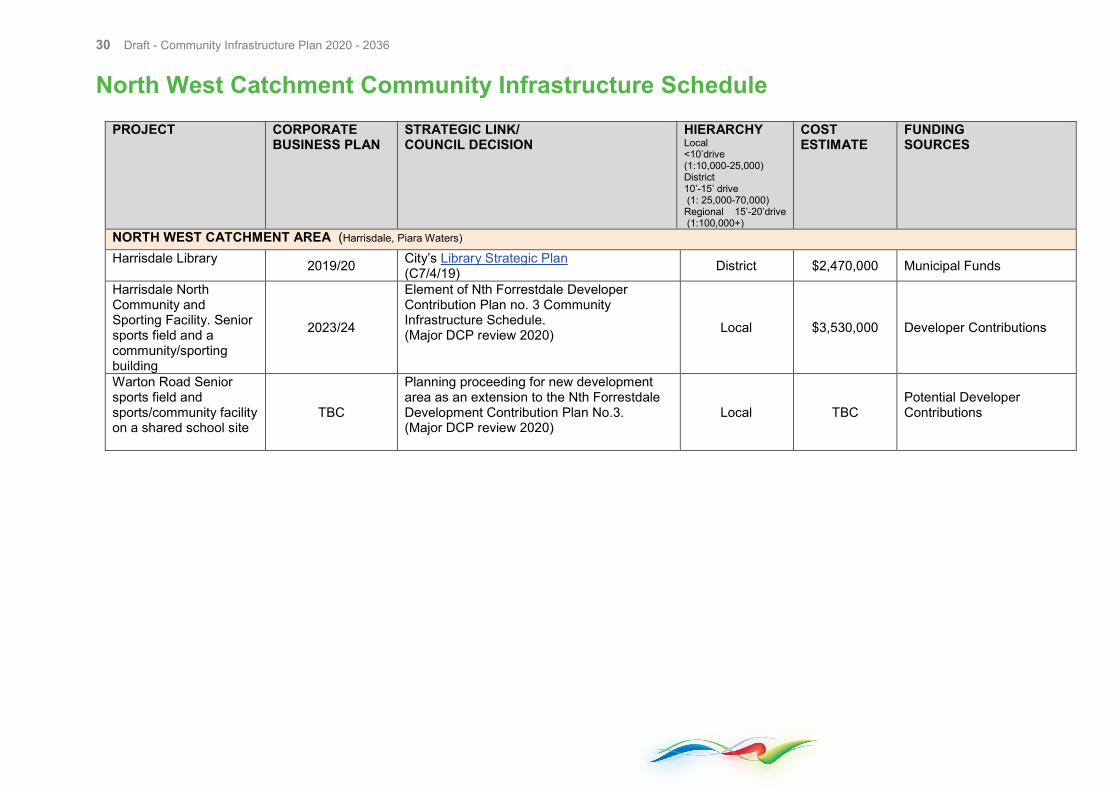
North West Catchment Community Infrastructure Schedule
PROJECT CORPORATE BUSINESS PLAN
STRATEGIC LINK/ COUNCIL DECISION
HIERARCHY Local <10’drive (1:10,000-25,000) District 10’-15’ drive (1: 25,000-70,000) Regional 15’-20’drive (1:100,000+)
COST ESTIMATE
FUNDING SOURCES
NORTH WEST CATCHMENT AREA (Harrisdale, Piara Waters) Harrisdale Library 2019/20 City’s Library Strategic Plan
(C7/4/19) District $2,470,000 Municipal Funds
Harrisdale North Community and Sporting Facility. Senior sports field and a community/sporting building
2023/24
Element of Nth Forrestdale Developer Contribution Plan no. 3 Community Infrastructure Schedule. (Major DCP review 2020) Local $3,530,000 Developer Contributions
Warton Road Senior sports field and sports/community facility on a shared school site
TBC
Planning proceeding for new development area as an extension to the Nth Forrestdale Development Contribution Plan No.3. (Major DCP review 2020)
Local TBC Potential Developer Contributions
31 Community Infrastructure Plan 2020 - 2036
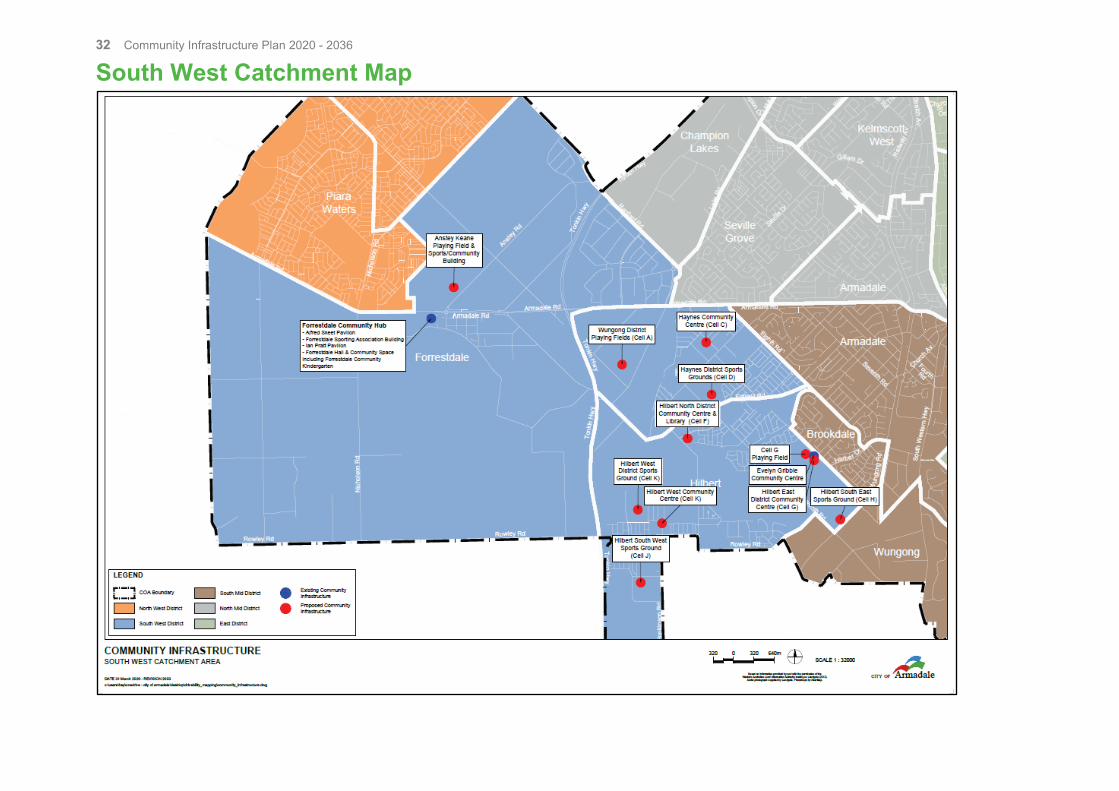
South West Catchment Demographic Snapshot The South West catchment consists of the suburbs of Forrestdale, Haynes and Hilbert.
Forecast population, households and dwellings 2016 2021 2026 2031 2036
Population 3,472 8,289 15,465 22,697 34,474* Change in population (5yrs) 4,817 7,176 7,232 7,409 Households 1,217 2,851 5,225 7,559 10,011
*An additional population of 4,368 people is expected to reside within the Anstey Keane Precinct which is currently progressing through land use planning. Due to the nature of this proposal the forecast population is known (and included in the above 2036 total population figure) but no detailed demographic data is known. The growing population (+31,002 people) will require the provision of additional community infrastructure within the South West catchment area. The majority of future community infrastructure will be provided through the Wungong Urban Area Development Contribution Plan. The proportion of household types is expected to remain similar within the South West catchment area from 2016 to 2036. The catchment has a range of household types and therefore community infrastructure should be diverse and flexible. Similarly to the North West catchment, the high amount of family households, coupled with smaller lot sizes within the South West catchment will drive demand for access to community infrastructure particularly for children and family activities. In 2016 the dominant age group within the South West catchment was people aged 35-59 (32.5% of total population), this will remain consistent through to 2036 where the 35-59 year age group will comprise 31.8% of the population. Against the trend of an ageing population, the proportion of people aged over 60 will decrease within the South West catchment from 2016 (11%) to 2036 (8%). The South West catchment compared to the wider City of Armadale has a smaller proportion of people born overseas, however this proportion is increasing. Community infrastructure must cater for the South West catchment’s growing diverse community and cater for all proportions of the population. When planning community infrastructure traditional activities and sports as well as those which are undertaken by these new emerging communities must be considered. This will provide opportunities for the South West community to engage in safe and welcoming activities which the whole community can participate in. The South West catchment, although having a higher average income than the wider City area, comprises 45% households earning low-medium (lowest) incomes per week (less than $1,582 per week). A large proportion of the community will rely on accessible community infrastructure to participate in physical and social activities.
32 Community Infrastructure Plan 2020 - 2036
South West Catchment Map
33 Community Infrastructure Plan 2020 - 2036
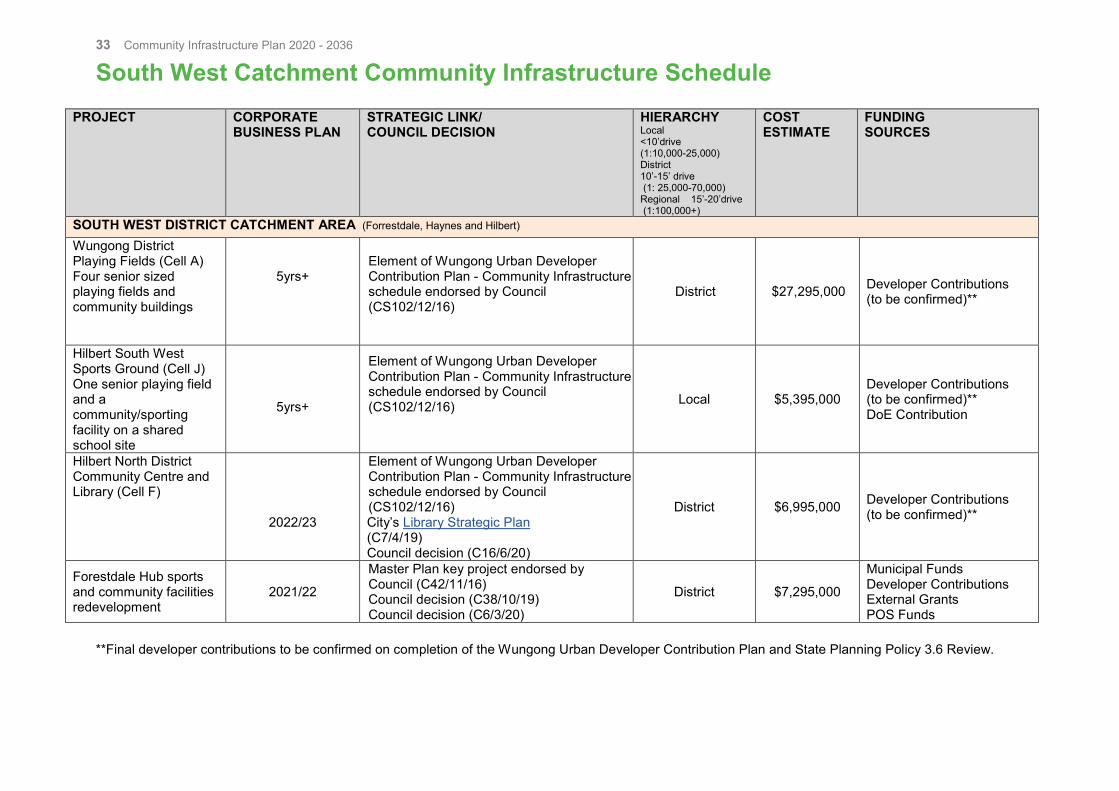
South West Catchment Community Infrastructure Schedule
PROJECT CORPORATE BUSINESS PLAN
STRATEGIC LINK/ COUNCIL DECISION
HIERARCHY Local <10’drive (1:10,000-25,000) District 10’-15’ drive (1: 25,000-70,000) Regional 15’-20’drive (1:100,000+)
COST ESTIMATE
FUNDING SOURCES
SOUTH WEST DISTRICT CATCHMENT AREA (Forrestdale, Haynes and Hilbert) Wungong District Playing Fields (Cell A) Four senior sized playing fields and community buildings
5yrs+ Element of Wungong Urban Developer Contribution Plan - Community Infrastructure schedule endorsed by Council (CS102/12/16)
District $27,295,000 Developer Contributions (to be confirmed)**
Hilbert South West Sports Ground (Cell J) One senior playing field and a community/sporting facility on a shared school site
5yrs+
Element of Wungong Urban Developer Contribution Plan - Community Infrastructure schedule endorsed by Council (CS102/12/16)
Local $5,395,000 Developer Contributions (to be confirmed)** DoE Contribution
Hilbert North District Community Centre and Library (Cell F)
2022/23
Element of Wungong Urban Developer Contribution Plan - Community Infrastructure schedule endorsed by Council (CS102/12/16) City’s Library Strategic Plan (C7/4/19) Council decision (C16/6/20)
District $6,995,000 Developer Contributions (to be confirmed)**
Forestdale Hub sports and community facilities redevelopment
2021/22
Master Plan key project endorsed by Council (C42/11/16) Council decision (C38/10/19) Council decision (C6/3/20)
District $7,295,000
Municipal Funds Developer Contributions External Grants POS Funds
**Final developer contributions to be confirmed on completion of the Wungong Urban Developer Contribution Plan and State Planning Policy 3.6 Review.
34 Draft - Community Infrastructure Plan 2020 - 2036
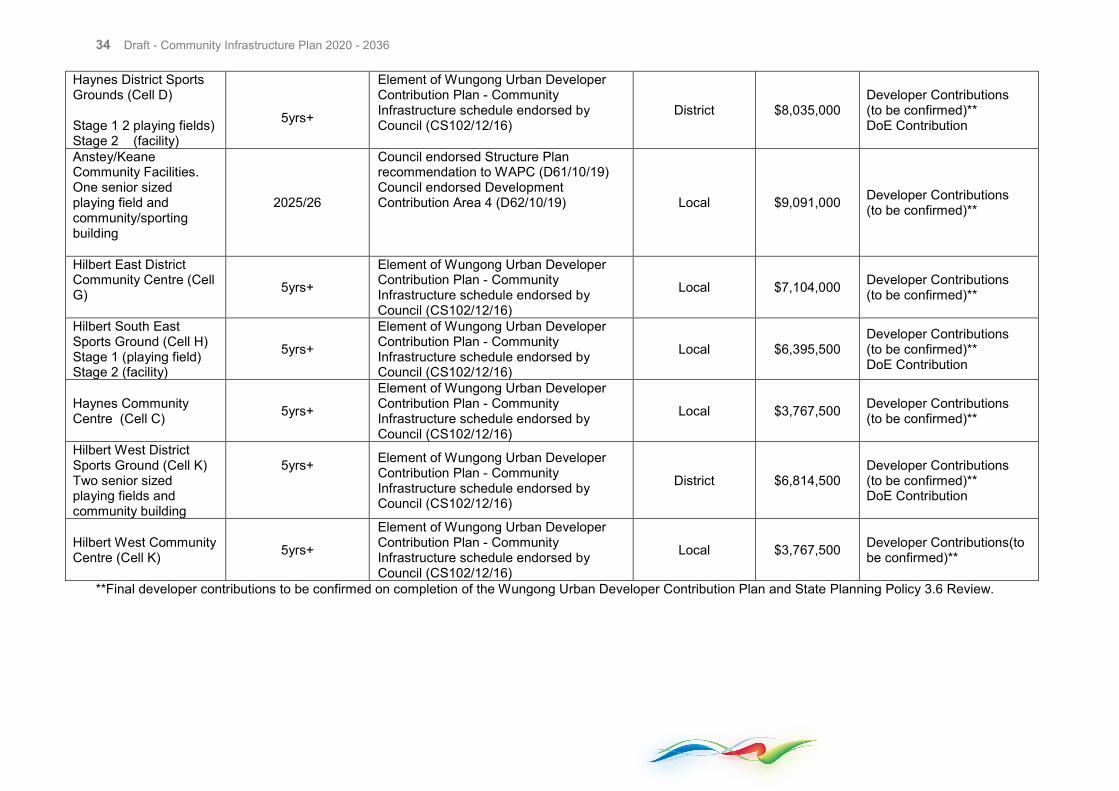
Haynes District Sports Grounds (Cell D) Stage 1 2 playing fields) Stage 2 (facility)
5yrs+
Element of Wungong Urban Developer Contribution Plan - Community Infrastructure schedule endorsed by Council (CS102/12/16)
District $8,035,000 Developer Contributions (to be confirmed)** DoE Contribution
Anstey/Keane Community Facilities. One senior sized playing field and community/sporting building
2025/26
Council endorsed Structure Plan recommendation to WAPC (D61/10/19) Council endorsed Development Contribution Area 4 (D62/10/19) Local $9,091,000 Developer Contributions
(to be confirmed)**
Hilbert East District Community Centre (Cell G)
5yrs+
Element of Wungong Urban Developer Contribution Plan - Community Infrastructure schedule endorsed by Council (CS102/12/16)
Local $7,104,000 Developer Contributions (to be confirmed)**
Hilbert South East Sports Ground (Cell H) Stage 1 (playing field) Stage 2 (facility)
5yrs+
Element of Wungong Urban Developer Contribution Plan - Community Infrastructure schedule endorsed by Council (CS102/12/16)
Local $6,395,500 Developer Contributions (to be confirmed)** DoE Contribution
Haynes Community Centre (Cell C) 5yrs+
Element of Wungong Urban Developer Contribution Plan - Community Infrastructure schedule endorsed by Council (CS102/12/16)
Local $3,767,500 Developer Contributions (to be confirmed)**
Hilbert West District Sports Ground (Cell K) Two senior sized playing fields and community building
5yrs+ Element of Wungong Urban Developer
Contribution Plan - Community Infrastructure schedule endorsed by Council (CS102/12/16)
District $6,814,500 Developer Contributions (to be confirmed)** DoE Contribution
Hilbert West Community Centre (Cell K) 5yrs+
Element of Wungong Urban Developer Contribution Plan - Community Infrastructure schedule endorsed by Council (CS102/12/16)
Local $3,767,500 Developer Contributions(to be confirmed)**
**Final developer contributions to be confirmed on completion of the Wungong Urban Developer Contribution Plan and State Planning Policy 3.6 Review.
35 Community Infrastructure Plan 2020 - 2036
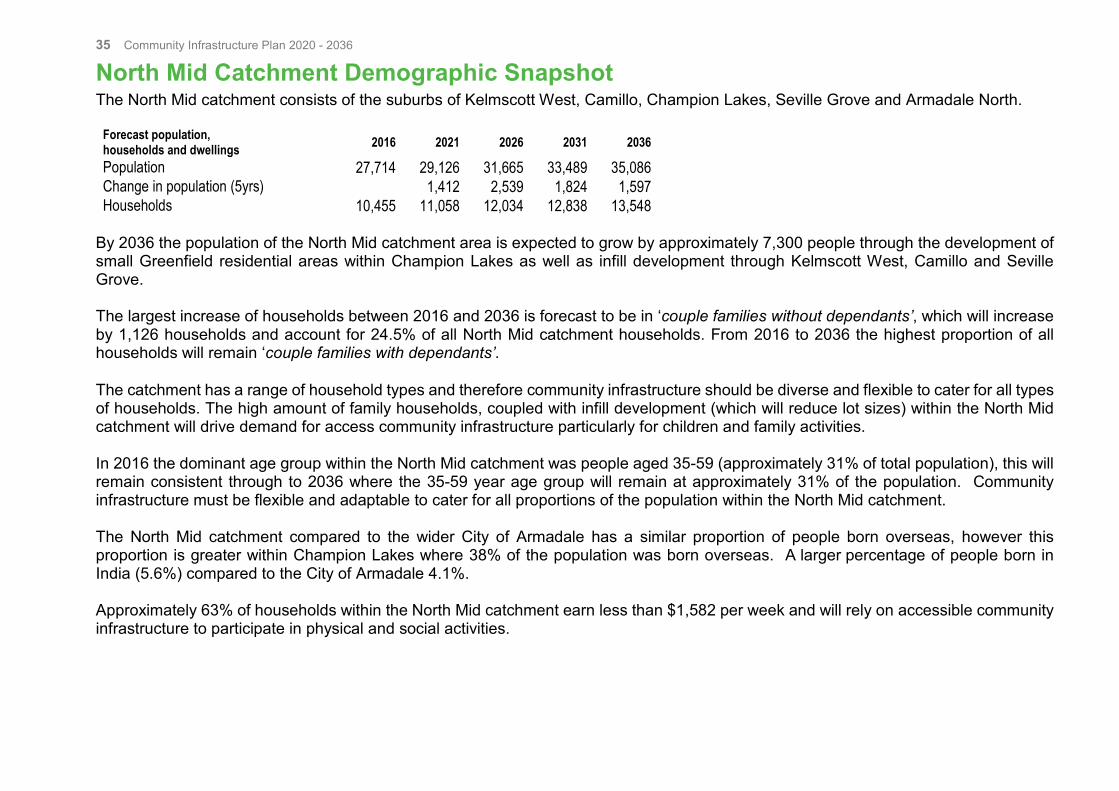
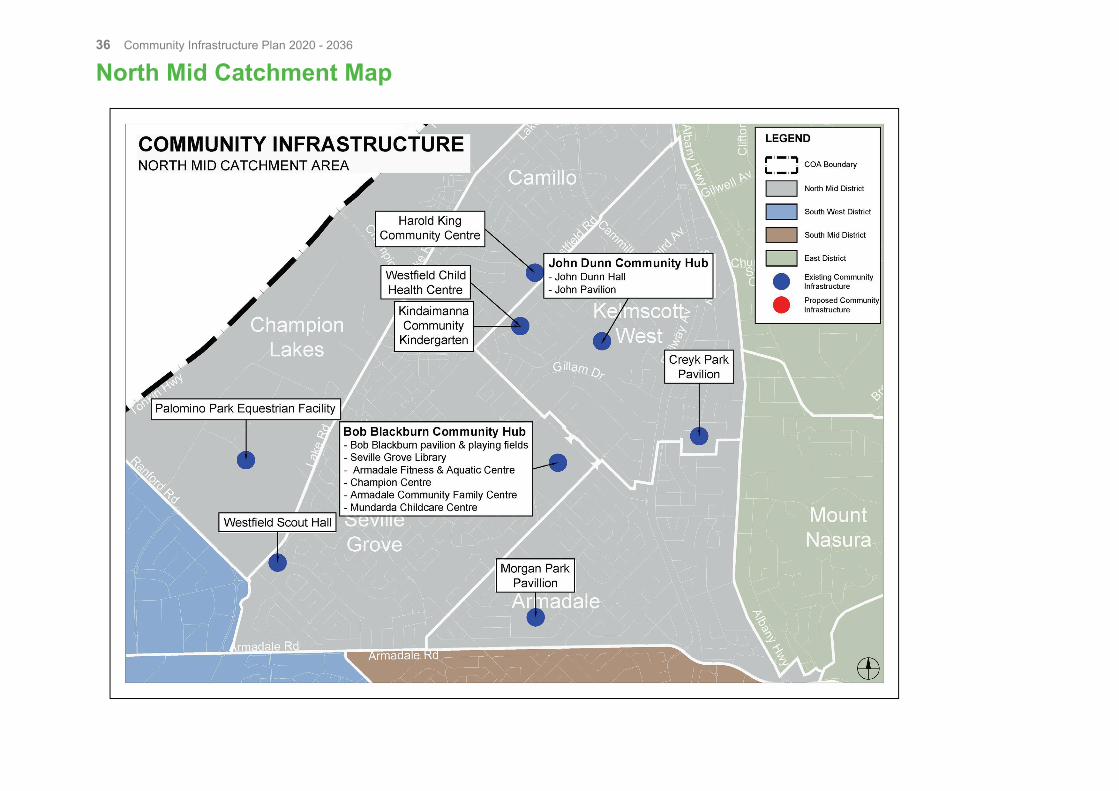
North Mid Catchment Demographic Snapshot The North Mid catchment consists of the suburbs of Kelmscott West, Camillo, Champion Lakes, Seville Grove and Armadale North.
Forecast population, households and dwellings 2016 2021 2026 2031 2036
Population 27,714 29,126 31,665 33,489 35,086 Change in population (5yrs) 1,412 2,539 1,824 1,597 Households 10,455 11,058 12,034 12,838 13,548
By 2036 the population of the North Mid catchment area is expected to grow by approximately 7,300 people through the development of small Greenfield residential areas within Champion Lakes as well as infill development through Kelmscott West, Camillo and Seville Grove. The largest increase of households between 2016 and 2036 is forecast to be in ‘couple families without dependants’, which will increase by 1,126 households and account for 24.5% of all North Mid catchment households. From 2016 to 2036 the highest proportion of all households will remain ‘couple families with dependants’. The catchment has a range of household types and therefore community infrastructure should be diverse and flexible to cater for all types of households. The high amount of family households, coupled with infill development (which will reduce lot sizes) within the North Mid catchment will drive demand for access community infrastructure particularly for children and family activities. In 2016 the dominant age group within the North Mid catchment was people aged 35-59 (approximately 31% of total population), this will remain consistent through to 2036 where the 35-59 year age group will remain at approximately 31% of the population. Community infrastructure must be flexible and adaptable to cater for all proportions of the population within the North Mid catchment. The North Mid catchment compared to the wider City of Armadale has a similar proportion of people born overseas, however this proportion is greater within Champion Lakes where 38% of the population was born overseas. A larger percentage of people born in India (5.6%) compared to the City of Armadale 4.1%. Approximately 63% of households within the North Mid catchment earn less than $1,582 per week and will rely on accessible community infrastructure to participate in physical and social activities.
36 Community Infrastructure Plan 2020 - 2036
North Mid Catchment Map
37 Draft - Community Infrastructure Plan 2020 - 2036
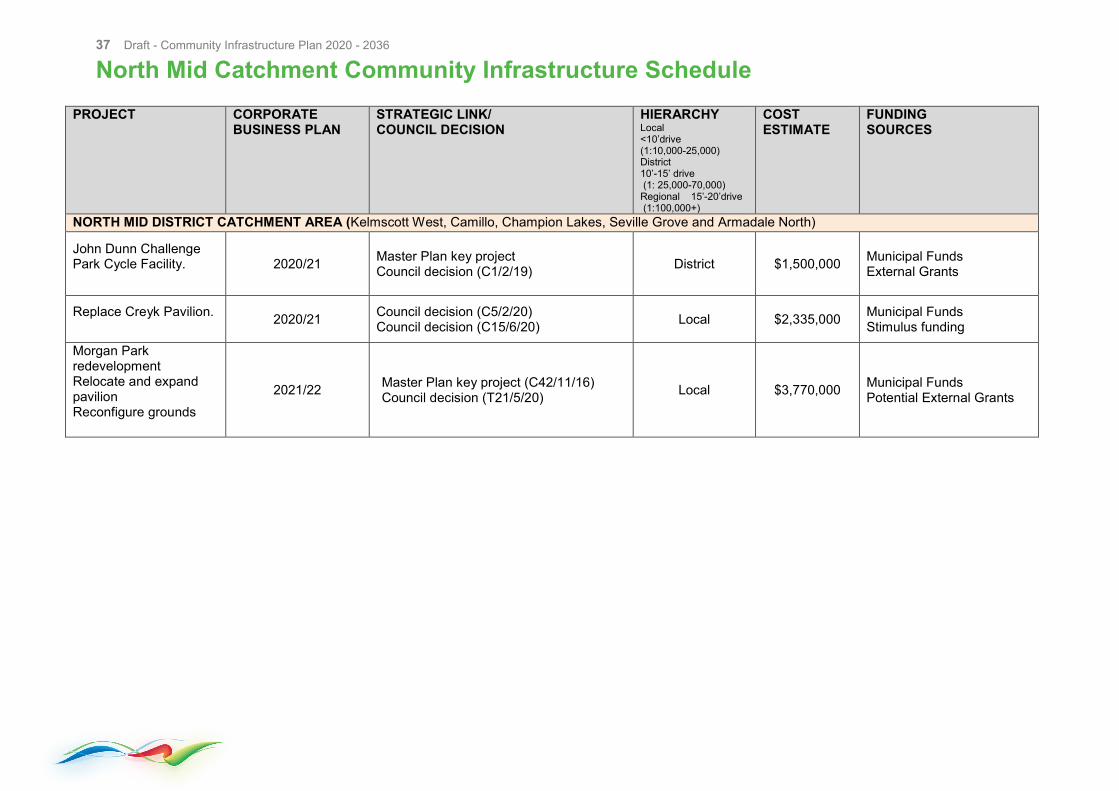
North Mid Catchment Community Infrastructure Schedule
PROJECT CORPORATE BUSINESS PLAN
STRATEGIC LINK/ COUNCIL DECISION
HIERARCHY Local <10’drive (1:10,000-25,000) District 10’-15’ drive (1: 25,000-70,000) Regional 15’-20’drive (1:100,000+)
COST ESTIMATE
FUNDING SOURCES
NORTH MID DISTRICT CATCHMENT AREA (Kelmscott West, Camillo, Champion Lakes, Seville Grove and Armadale North)
John Dunn Challenge Park Cycle Facility.
2020/21 Master Plan key project Council decision (C1/2/19) District $1,500,000 Municipal Funds
External Grants
Replace Creyk Pavilion. 2020/21 Council decision (C5/2/20)
Council decision (C15/6/20) Local $2,335,000 Municipal Funds Stimulus funding
Morgan Park redevelopment Relocate and expand pavilion Reconfigure grounds
2021/22 Master Plan key project (C42/11/16) Council decision (T21/5/20) Local $3,770,000 Municipal Funds
Potential External Grants
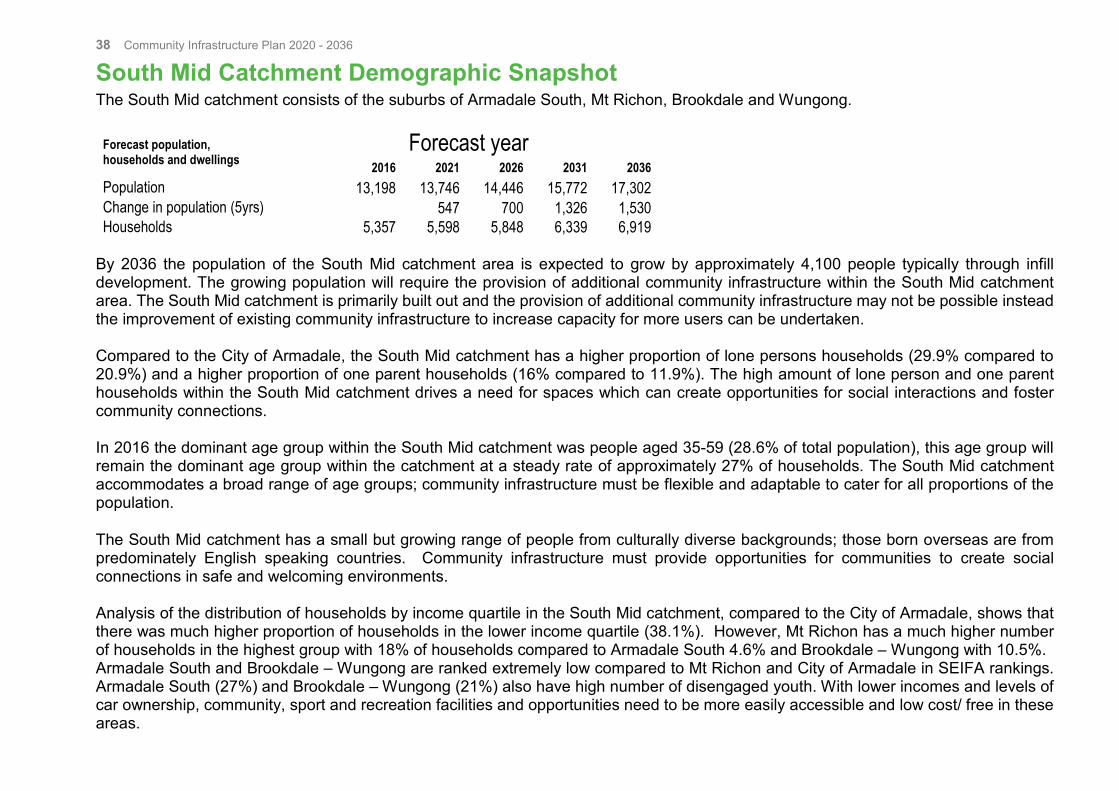
38 Community Infrastructure Plan 2020 - 2036
South Mid Catchment Demographic Snapshot The South Mid catchment consists of the suburbs of Armadale South, Mt Richon, Brookdale and Wungong.
Forecast population, households and dwellings
Forecast year 2016 2021 2026 2031 2036
Population 13,198 13,746 14,446 15,772 17,302 Change in population (5yrs) 547 700 1,326 1,530 Households 5,357 5,598 5,848 6,339 6,919
By 2036 the population of the South Mid catchment area is expected to grow by approximately 4,100 people typically through infill development. The growing population will require the provision of additional community infrastructure within the South Mid catchment area. The South Mid catchment is primarily built out and the provision of additional community infrastructure may not be possible instead the improvement of existing community infrastructure to increase capacity for more users can be undertaken. Compared to the City of Armadale, the South Mid catchment has a higher proportion of lone persons households (29.9% compared to 20.9%) and a higher proportion of one parent households (16% compared to 11.9%). The high amount of lone person and one parent households within the South Mid catchment drives a need for spaces which can create opportunities for social interactions and foster community connections. In 2016 the dominant age group within the South Mid catchment was people aged 35-59 (28.6% of total population), this age group will remain the dominant age group within the catchment at a steady rate of approximately 27% of households. The South Mid catchment accommodates a broad range of age groups; community infrastructure must be flexible and adaptable to cater for all proportions of the population. The South Mid catchment has a small but growing range of people from culturally diverse backgrounds; those born overseas are from predominately English speaking countries. Community infrastructure must provide opportunities for communities to create social connections in safe and welcoming environments. Analysis of the distribution of households by income quartile in the South Mid catchment, compared to the City of Armadale, shows that there was much higher proportion of households in the lower income quartile (38.1%). However, Mt Richon has a much higher number of households in the highest group with 18% of households compared to Armadale South 4.6% and Brookdale – Wungong with 10.5%. Armadale South and Brookdale – Wungong are ranked extremely low compared to Mt Richon and City of Armadale in SEIFA rankings. Armadale South (27%) and Brookdale – Wungong (21%) also have high number of disengaged youth. With lower incomes and levels of car ownership, community, sport and recreation facilities and opportunities need to be more easily accessible and low cost/ free in these areas.
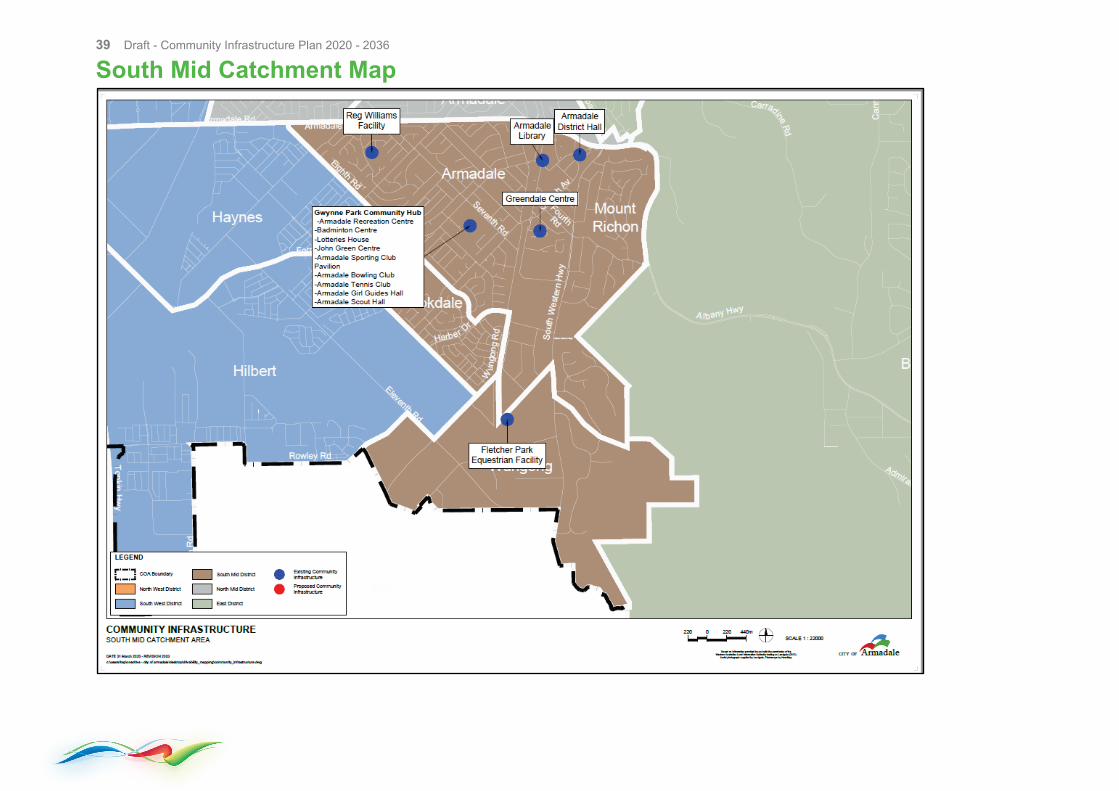
39 Draft - Community Infrastructure Plan 2020 - 2036
South Mid Catchment Map
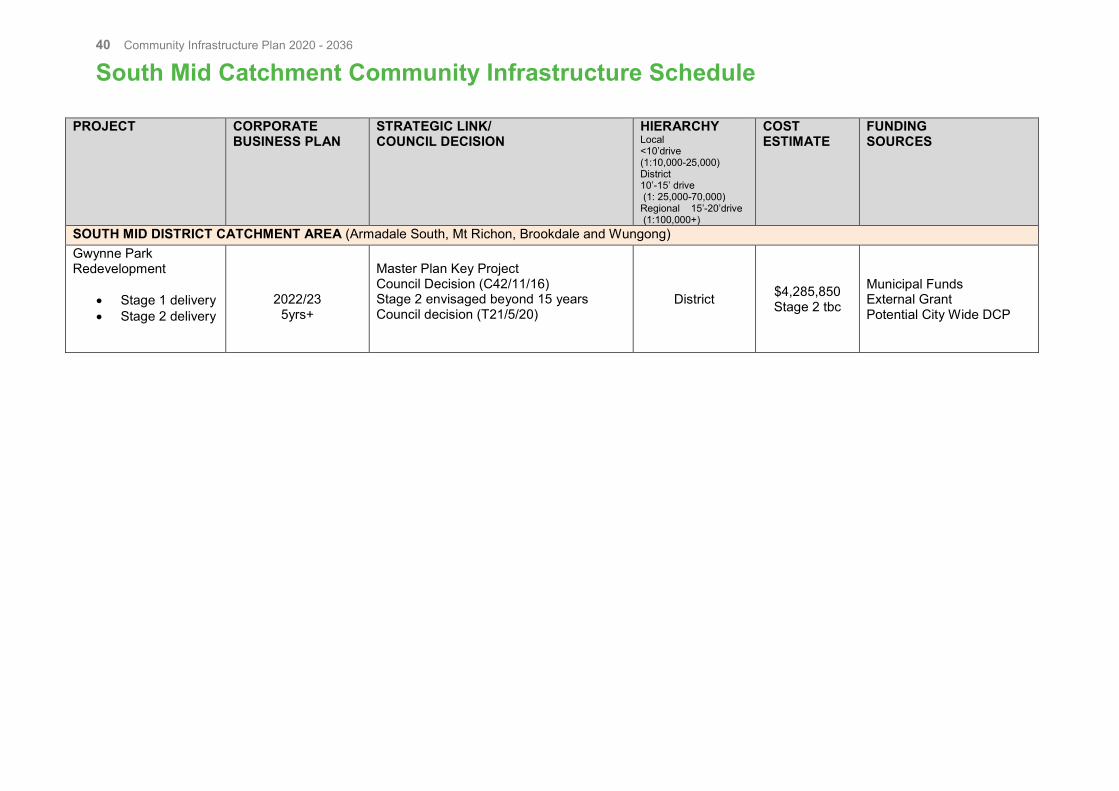
40 Community Infrastructure Plan 2020 - 2036
South Mid Catchment Community Infrastructure Schedule
PROJECT CORPORATE BUSINESS PLAN
STRATEGIC LINK/ COUNCIL DECISION
HIERARCHY Local <10’drive (1:10,000-25,000) District 10’-15’ drive (1: 25,000-70,000) Regional 15’-20’drive (1:100,000+)
COST ESTIMATE
FUNDING SOURCES
SOUTH MID DISTRICT CATCHMENT AREA (Armadale South, Mt Richon, Brookdale and Wungong) Gwynne Park Redevelopment
• Stage 1 delivery • Stage 2 delivery
2022/23 5yrs+
Master Plan Key Project Council Decision (C42/11/16) Stage 2 envisaged beyond 15 years Council decision (T21/5/20)
District $4,285,850 Stage 2 tbc
Municipal Funds External Grant Potential City Wide DCP
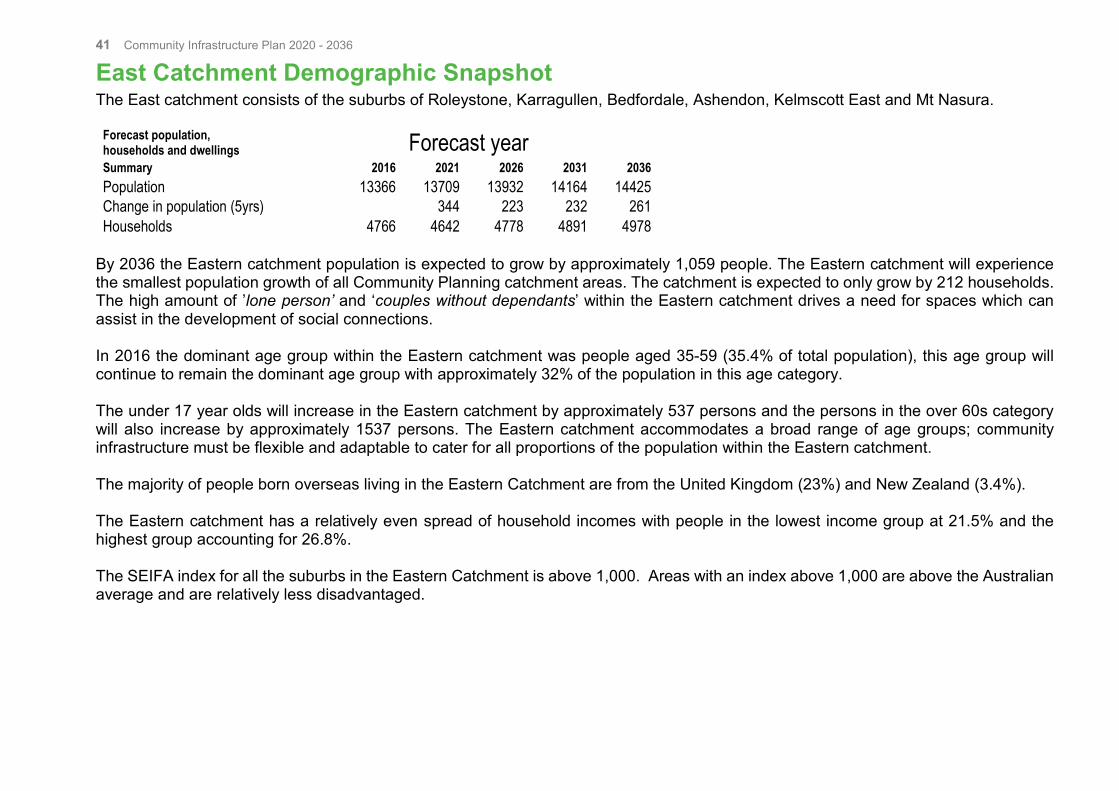
41 Community Infrastructure Plan 2020 - 2036
East Catchment Demographic Snapshot The East catchment consists of the suburbs of Roleystone, Karragullen, Bedfordale, Ashendon, Kelmscott East and Mt Nasura.
Forecast population, households and dwellings Forecast year Summary 2016 2021 2026 2031 2036 Population 13366 13709 13932 14164 14425 Change in population (5yrs) 344 223 232 261 Households 4766 4642 4778 4891 4978
By 2036 the Eastern catchment population is expected to grow by approximately 1,059 people. The Eastern catchment will experience the smallest population growth of all Community Planning catchment areas. The catchment is expected to only grow by 212 households. The high amount of ’lone person’ and ‘couples without dependants’ within the Eastern catchment drives a need for spaces which can assist in the development of social connections. In 2016 the dominant age group within the Eastern catchment was people aged 35-59 (35.4% of total population), this age group will continue to remain the dominant age group with approximately 32% of the population in this age category. The under 17 year olds will increase in the Eastern catchment by approximately 537 persons and the persons in the over 60s category will also increase by approximately 1537 persons. The Eastern catchment accommodates a broad range of age groups; community infrastructure must be flexible and adaptable to cater for all proportions of the population within the Eastern catchment. The majority of people born overseas living in the Eastern Catchment are from the United Kingdom (23%) and New Zealand (3.4%). The Eastern catchment has a relatively even spread of household incomes with people in the lowest income group at 21.5% and the highest group accounting for 26.8%. The SEIFA index for all the suburbs in the Eastern Catchment is above 1,000. Areas with an index above 1,000 are above the Australian average and are relatively less disadvantaged.
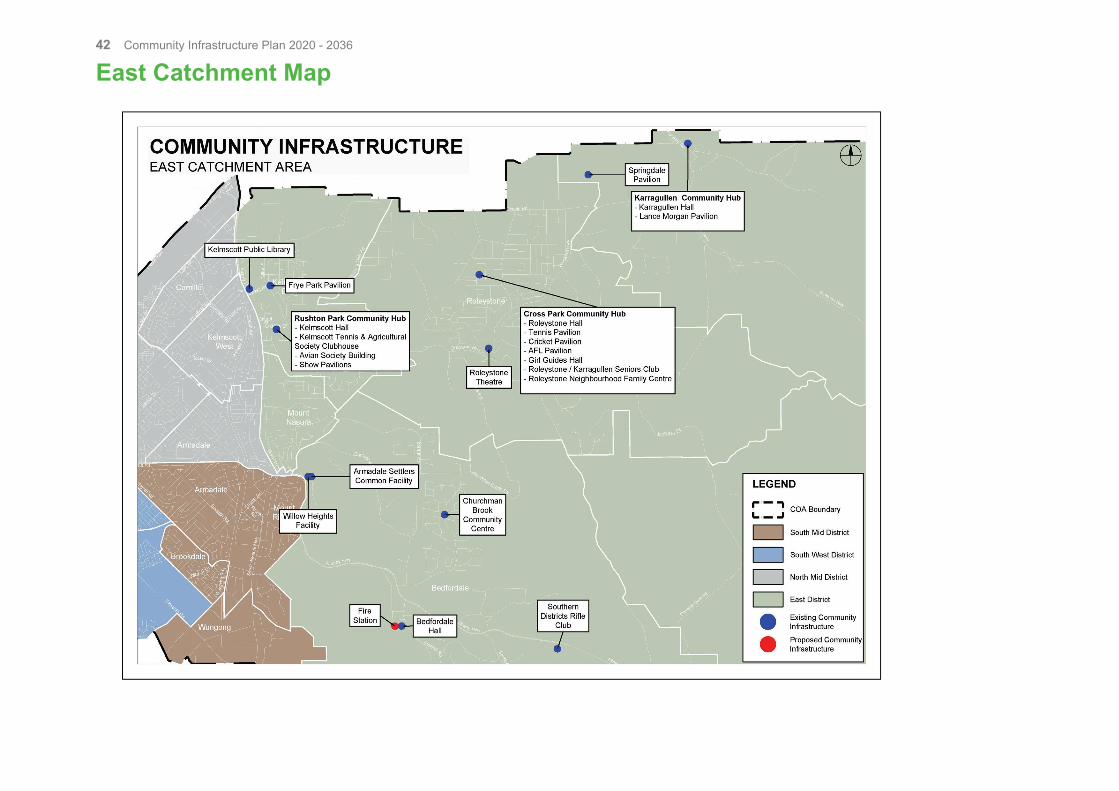
42 Community Infrastructure Plan 2020 - 2036
East Catchment Map

43 Community Infrastructure Plan 2020 - 2036
East Catchment Community Infrastructure Schedule
PROJECT CORPORATE BUSINESS PLAN
STRATEGIC LINK/ COUNCIL DECISION
HIERARCHY Local <10’drive (1:10,000-25,000) District 10’-15’ drive (1: 25,000-70,000) Regional 15’-20’drive (1:100,000+)
COST ESTIMATE
FUNDING SOURCES
EAST CATCHMENT AREA (Kelmscott East, Mt Richon, Roleystone, Karragullen and Bedfordale) Redevelopment of Roleystone Theatre
2020/21
Council Decision (C37/12/18)
District $4,000,000 Municipal Funds
Bedfordale Bushfire Brigade Station
2020/21 Council decision T20/4/20 District $1,700,000
Municipal Funds External funds
44 Community Infrastructure Plan 2020 - 2036
References and source data A Balanced View 2007, Active Sporting Reserve Needs Assessment
A Balanced View 2008, Active Sporting Reserves Feasibility Study
Armadale Redevelopment Authority 2008, Wungong Urban Master Plan Schools Policy
Asztalos et al 2009, Specific associations between types of physical activity and components of mental health
Australian Bureau of Statistics (ABS) 2008, Sport and Recreation: A Statistical Overview, Australia
Australian Bureau of Statistics (ABS) 2010, Multipurpose Household Survey
Australian Bureau of Statistics (ABS) 2016, Census of Population and Housing
Australian Bureau of Statistics (ABS) 2012, Australian Social Trends: Sport and physical recreation
Australian Bureau of Statistics (ABS) 2012, Cultural and Leisure Activities
Australian Bureau of Statistics (ABS) 2013, Children’s Participation in Sport and Leisure Time
Australian Bureau of Statistics (ABS) 2013, Sport and Physical Recreation Differentials in Participation
Australian Bureau of Statistics (ABS) 2013, Sport and Recreation: A Statistical Overview, Australia and Children’s
Participation
Australian Bureau of Statistics (ABS) 2015, Attendance at Selected Cultural Venues and Events 13-14
Australian Institute of Health and Welfare 2012, Risk factors contributing to chronic disease
Australian Sports Commission (ASC) 2010, The Exercise, Recreation and Sport Survey
CCS 2009, Peer Review of ABV Sporting Reserves Study
Charles 2008, City of Armadale Community Facilities Investigation
City of Armadale 2005, Town Planning Scheme No. 4
City of Armadale 2010, Comparative Analysis of Community Infrastructure Provision in the City of Armadale
City of Armadale 2010, Positive Ageing Strategy 2011-2014
City of Armadale 2010, Volunteer Strategy 2010-2013
City of Armadale 2010, Youth Strategy 2010-2012
City of Armadale 2011, Community Infrastructure Plan 2011-2031
City of Armadale 2014, Urban Forest Strategy
City of Armadale 2015, Disability Access and Inclusion Plan 2016-2021
City of Armadale 2015, Strategic Community Plan 2016-2031
City of Armadale 2016, Corporate Business Plan 2017-2022
City of Armadale 2016, Draft Guidelines for the Planning and Development of Sporting Spaces in the City of
Armadale
City of Armadale 2016, Library Strategic and Development Plan Review and Update 2016
City of Armadale 2016, Local Planning Strategy
City of Armadale 2016, Public Art Strategy
City of Armadale 2017, Asset Management Plan Summary Report 2017/18-2031/32
City of Armadale 2017, Community Hubs Master Planning Initiative
City of Armadale 2017, Leased Facility Usage
City of Armadale 2017, Seasonal User Data
City of Armadale 2017, Wungong Community and Shared Facilities Project – Project Brief
City of Armadale 2018, Demographic Insights

45 Draft - Community Infrastructure Plan 2020 - 2036
City of Armadale 2018, Parks Facilities Strategy
Department of Environment and Energy, 2018. Climate Change Impacts in Australia.
Department of Sport and Recreation 2012, Classification Framework for Public Open Space
Department of Sport and Recreation 2015, Public Open Space Strategy Guide for Local Governments.
Department of Sport and Recreation 2016, Strategic Directions 6
Department of Sport and Recreation 2016, Sports Dimension Guidelines for Playing Areas
Department of Sport and Recreation and the Department of Water 2014, Public Parkland Planning and Design
Guide
Department of Water 2004, Stormwater Management Manual for Western Australia
Giles-Corti, Bull , Knuiman, McCormack, Van Niel, Timperio, et a 2013, The influence of urban design on
45eighbourhood walking following residential relocation: Longitudinal results from the RESIDE study
Giles-Corti, Broomhall, Knuiman, Collins, Douglas, Ng, and Donovan 2005, Increasing walking: How important is
distance to, attractiveness, and size of public open space?
Grose 2009, Changing relationships in public open space and private open space in suburbs in south-western
Australia
Heart Foundation 2014, Healthy By Active Design Master Checklist
Izmir , Katz and Bruce 2009, Neighbourhood and Community Centres: Results for Children, Families and
Communities
Id.Consulting 2016, City of Armadale Community Atlas
Id.Consulting 2016, City of Armadale Community Profile
Id.Consulting 2016, City of Armadale Household Composition
Id.Consulting 2016, City of Armadale Income Distribution
Id.Consulting 2016, City of Armadale Place of Birth
Id.Consulting 2017, City of Armadale Average Household Size 2036
Id.Consulting 2017, City of Armadale Population Forecast
Byrnes and Associates 2016, Wungong Landscape Design Guidelines
Kaczynski, Potwarka, Saelens 2008, Association of Park Size, Distance, and Features with Physical Activity in
Neighborhood Parks
Marshall, and Corkery 2011, Generation after Generation: Why and How Do We Value Open Space?
Maruani, Tseria, and Irit Amit-Cohen 2007, Open space planning models: A review of approaches and methods
Metropolitan Redevelopment Authority 2012, Wungong Urban Water Project Public Open Space Policy
Middle, Tye, and Middle 2012, Active Open Space (playing fields) in a growing Perth-Peel: Implications of Bush
Forever, Water Sensitive Urban Design and Liveable Neighbourhoods for active sporting recreation
National Competition Council, 1997. Competitive Neutrality Reform: Issues in Implementing Clause 3 of the
Competition Principles Agreement
Parks and Leisure Australia – WA Branch 201, Benchmarks for Community Infrastructure
Parks and Leisure Australia – WA Branch 2011, Public open space planning in Western Australia: New residential
developments: Position Paper
Sugiyama, Francis, Middleton, Owen, and Giles-Corti 2010, Associations between recreational walking and
attractiveness, size, and proximity of neighbourhood open spaces
Veal 2013, Open Space Planning Standards in Australia: in Search of Origins
46 Draft - Community Infrastructure Plan 2020 - 2036
Ward Thompson 2011, Linking landscape and health: The recurring theme Western Australian Planning
Commission 1963, Metropolitan Regional Scheme
Western Australian Planning Commission 1997, Planning Bulletin 21 – Cash in Lieu of Public Open Space
Western Australian Planning Commission 2002, Development Control Policy 2.3 – Public Open Space in
Residential Areas
Western Australian Planning Commission 2005, Guideline for the Determination of Wetland Buffer Requirements
Western Australian Planning Commission 2006, Designing Out Crime Guidelines
Western Australian Planning Commission 2007, Liveable Neighbourhoods
Western Australian Planning Commission 2008, Better Urban Water Management
Western Australian Planning Commission 2008, State Planning Policy 1- State Planning Policy Framework
Western Australian Planning Commission 2008, State Planning Policy 2.9 – Water Resources
Western Australian Planning Commission 2009, State Planning Policy 3.6 Development Contributions for
Infrastructure
Western Australian Planning Commission 2010, Directions 2031 and Beyond
Western Australian Planning Commission 2010, Outer Metropolitan Perth and Peel: Sub-Regional Strategy
Western Australian Planning Commission 2010, State Planning Policy 2.8 – Bushland Policy for the Perth
Metropolitan Region and Bush Forever
Western Australian Planning Commission 2010, State Planning Policy 4.2 – Activity Centres for Perth and Peel
Western Australian Planning Commission 2011, Development Control Policy 5.3 – Use of Land Reserved for Parks
and Recreation and Regional Open Space
Western Australian Planning Commission 2013, State Planning Strategy 2050: Planning for Sustained Growth and
Prosperity
Western Australian Planning Commission 2015, Draft Liveable Neighborhoods
Western Australian Planning Commission 2015, Perth and Peel at 3.5 million
Western Australian Planning Commission 2015, Draft South Metropolitan Peel Sub-Regional
Western Australian Planning Commission 2016, Draft Perth and Peel Green Growth Plan for 3.5 million
Western Australian Planning Commission 2016, Draft Revision of State Planning Policy 3.6 – Development
Contributions for Infrastructure
Western Australian Planning Commission 2017, Draft State Planning Policy 7- Design of the Built Environment

47 Draft - Community Infrastructure Plan 2020 - 2036
This page has been intentionally left blank

48 Community Infrastructure Plan 2020 - 2036