Embed Size (px)
Citation preview
Infrastructure Needs:North Dakota’s County, Township, & Tribal
Roads & Bridges2017-2036
Draft Report Regional Meetings
Dickinson, Stanley, Mandan, Devils Lake & Valley City October 13, 14, 15, 28, 29 - 2016
Upper Great Plains Transportation InstituteNorth Dakota State University
Outline of Today’s Presentation• Introductory Remarks/general
findings• Quick History of Studies• General Changes in Study Process• Data Collection Details• Data Analysis Processes/Issues• Summation of Needs Presentation• Open Discussion
Slide 2
Introductory Remarks• This study is again an improvement over
the past studies. – Utilization of Legislative Support of Asset Management
• GRIT – Geographic Roadway Information Tool• Better pavement history Data
– Improved Unpaved Road Survey Instrument• Built with a user group• Provided Webinar based Training – Recorded
• Less interest from Legislature at this time.– In Past Studies We Reported to Budget Section First– Legislative Council OK with us going to jurisdictions with
draft and reporting later
Slide 3
General Findings• Overall Ride and Pavement Ratings are Improving• County participation in Asset Management (GRIT) has
enhanced quality of pavement history/thickness data.• Pavements are thicker based on GRIT and Final GPR
resulting in less structural failure and more overlays.• Unit costs are lower than in last study with no differential
between oil and non-oil counties• Gravel costs have had much more attention by locals• Gravel costs are up a bit (depending on how we adjust)• Paving costs are down for the 20 year period as expected
due to recent investments• Bridges are generally unchanged – up slightly• More wells are being drilled with fewer rigs
Slide 4
Quick History of Studies• 2010 study: UGPTI estimated road
investment needs for the 2011 session– 21,500 new wells & increased ag. production
• 2012 study: updated investment needs– 46,000 new wells, ag. production, & initial
bridge study• 2014 Study: more comprehensive data
– Higher roadway costs, ag. production, & 60,000 new wells
• 2016 Study: First Study with GRIT and Reduced Oil Exploration: 30, 60, & 90 Rigs
Slide 5
2016 Study Horizon• 20 year time frame• Traffic and investment needs estimated
annually• Results summarized by:
– Biennium– Region
• Detailed results by:– County– Jurisdiction
Slide 6

Feedback from Countiesand Legislators - 2015
• Interactive map was effective in communicating results
• First time many had objective pavement ratings available to them
• Study provided basis for investing in transportation infrastructure
pg. 7
Concerns from Counties and Legislators -2015
• Pavement condition scores may not reflect age of lower layers of pavement– More accurate shoulder width and pavement
thickness• Counties not uniformly reporting gravel costs• No costs for minor structures• Some counties unaware of data requests
pg. 8
2015-17 Study Priorities• Emphasis on uniformity of gravel costing submissions
(revised survey instrument)• Additional improvements to county pavement
condition data• Continued improvement to traffic data and
forecasting• Updated costing and modeling concepts• Capture more accurate data history from counties –
asset inventory too• Continued emphasis on maintaining system – not
providing for major upgrades
pg. 9
General Changes in Study Process• Finished county paved FWD/GPR
coverage for majority of paved roads• Obtained age, width and project data
from many counties through GRIT.• Enhanced unpaved roads survey with
revised survey and extensive training• Traffic Model Sensitivity Process
– 30, 60 and 90 rig traffic models– 20 to 22 wells per rig per year
Slide 10
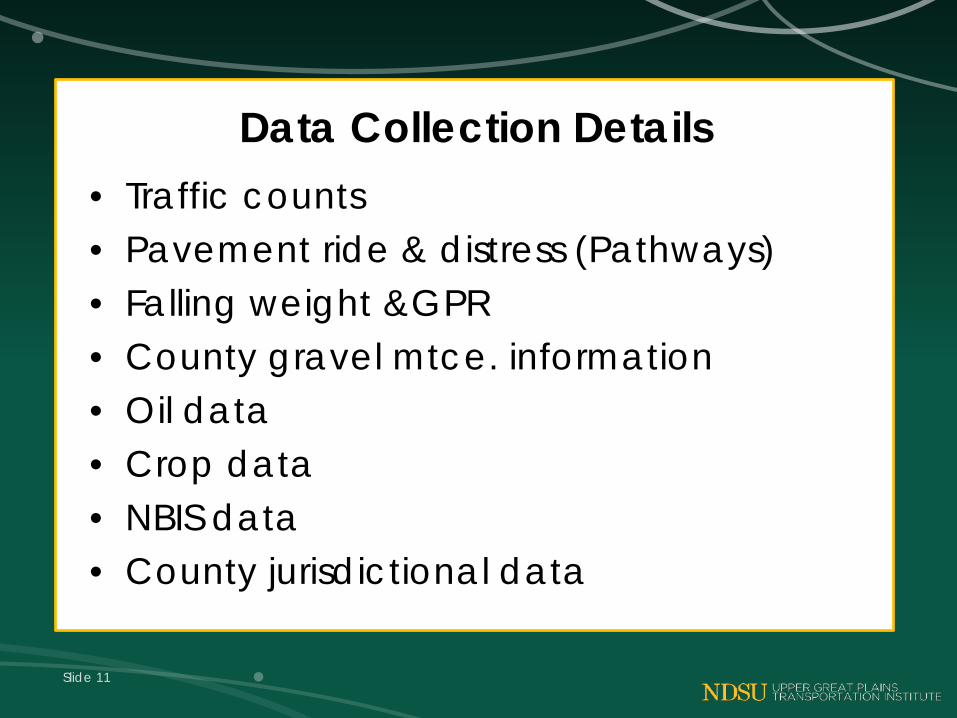
Data Collection Details• Traffic counts• Pavement ride & distress (Pathways)• Falling weight &GPR• County gravel mtce. information• Oil data• Crop data• NBIS data• County jurisdictional data
Slide 11
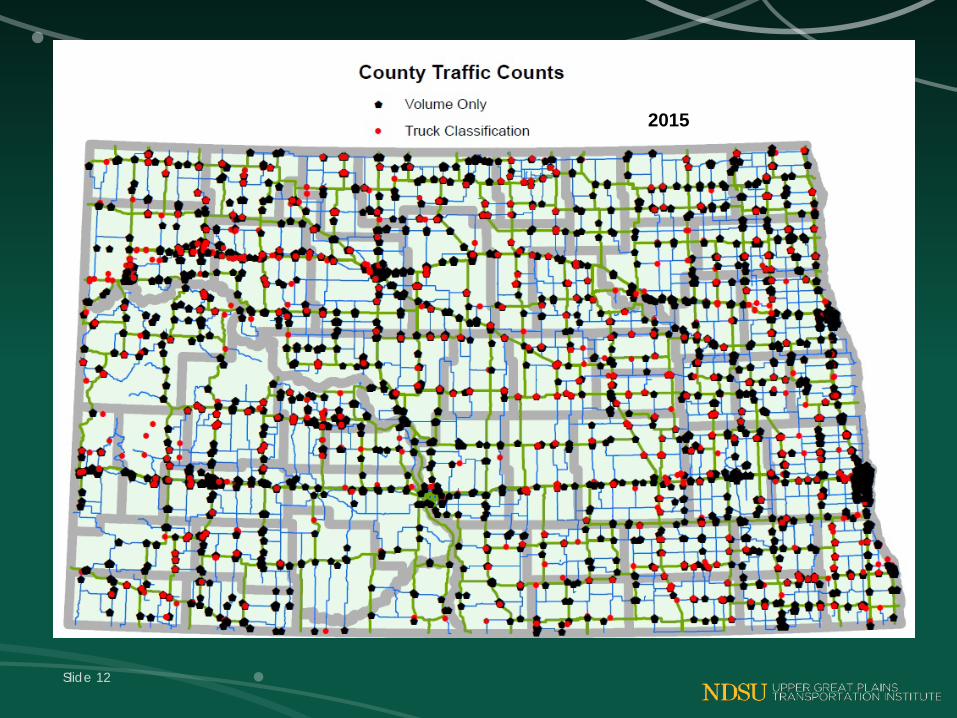
2015
Slide 12
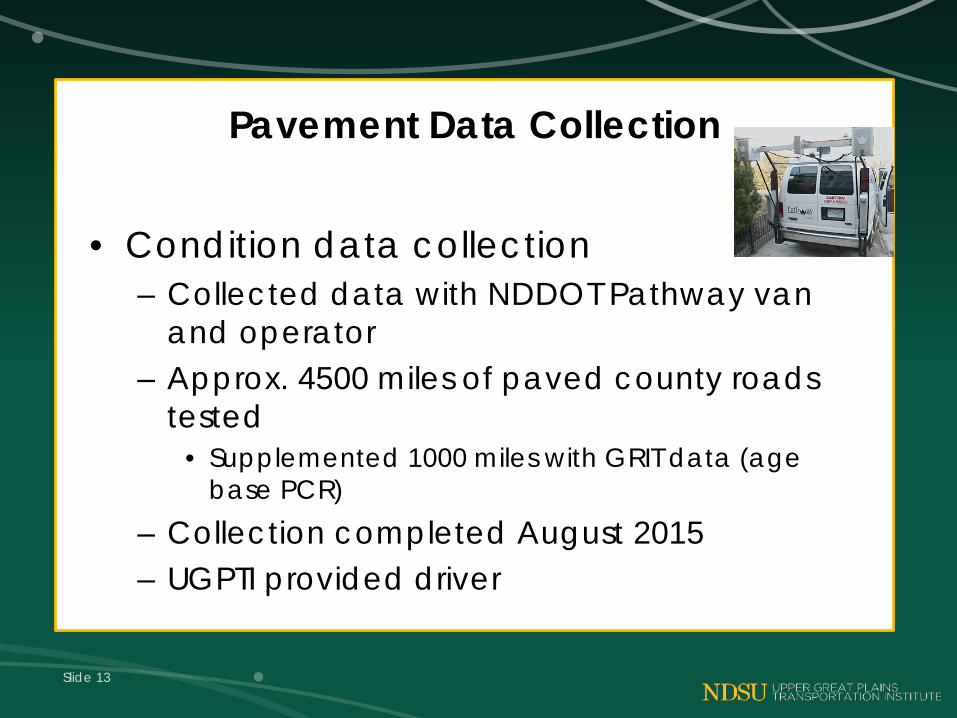
Pavement Data Collection
• Condition data collection– Collected data with NDDOT Pathway van
and operator– Approx. 4500 miles of paved county roads
tested• Supplemented 1000 miles with GRIT data (age
base PCR)– Collection completed August 2015– UGPTI provided driver
Slide 13
Slide 14
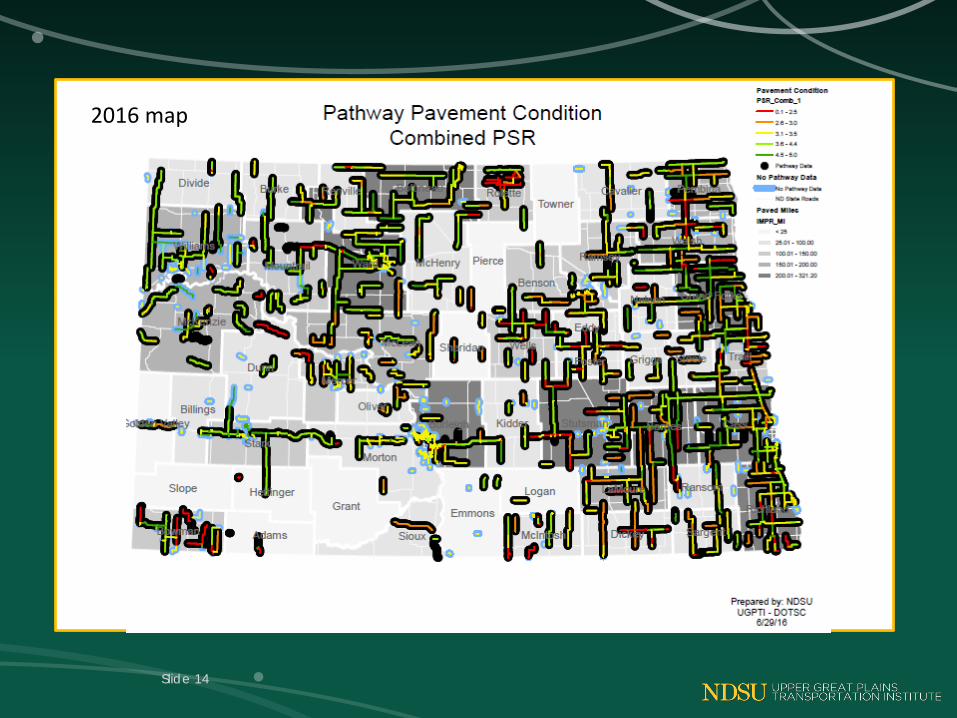
2016 map
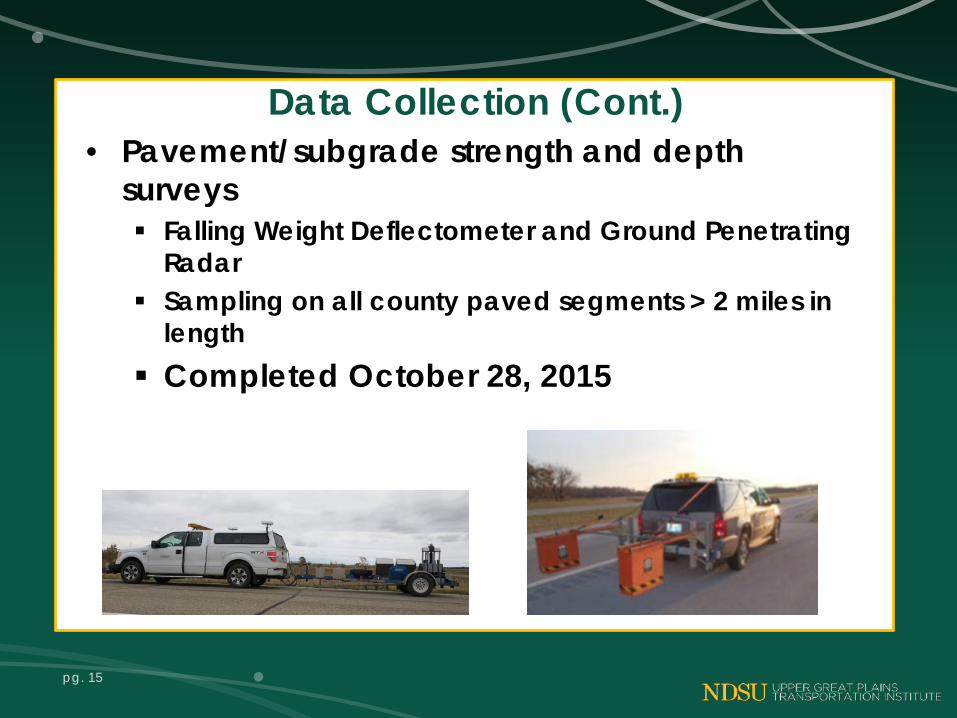
Data Collection (Cont.)• Pavement/subgrade strength and depth
surveys Falling Weight Deflectometer and Ground Penetrating
Radar Sampling on all county paved segments > 2 miles in
length Completed October 28, 2015
pg. 15
pg. 16
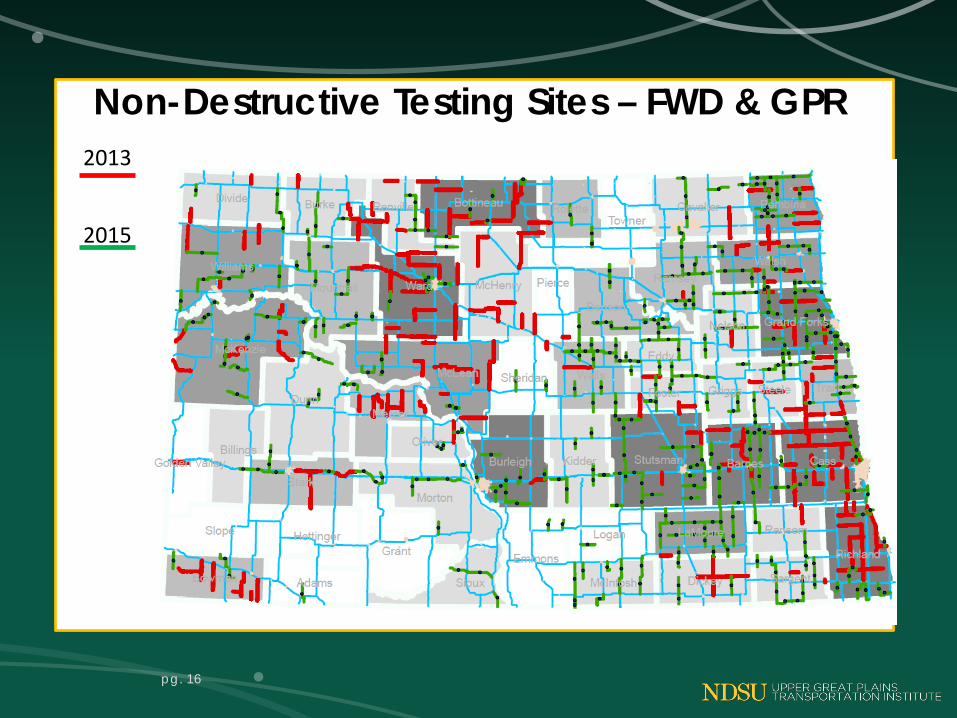
Non-Destructive Testing Sites – FWD & GPR2013
2015
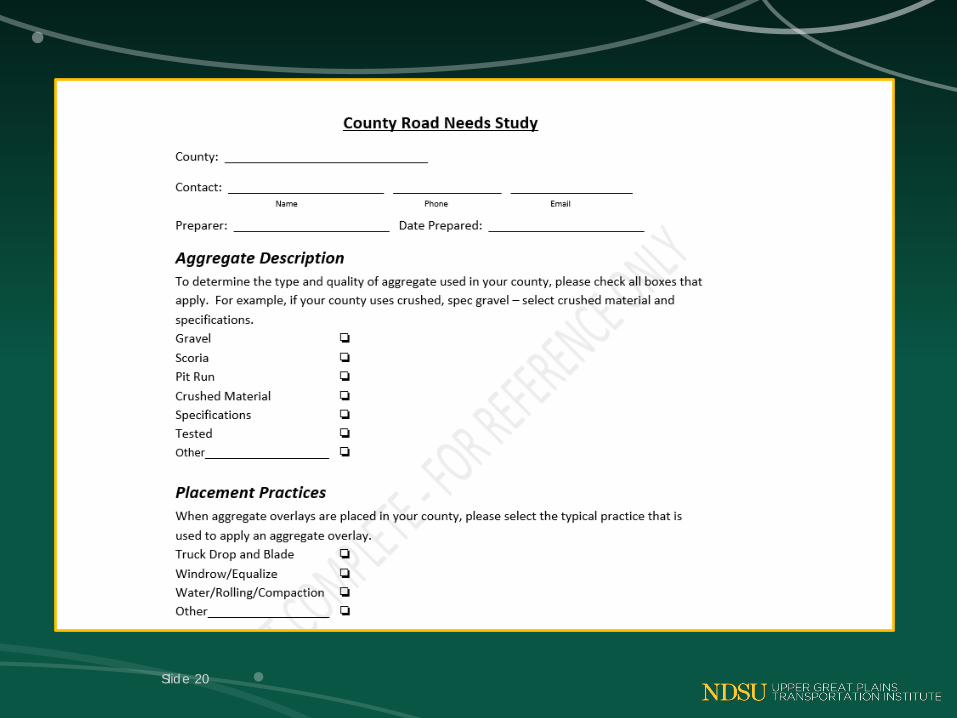
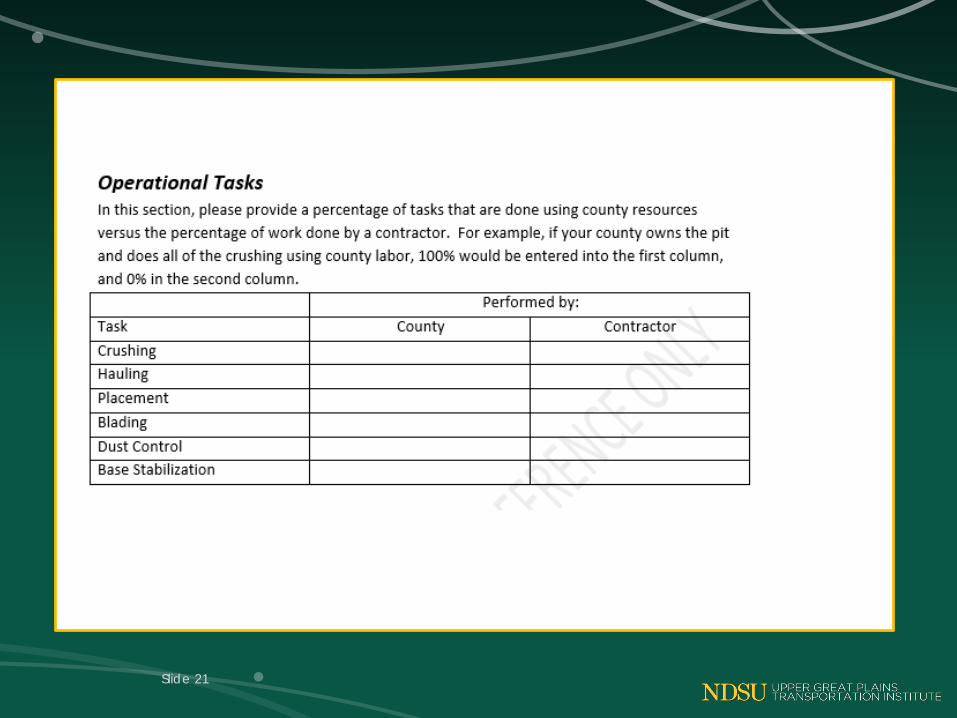
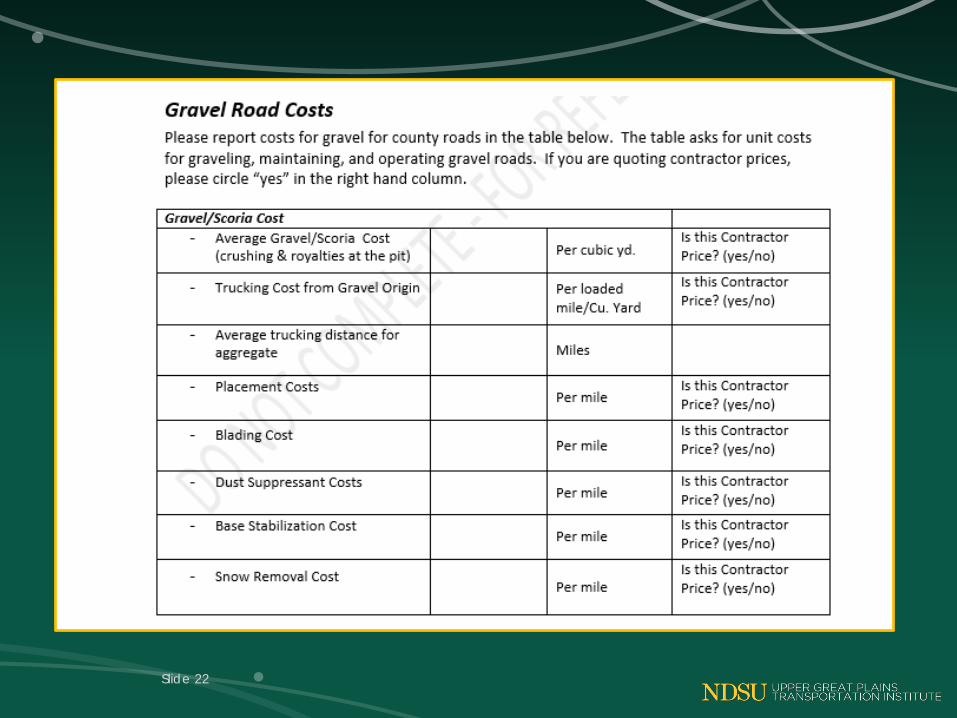
Data Collection – Gravel Road Cost Surveys• Gravel costs & production techniques• Placement costs• Transportation & placement costs• Dust suppressant costs• Intermediate practices
o Stabilization armor coato Double chip seal/armor coato Others
o Questionnaire responses:o 2014 - 52 Counties; 2016 - 53 Counties
Slide 17

Data Collection – Unpaved Costs• Basic Cost Categories for Unpaved Roads
– Gravel/unpaved costs & production techniques
– Placement costs– Transportation & placement costs– Dust suppressant costs
Slide 18
Unpaved (Gravel Roads Survey)– Survey Released to Counties 8-14-15– Survey Released to TWP’s 9-1-15
• Supplemental letter to County Comm/Auditors– Instructional Webinar Hosted and Recorded
• September 23, 2015– Reminder letters throughout year– Status July 1
• 53 Counties Submitted• 738 TWPs Submitted
pg. 19
Slide 20
Slide 21
Slide 22
Slide 23
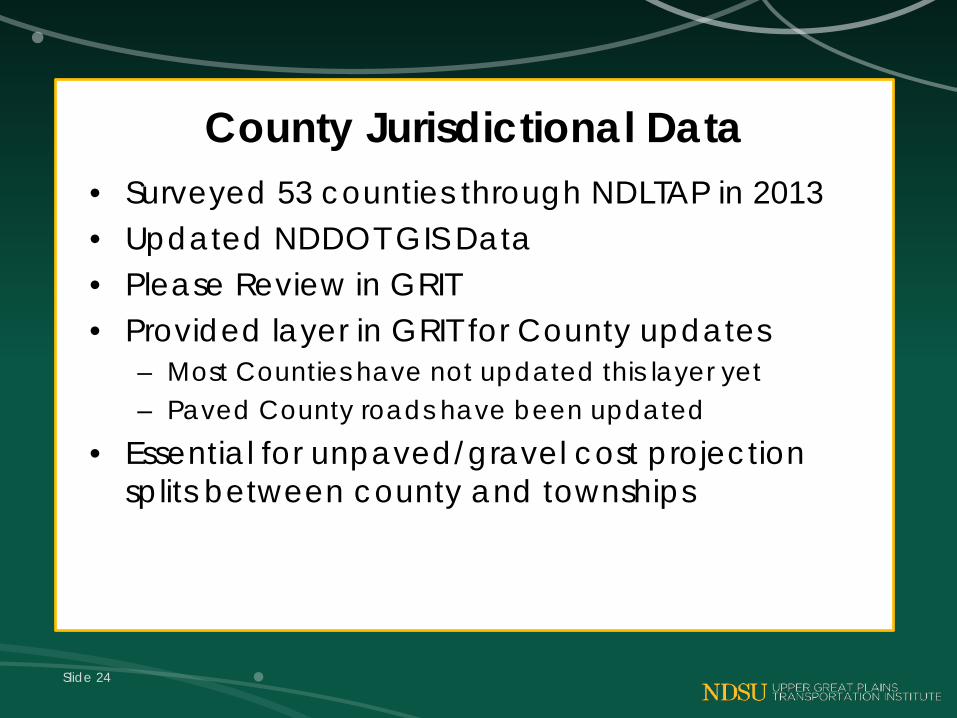
County Jurisdictional Data• Surveyed 53 counties through NDLTAP in 2013• Updated NDDOT GIS Data• Please Review in GRIT• Provided layer in GRIT for County updates
– Most Counties have not updated this layer yet– Paved County roads have been updated
• Essential for unpaved/gravel cost projection splits between county and townships
Slide 24
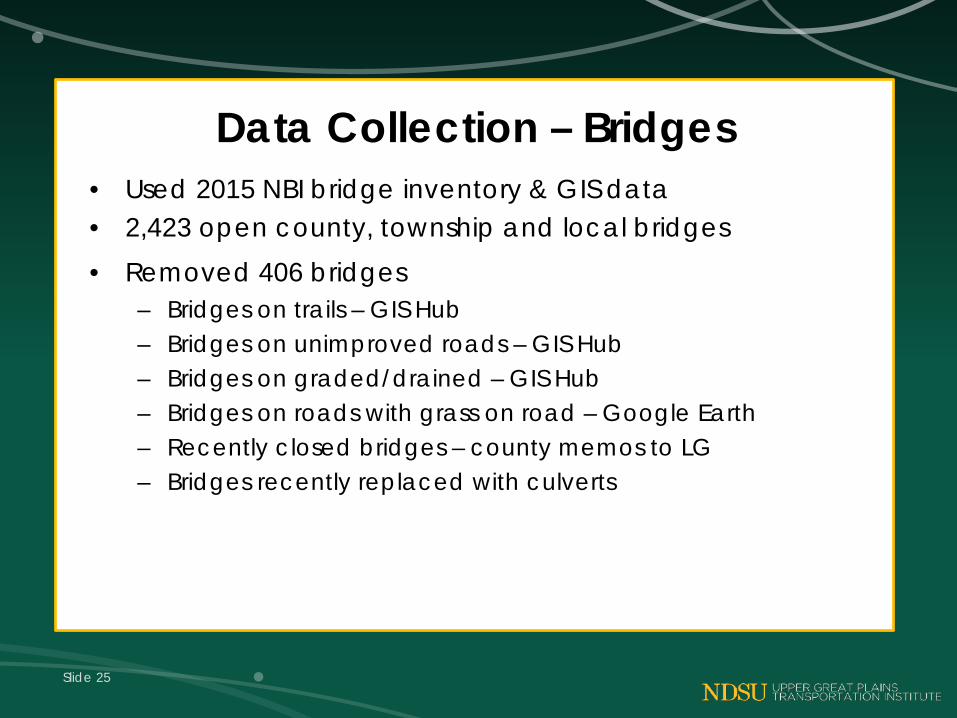
Data Collection – Bridges• Used 2015 NBI bridge inventory & GIS data• 2,423 open county, township and local bridges• Removed 406 bridges
– Bridges on trails – GIS Hub– Bridges on unimproved roads – GIS Hub– Bridges on graded/drained – GIS Hub– Bridges on roads with grass on road – Google Earth– Recently closed bridges – county memos to LG– Bridges recently replaced with culverts
Slide 25
Slide 26
Slide 27
2016 map
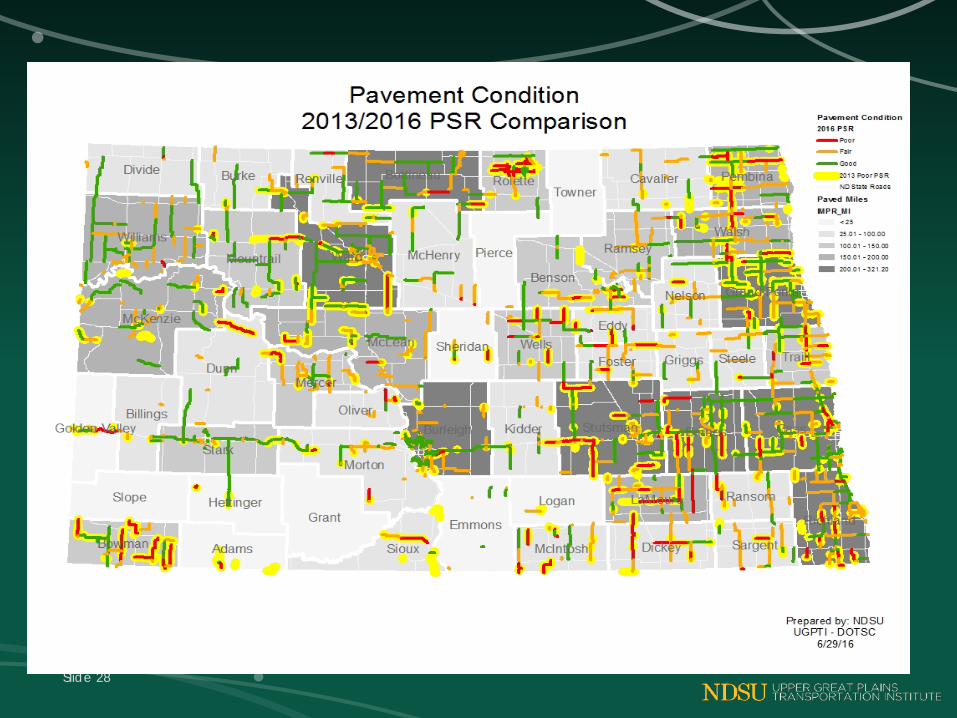
• Insert slides with maps of grit data such as pavement age and shoulder width
Slide 28
pg. 29
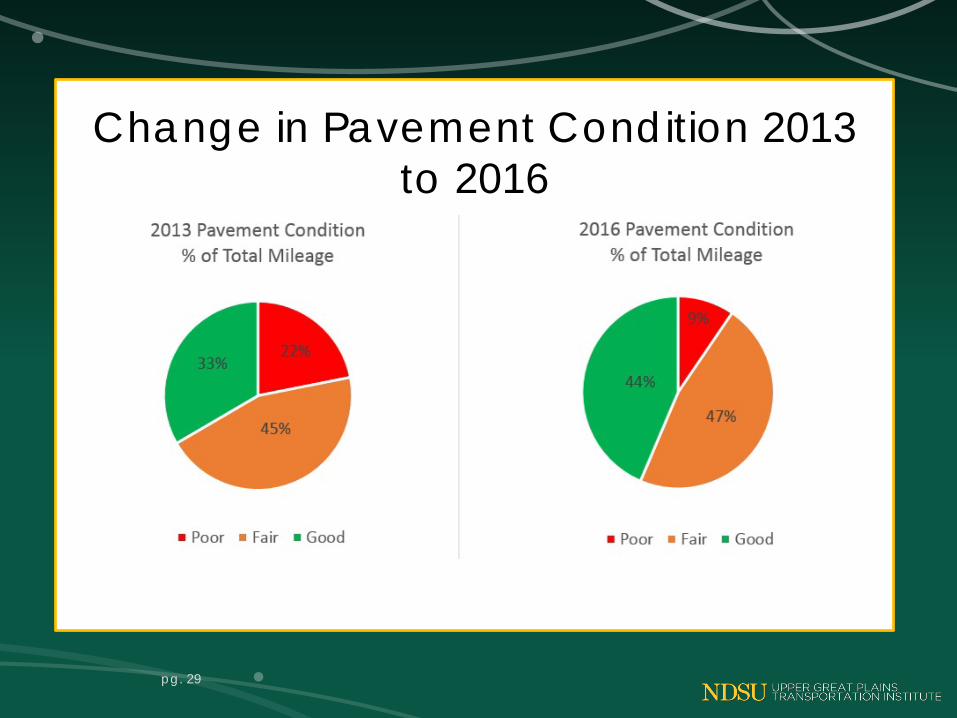
Change in Pavement Condition 2013 to 2016
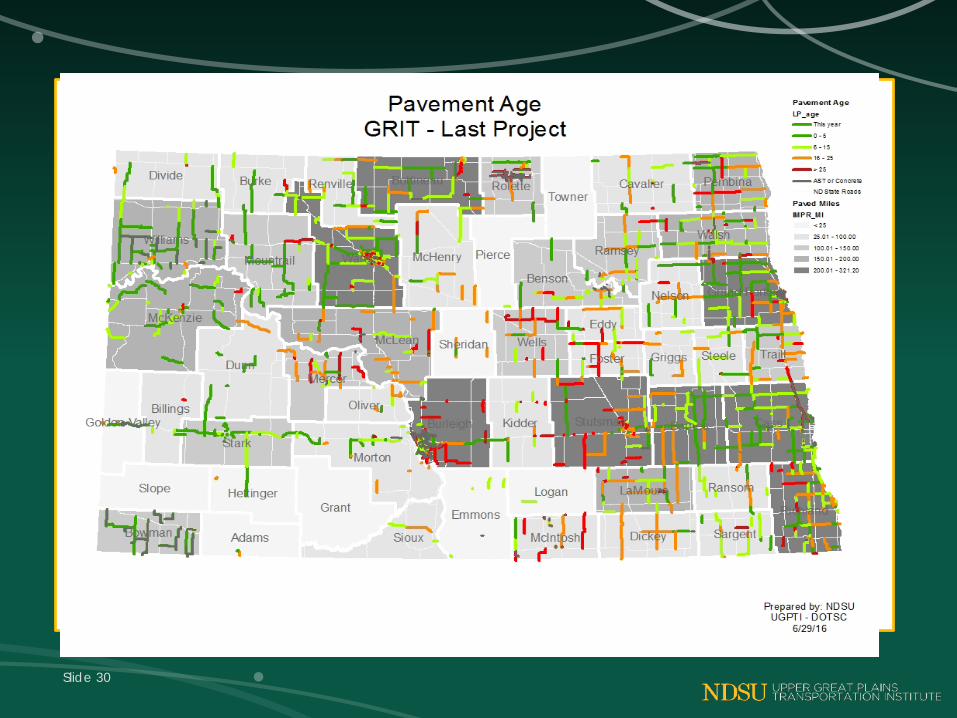
• Insert slides with maps of grit data such as pavement age and shoulder width
Slide 30
Slide 31
Slide 32
Data Analysis Steps & Review
Oil Analysis• Each of the major truck traffic categories were analyzed due
to potential differences in travel behavior and trip length distribution.
• A total of 9 sub models were estimated for the overall oil sub model.
• Individual estimates were aggregated to the segment level for overall traffic estimates.
• Three rig count scenarios were estimated: 30, 60 and 90 rigs• Rig productivity was updated following updates at the WBPC
Slide 33
Agricultural Analysis• A total of 9 commodities were modeled.
In addition, fertilizer and transshipment movements were modeled individually for a total of 11 ag sub models.
• Individual models were aggregated to the segment level to develop estimates of agricultural traffic estimates statewide.
Slide 34
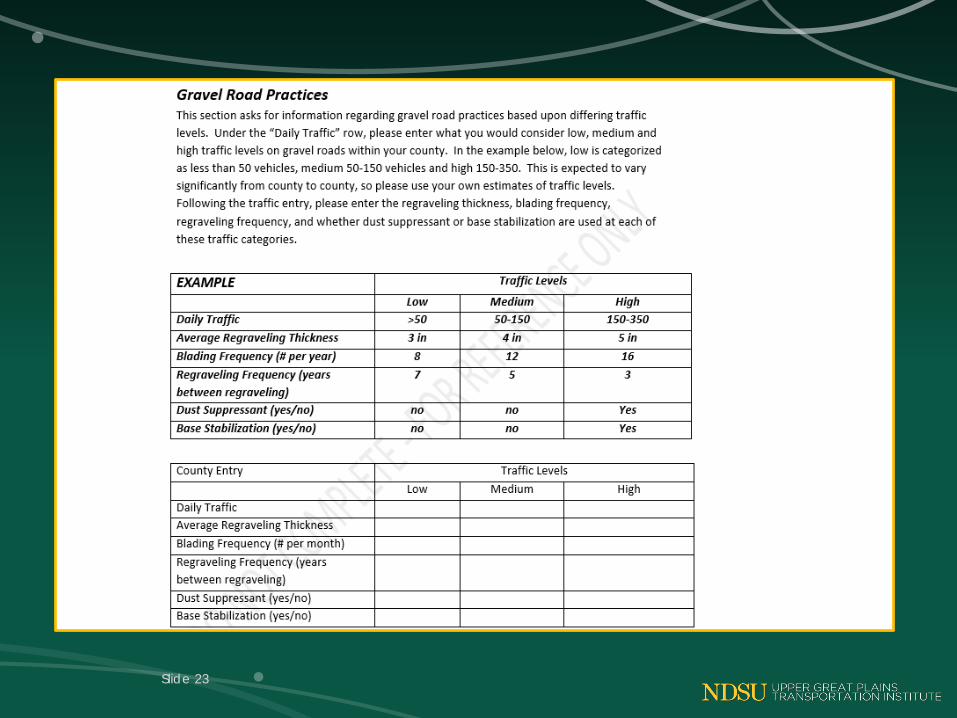
Unpaved Road Analysis• Grouped unpaved road miles by traffic
volume categories.• Established “normal” practices for each
county based upon traffic observations and reported maintenance practices.
• For traffic volumes above normal levels responses for oil impacted roads were used to establish upper categories of maintenance.
Slide 35
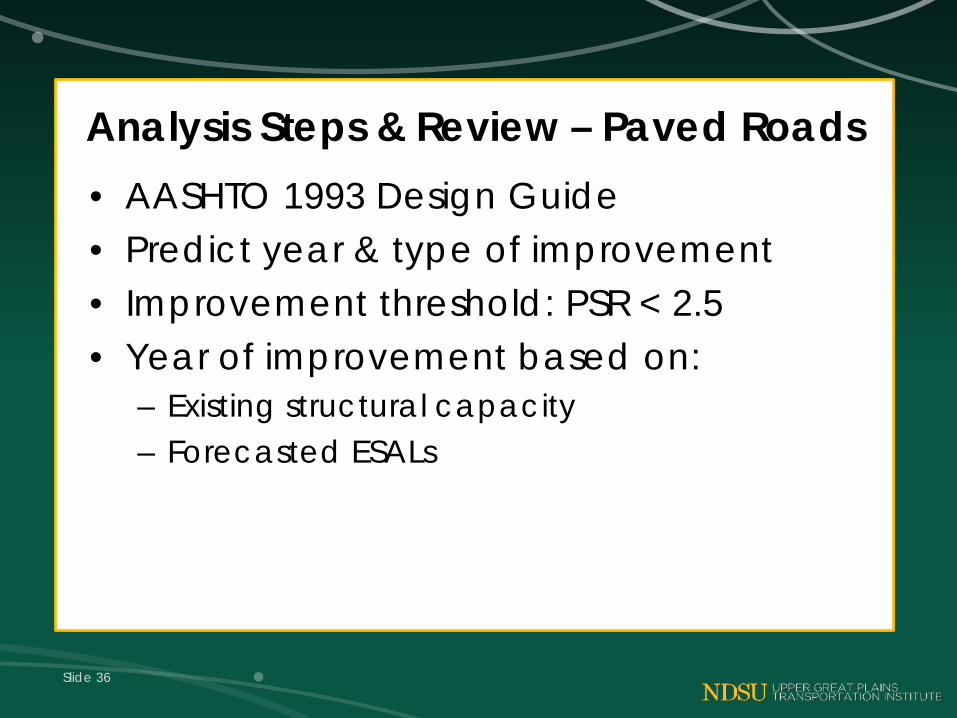
Analysis Steps & Review – Paved Roads• AASHTO 1993 Design Guide• Predict year & type of improvement• Improvement threshold: PSR < 2.5• Year of improvement based on:
– Existing structural capacity– Forecasted ESALs
Slide 36
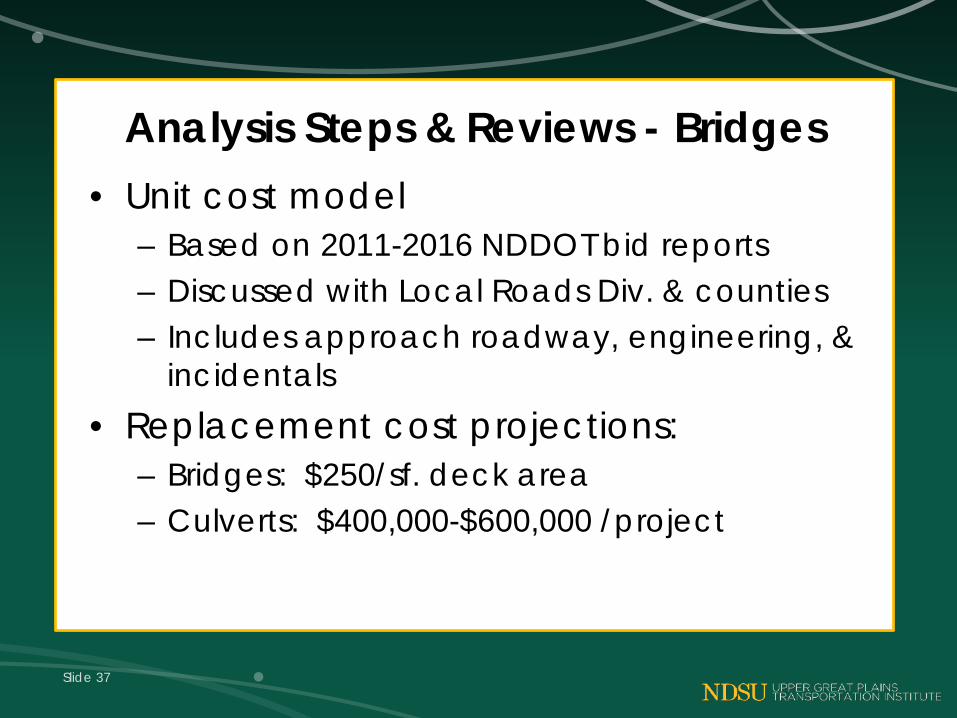
Analysis Steps & Reviews - Bridges• Unit cost model
– Based on 2011-2016 NDDOT bid reports– Discussed with Local Roads Div. & counties– Includes approach roadway, engineering, &
incidentals • Replacement cost projections:
– Bridges: $250/sf. deck area– Culverts: $400,000-$600,000 /project
Slide 37
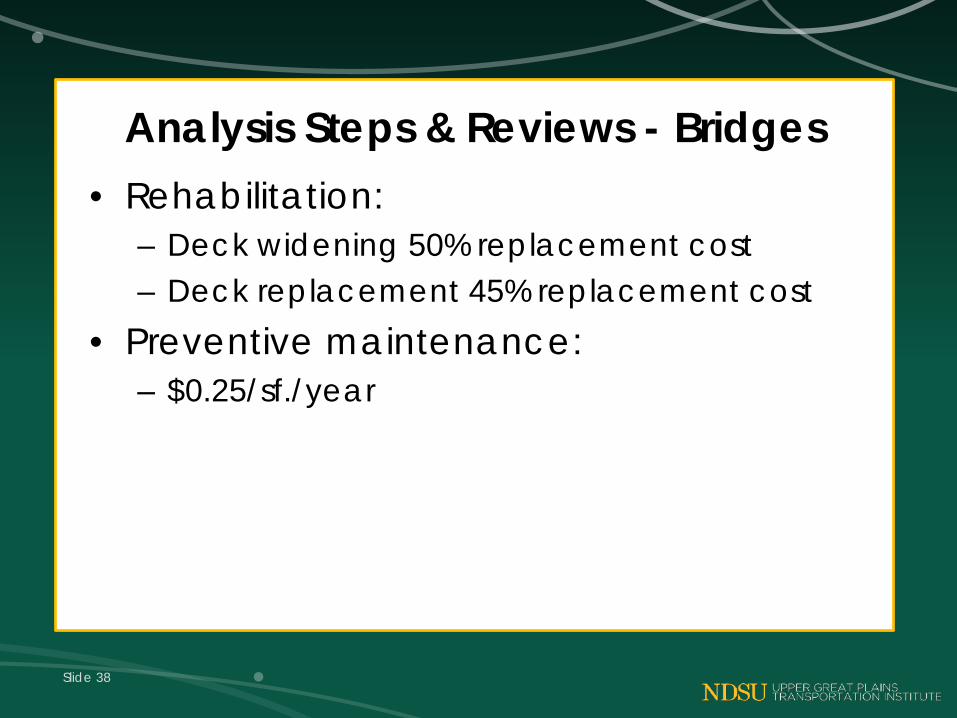
Analysis Steps & Reviews - Bridges• Rehabilitation:
– Deck widening 50% replacement cost– Deck replacement 45% replacement cost
• Preventive maintenance:– $0.25/sf./year
Slide 38

Slide 39
Summation of Needs Part of Presentation
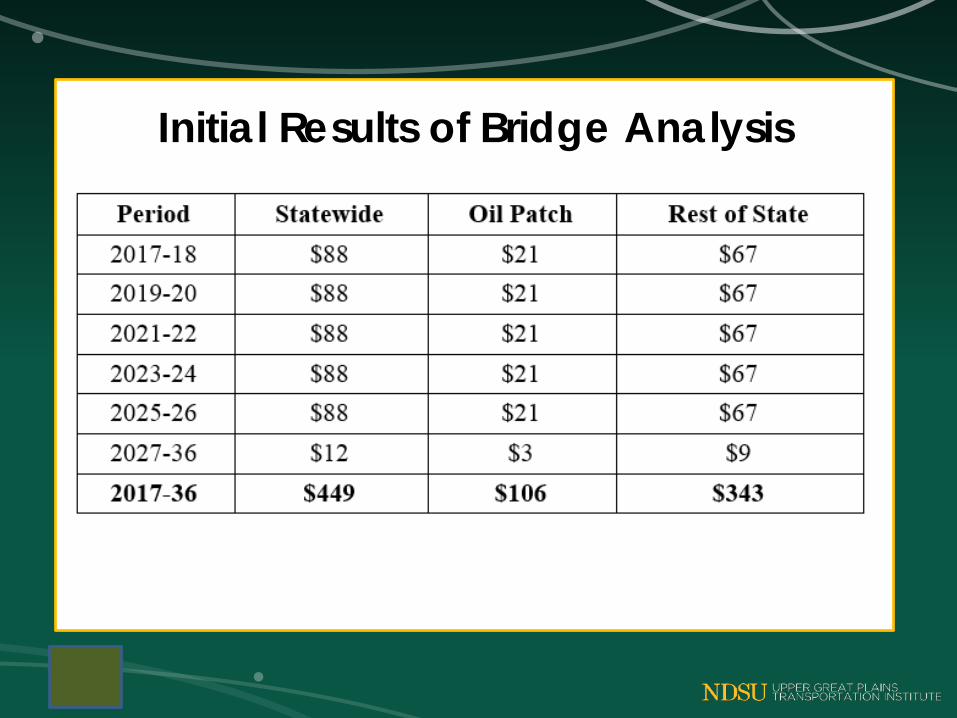
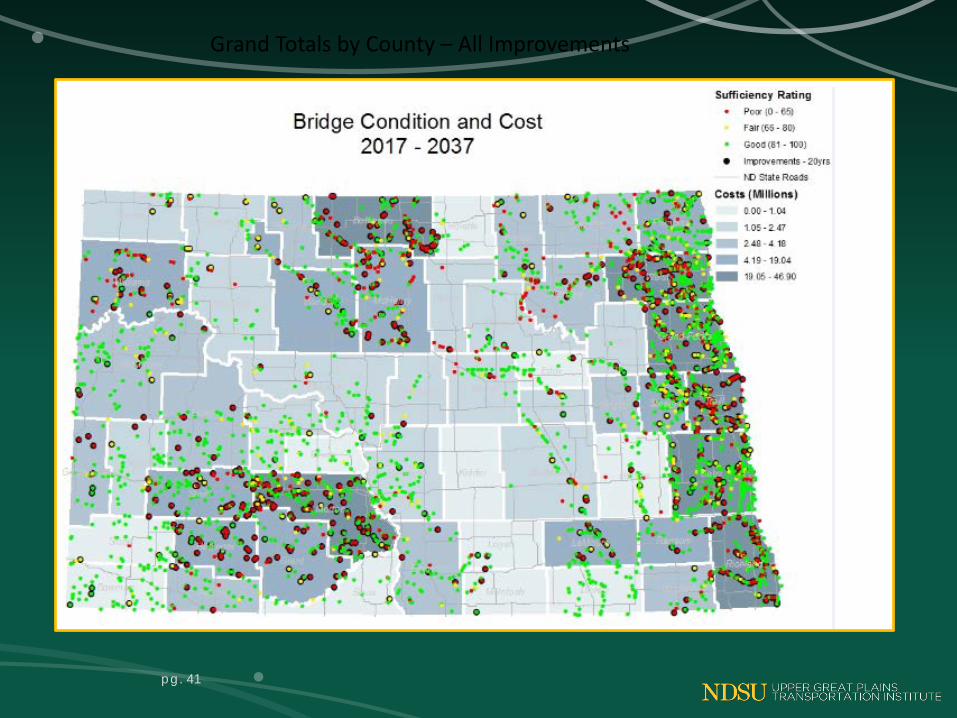
Initial Results of Bridge Analysis
Slide 40
•
pg. 41
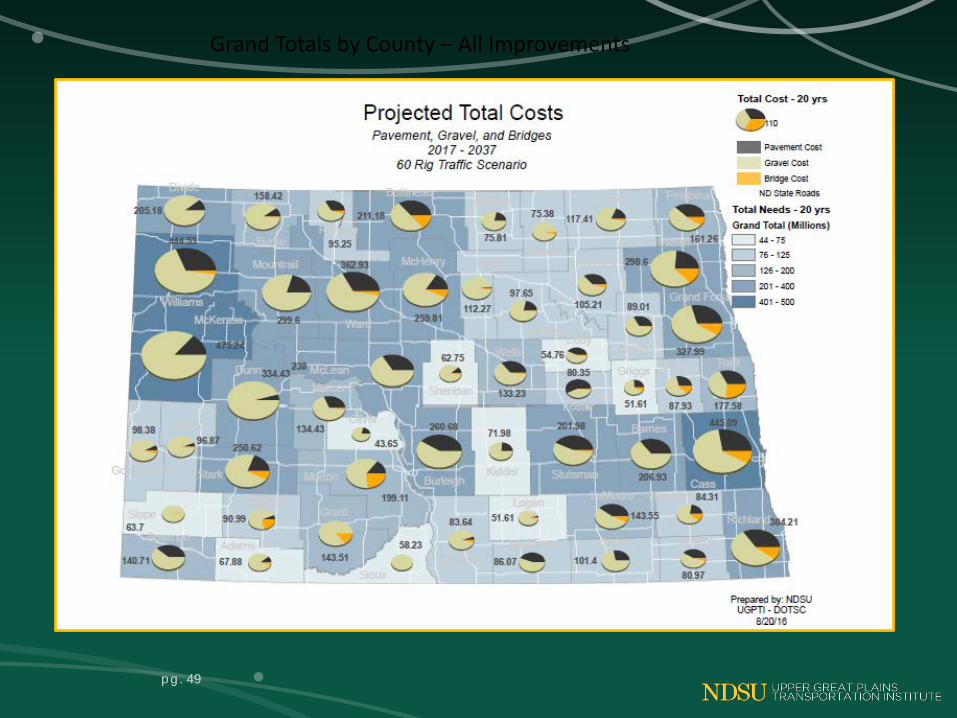
Grand Totals by County – All Improvements
Slide 42
Draft Summation of Unpaved Road Needs
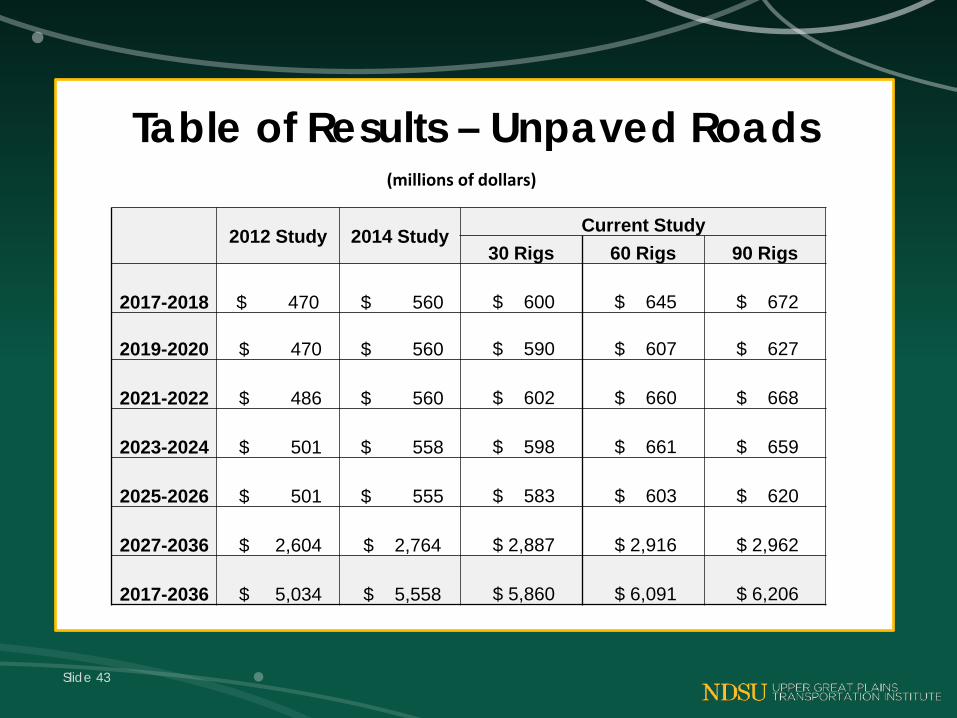
Table of Results – Unpaved Roads
Slide 43
2012 Study 2014 Study Current Study30 Rigs 60 Rigs 90 Rigs
2017-2018 $ 470 $ 560 $ 600 $ 645 $ 672
2019-2020 $ 470 $ 560 $ 590 $ 607 $ 627
2021-2022 $ 486 $ 560 $ 602 $ 660 $ 668
2023-2024 $ 501 $ 558 $ 598 $ 661 $ 659
2025-2026 $ 501 $ 555 $ 583 $ 603 $ 620
2027-2036 $ 2,604 $ 2,764 $ 2,887 $ 2,916 $ 2,962
2017-2036 $ 5,034 $ 5,558 $ 5,860 $ 6,091 $ 6,206
(millions of dollars)
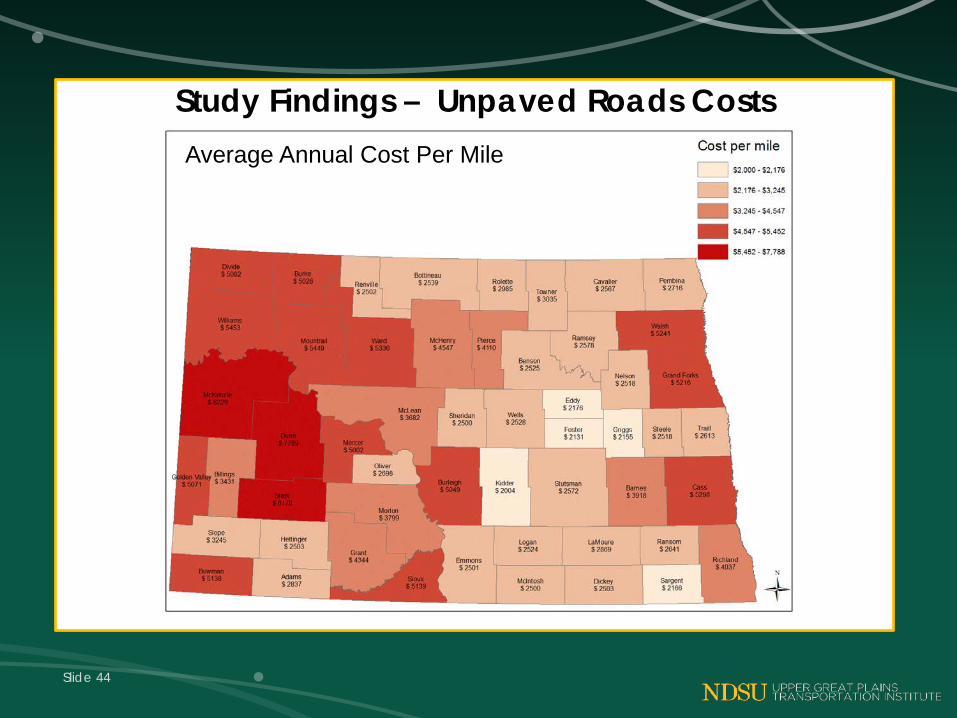
Study Findings – Unpaved Roads Costs
Slide 44
Average Annual Cost Per Mile
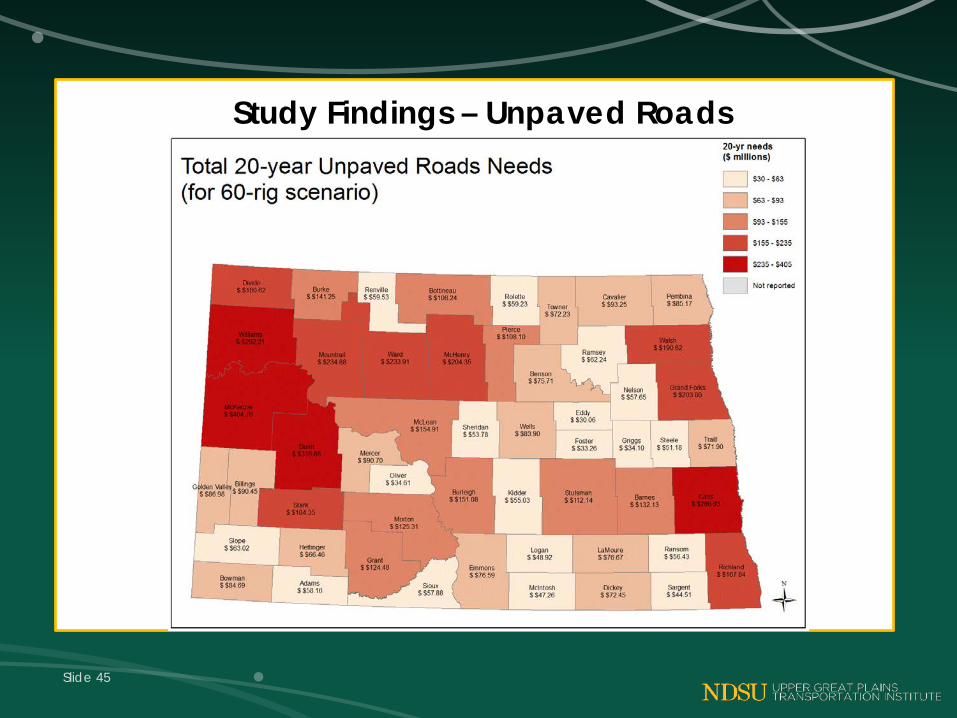
Study Findings – Unpaved Roads
Slide 45
Slide 46
Summation of Pavement Needs
pg. 47
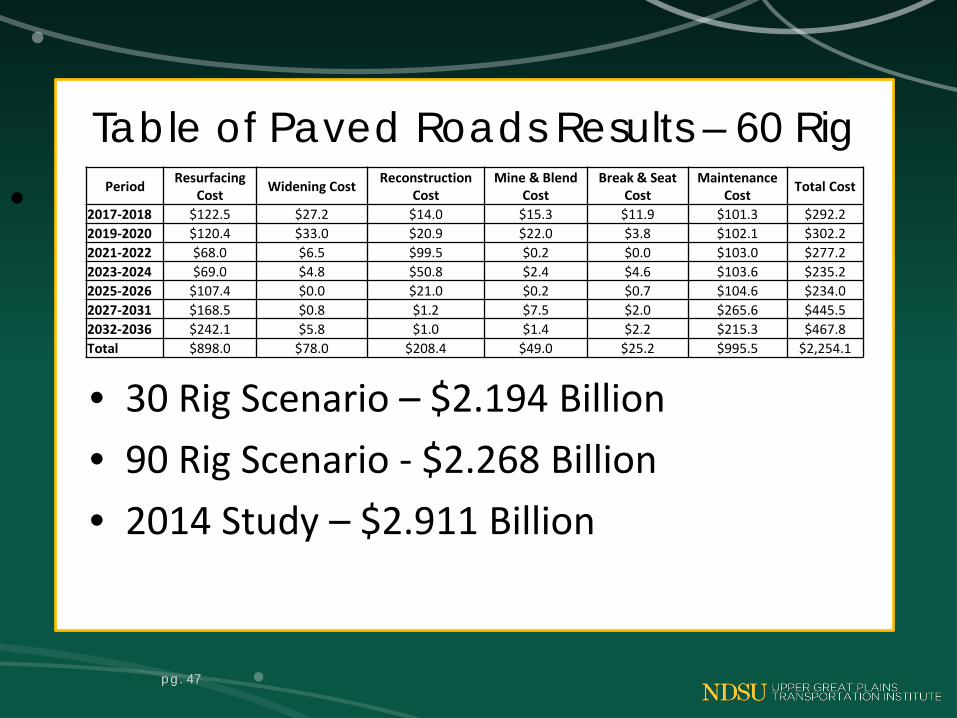
Table of Paved Roads Results – 60 Rig• Period Resurfacing
Cost Widening Cost Reconstruction Cost
Mine & Blend Cost
Break & Seat Cost
Maintenance Cost Total Cost
2017-2018 $122.5 $27.2 $14.0 $15.3 $11.9 $101.3 $292.2 2019-2020 $120.4 $33.0 $20.9 $22.0 $3.8 $102.1 $302.2 2021-2022 $68.0 $6.5 $99.5 $0.2 $0.0 $103.0 $277.2 2023-2024 $69.0 $4.8 $50.8 $2.4 $4.6 $103.6 $235.2 2025-2026 $107.4 $0.0 $21.0 $0.2 $0.7 $104.6 $234.0 2027-2031 $168.5 $0.8 $1.2 $7.5 $2.0 $265.6 $445.5 2032-2036 $242.1 $5.8 $1.0 $1.4 $2.2 $215.3 $467.8 Total $898.0 $78.0 $208.4 $49.0 $25.2 $995.5 $2,254.1
• 30 Rig Scenario – $2.194 Billion• 90 Rig Scenario - $2.268 Billion• 2014 Study – $2.911 Billion
Slide 48
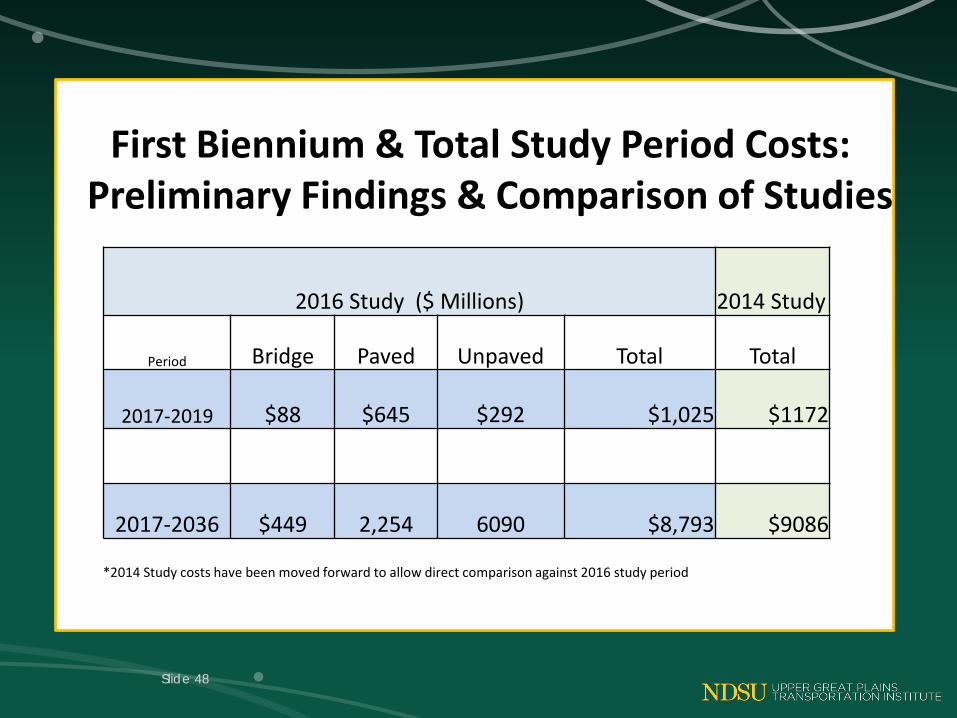
2016 Study ($ Millions) 2014 Study
Period Bridge Paved Unpaved Total Total
2017-2019 $88 $645 $292 $1,025 $1172
2017-2036 $449 2,254 6090 $8,793 $9086
*2014 Study costs have been moved forward to allow direct comparison against 2016 study period
First Biennium & Total Study Period Costs:Preliminary Findings & Comparison of Studies
pg. 49
Grand Totals by County – All Improvements

Outreach/Comment Process
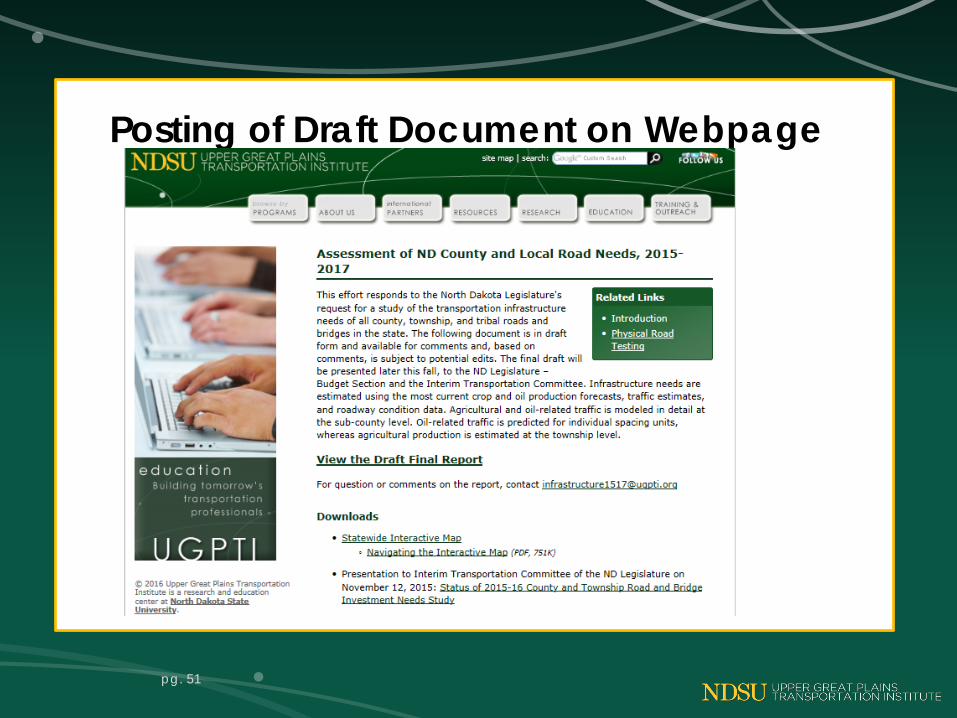
Posting of Draft Document on Webpage
pg. 51
Posting of Draft Document on Webpage
pg. 52
• This effort responds to the North Dakota Legislature's request for a study of the transportation infrastructure needs of all county, township, and tribal roads and bridges in the state. The following document is in draft form and available for comments and based on comments subject to potential edits. The final draft will be presented later this fall, to the ND Legislature – Budget Section and the Interim Transportation Committee.Infrastructure needs are estimated using the most current crop and oil production forecasts, traffic estimates, and roadway condition data. Agricultural and oil-related traffic is modeled in detail at the sub-county level. Oil-related traffic is predicted for individual spacing units, whereas agricultural production is estimated at the township level.

Provide Online Comment Button• Provided on UGPTI Website
– Tracking of Comments/Responses
pg. 53
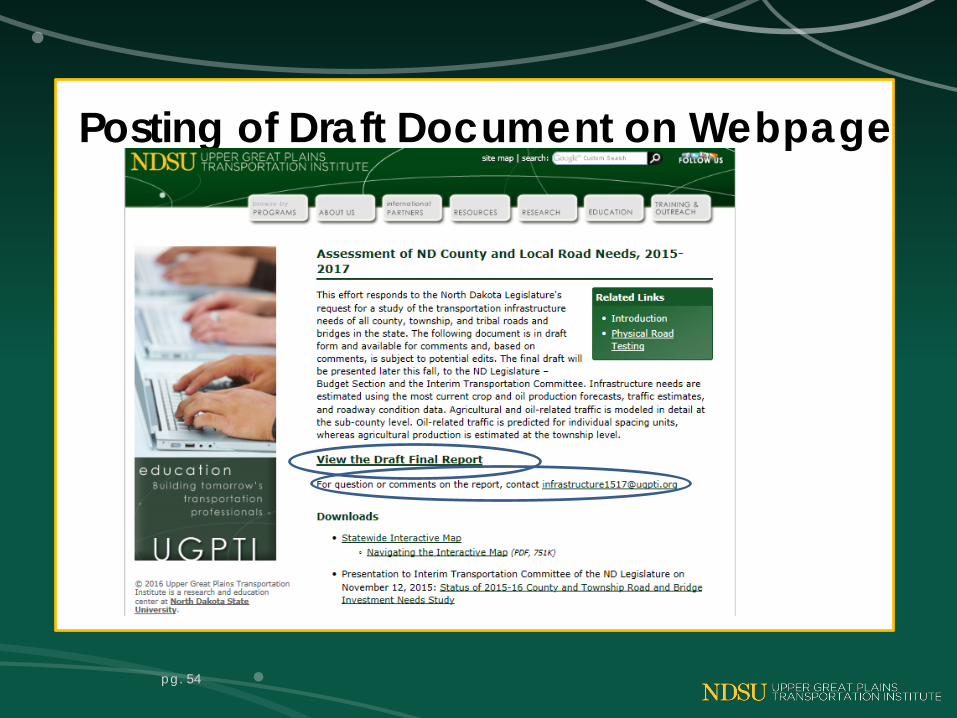
Posting of Draft Document on Webpage
pg. 54
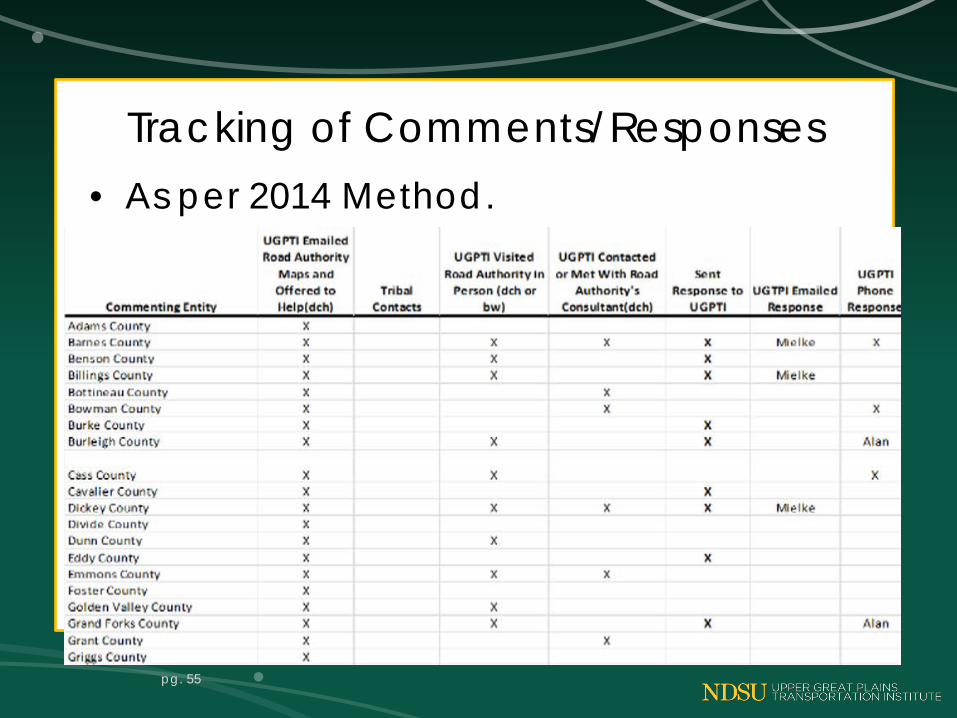
Tracking of Comments/Responses• As per 2014 Method.
pg. 55

Questions?