Embed Size (px)
Citation preview

Copyright © 2012, Oracle and/or its affiliates. All rights reserved.1

CON9210 - Performance Tuning for PeopleSoft Administrators
Copyright © 2012, Oracle and/or its affiliates. All rights reserved.2
David Kurtz
Go-Faster Consultancy Ltd.
www.go-faster.co.uk
Tim Bower
Oracle – PeopleSoft Center of Expertise

Oracle Safe Harbor Statement
The following is intended to outline our general product direction. It is
intended for information purposes only, and may not be incorporated into
any contract. It is not a commitment to deliver any material, code, or
functionality, and should not be relied upon in making purchasing
decisions.
Copyright © 2012, Oracle and/or its affiliates. All rights reserved.3
decisions.
The development, release, and timing of any features or functionality
described for Oracle’s products remains at the sole discretion of Oracle.

Program Agenda
� Introductory Remarks
� Performance Defined
� Performance Measurement
Copyright © 2012, Oracle and/or its affiliates. All rights reserved.4
� Performance Measurement
� Database (Oracle)
� Application Server

Program Agenda (continued)
� Web Servers
� Conclusions
� Q & A
Copyright © 2012, Oracle and/or its affiliates. All rights reserved.5
� Q & A

Who Am I?
�Oracle Database Specialist
– Independent consultant
� Performance tuning
– PeopleSoft ERP
Copyright © 2012, Oracle and/or its affiliates. All rights reserved.6
– Oracle RDBMS
� Book
– www.psftdba.com
Oak Table
ACE

It depends…
� The answer to all questions should be deemed to be implicitly prefixed
‘it depends’ if they are not already explicitly so prefixed. The reasons
for this include, but are not limited to:
– There may be exceptions where the answer is either false or not
Copyright © 2012, Oracle and/or its affiliates. All rights reserved.7
– There may be exceptions where the answer is either false or not
completely true
– There may be exceptions to the exceptions and so on ad infinitum.
– The question may not explicitly scope all the conditions upon which
the answer depends

‘Not Completely True’
Copyright © 2012, Oracle and/or its affiliates. All rights reserved.8

Performance
Performance is exactly what the user perceives it to be. No more, no
less.
Copyright © 2012, Oracle and/or its affiliates. All rights reserved.10
Performance is ‘poor’ when the user’s perception does not match their
expectation.
“Data, data, data, I cannot make bricks without clay.”
You don’t need fancy monitoring software to tell you that a system is
performing poorly.
That is what users are for.
Copyright © 2012, Oracle and/or its affiliates. All rights reserved.11
But you do need to record and monitor metrics to provide diagnostic
data

Performance Tuning is a search for lost time.
Detection is, or ought to be, an exact science.
It should be treated in the same cold and unemotional manner.
The Sign of Four, Arthur Conan-Doyle
Copyright © 2012, Oracle and/or its affiliates. All rights reserved.12

PeopleTools Performance Monitor
Copyright © 2012, Oracle and/or its affiliates. All rights reserved.14

Performance Monitor
� Part of PeopleTools
– PeopleTools to monitor PeopleTools
� Since PeopleTools 8.44
– Fully instrumented
Copyright © 2012, Oracle and/or its affiliates. All rights reserved.15
– Including a timed-event interface for the component processor
� Event 10046 for the application
– Useful PeopleBook
– No separate licence

Web
ServerApplication
Server
(application logic)
APPQ PSAPPSRVDBMS
(application data
& meta-data
SQLTuxedo
Message
http /
https
Browser
(presentation &
JavaScript)
Monitoring System
PIA
Servlet
PSPPMSRV
Web Browser Application
PPMI
Servlet
Monitor
Servlet
Copyright © 2012, Oracle and/or its affiliates. All rights reserved.16
logic)
Web
Server
(presentation
logic)
PIA
Servlet
DBMS
(application data
& meta-data
Tuxedo
Message
http /
https
Browser
(presentation &
JavaScript)
Screen
Paint
Java
Script
Application
Server
(application logic)
APPQ PSAPPSRV
SQL
Monitored System
PSMONITORSRV

Performance Monitor Metrics
�Transactions
– User activities in PIA that cause communications with application server
� Events
– Periodic samples
– Usually initiated by monitoring
agents
Copyright © 2012, Oracle and/or its affiliates. All rights reserved.17
application server
– Sampled
– Enabled to form a session trace
� PSPMTRANSHIST
agents
– eg. CPU, Tuxedo counters
� PSPMEVENTHIST

Web
Server
Servlet
Thread
Application
Server
APPQ PSAPPSRV
Browser
DBMS
(application data SQL
Tuxedo
Message
http /
https
Web Server
Access Log
Tuxedo
Service
Trace
Oracle
SQL*Trace
Screen
Paint
Java
Script
PeopleTools
Trace
Copyright © 2012, Oracle and/or its affiliates. All rights reserved.18
(presentation
logic)
Thread
(application logic)(presentation
& JavaScript)
(application data
& meta-data
MessagehttpsPaint Script
101: PIA Request
115: Jolt Time
400: Tuxedo Service
401: ICPanel
400: PeopleCode only406/407/408:
SQL Exec
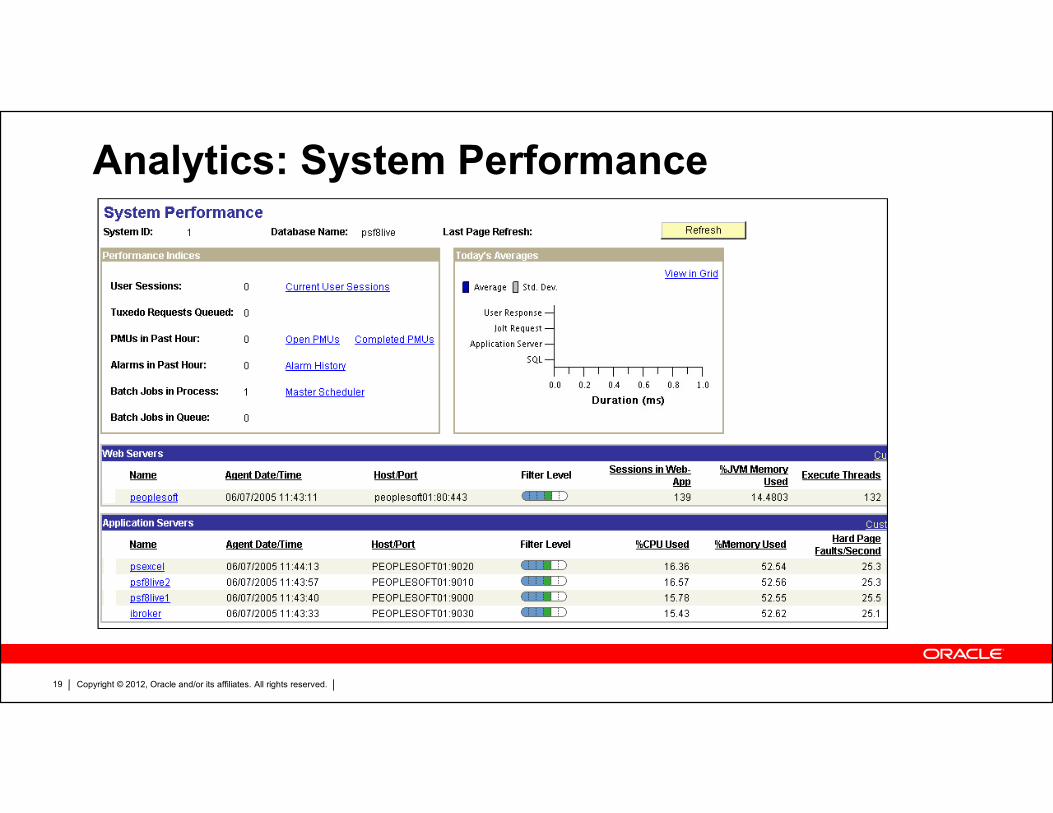
Analytics: System Performance
Copyright © 2012, Oracle and/or its affiliates. All rights reserved.19

Analytics: Top Components
Copyright © 2012, Oracle and/or its affiliates. All rights reserved.20

Generates a group of PMUs for activity in a user session
• Choose an ID to identify records later
Performance Trace
Copyright © 2012, Oracle and/or its affiliates. All rights reserved.21
• Verbose
• Includes SQL
• Significant
overhead.
• Don’t use as
default. Trace only.

Performance Monitor Transactions
� User activity in PIA
� Performance Monitoring Unit
– Hierarchy of transactions
� Similar to Oracle event 10046
trace
Copyright © 2012, Oracle and/or its affiliates. All rights reserved.22
trace
– recursive actions

SQL in Verbose Trace
Copyright © 2012, Oracle and/or its affiliates. All rights reserved.23

How much data?
� Proportion of transactions collected
– Depends upon activity on system
– On busy self-service system as little as 1 in 1000
It depends! You will have to decide for yourself.
Copyright © 2012, Oracle and/or its affiliates. All rights reserved.24
� It depends! You will have to decide for yourself.
� Event sampling frequency
– For each agent
– 5 minutes – 15 minutes
� Depends on whether you want to be able to see short-lived behaviours.

Copyright © 2012, Oracle and/or its affiliates. All rights reserved.25

Performance Tuning the Performance Monitor
� Always configure self-monitoring of the monitoring database
– So you know it works
– So you can work out why the analytics are slow!
� Performance Tuning the Performance Monitor Archive Process
– http://blog.psftdba.com/2008/05/performance-tuning-performance-
Copyright © 2012, Oracle and/or its affiliates. All rights reserved.26
monitor.html
� Additional indexes
– http://blog.psftdba.com/2006/04/performance-tuning-performance-
monitor.html
– http://blog.psftdba.com/2008/12/poor-performance-of-pspmsessionsvw-
view.html
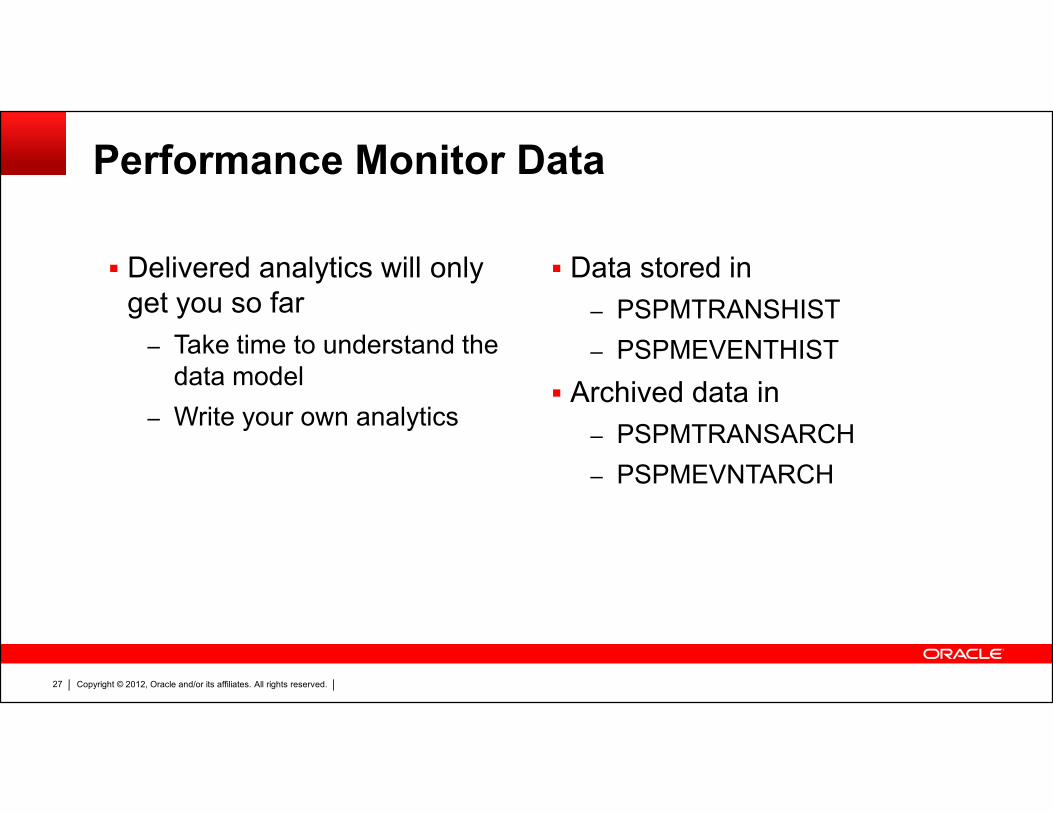
Performance Monitor Data
� Delivered analytics will only
get you so far
– Take time to understand the
data model
– Write your own analytics
� Data stored in
– PSPMTRANSHIST
– PSPMEVENTHIST
� Archived data in
Copyright © 2012, Oracle and/or its affiliates. All rights reserved.27
– Write your own analytics� Archived data in
– PSPMTRANSARCH
– PSPMEVNTARCH

Custom Analytics with Excel
� Write a query to extract the data
– Create ODBC source using Oracle’s ODBC driver
– Use MSQuery to extract the data directly via into Excel workbook
� Possibly directly into a pivot table
� Chart the data
Copyright © 2012, Oracle and/or its affiliates. All rights reserved.28
� Chart the data
– Some of the charts that you will see later in this presentation were derived
from PPM data by this method
� When you update the data the chart will also update.

Performance Monitor Further Reading
� Performance Monitor PeopleBook
� PeopleSoft Performance Monitor Red Paper
– Doc ID: 747510.1
� PeopleSoft for the Oracle DBA
Copyright © 2012, Oracle and/or its affiliates. All rights reserved.30
– Chapter 10 (2nd edition)
� Practical Guidance on the Use of PeopleSoft Performance Monitor
– www.go-faster.co.uk/Practical_PPM.ppt
– www.go-faster.co.uk/Practical_PPM_2009.ppt
– http://blog.psftdba.com/search/label/Performance Monitor

PeopleToolsInstrumentation For Oracle Database
Copyright © 2012, Oracle and/or its affiliates. All rights reserved.31
Database

PeopleTools Instrumentation for Oracle Database
� DBMS_APPLICATION_INFO
– CLIENT_INFO since PT7.53
� Used in audit triggers
– MODULE and ACTION from PT8.50
On-Line
Copyright © 2012, Oracle and/or its affiliates. All rights reserved.32
– On-Line
� Module/Action
– Component/Page, Query Name, Subscription Message
� Client ID = Operator ID
– Scheduled Processes
� But only sets ACTION to PRCSNAME

Oracle DBMS: Module & Action
� Enterprise Manager / Grid Control
� Active Session Hstory (ASH)
� Oracle Extended Trace
Copyright © 2012, Oracle and/or its affiliates. All rights reserved.34
� Oracle Extended Trace
– From 10g set trace on Module/Action
� Oracle Resource Manager

Module & Action in OEM
Copyright © 2012, Oracle and/or its affiliates. All rights reserved.35

Augmenting PeopleTools Instrumentation
� Trigger on PSPRCSRQST
– Set Module to PRCSNAME
– Set Acton to
Copyright © 2012, Oracle and/or its affiliates. All rights reserved.36
� Process Instance
� Or Run Control ID
� http://www.go-faster.co.uk/scripts/psftapi.sql
– PeopleTools 8.50
� Module = program, Action = Process Name

Copyright © 2012, Oracle and/or its affiliates. All rights reserved.37
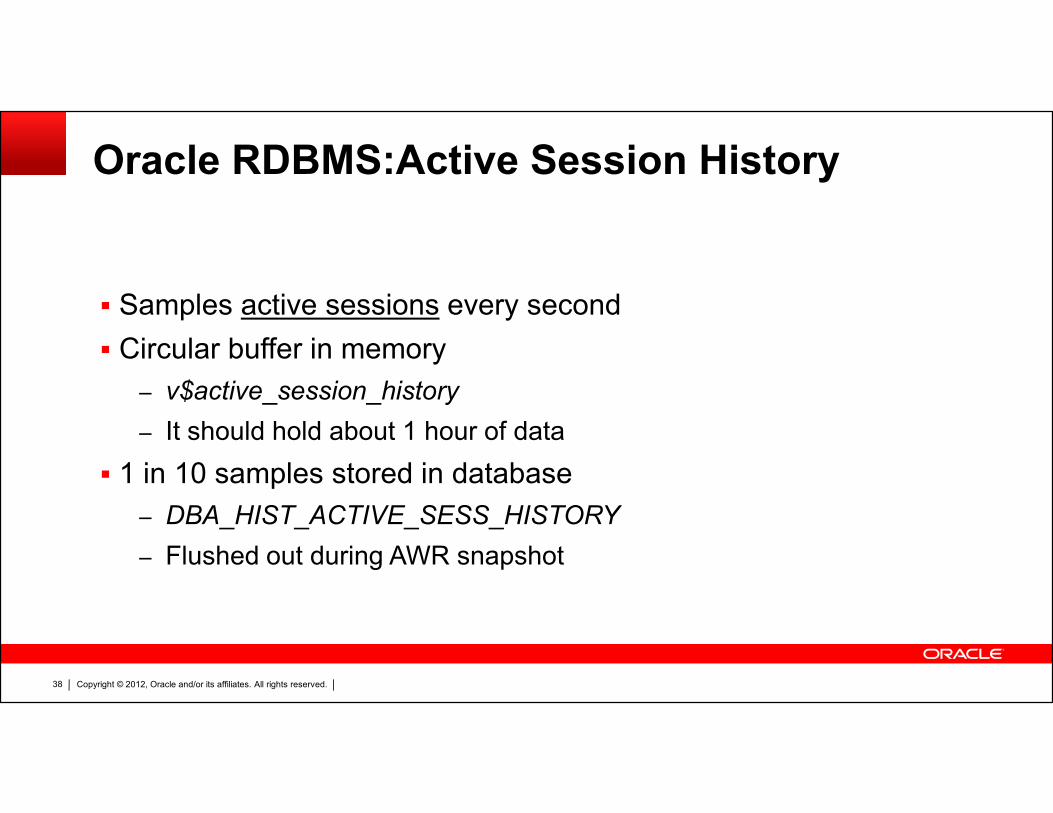
Oracle RDBMS:Active Session History
� Samples active sessions every second
� Circular buffer in memory
– v$active_session_history
Copyright © 2012, Oracle and/or its affiliates. All rights reserved.38
– It should hold about 1 hour of data
� 1 in 10 samples stored in database
– DBA_HIST_ACTIVE_SESS_HISTORY
– Flushed out during AWR snapshot

Licensing
� ASH is a part of the Diagnostics Pack
– only available with Enterprise Edition of Oracle database.
Copyright © 2012, Oracle and/or its affiliates. All rights reserved.39
– That’s means it costs money.
– I don’t like it either, but that is how it is!

ASH in OEMYou can run ASH reports via EM
Copyright © 2012, Oracle and/or its affiliates. All rights reserved.40

Example ASH Report
� These processes were
responsible for 86% of total
DB activity
� Average 14.8 active
sessions (out 32 processes)
Copyright © 2012, Oracle and/or its affiliates. All rights reserved.41
sessions (out 32 processes)
� If I go on I get SQL
statements
� But I don’t get execution
plans.

What does ASH retain?� Most of the columns are on v$session
– Session
� Session ID and serial, query coordinator
– Wait
� event id, name and parameters
– SQL
� SQL_ID, plan hash, opcode
Copyright © 2012, Oracle and/or its affiliates. All rights reserved.42
� SQL_ID, plan hash, opcode
� Plan line numbers from 11g
– Object
� object, file and block numbers
� row numbers from 11g
– Application
� module, action, client_id …

Active Session History
� Query ASH repository directly
– DBA_HIST_ACTIVE_SESS_HISTORY
� Profile DB Time by
Copyright © 2012, Oracle and/or its affiliates. All rights reserved.43
– Module / Action
– SQL_ID
– SQL Plan Hash Value (if lots of different literals)
Background Reading
� Sifting through the ASHes, Graham Wood
– http://www.oracle.com/technetwork/database/manageability/ppt-active-session-history-129612.pdf
� The ASHes of (DB) Time, Graham Wood
– http://www.ukoug.org/what-we-offer/library/12004ash-why-how-and-howto/ASHUKOUGJuly2010GW.pdf
Copyright © 2012, Oracle and/or its affiliates. All rights reserved.44
howto/ASHUKOUGJuly2010GW.pdf
� Doug Burns’ Oracle Blog
– http://oracledoug.com/serendipity/index.php?/plugin/tag/ASH
� Introduction to DBMS_XPLAN
– http://www.go-faster.co.uk/Intro_DBMS_XPLAN.ppt

Further Reading
� Practical use of Active Session History
� With examples drawn from PeopleSoft
– http://www.go-faster.co.uk/ukougpres.htm #Practical_ASH.ppt
Copyright © 2012, Oracle and/or its affiliates. All rights reserved.45
– http://www.go-faster.co.uk/Practical_ASH.pdf

PeopleTools Traces and Logging
Copyright © 2012, Oracle and/or its affiliates. All rights reserved.46

Traces
� PeopleTools SQL Trace
– TraceMagic - MOS Docid
(1470578.1)
� Application Server Logs
� Diagnostic
– Large Files
– Difficult to extract
performance metrics
Copyright © 2012, Oracle and/or its affiliates. All rights reserved.47
– LogFence=4
– PSWATCHSRV log (if
logfence is 4)
– Timing Inaccuracies
– Incomplete
– Measurement Intrusion
Batch Timings Reports
� Application Engine and COBOL
– Time spent in each step
– AE can write this to database
Copyright © 2012, Oracle and/or its affiliates. All rights reserved.48
– Can get negative numbers in some Tools releases
� Only ever one, can get around this with some arithmetic.

Web Server Access Log
� Logs every request
– Large files
– Time taken for every request
Copyright © 2012, Oracle and/or its affiliates. All rights reserved.49
– Client IP address
� But it could just be a network component not the actual client
– Oracle Doc 662319.1

There are only two kinds of performance problems
� You are working too hard.
– Consuming resource
� CPU
� Disk
� You are being prevented from
working
– Queuing
� Database Locking
Copyright © 2012, Oracle and/or its affiliates. All rights reserved.50
� Memory � Tuxedo Queuing
� CPU overload
� …
– Waiting for somebody else
working too hard!

� It is generally better to queue higher up the stack.
– The impact of queuing in lower tiers can propagate across the system through mechanisms in higher tiers.
– Eg. While it is best not to have to queue at all, it is better to queue on the APPQ in the application server domain, than run out of CPU and queue on the operating system run queue.
– Protect lower tiers for overload by correct configuration
� But do explain this to DB/OS/disk admins!
Web
Copyright © 2012, Oracle and/or its affiliates. All rights reserved.51
Monitored System
logic)
Web
Server
(presentation
logic)
PIA
Servlet
DBMS
(application data
& meta-data
Tuxedo
Message
Browser
(presentation
& JavaScript)
Screen
Paint
Java
Script
Application
Server
(application logic)
APPQ PSAPPSRV SQLhttp /
https

Cost-Based Optimizer Statistics
Copyright © 2012, Oracle and/or its affiliates. All rights reserved.52

Cost-Based Optimizer Statistics
� Performance of SQL is a significant aspect of any OLTP system
– PeopleSoft is not an exception to this rule.
� All SQL databases* use volumetric statistics to make SQL Optimizer
⇒
Copyright © 2012, Oracle and/or its affiliates. All rights reserved.53
determine the ‘best’ execution plan.
� ⇒ You need to get your statistics right
� *at least the ones on which PeopleSoft is certified!
� But I am only going to talk about Oracle RDBMS

How should you collect Optimizer Statistics in Oracle?
� Maria Colgen and others – http://blogs.oracle.com/optimizer/
– CON8457 - Oracle Database Optimizer: An Insider’s View of How the Optimizer Works
– CON8455 - Oracle Database Optimizer: Harnessing the Power of Optimizer Hints
– CON3053 - Get Proactive: Best Practices—SQL Tuning Made Easier with SQLTXPLAIN (SQLT)
� Jonathan Lewis - http://jonathanlewis.wordpress.com/
Copyright © 2012, Oracle and/or its affiliates. All rights reserved.54
� Jonathan Lewis - http://jonathanlewis.wordpress.com/
– CON2803 - The Evolution of Histograms in Oracle Database
� Christian Antognini - http://www.antognini.ch/blog/
– CON3330 - How the Query Optimizer Learns from Its Mistakes
� Wolfgang Breitling - http://www.centrexcc.com
– Tuning by Cardinality Feedback

How should you collect Optimizer Statistics in Oracle?
� Tell the Optimizer the truth about your data.
– Or at least as much of the truth as it needs to make the right answer.
– Making it handle too much of the truth can be prejudicial without being
probative.
Copyright © 2012, Oracle and/or its affiliates. All rights reserved.55
probative.
� Data in Table has a lifecycle
– Create/Change/Delete data,
– Collect Statistics
– Use it

What does Oracle do by default?
� Oracle collects statistics in the maintenance window
– 10pm-6am weekdays, and weekends
� Collects statistics on stale objects
Copyright © 2012, Oracle and/or its affiliates. All rights reserved.56
– Automatically determines optimal sample size for collecting statistics
– Automatically determines whether data is sufficiently skewed to require
histograms.

Implications for PeopleSoft of Default Oracle Behaviour � PeopleSoft is parse intensive.
– Literal values in dynamic SQL
– Non-use of ReUseStatement in Application Engine
– %ProcessInstance and similar macros always resolve to literals
– Temporary Record corresponds to many tables.
Copyright © 2012, Oracle and/or its affiliates. All rights reserved.57
– Non-sharable SQL
� Skewed Data
– Default values to avoid NULL
� 0, single space, 1st January 1900.
� Excessive histogram generation
� Processing histograms adds to parse overhead.

New Optimizer Features in 11g� Table Preferences
– Default dbms_stats options at table level
� CASCADE
� DEGREE
� ESTIMATE_PERCENT
– However, there are 11g features that only work properly with automatic sample size.
� GRANULARITY
Copyright © 2012, Oracle and/or its affiliates. All rights reserved.58
� GRANULARITY
� INCREMENTAL
� METHOD_OPT
– Can control histogram collection
� STALE_PERCENT
– Control when statistics are refreshed
– Set these, and you can safely use standard, default approaches to maintaining statistics with
PeopleSoft.

%UpdateStats macro� DDL Model calls dbms_stats.gather_table_statistics
– In 11g, can remove most parameters and use table preferences to control the behaviour of DBMS_STATS.
– This applies to whenever statistics are collected.
� There can still be a case for intercepting calls from %UpdateStats to dbms_stats with custom PL/SQL package.
– Some processes make excessive use of %UpdateStats
� eg. TL_TIMEADMIN
– Statistics collection can be a significant overhead during batch processing.
Copyright © 2012, Oracle and/or its affiliates. All rights reserved.59
– Sometimes an process may call %UpdateStats on a permanent table. If that table is large then incremental difference small. Might only want to collect statistics if sufficient change, ie statistics are STALE.
– Fine grain control over %UpdateStats can be very useful.
� NB: Default Oracle Statistics History Retention policy is 31 days.– Every %UpdateStats call generates history
– http://blog.psftdba.com/2009/06/oracle-10g-statistics-history-retention.html
GFCPSSTATS11 Package
� Hold table preferences on meta-data table keyed on RECNAME
– DDL Trigger to set table preferences as table created
– DML Trigger to set table preferences when metadata changed.
� DDL model also calls GFCPSSTATS11 package
– Via meta-data, can suppress call to dbms_stats
Copyright © 2012, Oracle and/or its affiliates. All rights reserved.60
– Via meta-data, can suppress call to dbms_stats
– Or only collect statistics if ‘stale’.
� So, no PeopleSoft application code change required.
– Force collection of locked statistics
– Catch exception when attempt to update locked statistics
©2012 www.go-faster.co.uk

Temporary Records
� No point collecting statistics during maintenance window.
� Truncated at start of AE
– Truncate doesn’t clear statistics!!!
� Can only collect accurate statistics during process
Copyright © 2012, Oracle and/or its affiliates. All rights reserved.61
� Can only collect accurate statistics during process
– %UpdateStats macro
� Recommendation:
– Lock and Delete Optimizer Statistics
– OPTIMIZER_DYMANIC_SAMPLING=4

MOS Document References
• SQLT – [ID 215187.1]
• Useful for detailed performance analyses of individual SQL statements
• OOW2012 - CON3053 Get Proactive: Best Practices—SQL Tuning Made
Easier with SQLTXPLAIN (SQLT)
Monitoring and Analysis
Copyright © 2012, Oracle and/or its affiliates. All rights reserved.62
Easier with SQLTXPLAIN (SQLT)
• OS Watcher Black Box – [ID 301137.1]
• Automates collection of OS-Level performance and diagnostic metrics
• Extensible scripting can include application-specific information. (stay
tuned)

Further Reading
� http://blog.psftdba.com
� www.go-faster.co.uk
Copyright © 2012, Oracle and/or its affiliates. All rights reserved.63
Tuxedo Application Server Sizing
Copyright © 2012, Oracle and/or its affiliates. All rights reserved.64
Application Server Sizing
� How many server processes should I configure?
– It is very hard to answer that question with a simply numeric answer.
– Not too many.
Copyright © 2012, Oracle and/or its affiliates. All rights reserved.65
– Not too few.
– It depends!

Application Server Sizing
� Too Few?
– Queuing
– All servers busy
� Too Many?
– Run out of memory/CPU
� Paging to disk
� Queue on run queue
Copyright © 2012, Oracle and/or its affiliates. All rights reserved.66
– >= 10 per queue
� IPC Queue Contention
– Overload database causing
Application Server to back up

Detecting Application Server Queuing
� Queuing not reported in PPM
due to bug
� Look instead at
– application server process
service status
� Interrogate Tuxedo domain
directly with tmadmin CLI with
shell/batch script.
– See http://www.go-
faster.co.uk/scripts/tuxmon.zi
Copyright © 2012, Oracle and/or its affiliates. All rights reserved.67
service status
� Event 302
– spawning.
� Following chart derived
from this data
faster.co.uk/scripts/tuxmon.zi
p

Application Server Processes by Service
Copyright © 2012, Oracle and/or its affiliates. All rights reserved.68
Application Server Spawning
� Spawning for enabled when Min servers<Max servers
– For PSAPPSRV, PSQRYSRV, PSBRKHND, PSSUBHND, PSPUBHND
� Idea is to adjust number of servers dynamically to meet the demand
� Spawning gets a bad press because
Copyright © 2012, Oracle and/or its affiliates. All rights reserved.69
– Number of Min/Max servers not correctly configured
– Fallacious belief that application server queuing is universally bad
� It isn’t. It can be the least worst option.
– Excessive spawning/recycling is a problem

Recycle Count
� PSAPPSRV
– Historically, the delivered value has varied between 1000 and 10000 in different
versions of PeopleTools
– It used to be used as a coarse method of controlling memory consumption of
application server processes
– More effective to use MaxCacheMemory >= 500Mb
Copyright © 2012, Oracle and/or its affiliates. All rights reserved.70
� PSQRYSRV
– Entire query results sets copied into memory
– A lower recycle count can be used to release memory
� Particularly on Windows
� Further Reading
– Document ID 1457385.1

Application Server Sizing
� Understand process types and avoid creating things that you don’t
need!– PSSAMSRV – Only one or two are ever needed .
– PSQCKSRV – Only used by for 3-tier Application Designer sessions (and
then only optional)
Copyright © 2012, Oracle and/or its affiliates. All rights reserved.71
then only optional)
� Ensure enough connections are available
– Turning off Jolt Pooling will require more JSHs
� Understand Application Server Memory Usage
– My Oracle Support - Document ID 1457385.1

Avoiding Contention Tuxedo Queues
� Contention on IPC queues occurring if messages on queue and not all
servers busy
� Recommendation
Copyright © 2012, Oracle and/or its affiliates. All rights reserved.73
– No more than 10 server processes/queue
– The only fully supported option is to create multiple domains
� Each with a single queue.
– There are other options, but they are not fully supported by Oracle GCS.

Unix IPC Message Sizing
� (This affects windows too!)
� PeopleSoft Tuxedo Messages typically around 100-120Kb
– Default message size 64Kb (except AIX)
– Messages larger than max message size (default ¾ queue size) written to and read from disk
– Messages that ¾ fill queue also written to disk
� General Recommendation
Copyright © 2012, Oracle and/or its affiliates. All rights reserved.74
� General Recommendation
– Set queue size 256Kb
� Although, this will consume more shared memory.
� ipcs shows queues that Tuxedo PrintQueue doesn’t!
– Set maximum message size 128Kb
� Large PS/Query results will still ping to disk and there is nothing you can do about it

100,000
1,000,000
10,000,000
Jolt M
essage S
ize (byte
s)
JOLT_BYTES_SEND JOLT_BYTES_RCVD
Copyright © 2012, Oracle and/or its affiliates. All rights reserved.75
1,000
10,000
100,000
0 10 20 30 40 50 60 70 80 90 100
%Tile
Jolt M
essage S
ize (byte
s)

Application Server – Integration Broker Considerations (Asynch)
� Isolate PUB/SUB processes by dedicating one or more domains to IB.
� DO NOT allow multiple domains to concurrently process the same
service operations
Copyright © 2012, Oracle and/or its affiliates. All rights reserved.76
– For domain failover, use IB failover groups
– For further isolation, use dedicated dispatchers
– To Scale, use slave or template slave dispatchers
� PeopleSoft Integration Performance and Tuning for PeopleTools 8.50 [ID
1169053.1]

Integration Broker Monitoring
� Integration Broker Service Operations Monitor
� IB Profiling – runtime performance detail for both Synch and Asynch
operations
Copyright © 2012, Oracle and/or its affiliates. All rights reserved.77
– Enable at both the Integration Gateway and Application Server
– Navigation: PeopleTools->Integration Broker->Service Operations Monitor-
>Statistics
©2012 www.go-faster.co.uk

Further Reading
� Application Servers
– E-AS: Understanding memory usage and associated settings in
PSAPPSRV processes [ID 1457385.1]
– E-PIA: PeopleTools 8.5x Timeout Settings - Guidelines for Setting Timeout
Values and Troubleshooting Timeout-Related Issues [ID 1470518.1]
Copyright © 2012, Oracle and/or its affiliates. All rights reserved.78
Values and Troubleshooting Timeout-Related Issues [ID 1470518.1]
� PeopleSoft for the Oracle DBA
– Chapter 13
� Tuxedo Internals
� This presentation from 2002 is based on PT7.5x
– http://www.go-faster.co.uk/bea_internals.pps

Web Server Sizing & Configuration
Copyright © 2012, Oracle and/or its affiliates. All rights reserved.79
Web Server Characteristics
� Primary purpose is serialization/deserialization to build and serve
presentation to browsers
� Maintains user session state
Copyright © 2012, Oracle and/or its affiliates. All rights reserved.80
� Tuning mostly involves correctly sizing the JVM.
� Scale horizontally by adding web instances

Web Server Sizing
� Tuning goal is to properly size JVMs, allowing for enough user
sessions without extensive GC pauses.
� JVM size is set with Java start-up options
(-Xmx, -Xmn)
� Try to keep JVM size between 512M and 2048M (depends on which
JRE).
Copyright © 2012, Oracle and/or its affiliates. All rights reserved.81
JRE).
� Watch out for native heap (-Xss to reduce thread stack size if
necessary)
� Native heap limitations largely a non-issue in PT 8.51+ (64-bit
addressing)
� Use verbose GC logging to monitor the Garbage Collector

Web Server Logging
� GC logging
(-verboseGC –XX:+PrintGCDetails -XX:+PrintGCTimeStamps)
– Provides timing and frequency of Java VM Garbage Collection cycles
Copyright © 2012, Oracle and/or its affiliates. All rights reserved.82
– Useful for evaluating Java Heap sizing under load.

Web Server Configuration
� Timeouts can drastically affect Web Server performance and scalability
� Web Profile Cache settings and Timeouts are important
– Saved States, State Discard Interval, Home Page Stale Interval
Copyright © 2012, Oracle and/or its affiliates. All rights reserved.83
� Consider a dedicated Web Instance for Integration Broker Gateway
– Things like session affinity and Http keepalives don’t matter as much as for
the IB Gateway.

Further Reading
� Web/Network Infrastructure
Copyright © 2012, Oracle and/or its affiliates. All rights reserved.84
– E-PIA: Red Paper On Implementing Clustering And High Availability For
PeopleSoft [ID 612096.1]
Conclusion
� It depends…
Copyright © 2012, Oracle and/or its affiliates. All rights reserved.85

Copyright © 2012, Oracle and/or its affiliates. All rights reserved.86
QUESTION TIMENullius in verba

Copyright © 2012, Oracle and/or its affiliates. All rights reserved.87

Copyright © 2012, Oracle and/or its affiliates. All rights reserved.88