Embed Size (px)
Citation preview

1
DEATH and DESTRUCTION from HURRICANES in the 21st CENTURY
Hugh Willoughby, FIU E&E
National Tropical Weather Conference
9 April 2015
2
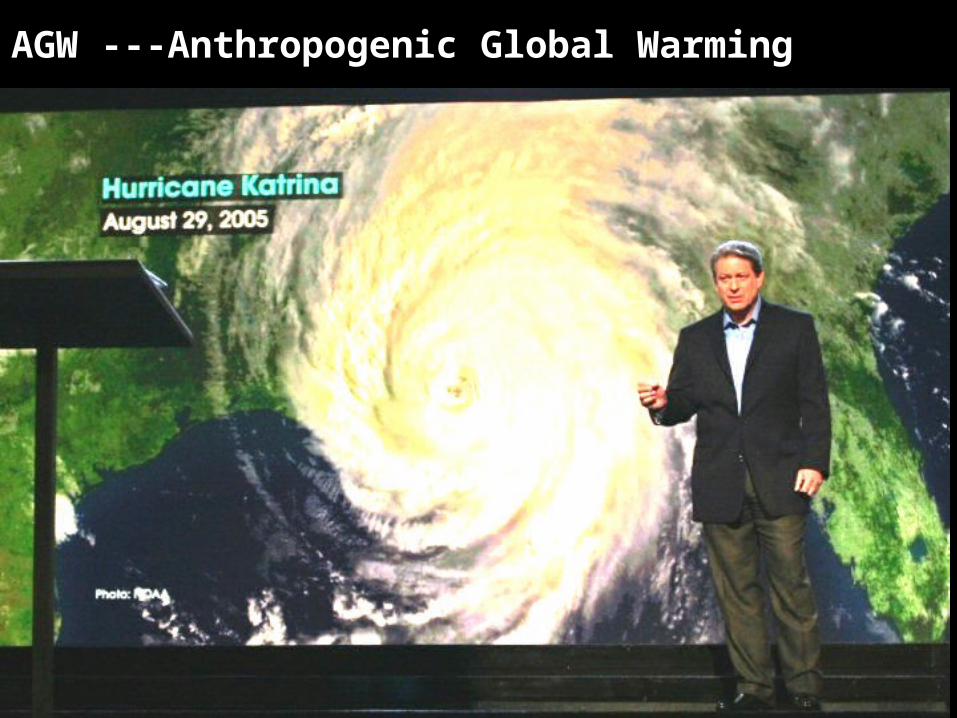
AGW ---Anthropogenic Global Warming
3
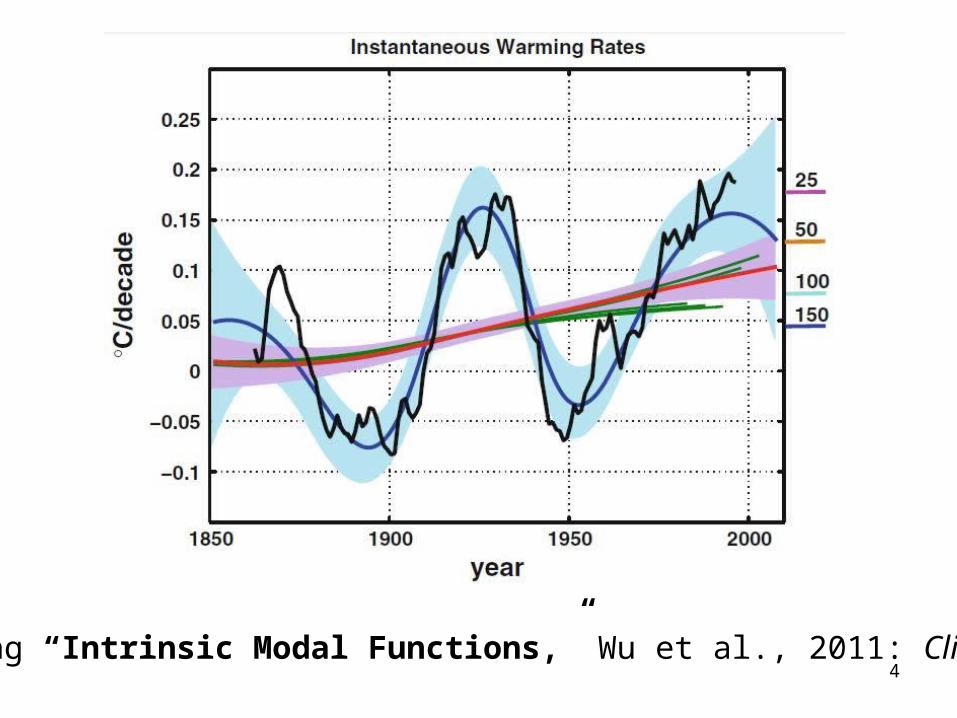
4Using “Intrinsic Modal Functions,” Wu et al., 2011: Clim. Dyn.,

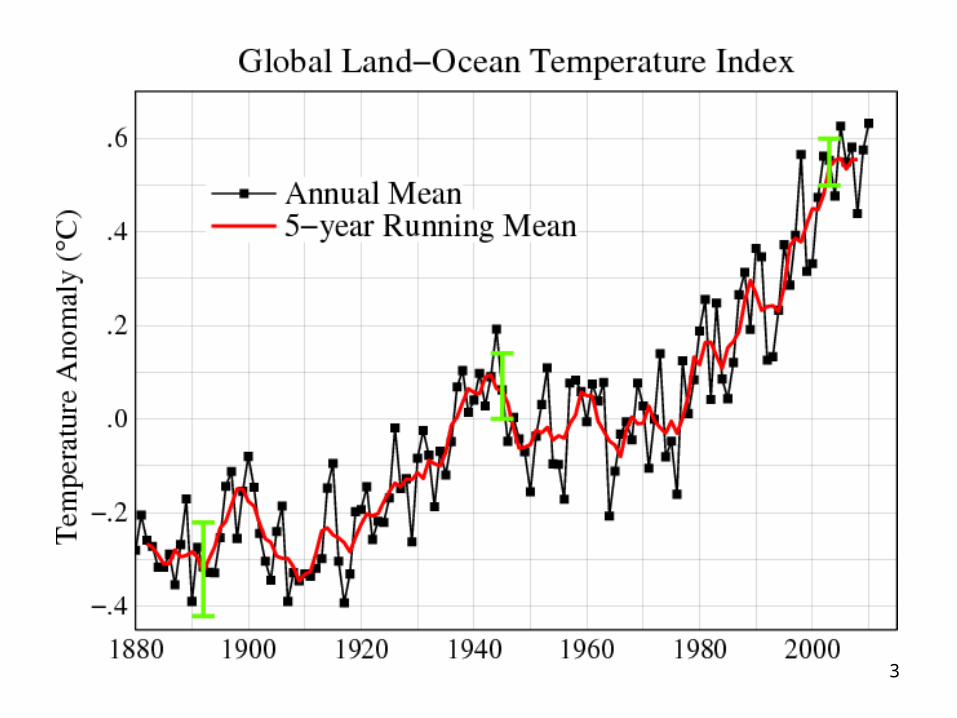
Why is AGW Credible?• 0.7oC warming since 1900
• Atmospheric CO2 increase to 400 ppm
• Melting ice and rising sea level (20 cm since 1900) are natural low-pass filters
• Well-established physical basis• Consistent (sort of…) results as the
models have improved• Counterarguments:
– Possible long-term >103 yr natural variability– Common intellectual heritage of models– Ad-hominem and economic arguments
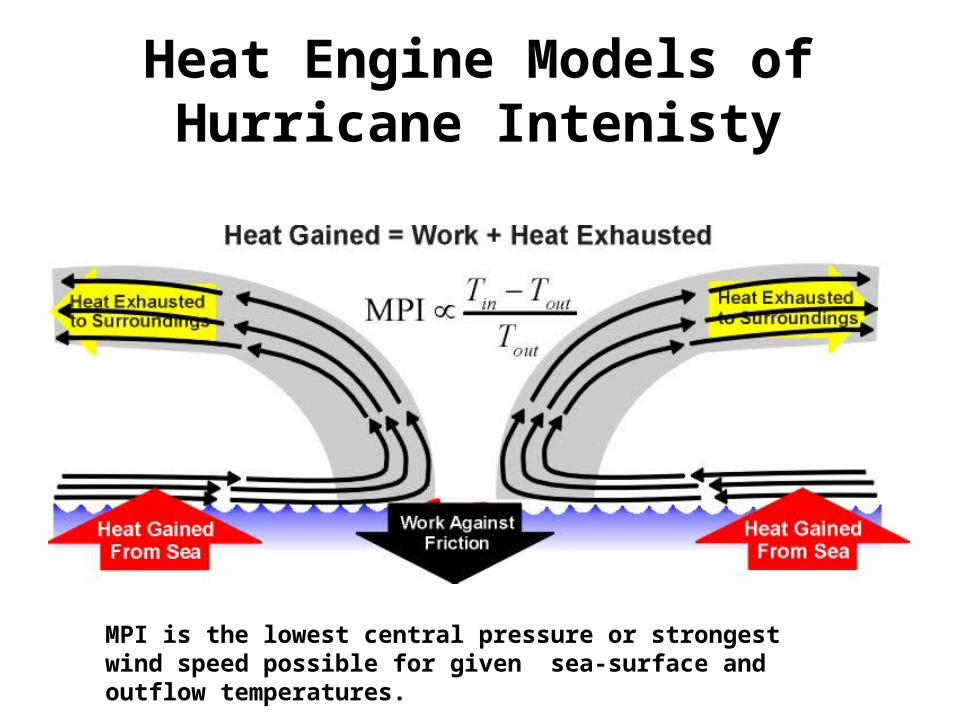
Heat Engine Models of Hurricane Intenisty
MPI is the lowest central pressure or strongest wind speed possible for given sea-surface and outflow temperatures.

Hurricane Intensity• MPI corresponds to category 5 over
most of the tropical seas during hurricane season.
• Most hurricanes don’t reach their MPI because of:– Vertical Shear of the surrounding winds– Hurricane-induced cooling of the sea– Eyewall replacement cycles– Lifecycle duration
7
8
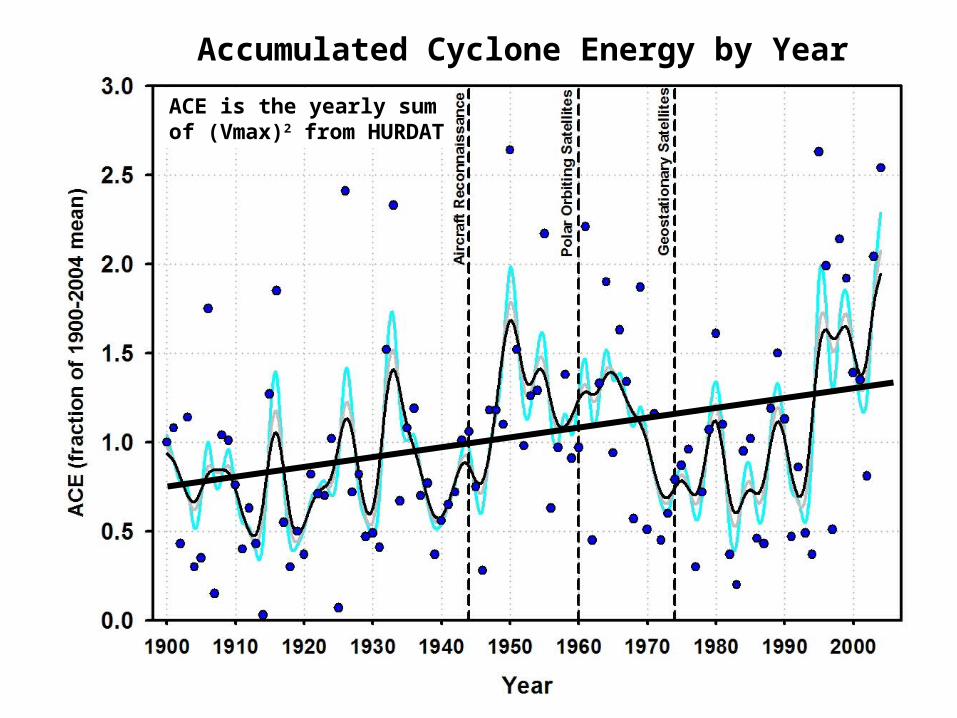
Accumulated Cyclone Energy by Year
ACE is the yearly sum of (Vmax)2 from HURDAT
9
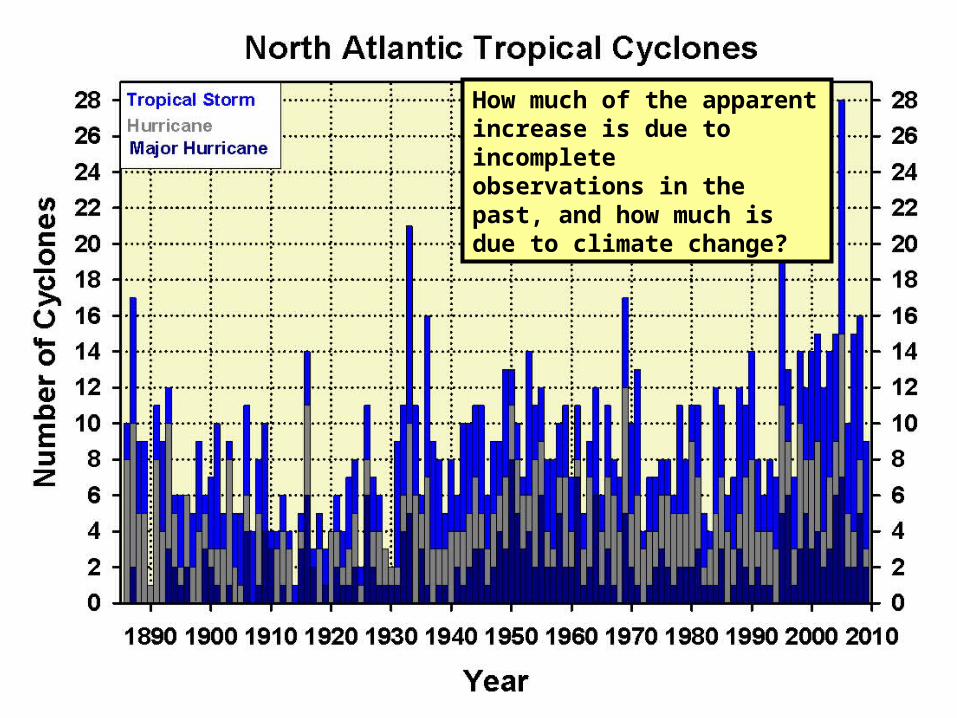
North Atlantic Tropical Cyclones
North Atlantic TCs by YearHow much of the apparent increase is due to incomplete observations in the past, and how much is due to climate change?
10
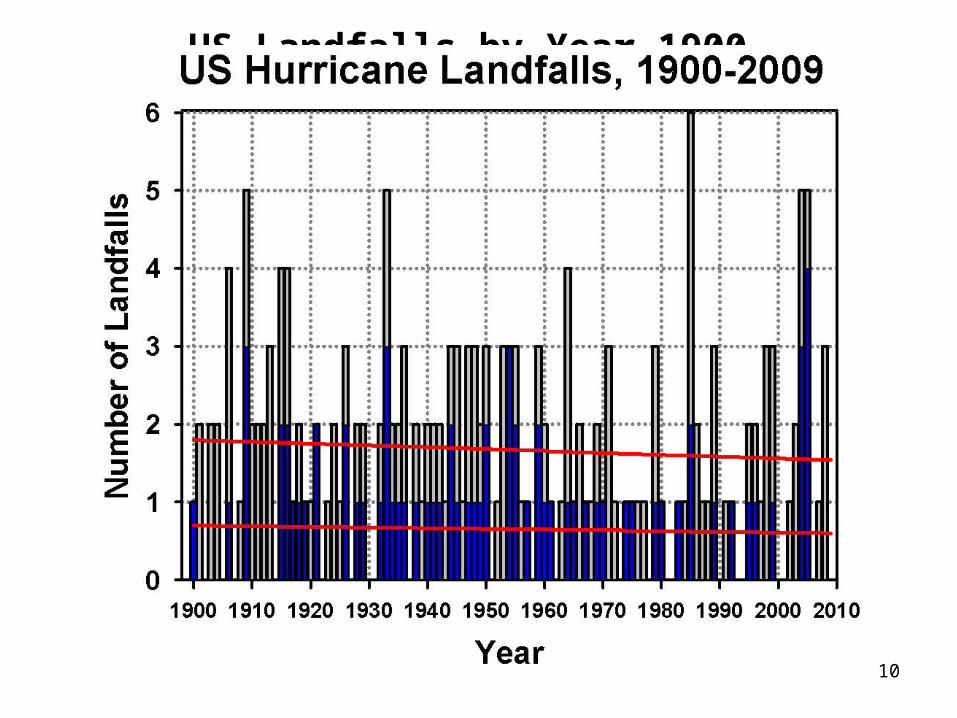
US Landfalls by Year 1900-2006
11
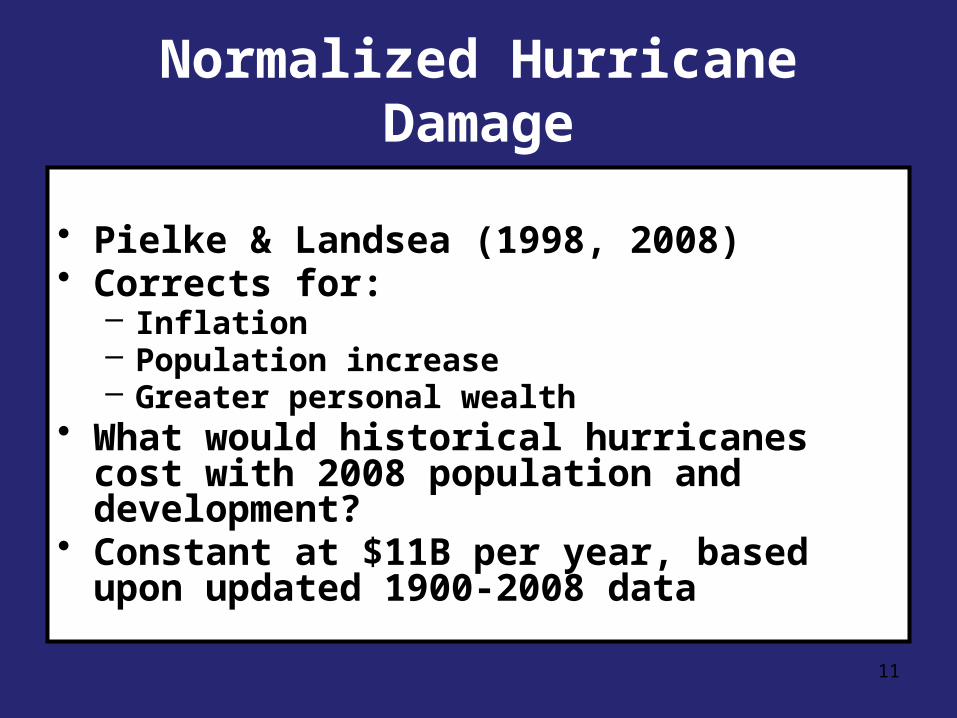
Normalized Hurricane Damage
• Pielke & Landsea (1998, 2008)• Corrects for:
– Inflation– Population increase– Greater personal wealth
• What would historical hurricanes cost with 2008 population and development?
• Constant at $11B per year, based upon updated 1900-2008 data
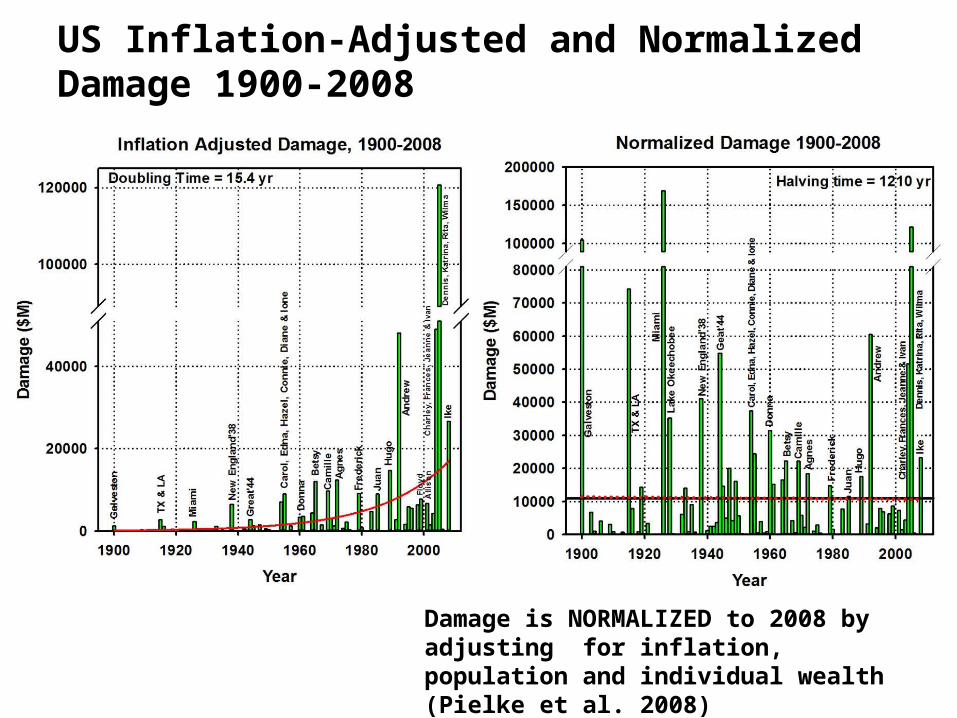
Damage is NORMALIZED to 2008 by adjusting for inflation, population and individual wealth (Pielke et al. 2008)
US Inflation-Adjusted and Normalized Damage 1900-2008

Deaths 1900-2005
Respite 1970-2003
Deaths 1900-2008
Better Forecasts & Communications!
Year-to-Year Variations of Hurricane Numbers and
Intensities:• Apparent increase due to data issues before 1944 (or
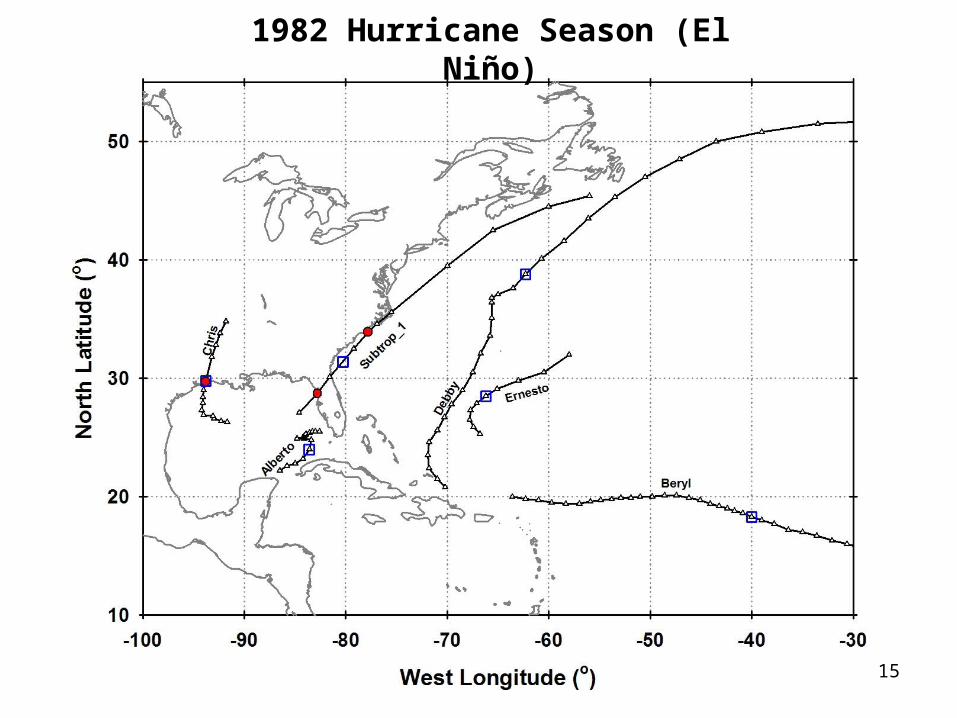
perhaps 1960 or 1974) • El Niño—Warming of the equatorial Pacific that
increases shear over the topical Atlantic every 3-5 years
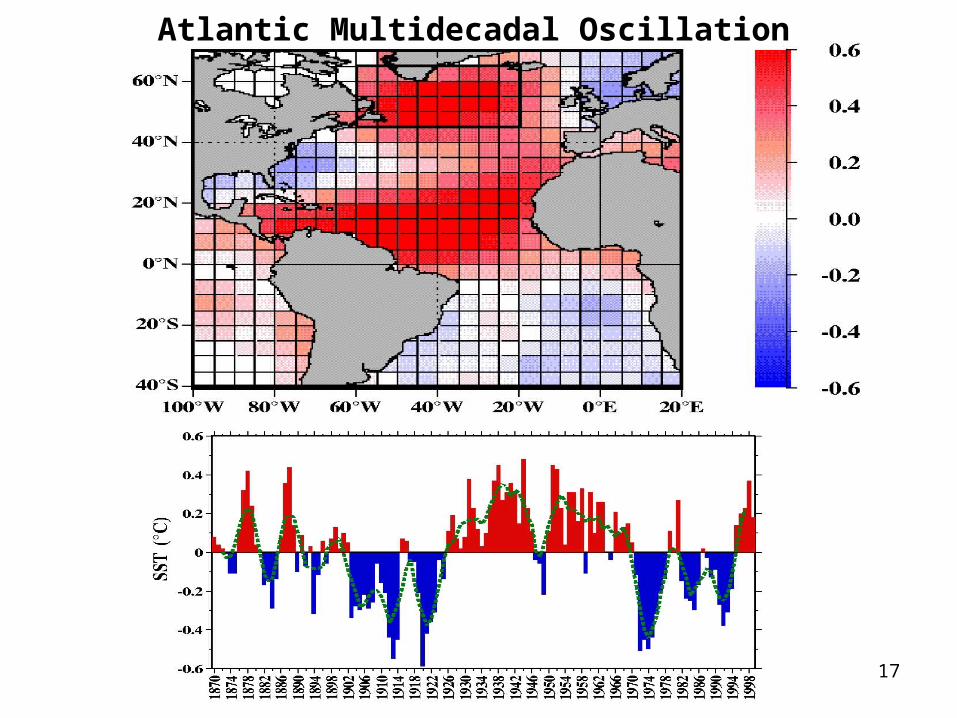
• Atlantic Multi-Decadal Oscillation:– Warm phase---weaker shear, more hurricanes– Cool phase---stronger shear, fewer hurricanes
• Anthropogenic Global Warming– Stronger MPI, but….– Probably more shear, too
• Chance---more about chance later
15
1982 Hurricane Season (El Niño)

16
(La Niña)
17
Atlantic Multidecadal Oscillation
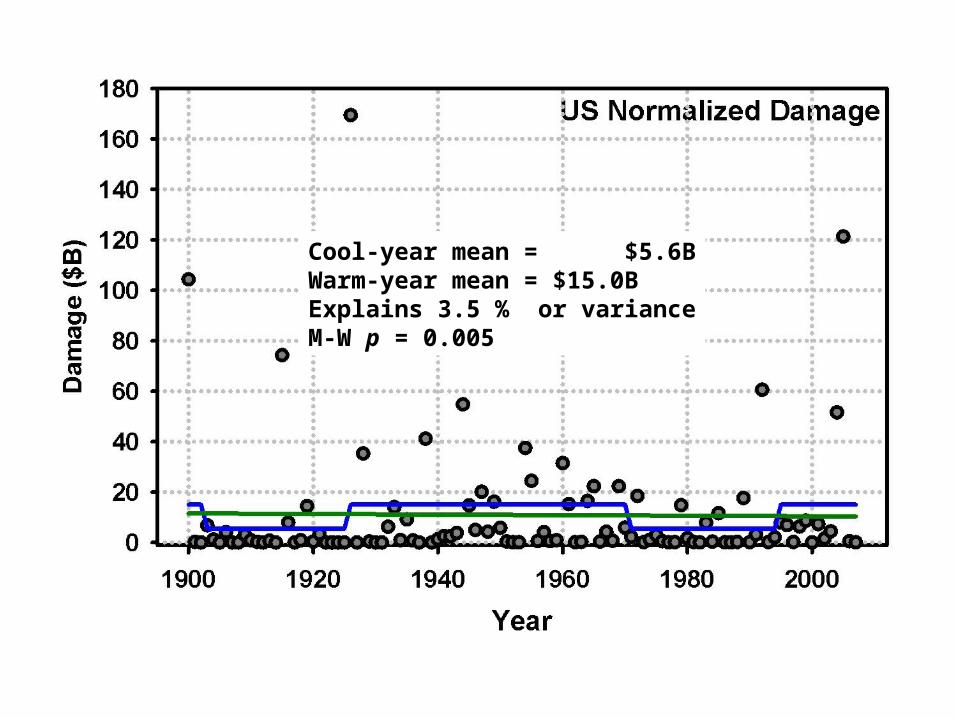
Cool-year mean = $5.6BWarm-year mean = $15.0BExplains 3.5 % or varianceM-W p = 0.005
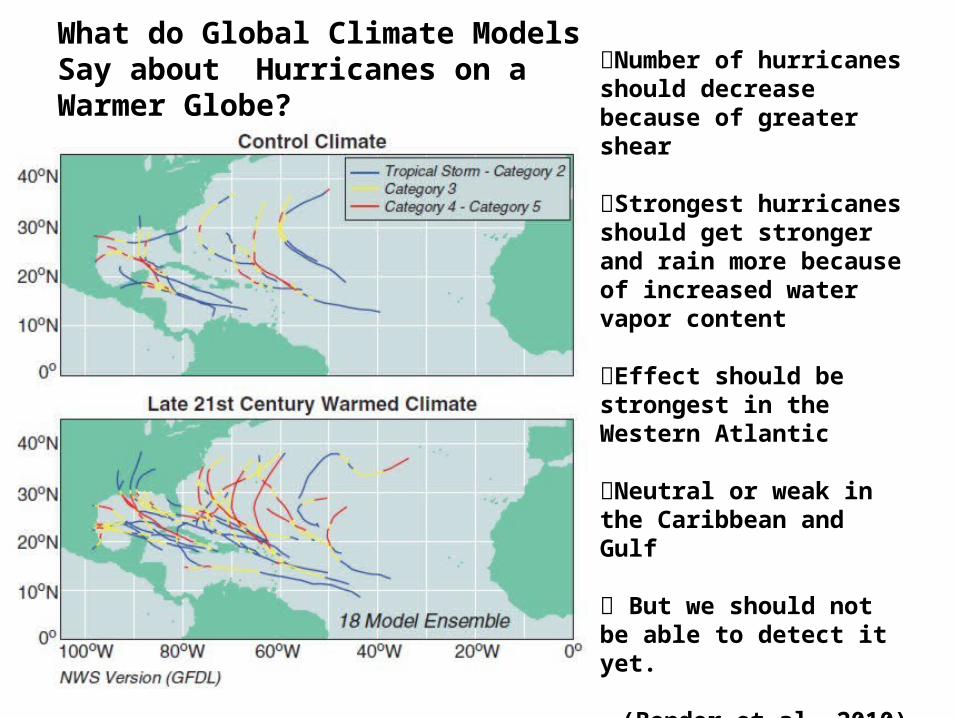
What do Global Climate Models Say about Hurricanes on a Warmer Globe?
Number of hurricanes should decrease because of greater shear
Strongest hurricanes should get stronger and rain more because of increased water vapor content
Effect should be strongest in the Western Atlantic
Neutral or weak in the Caribbean and Gulf
But we should not be able to detect it yet.
(Bender et al. 2010)

20Emanuel (2013), using a different downscaling
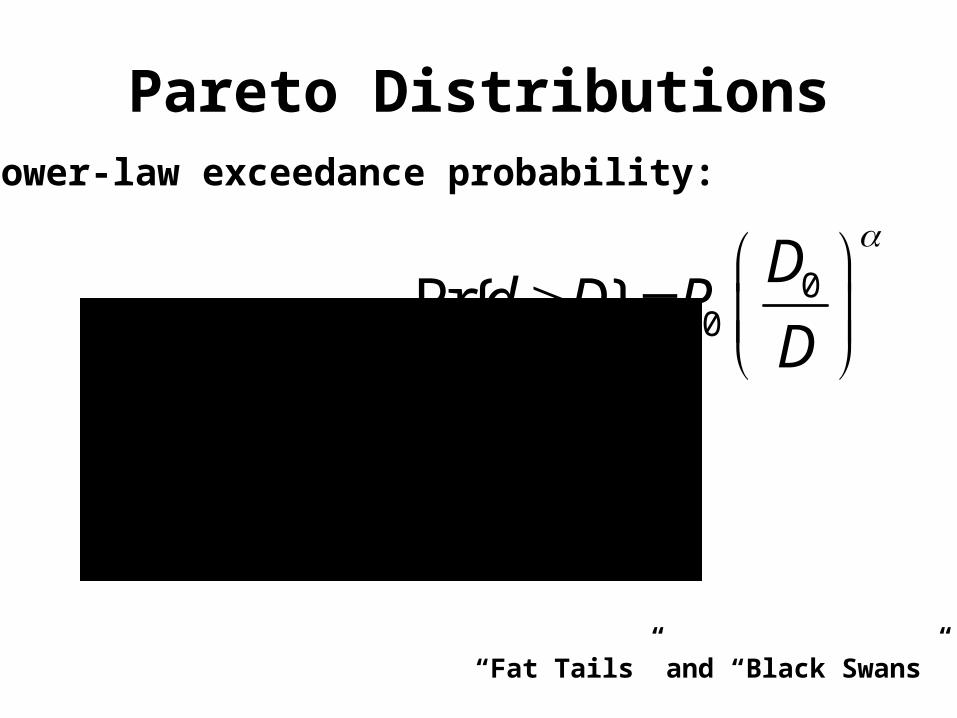
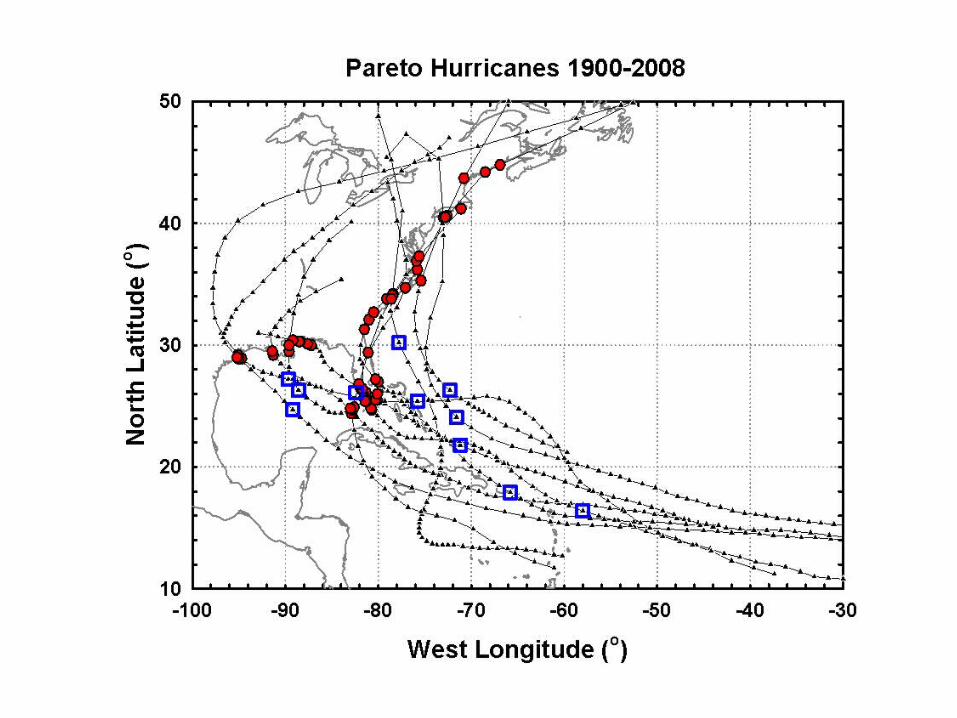
Pareto Distributions
00Pr{ }
Dd D P
D
Power-law exceedance probability:
“Fat Tails” and “Black Swans”
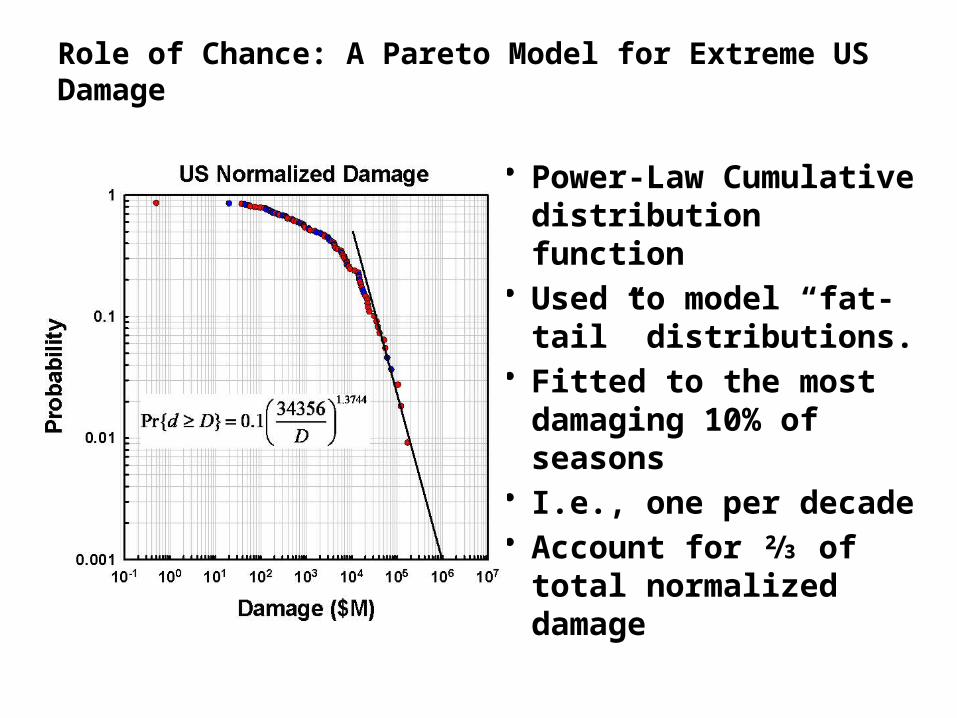
Role of Chance: A Pareto Model for Extreme US Damage
• Power-Law Cumulative distribution function
• Used to model “fat-tail” distributions.
• Fitted to the most damaging 10% of seasons
• I.e., one per decade• Account for ⅔ of total
normalized damage
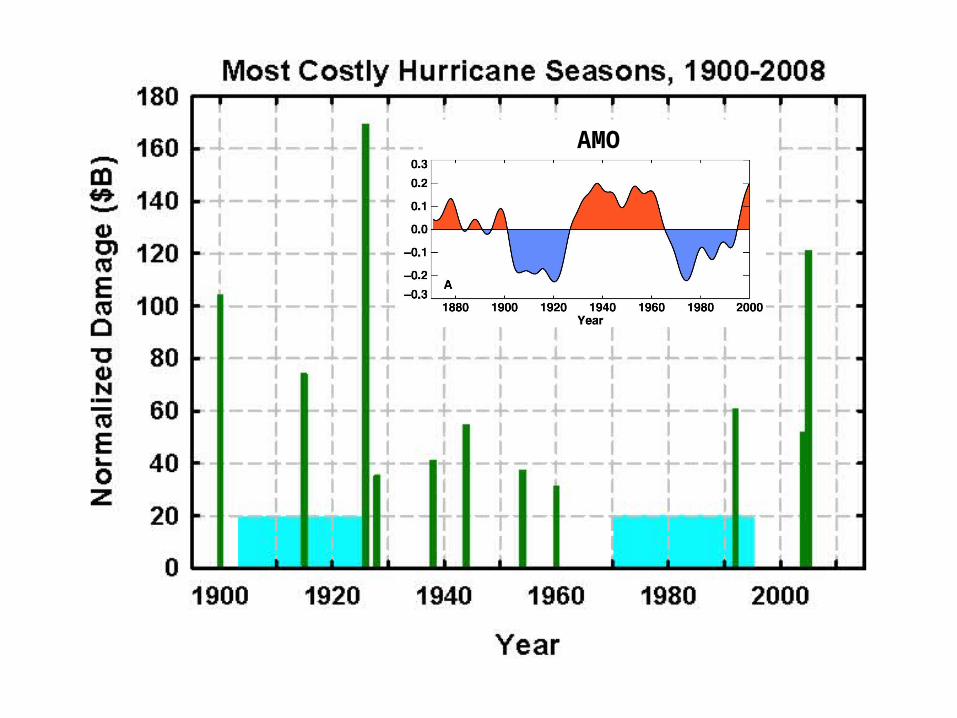
AMO
25
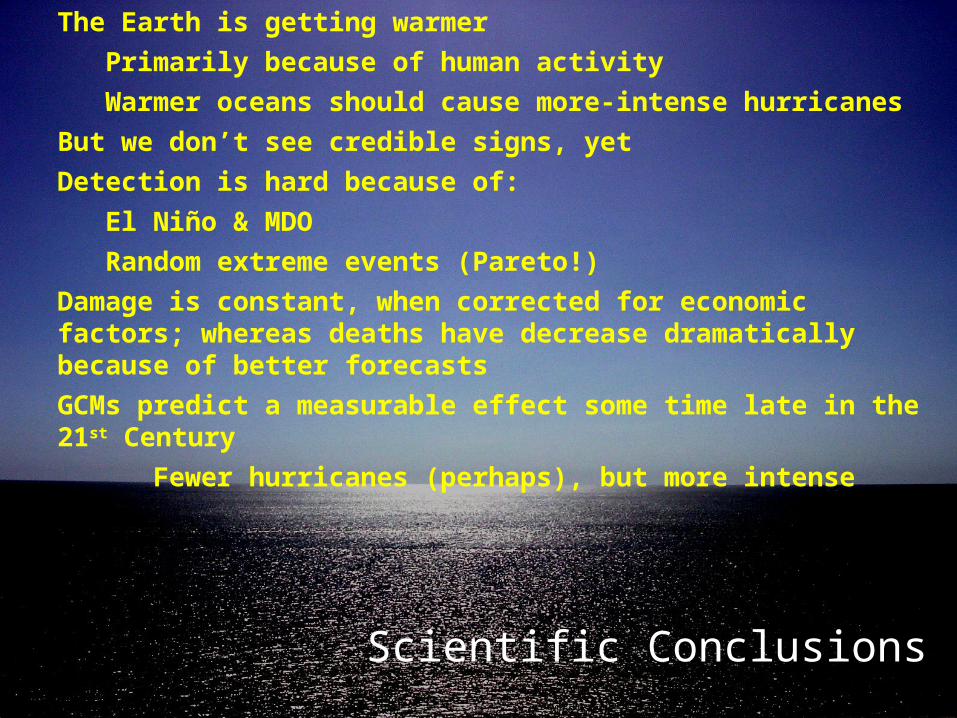
The Earth is getting warmer
Primarily because of human activity
Warmer oceans should cause more-intense hurricanes
But we don’t see credible signs, yet
Detection is hard because of:
El Niño & MDO
Random extreme events (Pareto!)
Damage is constant, when corrected for economic factors; whereas deaths have decrease dramatically because of better forecasts
GCMs predict a measurable effect some time late in the 21st Century
Fewer hurricanes (perhaps), but more intense
Scientific Conclusions
Thank you for your attention.
Questions?