Embed Size (px)
Citation preview
1
Direct Farm Fuel Expenses, Results from a Large Farm Survey
Robert W. DubmanSurvey and Data Coordinator
USDA/Economic Research Service
2
Which farms are most vulnerable from rising prices
of fuels? • Direct immediate impact• Excludes effects on fertilizer
expenses or other inputs• Excludes product price changes• Assumes farmers may be
purchasing in bulk or from cooperatives
3
USDA’s Agricultural Resource Management
Survey (ARMS)• Roughly 10,000 samples
annually• Phase III
–Collects farm financial data–Produces Income statements, balance sheets, and measures of financial performance
–Personally enumerated
4
Details asked in most years Gasoline Diesel Natural gas LP gas Other fuels Electricity
Questions on whole farm fuel expenses asked annually
5
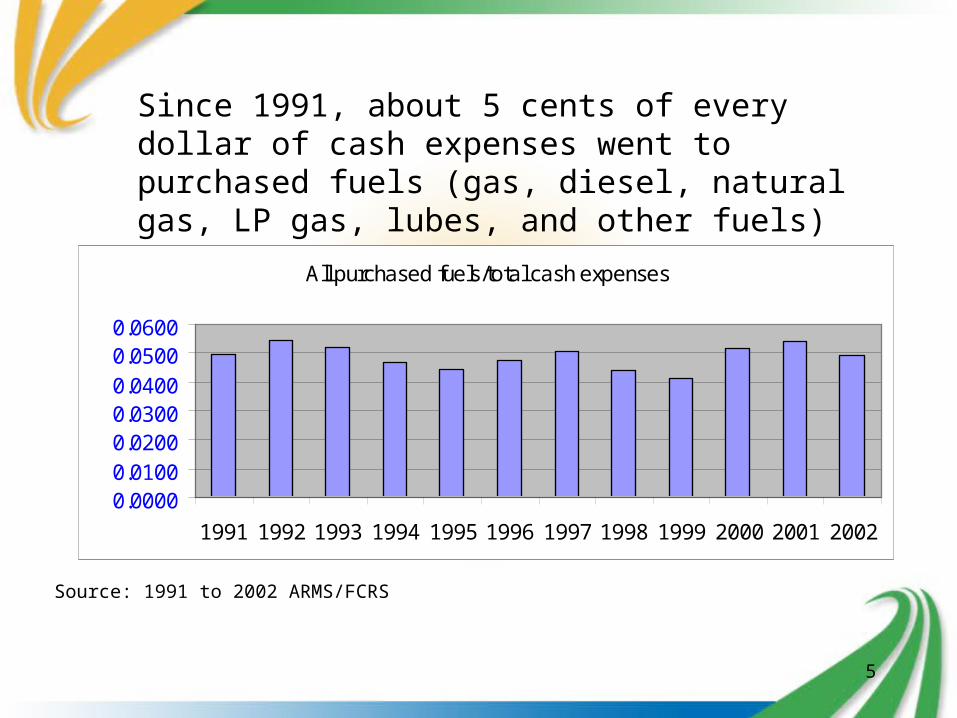
All purchased fuels/total cash expenses
0.0000 0.0100 0.0200 0.0300 0.0400 0.0500 0.0600
1991 1992 1993 1994 1995 1996 1997 1998 1999 2000 2001 2002
Since 1991, about 5 cents of every dollar of cash expenses went to purchased fuels (gas, diesel, natural gas, LP gas, lubes, and other fuels)
Source: 1991 to 2002 ARMS/FCRS
6
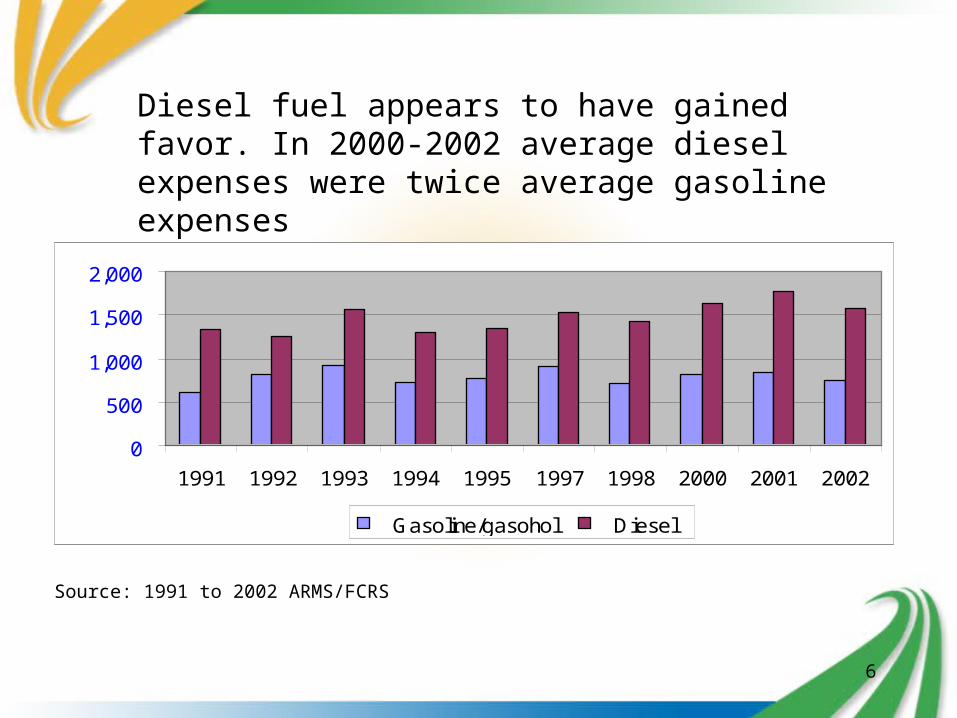
Diesel fuel appears to have gained favor. In 2000-2002 average diesel expenses were twice average gasoline expenses
Source: 1991 to 2002 ARMS/FCRS
0
500
1,000
1,500
2,000
1991 1992 1993 1994 1995 1997 1998 2000 2001 2002
Gasoline/gasohol Diesel
7
Region/StateSize of operation
Major commodity producedFarm operator typology
Survey can categorize farms many ways
8
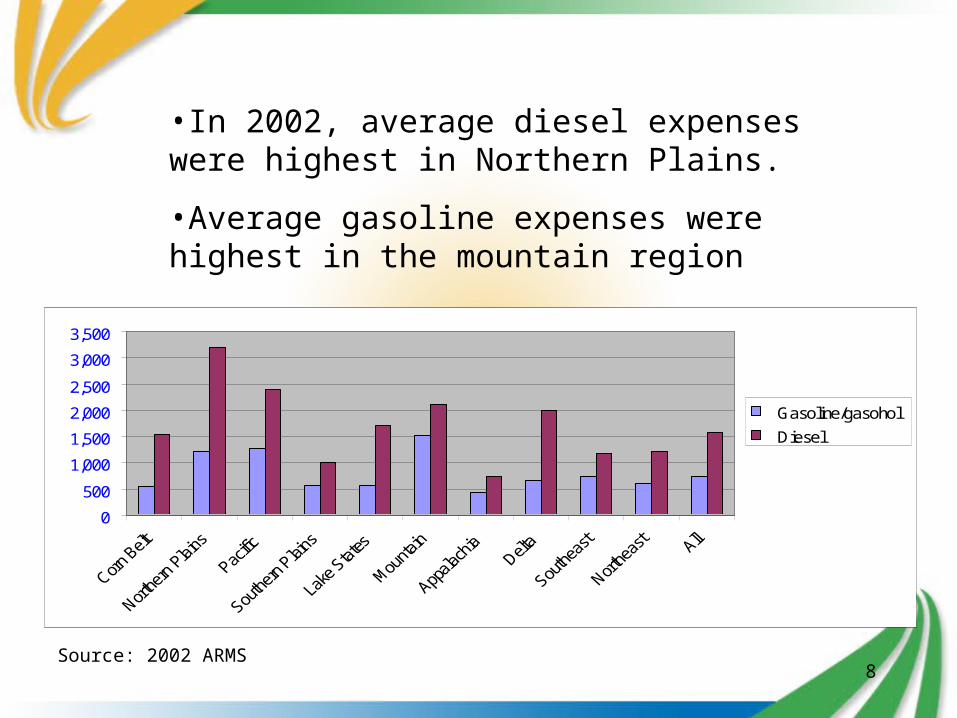
•In 2002, average diesel expenses were highest in Northern Plains.
•Average gasoline expenses were highest in the mountain region
0
500
1,000
1,500
2,000
2,500
3,000
3,500
Gasoline/gasohol
Diesel
Source: 2002 ARMS
9
0.0000 0.0050 0.0100 0.0150 0.0200 0.0250 0.0300 0.0350 0.0400 0.0450
Gasoline/total cash expenses
Diesel/total cash expenses
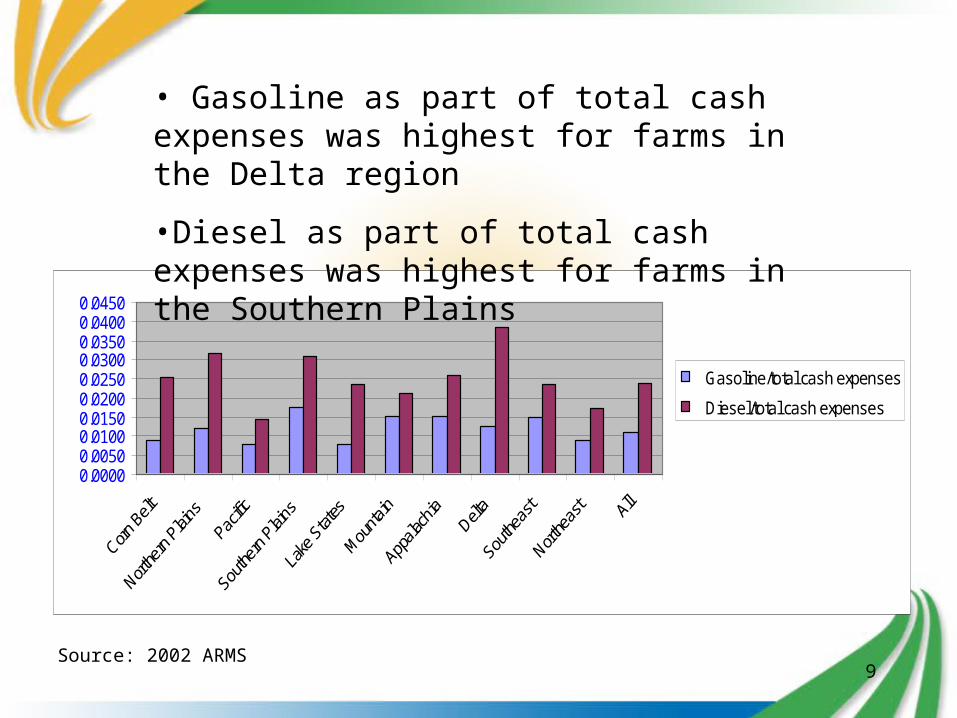
• Gasoline as part of total cash expenses was highest for farms in the Delta region
•Diesel as part of total cash expenses was highest for farms in the Southern Plains
Source: 2002 ARMS
10
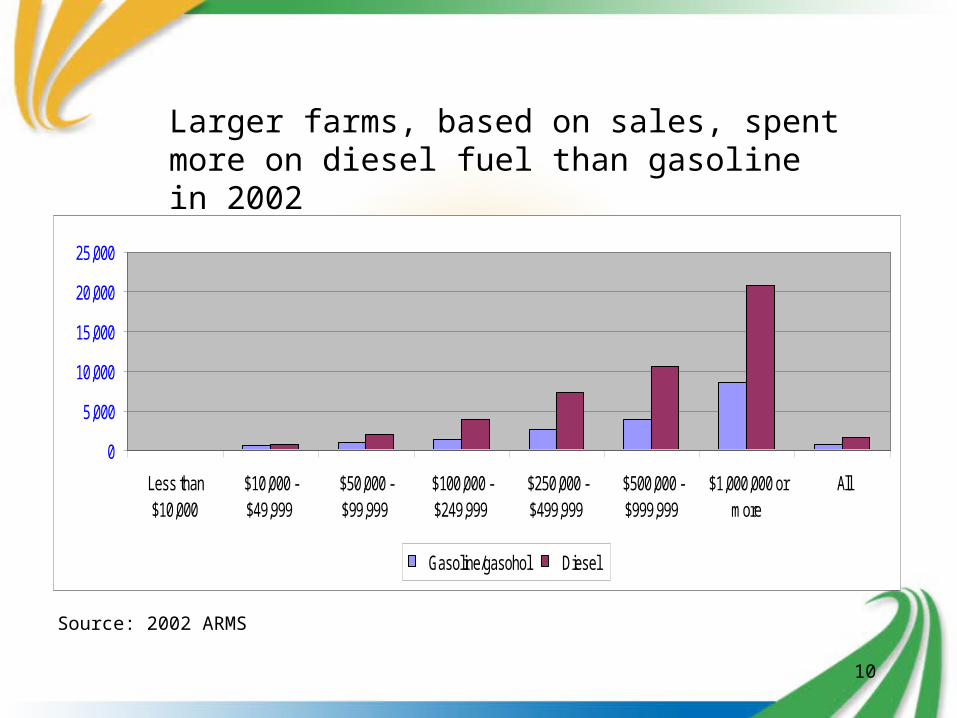
Larger farms, based on sales, spent more on diesel fuel than gasoline in 2002
0
5,000
10,000
15,000
20,000
25,000
Less than$10,000
$10,000 -$49,999
$50,000 -$99,999
$100,000 -$249,999
$250,000 -$499,999
$500,000 -$999,999
$1,000,000 ormore
All
Gasoline/gasohol Diesel
Source: 2002 ARMS
11
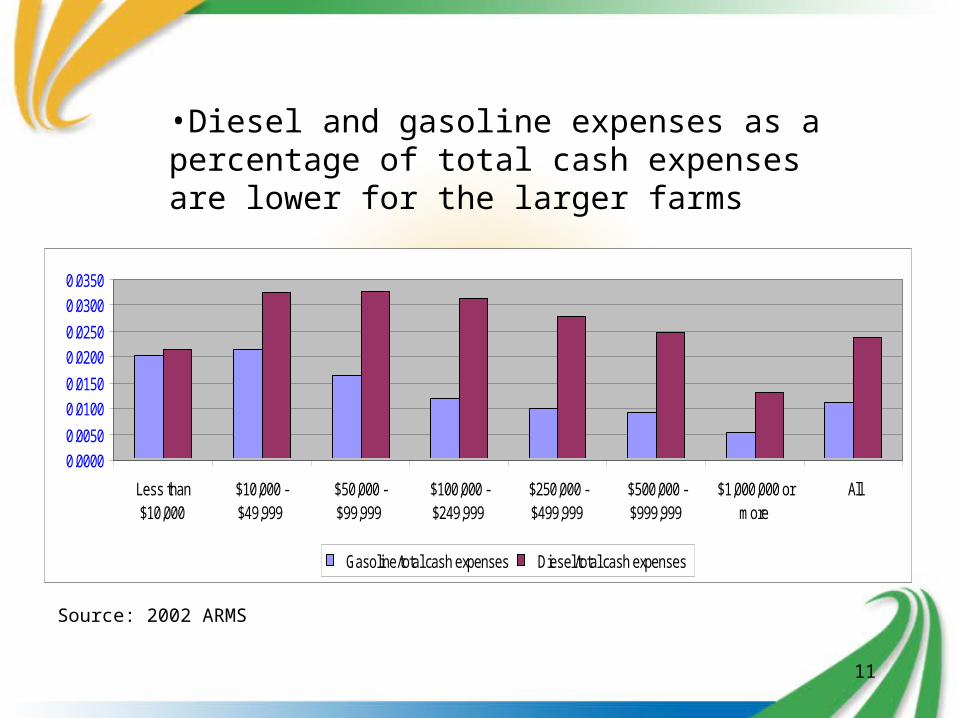
•Diesel and gasoline expenses as a percentage of total cash expenses are lower for the larger farms
0.0000
0.0050
0.0100
0.0150
0.0200
0.0250
0.0300
0.0350
Less than$10,000
$10,000 -$49,999
$50,000 -$99,999
$100,000 -$249,999
$250,000 -$499,999
$500,000 -$999,999
$1,000,000 ormore
All
Gasoline/total cash expenses Diesel/total cash expenses
Source: 2002 ARMS
12
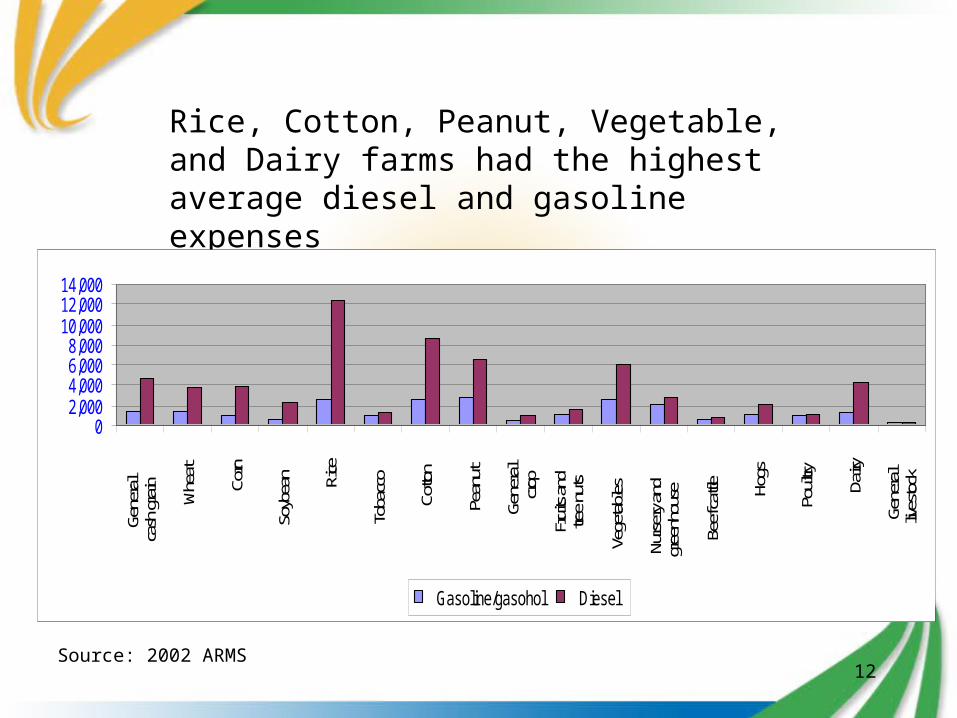
Rice, Cotton, Peanut, Vegetable, and Dairy farms had the highest average diesel and gasoline expenses
0 2,000 4,000 6,000 8,000
10,000 12,000 14,000
Gene
ral
cash
grain
Whe
at
Corn
Soyb
ean Rice
Toba
cco
Cotto
n
Pean
ut
Gene
ral
crop
Fruit
s and
tree n
uts
Vege
tables
Nurse
ry an
dgr
eenh
ouse
Beef
cattle
Hogs
Poult
ry
Dairy
Gene
ral
lives
tock
Gasoline/gasohol Diesel
Source: 2002 ARMS
13
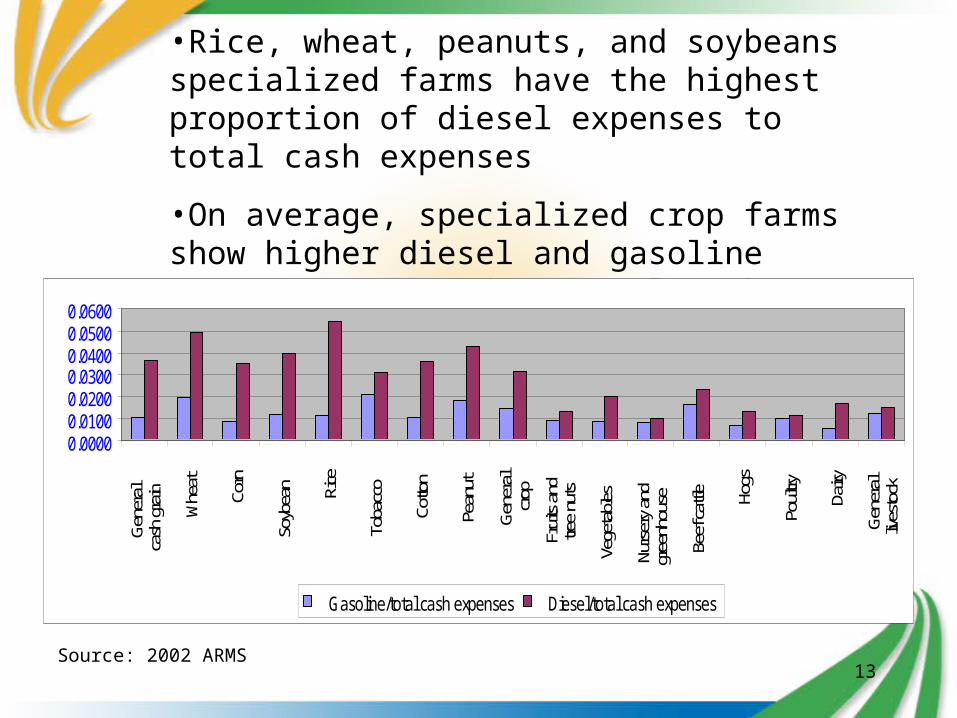
•Rice, wheat, peanuts, and soybeans specialized farms have the highest proportion of diesel expenses to total cash expenses
•On average, specialized crop farms show higher diesel and gasoline expenses compared to total cash expenses
0.0000 0.0100 0.0200 0.0300 0.0400 0.0500 0.0600
Gen
eral
cash
gra
in
Whe
at
Corn
Soyb
ean Rice
Toba
cco
Cotto
n
Pean
ut
Gen
eral
crop
Frui
ts a
ndtre
e nu
ts
Vege
tabl
es
Nurs
ery
and
gree
nhou
se
Beef
cat
tle
Hogs
Poul
try
Dairy
Gen
eral
lives
tock
Gasoline/total cash expenses Diesel/total cash expenses
Source: 2002 ARMS
14
• USDA’s Agricultural Resource Management Survey has a wealth of data on farm fuel expenses. Much more than can summarized in a presentation. Multiple years, more breakdowns of fuel types, different categories, and links to the financial performance of the farm operations are available.
• Expenses can be translated into physical units and into BTUs.
• Please contact me at ERS if this data could help your research.