Embed Size (px)
Citation preview
Farm Structure Survey 2009/2010
Survey on agricultural production
methods 2009/2010
National Methodological Report (NMR)
According to Art. 12 of Regulation (EC) No 1166/2008 of the
European Parliament and of the Council of 19 November 2008
published in the Official Journal of the European Union L 321, p.14
of 1 December 2008
Member State: Sweden
2
FARM STRUCTURE SURVEY 2009/2010
SURVEY ON AGRICULTURAL
PRODUCTION METHODS 2009/2010 NATIONAL METHODOLOGICAL REPORT
CONTENTS
SUMMARY 1. CONTACTS 2. SURVEY METHODOLOGY
2.1 National legislation 2.2 Characteristics and reference period
The questionnaires 2.3 Survey organisation 2.4 Calendar (overview of work progress) 2.5 Population and frame
2.6 Survey design 2.7 Sampling, data collection and data entry
2.7.1 Drawing the sample –for SAPM and/or OGA, if applicable 2.7.2 Data collection and data entry
2.7.3 Use of administrative data sources 2.8 Specific topics
2.8.1 Common Land
2.8.2 Geographical reference of the holding 2.8.3 Volume of water used for irrigation
2.9 Response-burden policy 3. ACCURACY AND RELIABILITY OF THE DATA COLLECTED
3.1 Data processing, analysis and estimation 3.1.1 Estimation and sampling errors – for SAPM and/or OGA, if applicable
3.1.2 Non sampling errors () 3.1.3 Methods for handling missing or incorrect data items
3.1.4 Control of the data 3.2 Evaluation of results 3.3 Data Revision Policy
4. ACCESSIBILITY AND PUNCTUALITY 4.1 Publications
4.2 Timeliness and Punctuality 5. CONFIDENTIALITY AND SECURITY REFERENCES ANNEXES
ENDNOTES
3
SUMMARY
The records of agricultural statistics in Sweden date back to the beginning of the nineteenth
century. In the first half of the twentieth century established statistical methods were
introduced for production of statistics on agricultural holdings, crop areas, crop production
livestock etc. In 1968, in order to improve the coordination of the statistics within the
agricultural sector, Sweden established a farm register which was updated annually. The
register covered all agricultural holdings with: more than 2 hectares of arable land; a large
number of livestock but less than 2 hectares of arable land; and holdings with horticultural
production. Since its establishment the farm register was used as a sample frame for both
farm structure surveys and other agricultural statistical surveys.
During the 1990s the farm structure surveys were subject to few methodological and
technical changes. The substitution of some censuses with sample surveys, together with the
processing of statistics on PC-environment led to a reduction of the costs for producing
agricultural statistics. However, the substitution of some censuses with sample surveys
inevitably led to less detailed information on agricultural statistics on municipality level for
the years the substitution occurred.
The Swedish accession to the European Union in 1995 created the need for adapting national
agricultural statistics to the EU legislation. Up to 2001, Sweden compiled farm structure
surveys annually, switching every year between EU and national legislation. The main
difference between these two consisted of the number of the characteristics surveyed. The
national farm structure surveys met primarily national statistical requirements and therefore
were far less extensive than the ones based on EU legislation. In 2001, national farm
structure surveys were abandoned, thus embracing the surveys based on EU legislation as
the sole Farm Structure Surveys. Before 2001, the data collection for the EU Farm Structure
Surveys was made through postal questionnaires to the farmers. Since 2001, however, the
data collection methods included also web questionnaires, administrative registers and
telephone interviews with the farmers.
Through the Official Statistics Ordinance (SFS 2001:100), promulgated on March 2001, the
Swedish Board of Agriculture became the sole authority responsible for organizing and
producing all agricultural statistics in Sweden. Up to March 2001, this responsibility fell on
Statistics Sweden.
FSS 2010
The Agricultural census- FSS 2010, was carried out as a census combining both national and
EU requirements. Sample surveys in accordance with the EU precision requirements
where applied for both SAPM and OGA variables. Data was collected from postal and web
questionnaires, different administrative registers, and from complementary telephone
interviews which aimed to reduce the non-response rate for the census. In cases where
information was still missing, data was estimated through imputation methods.
The census in its full form (organization, data collection, data editing etc.), was carried out
by the Statistic Division of the Swedish Board of Agriculture. The FSS 2010 team involved
members that had worked with this survey since the year 2003, but also new members which
were recruited and trained to especially work with these tasks. The project team was located
4
on the premises of the Swedish Board of Agriculture, thus no field personnel was involved.
Booklets and questionnaires were printed outside of the Board.
The organization of the census started in September 2009, while the main activities started in
mid-October 2009 with the construction of the questionnaires. On May 28th
, four different
questionnaires together with relevant information were sent out to about 76 800 holdings.
The reference date for the survey was June 10th
, 2010. The farmers could answer the survey
either by sending in the filled questionnaires to the Swedish Board of Agriculture or by
answering the survey online on a webpage especially designed for the survey.
The data collection and processing started in the middle of June 2010. Three reminders were
sent to the holdings between June and September 2010. In September 2010, in order to
reduce the non-response rate the Swedish Board of Agriculture started conducting telephone
interviews with farmers which up to that point had not answered the survey. The data
collection ended in October, 10th
, 2010 with a response rate of 97%.
In January and February 2011, information from IACS and the Bovine Register, was merged
together with the information collected through questionnaires. A database from the survey
was processed and established in the end of February 2011. Disseminations of the final
national statistics based on the survey started in April 2011 and finished in October 2011.
The target population for the agricultural census (FSS 2010) consisted of the old national
thresholds and the new EU thresholds. This combination was a consequence of the need to
prevent discontinuity in our time series. Thus, the census covered all agricultural holdings in
Sweden, which on June 10th
, 2010, met one or more of the following criteria:
- More than 2.0 hectares of arable land
- More than 5.0 hectares of agricultural land
- At least 200 m² are under glass
- At least 2500 m² outdoor horticultural cultivation
- At least 10 cattle or 10 sows or 50 pigs or 20 ewes or 1000 poultry (incl. chickens).
The statistical farm register which was established in 1968 as a frame for different
agricultural surveys was also the frame for the FSS 2010. The 2010 frame population was
based on information collected during: the FSS 2007, the FSS 2005, the national livestock
survey 2009, and of holdings which applied for subsidies 2010. The poultry-, sheep-, and pig
registers were also used to identify potential holdings to be included in the target population.
The calculated statistical results for national purposes have been compared with
corresponding results from earlier years on macro level for groups of holdings (regions, size
classes) before dissemination. These comparisons show, for most characteristics, no
differences that cannot be explained. The final number of agricultural holdings resulting
from the FSS 2010 was 71 091, a decrease by 1 519 since 2007.
5
1. CONTACTS
Contact organisation Swedish board of Agriculture
Contact organisation unit Statistics Division
Contact name Saranda Daka
Contact person function Project manager for the Farm Structure Surveys
Contact mail address
Jordbruksverket
SE-551 82, JÖNKÖPING
Sweden
Contact email address [email protected]
Contact phone number +46 36 15 59 26
2. SURVEY METHODOLOGY
2.1 National legislation
All national agriculture statistics in Sweden refer to the Official Statistics Act (SFS 2001:99), and
to the Official Statistics Ordinance (SFS 2001:100) promulgated on March, 15th
, 2001. This
ordinance appoints the Swedish Board of Agriculture as the sole responsible authority for all
national agricultural statistics. This gives the Swedish Board of Agriculture sole mandate to
decide which organisations and authorities can conduct agricultural statistical surveys in order to
meet the statistical requirements both at national and at EU level.
In the provision SJVFS 2010:16 of the Swedish Board of Agriculture which took effect on May
1st, 2010, it was stipulated that the Swedish Board of Agriculture was responsible for organizing
the agriculture census FSS 2010. Further, through this provision, all agricultural holdings
meeting the criteria set for the target population, were obligated to provide the requested
information to the Swedish Board of Agriculture within the deadline set for the census, June 23th
,
2010. The information provided should reflect the situation on the agricultural holding on the
census’s reference date, June 10th
, 2010. Holdings which would fail to provide the data requested
could be subject to a penalty in accordance with the abovementioned act.
The confidentiality of the data was kept in accordance with Act 24, 8 § of the Swedish
confidentiality law on statistics (SFS 2009:400). According to this Act, the data provided by the
holdings cannot be used for other reasons than statistical and research purposes. In both these
cases, information that could identify the holder and the holding itself should be hidden. The
questionnaires sent in by the farmers were disclosed only for the staff of the Statistics Division,
and could not be shown to anyone outside of the division. All the personnel working within the
Statistical Division of the Swedish Board of Agriculture (including the ones employed to work
with the FSS 2010) had to sign a statistical confidentiality form which guaranteed the use and the
storage of the data in accordance with the confidentiality law.
6
2.2 Characteristics and reference period
The FSS 2010 was carried out as a combination of variables for national purposes and variables
surveyed according to EU requirements, Regulation (EC) No 1166/2008. The agricultural census
2010, included following information and statistical characteristics:
a) Information about the holding: holder’s name, address, personal or organizational,
number, telephone number, e-mail address, client number in the administrative
register for single farm payment, client number in the register of Organic Farming (at
the control body), and production location number for Bovine animals
b) Areas of different types of land
c) Areas of different crops
d) Set aside areas under the EU aid programme
e) Number of livestock of different kinds
f) Organic farming: utilised agricultural area (converted and under conversion) and
organic production methods in animal production.
g) Farm labour force
h) Rural development
The statistical characteristics b)-h) were collected in order to produce the customary annual
national statistics of farm structure as well as to fulfil the EU requirements on agricultural
statistics.
For a certain number of the holdings which were surveyed as a sample (8 700 holdings), the
following groups of characteristics were added:
i) Other gainful activity
j) Additional data on farm labour force
k) Areas for horticultural production
l) Agricultural production methods
m) Irrigation
The reference date was set to June 10th
, 2010. For the characteristics within the farm labour force,
production methods and irrigation sectors, the reference period was June 2009- May 2010.
Few characteristics from of the EU list of characteristics to be surveyed were not collected during
the agricultural census 2010. In some cases these characteristics were non-existent, while in
others, were treated as non-significant. Here follows a list of characteristics on the EU list of
characteristics which have not been subject to survey in Sweden during the FSS 2010:
I. General characteristics:
1.02.01.02 one or more natural persons who is/are a partner, where the holding is a group
holding? (NS);
1.03.01.03 UAA for share farming or other methods (NE);
1.03.02.03.09 Citrus plantations (NE);
1.03.02.03.10 Olives plantations (NE);
1.03.02.03.11Vineyards (NS);
1.03.03.01 Households consumes more than 50 % of the value of the final production on the
holding (NS);
7
1.03.03.02 Direct sales to final consumers represent more than 50 % of the total sales of the
holding (NS)
II. Land:
2.01.01.02 Durum wheat (NS);
2.01.01.06 Grain maize (NS);
2.01.01.07 Rice (NE);
2.01.05 Fodder roots and brassicas (NS);
2.01.06.01Tobacco (NE);
2.01.06.02 Hops (NE);
2.01.06.03 Cotton (NE);
2.01.06.05 Sunflower (NS);
2.01.06.06 Soya (NE);
2.01.06.08 Other oil seed crops (NS);
2.01.06.09 Flax (NS);
2.01.06.10 Hemp (NS);
2.01.06.11Other fibre crops (NS);
2.01.06.12 Aromatic plants, medicinal and culinary plants (NS);
2.01.06.99 Other industrial crops not mentioned elsewhere (NS);
2.01.08.01 Flowers and ornamental plants (excluding nurseries) outdoor or under low (not
accessible) protective cover (NS);
2.01.09.02.02 Leguminous plants (NS);
2.02; 2.03.03 Kitchen gardens (NS);
2.04.01.01.02 Fruit of subtropical climate zones (NE);
2.04.01.03 Nuts (NE);
2.04.02 Citrus plantations (NE);
2.04.03 Olive plantations (NE);
2.04.03.01Normally producing table olives (NE);
2.04.03.02 Normally producing olives for oil production (NE);
2.04.04 Vineyards of which normally producing quality wine, other wines, table grapes, raisins
(NS);
2.04.06 Other permanent crops (NS);
2.05.01Unutilised agricultural land (NS);
2.06.01Mushrooms (NS);
2.06.03 Energy crops for production of biofuels or other renewable energy (NE);
2.06.04 Genetically modified crops (NS)
III. Livestock:
3.03.02 Goats (NS);
3.05.03.02 Ducks (NS);
3.05.03.03 Geese (NS);
3.05.03.04 Ostriches (NS);
3.05.03.99 Other poultry, not mentioned elsewhere (NS);
3.06 Rabbits, breading females (NE);
3.07 Bees (NS);
3.99 Livestock not mentioned elsewhere (NS).
VI. Other gainful activities:
6.01.08 Forestry (NS)

8
VII. Support for rural development:
7.01.04 Meeting standards based on Community legislations (NE);
7.01.05 Participation of farmers in food quality schemes (NE);
7.01.06 Natura 2000 payments for agricultural area (NE);
7.01.07 Payments linked to Water Framework Directive (NE);
7.01.09 Animal welfare payments (NE)
SAPM:
4.02.01Total number of animals grazing on common land (NE);
4.02.02 Amount of time for which animals are grazing on common land (NE);
5.02.02 Pigs on completely slatted floors (NE);
5.03.02.02 Laying hens: Battery cage with deep pit (NS);
5.03.02.03 Laying hens: Battery cage with deep pit (NE);
7.01.03.02 Use of lagoon (NE);
8.01.02.03 Rice (NE);
8.01.02.08 Sunflower (NS);
8.01.02.09 Fibre crops (flax, hemp, other fibre crops), (NS);
8.01.02.14 Citrus plantations (NE);
8.01.02.15 Olive plantations (NE);
8.01.02.16 Vineyards (NS)
Regarding the characteristic 2.06.0, Genetically Modified Crops, there has been a change during
the time of the census. From the beginning, this characteristic was listed as NE as the GMO crops
were only grown on field trial basis and were not part of the section C of Directive 2001/18/EC.
However, during the 2010, the Swedish law changed, making GMO production of a type of
potatoes legal. Therefore, this variable will no longer be listed as NE and will be delivered to the
Eurostat together with the other surveyed FSS characteristics. The information on this variable
was obtained from administrative registers at the Swedish Board of Agriculture.
There are no changes of definitions of characteristics, or reference time measurement affecting
the comparability with the previous survey or census data.
The questionnaires
In total, four different questionnaires were designed in order to collect the data requested; three
questionnaires covering the FSS variables and one covering the SAPM variables (SP). Two of
the FSS questionnaires were adopted for natural persons, one including OGA variables (SFK)
while the other without OGA (SFE), while the third one was designed for legal persons (SJ).
The FSS questionnaires had this structure:
Page 1
In the top right-hand corner the following information was pre-printed: ID-number,
personal/organizational number, telephone number, name and the address of the holder.
At the bottom of the page the following information was pre-printed: Barcode with registered ID-
number, and personal Log in information to the webpage of the survey.
9
1. Land use
2. Cultivation of fruit and berries
3. Green houses
4. Nurseries
5. Client number at the Swedish Board of Agriculture
6. Irrigation
7. Client number in the Organic Farming Register (at the control body)
Page 2
1. Production location number for livestock (bovine) according to the Bovine register
(pre-printed)
2. Pigs broken down by category
3. Horses
4. Sheep broken down by category
5. Poultry broken down by category
6. Rural development/Other gainful activity
7. Renewable energy
Page 3
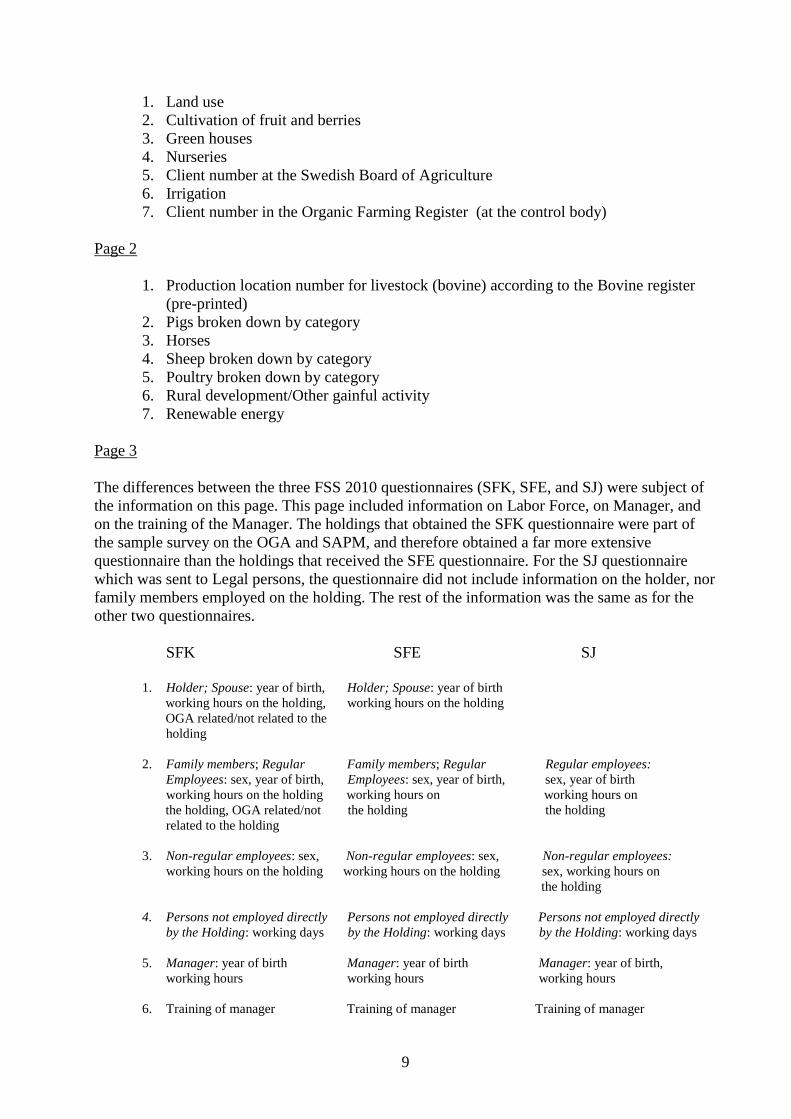
The differences between the three FSS 2010 questionnaires (SFK, SFE, and SJ) were subject of
the information on this page. This page included information on Labor Force, on Manager, and
on the training of the Manager. The holdings that obtained the SFK questionnaire were part of
the sample survey on the OGA and SAPM, and therefore obtained a far more extensive
questionnaire than the holdings that received the SFE questionnaire. For the SJ questionnaire
which was sent to Legal persons, the questionnaire did not include information on the holder, nor
family members employed on the holding. The rest of the information was the same as for the
other two questionnaires.
SFK SFE SJ
1. Holder; Spouse: year of birth, Holder; Spouse: year of birth
working hours on the holding, working hours on the holding
OGA related/not related to the
holding
2. Family members; Regular Family members; Regular Regular employees:
Employees: sex, year of birth, Employees: sex, year of birth, sex, year of birth
working hours on the holding working hours on working hours on
the holding, OGA related/not the holding the holding
related to the holding
3. Non-regular employees: sex, Non-regular employees: sex, Non-regular employees:
working hours on the holding working hours on the holding sex, working hours on
the holding
4. Persons not employed directly Persons not employed directly Persons not employed directly
by the Holding: working days by the Holding: working days by the Holding: working days
5. Manager: year of birth Manager: year of birth Manager: year of birth,
working hours working hours working hours
6. Training of manager Training of manager Training of manager
10
Page 4
1. Changes on the holding concerning the holder, name of the holding,
personal/organizational number, address, telephone number, e-mail address.
2. Signature of the respondent.
SP (The questionnaire on the SAPM)
This questionnaire was sent to about 8 700 holdings and included information on the agricultural
production methods. The questionnaire was sent in combination with the FSS questionnaires. All
holdings that received the SFK questionnaire (about 6 700 holdings), and about 2 000 legal
persons who received the SJ questionnaire, had to answer also the SP questionnaire. The 3-page
questionnaire included the following information:
Page 1
In the top right-hand corner following information was pre-printed: ID-number, personal/
organization registration number, telephone number, name and the address of the holder.
At the bottom of the page following information was pre-printed: Barcode with registered ID-
number, and personal Log in information to the webpage of the survey. The questionnaire
included variables on:
1. Tillage methods
2. Soil conversation
3. Crop rotation
4. Irrigation
5. Animal grazing
6. Animal housing broken down by category
7. Manure application
8. Manure storage and treatment facilities
9. Landscape features
The need for having four different questionnaires came as a result of Swedish national goals on
reducing the response burden for the respondents. This method of collecting the FSS 2010 data
increased the workload for the Swedish Board of Agriculture, as the data collection became more
complicated, increasing the need for further IT-developments, data controls, more detailed rules
for data editing and process etc. This methodology was however justified by the fact that the
holdings received only the variables they had to declare, and in a simpler and less complicated
way than what the other alternative (one questionnaire-for all) would have implied.
From the main questionnaire and the information booklet the respondents had all the necessary
information to fill in the questionnaire. Instructions on how to fill in the forms were also
included. For the holdings that preferred answering the survey electronically, a webpage for the
survey was designed. By using the personal Log in information pre-printed on the questionnaire
the farmers could log in and fill in the web-questionnaires on the website of the Swedish Board
of Agriculture.
11
Crop areas, number of bovine animals, organic farming, direct investment aids, and areas with
environmental restrictions were not included in the questionnaires as these were obtained directly
from administrative registers.
The version 6 of the Handbook was used on the implementing of the FSS 2010 and SAPM 2010
definitions as there were no differences between national and EU concepts.
See Annex 1 for a copy of the 4 questionnaires in Swedish.
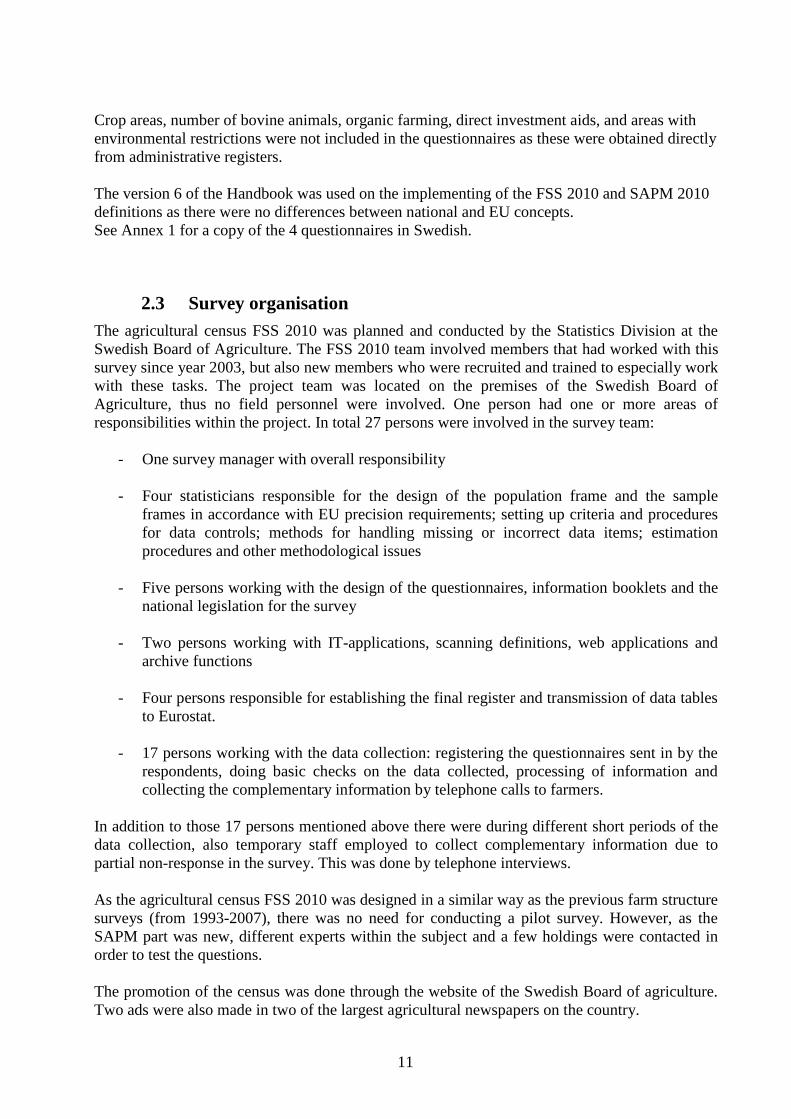
2.3 Survey organisation
The agricultural census FSS 2010 was planned and conducted by the Statistics Division at the
Swedish Board of Agriculture. The FSS 2010 team involved members that had worked with this
survey since year 2003, but also new members who were recruited and trained to especially work
with these tasks. The project team was located on the premises of the Swedish Board of
Agriculture, thus no field personnel were involved. One person had one or more areas of
responsibilities within the project. In total 27 persons were involved in the survey team:
- One survey manager with overall responsibility
- Four statisticians responsible for the design of the population frame and the sample
frames in accordance with EU precision requirements; setting up criteria and procedures
for data controls; methods for handling missing or incorrect data items; estimation
procedures and other methodological issues
- Five persons working with the design of the questionnaires, information booklets and the
national legislation for the survey
- Two persons working with IT-applications, scanning definitions, web applications and
archive functions
- Four persons responsible for establishing the final register and transmission of data tables
to Eurostat.
- 17 persons working with the data collection: registering the questionnaires sent in by the
respondents, doing basic checks on the data collected, processing of information and
collecting the complementary information by telephone calls to farmers.
In addition to those 17 persons mentioned above there were during different short periods of the
data collection, also temporary staff employed to collect complementary information due to
partial non-response in the survey. This was done by telephone interviews.
As the agricultural census FSS 2010 was designed in a similar way as the previous farm structure
surveys (from 1993-2007), there was no need for conducting a pilot survey. However, as the
SAPM part was new, different experts within the subject and a few holdings were contacted in
order to test the questions.
The promotion of the census was done through the website of the Swedish Board of agriculture.
Two ads were also made in two of the largest agricultural newspapers on the country.
12
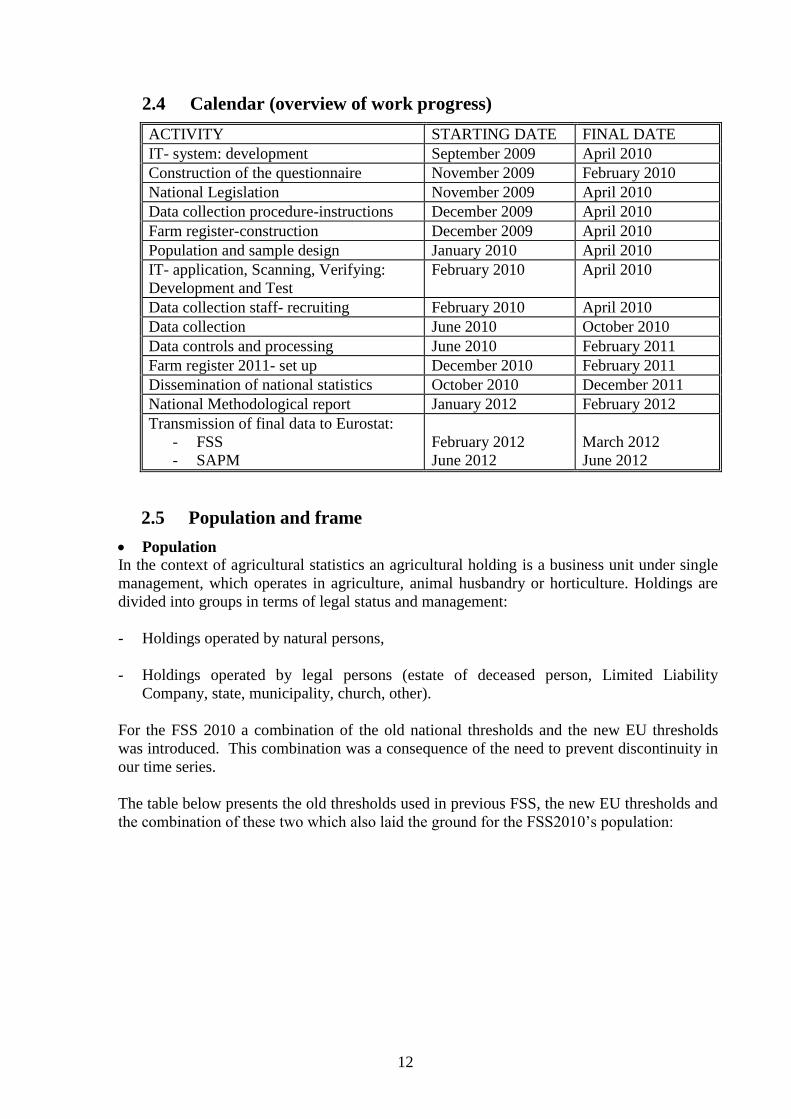
2.4 Calendar (overview of work progress)
ACTIVITY STARTING DATE FINAL DATE
IT- system: development September 2009 April 2010
Construction of the questionnaire November 2009 February 2010
National Legislation November 2009 April 2010
Data collection procedure-instructions December 2009 April 2010
Farm register-construction December 2009 April 2010
Population and sample design January 2010 April 2010
IT- application, Scanning, Verifying:
Development and Test
February 2010 April 2010
Data collection staff- recruiting February 2010 April 2010
Data collection June 2010 October 2010
Data controls and processing June 2010 February 2011
Farm register 2011- set up December 2010 February 2011
Dissemination of national statistics October 2010 December 2011
National Methodological report January 2012 February 2012
Transmission of final data to Eurostat:
- FSS
- SAPM
February 2012
June 2012
March 2012
June 2012
2.5 Population and frame
Population
In the context of agricultural statistics an agricultural holding is a business unit under single
management, which operates in agriculture, animal husbandry or horticulture. Holdings are
divided into groups in terms of legal status and management:
- Holdings operated by natural persons,
- Holdings operated by legal persons (estate of deceased person, Limited Liability
Company, state, municipality, church, other).
For the FSS 2010 a combination of the old national thresholds and the new EU thresholds
was introduced. This combination was a consequence of the need to prevent discontinuity in
our time series.
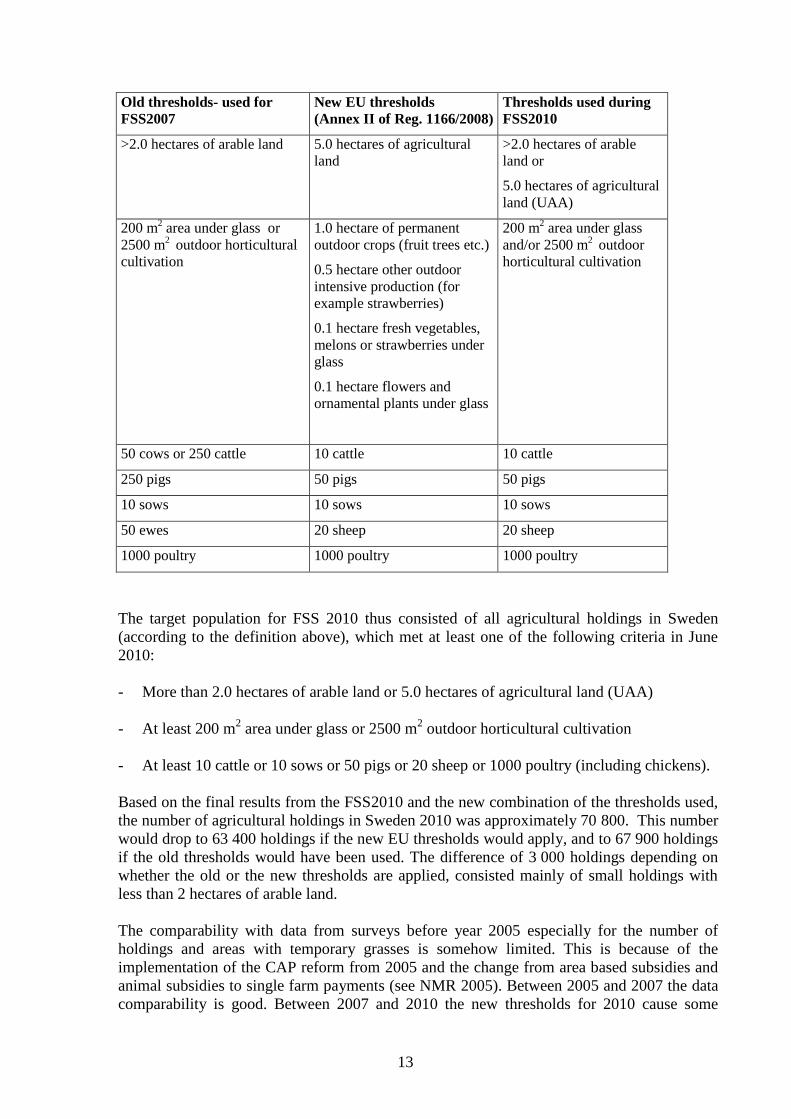
The table below presents the old thresholds used in previous FSS, the new EU thresholds and
the combination of these two which also laid the ground for the FSS2010’s population:
13
Old thresholds- used for
FSS2007
New EU thresholds
(Annex II of Reg. 1166/2008)
Thresholds used during
FSS2010
>2.0 hectares of arable land 5.0 hectares of agricultural
land
>2.0 hectares of arable
land or
5.0 hectares of agricultural
land (UAA)
200 m2 area under glass or
2500 m2 outdoor horticultural
cultivation
1.0 hectare of permanent
outdoor crops (fruit trees etc.)
0.5 hectare other outdoor
intensive production (for
example strawberries)
0.1 hectare fresh vegetables,
melons or strawberries under
glass
0.1 hectare flowers and
ornamental plants under glass
200 m2 area under glass
and/or 2500 m2 outdoor
horticultural cultivation
50 cows or 250 cattle 10 cattle 10 cattle
250 pigs 50 pigs 50 pigs
10 sows 10 sows 10 sows
50 ewes 20 sheep 20 sheep
1000 poultry 1000 poultry 1000 poultry
The target population for FSS 2010 thus consisted of all agricultural holdings in Sweden
(according to the definition above), which met at least one of the following criteria in June
2010:
- More than 2.0 hectares of arable land or 5.0 hectares of agricultural land (UAA)
- At least 200 m2 area under glass or 2500 m
2 outdoor horticultural cultivation
- At least 10 cattle or 10 sows or 50 pigs or 20 sheep or 1000 poultry (including chickens).
Based on the final results from the FSS2010 and the new combination of the thresholds used,
the number of agricultural holdings in Sweden 2010 was approximately 70 800. This number
would drop to 63 400 holdings if the new EU thresholds would apply, and to 67 900 holdings
if the old thresholds would have been used. The difference of 3 000 holdings depending on
whether the old or the new thresholds are applied, consisted mainly of small holdings with
less than 2 hectares of arable land.
The comparability with data from surveys before year 2005 especially for the number of
holdings and areas with temporary grasses is somehow limited. This is because of the
implementation of the CAP reform from 2005 and the change from area based subsidies and
animal subsidies to single farm payments (see NMR 2005). Between 2005 and 2007 the data
comparability is good. Between 2007 and 2010 the new thresholds for 2010 cause some
14
difficulties in terms of comparability. Therefore, for all national publications (except for the
statistical database) based on the FSS 2010, Sweden has presented results with both old and
new thresholds, which make the comparisons easier for the users.
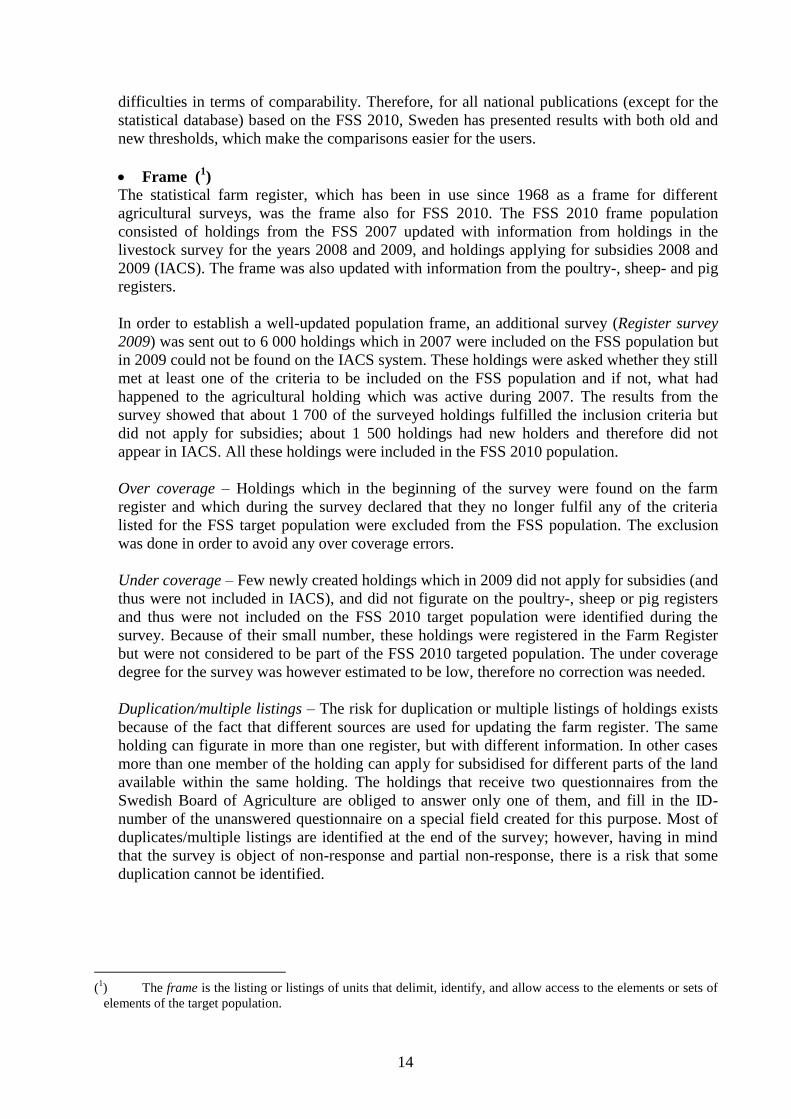
Frame (1)
The statistical farm register, which has been in use since 1968 as a frame for different
agricultural surveys, was the frame also for FSS 2010. The FSS 2010 frame population
consisted of holdings from the FSS 2007 updated with information from holdings in the
livestock survey for the years 2008 and 2009, and holdings applying for subsidies 2008 and
2009 (IACS). The frame was also updated with information from the poultry-, sheep- and pig
registers.
In order to establish a well-updated population frame, an additional survey (Register survey
2009) was sent out to 6 000 holdings which in 2007 were included on the FSS population but
in 2009 could not be found on the IACS system. These holdings were asked whether they still
met at least one of the criteria to be included on the FSS population and if not, what had
happened to the agricultural holding which was active during 2007. The results from the
survey showed that about 1 700 of the surveyed holdings fulfilled the inclusion criteria but
did not apply for subsidies; about 1 500 holdings had new holders and therefore did not
appear in IACS. All these holdings were included in the FSS 2010 population.
Over coverage – Holdings which in the beginning of the survey were found on the farm
register and which during the survey declared that they no longer fulfil any of the criteria
listed for the FSS target population were excluded from the FSS population. The exclusion
was done in order to avoid any over coverage errors.
Under coverage – Few newly created holdings which in 2009 did not apply for subsidies (and
thus were not included in IACS), and did not figurate on the poultry-, sheep or pig registers
and thus were not included on the FSS 2010 target population were identified during the
survey. Because of their small number, these holdings were registered in the Farm Register
but were not considered to be part of the FSS 2010 targeted population. The under coverage
degree for the survey was however estimated to be low, therefore no correction was needed.
Duplication/multiple listings – The risk for duplication or multiple listings of holdings exists
because of the fact that different sources are used for updating the farm register. The same
holding can figurate in more than one register, but with different information. In other cases
more than one member of the holding can apply for subsidised for different parts of the land
available within the same holding. The holdings that receive two questionnaires from the
Swedish Board of Agriculture are obliged to answer only one of them, and fill in the ID-
number of the unanswered questionnaire on a special field created for this purpose. Most of
duplicates/multiple listings are identified at the end of the survey; however, having in mind
that the survey is object of non-response and partial non-response, there is a risk that some
duplication cannot be identified.
(
1) The frame is the listing or listings of units that delimit, identify, and allow access to the elements or sets of
elements of the target population.
15
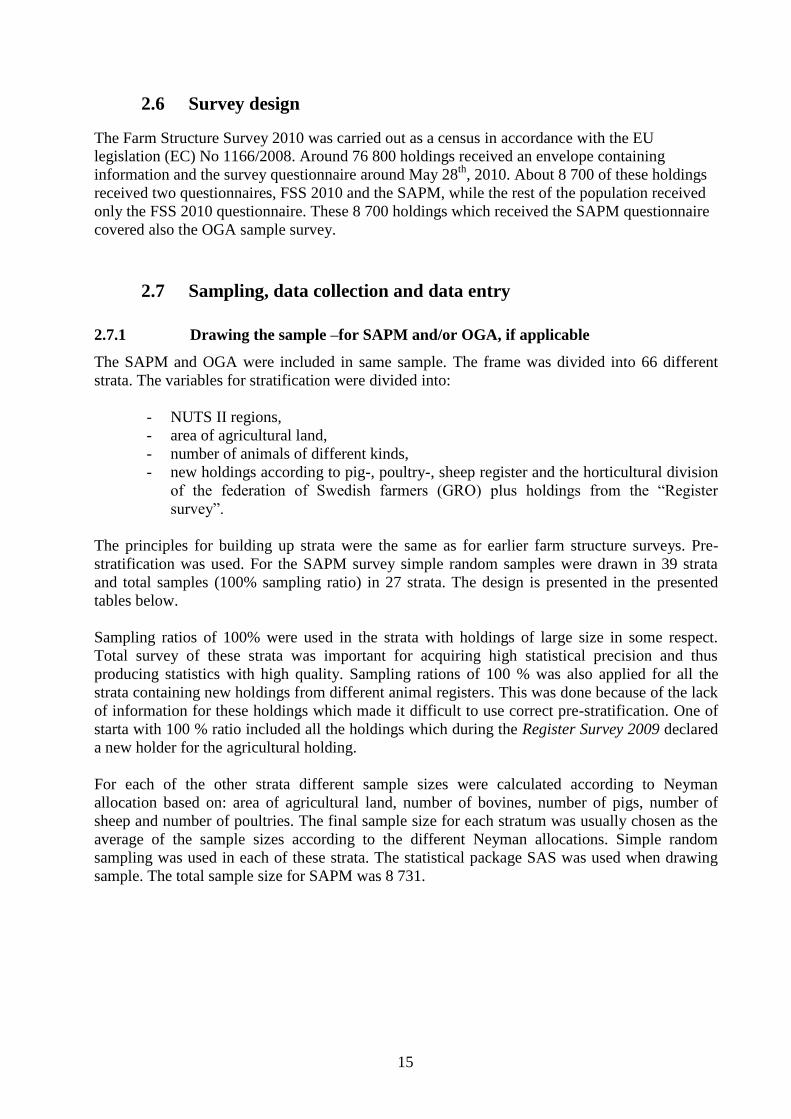
2.6 Survey design
The Farm Structure Survey 2010 was carried out as a census in accordance with the EU
legislation (EC) No 1166/2008. Around 76 800 holdings received an envelope containing
information and the survey questionnaire around May 28th
, 2010. About 8 700 of these holdings
received two questionnaires, FSS 2010 and the SAPM, while the rest of the population received
only the FSS 2010 questionnaire. These 8 700 holdings which received the SAPM questionnaire
covered also the OGA sample survey.
2.7 Sampling, data collection and data entry
2.7.1 Drawing the sample –for SAPM and/or OGA, if applicable
The SAPM and OGA were included in same sample. The frame was divided into 66 different
strata. The variables for stratification were divided into:
- NUTS II regions,
- area of agricultural land,
- number of animals of different kinds,
- new holdings according to pig-, poultry-, sheep register and the horticultural division
of the federation of Swedish farmers (GRO) plus holdings from the “Register
survey”.
The principles for building up strata were the same as for earlier farm structure surveys. Pre-
stratification was used. For the SAPM survey simple random samples were drawn in 39 strata
and total samples (100% sampling ratio) in 27 strata. The design is presented in the presented
tables below.
Sampling ratios of 100% were used in the strata with holdings of large size in some respect.
Total survey of these strata was important for acquiring high statistical precision and thus
producing statistics with high quality. Sampling rations of 100 % was also applied for all the
strata containing new holdings from different animal registers. This was done because of the lack
of information for these holdings which made it difficult to use correct pre-stratification. One of
starta with 100 % ratio included all the holdings which during the Register Survey 2009 declared
a new holder for the agricultural holding.
For each of the other strata different sample sizes were calculated according to Neyman
allocation based on: area of agricultural land, number of bovines, number of pigs, number of
sheep and number of poultries. The final sample size for each stratum was usually chosen as the
average of the sample sizes according to the different Neyman allocations. Simple random
sampling was used in each of these strata. The statistical package SAS was used when drawing
sample. The total sample size for SAPM was 8 731.
16
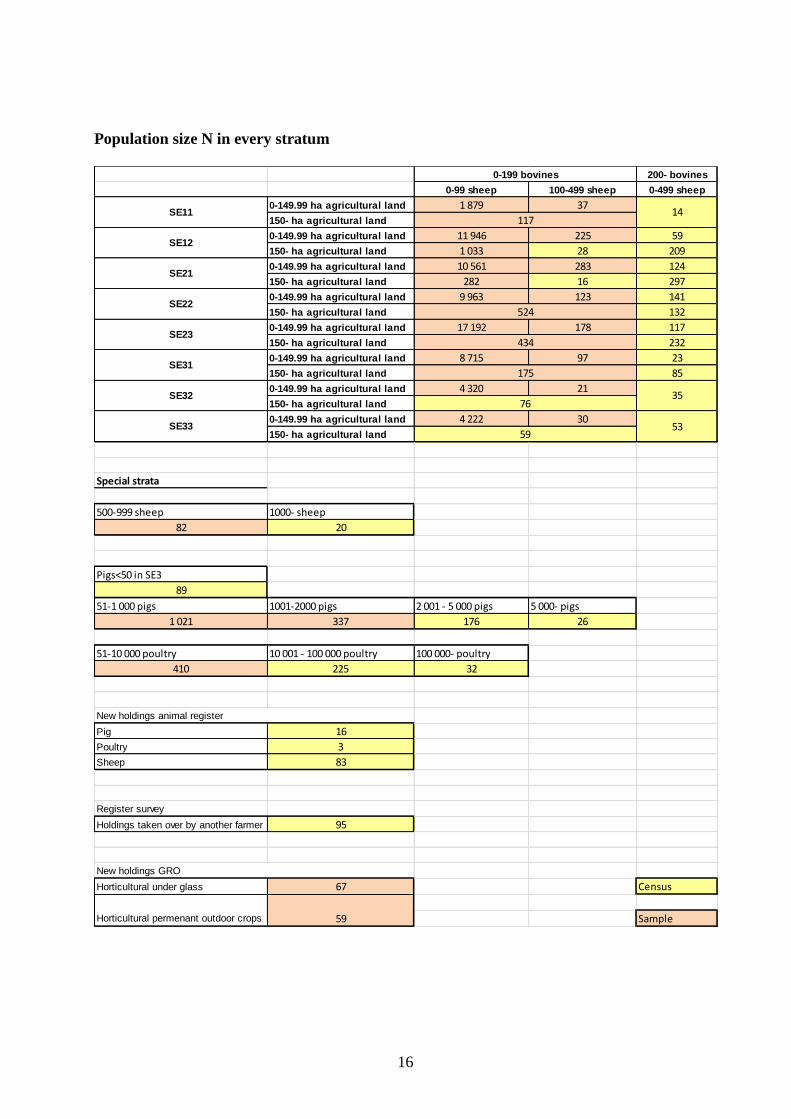
Population size N in every stratum
200- bovines
0-99 sheep 100-499 sheep 0-499 sheep
0-149.99 ha agricultural land 1 879 37
150- ha agricultural land
0-149.99 ha agricultural land 11 946 225 59
150- ha agricultural land 1 033 28 209
0-149.99 ha agricultural land 10 561 283 124
150- ha agricultural land 282 16 297
0-149.99 ha agricultural land 9 963 123 141
150- ha agricultural land 132
0-149.99 ha agricultural land 17 192 178 117
150- ha agricultural land 232
0-149.99 ha agricultural land 8 715 97 23
150- ha agricultural land 85
0-149.99 ha agricultural land 4 320 21
150- ha agricultural land
0-149.99 ha agricultural land 4 222 30
150- ha agricultural land
Special strata
500-999 sheep 1000- sheep
82 20
Pigs<50 in SE3
89
51-1 000 pigs 1001-2000 pigs 2 001 - 5 000 pigs 5 000- pigs
1 021 337 176 26
51-10 000 poultry 10 001 - 100 000 poultry 100 000- poultry
410 225 32
Pig 16
Poultry 3
Sheep 83
Register survey
Holdings taken over by another farmer 95
Horticultural under glass 67 Census
Sample
New holdings animal register
New holdings GRO
Horticultural permenant outdoor crops 59
SE32 3576
SE33 5359
SE22524
SE23434
SE31175
0-199 bovines
SE11 14117
SE12
SE21

17
Sampling ratio in every stratum
200- bovines
0-99 sheep 100-499 sheep 0-499 sheep
0-149.99 ha agricultural land 5% 35%
150- ha agricultural land
0-149.99 ha agricultural land 5% 35% 100%
150- ha agricultural land 35% 100% 100%
0-149.99 ha agricultural land 5% 35% 100%
150- ha agricultural land 35% 100% 100%
0-149.99 ha agricultural land 5% 35% 100%
150- ha agricultural land 100%
0-149.99 ha agricultural land 5% 35% 100%
150- ha agricultural land 100%
0-149.99 ha agricultural land 5% 35% 100%
150- ha agricultural land 100%
0-149.99 ha agricultural land 5% 35%
150- ha agricultural land
0-149.99 ha agricultural land 5% 35%
150- ha agricultural land
Special strata
500-999 sheep 1000- sheep
75% 100%
Pigs<50 in SE3
100%
51-1 000 pigs 1001-2000 pigs 2 001 - 5 000 pigs 5 000- pigs
75% 75% 100% 100%
51-10 000 poultry 10 001 - 100 000 poultry 100 000- poultry
35% 100% 100%
Pig 100%
Poultry 100%
Sheep 100%
Register survey
Holdings taken over by another farmer 100%
Horticultural under glass 35% Census
Sample
New holdings GRO
Horticultural permenant outdoor crops 35%
100%
New holdings animal register
SE3160%
SE32 100%100%
SE33 100%
SE21
SE2260%
SE2360%
0-199 bovines
SE11 100%60%
SE12
18
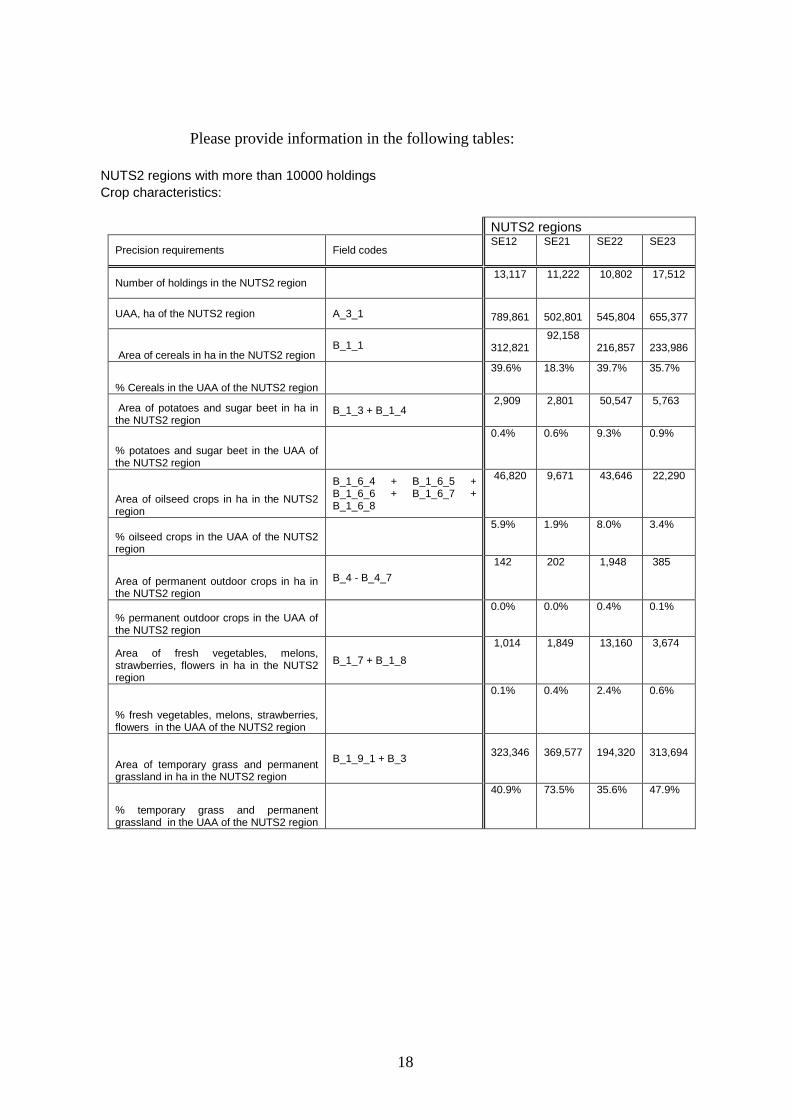
Please provide information in the following tables:
NUTS2 regions with more than 10000 holdings
Crop characteristics:
NUTS2 regions
Precision requirements Field codes
SE12 SE21 SE22 SE23
Number of holdings in the NUTS2 region
13,117 11,222 10,802 17,512
UAA, ha of the NUTS2 region A_3_1
789,861
502,801
545,804
655,377
Area of cereals in ha in the NUTS2 region B_1_1
312,821
92,158 216,857
233,986
% Cereals in the UAA of the NUTS2 region
39.6% 18.3% 39.7% 35.7%
Area of potatoes and sugar beet in ha in the NUTS2 region
B_1_3 + B_1_4 2,909 2,801 50,547 5,763
% potatoes and sugar beet in the UAA of the NUTS2 region
0.4% 0.6% 9.3% 0.9%
Area of oilseed crops in ha in the NUTS2 region
B_1_6_4 + B_1_6_5 + B_1_6_6 + B_1_6_7 + B_1_6_8
46,820 9,671 43,646 22,290
% oilseed crops in the UAA of the NUTS2 region
5.9% 1.9% 8.0% 3.4%
Area of permanent outdoor crops in ha in the NUTS2 region
B_4 - B_4_7
142 202 1,948 385
% permanent outdoor crops in the UAA of the NUTS2 region
0.0% 0.0% 0.4% 0.1%
Area of fresh vegetables, melons, strawberries, flowers in ha in the NUTS2 region
B_1_7 + B_1_8
1,014 1,849 13,160 3,674
% fresh vegetables, melons, strawberries, flowers in the UAA of the NUTS2 region
0.1% 0.4% 2.4% 0.6%
Area of temporary grass and permanent grassland in ha in the NUTS2 region
B_1_9_1 + B_3
323,346
369,577
194,320
313,694
% temporary grass and permanent grassland in the UAA of the NUTS2 region
40.9% 73.5% 35.6% 47.9%
19
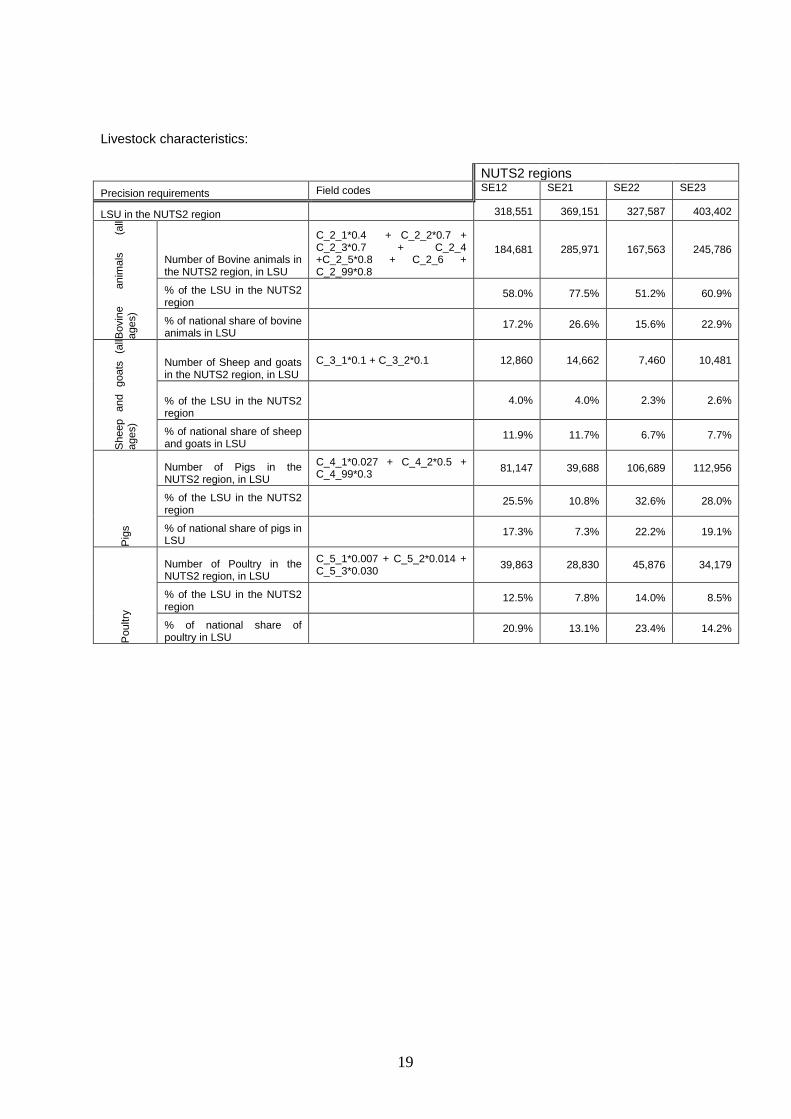
Livestock characteristics:
NUTS2 regions
Precision requirements Field codes SE12 SE21 SE22 SE23
LSU in the NUTS2 region 318,551 369,151 327,587 403,402
Bovin
e
anim
als
(a
ll
ages)
Number of Bovine animals in the NUTS2 region, in LSU
C_2_1*0.4 + C_2_2*0.7 + C_2_3*0.7 + C_2_4 +C_2_5*0.8 + C_2_6 + C_2_99*0.8
184,681 285,971 167,563 245,786
% of the LSU in the NUTS2 region
58.0% 77.5% 51.2% 60.9%
% of national share of bovine animals in LSU
17.2% 26.6% 15.6% 22.9%
Sheep
and
goats
(a
ll
ages)
Number of Sheep and goats in the NUTS2 region, in LSU
C_3_1*0.1 + C_3_2*0.1 12,860 14,662 7,460 10,481
% of the LSU in the NUTS2 region
4.0% 4.0% 2.3% 2.6%
% of national share of sheep and goats in LSU
11.9% 11.7% 6.7% 7.7%
Pig
s
Number of Pigs in the NUTS2 region, in LSU
C_4_1*0.027 + C_4_2*0.5 + C_4_99*0.3
81,147 39,688 106,689 112,956
% of the LSU in the NUTS2 region
25.5% 10.8% 32.6% 28.0%
% of national share of pigs in LSU
17.3% 7.3% 22.2% 19.1%
Poultry
Number of Poultry in the NUTS2 region, in LSU
C_5_1*0.007 + C_5_2*0.014 + C_5_3*0.030
39,863 28,830 45,876 34,179
% of the LSU in the NUTS2 region
12.5% 7.8% 14.0% 8.5%
% of national share of poultry in LSU
20.9% 13.1% 23.4% 14.2%
20
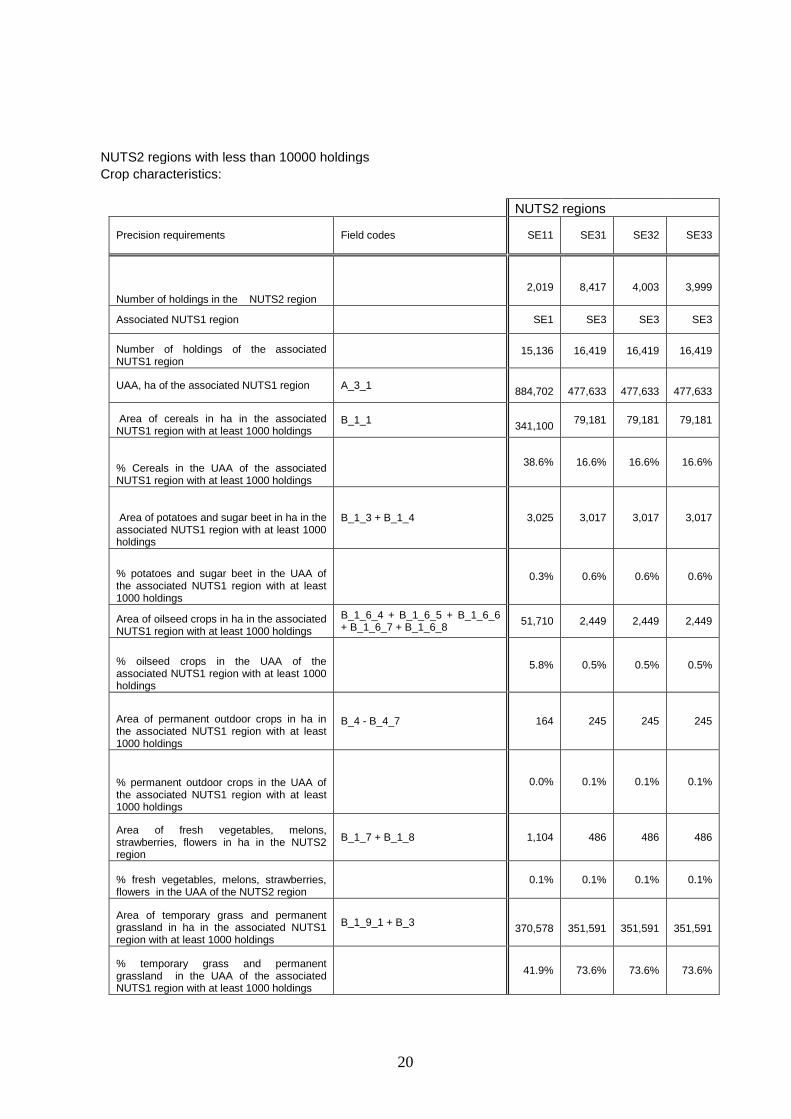
NUTS2 regions with less than 10000 holdings
Crop characteristics:
NUTS2 regions
Precision requirements Field codes
SE11
SE31 SE32 SE33
Number of holdings in the NUTS2 region
2,019
8,417
4,003
3,999
Associated NUTS1 region
SE1 SE3 SE3 SE3
Number of holdings of the associated NUTS1 region
15,136 16,419 16,419 16,419
UAA, ha of the associated NUTS1 region A_3_1
884,702
477,633
477,633
477,633
Area of cereals in ha in the associated NUTS1 region with at least 1000 holdings
B_1_1
341,100 79,181 79,181 79,181
% Cereals in the UAA of the associated NUTS1 region with at least 1000 holdings
38.6% 16.6% 16.6% 16.6%
Area of potatoes and sugar beet in ha in the associated NUTS1 region with at least 1000 holdings
B_1_3 + B_1_4 3,025 3,017 3,017 3,017
% potatoes and sugar beet in the UAA of the associated NUTS1 region with at least 1000 holdings
0.3% 0.6% 0.6% 0.6%
Area of oilseed crops in ha in the associated NUTS1 region with at least 1000 holdings
B_1_6_4 + B_1_6_5 + B_1_6_6 + B_1_6_7 + B_1_6_8
51,710 2,449 2,449 2,449
% oilseed crops in the UAA of the associated NUTS1 region with at least 1000 holdings
5.8% 0.5% 0.5% 0.5%
Area of permanent outdoor crops in ha in the associated NUTS1 region with at least 1000 holdings
B_4 - B_4_7 164 245 245 245
% permanent outdoor crops in the UAA of the associated NUTS1 region with at least 1000 holdings
0.0% 0.1% 0.1% 0.1%
Area of fresh vegetables, melons, strawberries, flowers in ha in the NUTS2 region
B_1_7 + B_1_8 1,104 486 486 486
% fresh vegetables, melons, strawberries, flowers in the UAA of the NUTS2 region
0.1% 0.1% 0.1% 0.1%
Area of temporary grass and permanent grassland in ha in the associated NUTS1 region with at least 1000 holdings
B_1_9_1 + B_3
370,578
351,591
351,591
351,591
% temporary grass and permanent grassland in the UAA of the associated NUTS1 region with at least 1000 holdings
41.9% 73.6% 73.6% 73.6%
21
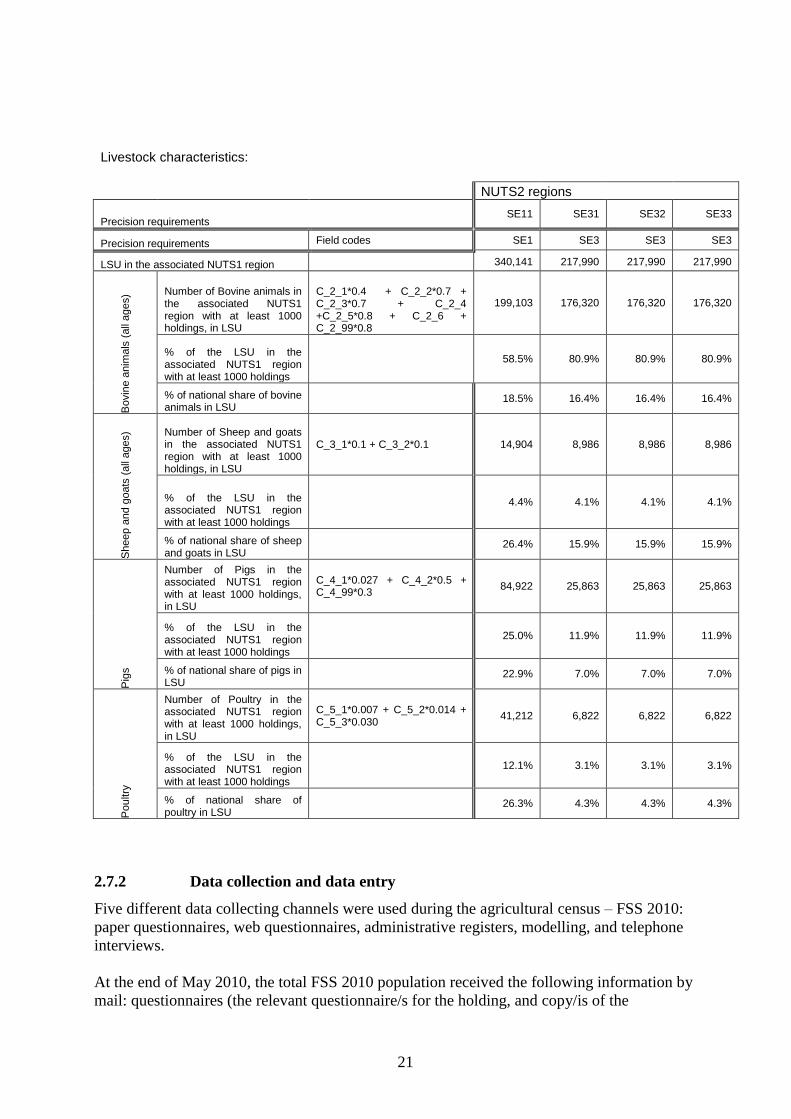
Livestock characteristics:
NUTS2 regions
Precision requirements SE11 SE31 SE32 SE33
Precision requirements Field codes SE1 SE3 SE3 SE3
LSU in the associated NUTS1 region 340,141 217,990 217,990 217,990
Bovin
e a
nim
als
(all
ages) Number of Bovine animals in
the associated NUTS1 region with at least 1000 holdings, in LSU
C_2_1*0.4 + C_2_2*0.7 + C_2_3*0.7 + C_2_4 +C_2_5*0.8 + C_2_6 + C_2_99*0.8
199,103 176,320 176,320 176,320
% of the LSU in the associated NUTS1 region with at least 1000 holdings
58.5% 80.9% 80.9% 80.9%
% of national share of bovine animals in LSU
18.5% 16.4% 16.4% 16.4%
Sheep a
nd g
oats
(all
ages) Number of Sheep and goats
in the associated NUTS1 region with at least 1000 holdings, in LSU
C_3_1*0.1 + C_3_2*0.1 14,904 8,986 8,986 8,986
% of the LSU in the associated NUTS1 region with at least 1000 holdings
4.4% 4.1% 4.1% 4.1%
% of national share of sheep and goats in LSU
26.4% 15.9% 15.9% 15.9%
Pig
s
Number of Pigs in the associated NUTS1 region with at least 1000 holdings, in LSU
C_4_1*0.027 + C_4_2*0.5 + C_4_99*0.3
84,922 25,863 25,863 25,863
% of the LSU in the associated NUTS1 region with at least 1000 holdings
25.0% 11.9% 11.9% 11.9%
% of national share of pigs in LSU
22.9% 7.0% 7.0% 7.0%
Poultry
Number of Poultry in the associated NUTS1 region with at least 1000 holdings, in LSU
C_5_1*0.007 + C_5_2*0.014 + C_5_3*0.030
41,212 6,822 6,822 6,822
% of the LSU in the associated NUTS1 region with at least 1000 holdings
12.1% 3.1% 3.1% 3.1%
% of national share of poultry in LSU
26.3% 4.3% 4.3% 4.3%
2.7.2 Data collection and data entry
Five different data collecting channels were used during the agricultural census – FSS 2010:
paper questionnaires, web questionnaires, administrative registers, modelling, and telephone
interviews.
At the end of May 2010, the total FSS 2010 population received the following information by
mail: questionnaires (the relevant questionnaire/s for the holding, and copy/is of the

22
questionnaire to be kept by the holding); relevant instruction booklet/s; information paper on the
FSS 2010, their responsibilities by law, and use of the data collected; and an envelope with pre-
paid stamp in order to send in the filled questionnaires. The information booklet included
information on the FSS, on the answering alternatives for the survey, and information on how to
fill in the questionnaires for each section included. The respondents received also personal Log in
information to the survey’s website at the Swedish Board of Agriculture. This website included
the questionnaire itself, detailed information on how to fill in the questionnaire for each section,
and data controls (simple validations) which warned the respondents if any error or mismatch of
data occurred. About 17 % of the FSS 2010 population used the web for answering the survey, an
increase with 7 % compared to the FSS 2007.
The FSS group working with the data collection received detailed instructions on how to handle
the different paper questionnaires sent in by the respondents. The process of data entry for the
incoming paper questionnaires could be divided in 5 moments:
1. Classification of incoming paper questionnaires (SFK; SFE; SJ; SP)
2. Registration of the questionnaires
3. Optical Scanning (hereafter Scanning)
4. Verifying
5. Transfer of data from the IT-system to the database.
When the questionnaires arrived at the Swedish Board of Agriculture, they were sorted out by the
FSS team in four different groups - one per kind of questionnaire (1). Then by scanning the
barcode, each questionnaire was registered on the IT-system (2).
The next step was to look for any changes made by the respondents on the pre-printed
administrative information:
- on the holding (holder’s name, address, telephone number etc.),
- if the holding in question had been sold or rented out to another holder, or if the
respondents had made any other comments.
In cases where the pre-printed administrative information was changed, the new information was
registered in the database manually before the questionnaire was scanned. In cases where the
respondents left other comments on the questionnaire, the comments were presented to the
survey manager before the questionnaire was scanned. Questionnaires without any changes on
pre-printed information were sent directly for optical scanning. Manual registration of the data
on the IT-system was done only for questionnaires which arrived at the Swedish Board of
Agriculture in such physical condition which made the scanning procedure impossible (3).
After the scanning procedure, the questionnaires went through the verifying process (4). By
verifying the questionnaire we can correct errors made by the optical scanning and thus make
sure that the data information registered on the IT-system is the same as the one left by the
respondents on the questionnaire. When the verifying procedure is finished all the questionnaires
scanned and verified are sent to a database especially established for the FSS (5).
The web questionnaires did not involve the same working load as the paper questionnaires. The
IT-system especially developed for the data collection identifies all the changes made on pre-
printed information. It also registers all errors occurring when a questionnaire contains
information which does not fulfil the validation criteria. All identified changes and errors must be
23
checked manually by the FSS personnel before the information can be stored on the FSS
database.
2.7.3 Use of administrative data sources
Five administrative data sources were used during the agricultural census- FSS 2010: IACS, the
Bovine Register, the Organic Farming Register, the register on Genetically Modified Crops and
the Register of Support for Rural Development.
The IACS register was developed based on the Council Regulation (EC) no 1782/2003, and
contains information from the applications for the single farm payments. When applying for
single farm payments the farms have to declare the use of all agricultural areas on the holding;
e.g. which crops are grown, the area for each crop, or the fallow area. The reporting units are
single persons and legal holdings which send applications to the Swedish Board of Agriculture.
There is no exact correspondence between the responsible person/holding (the reporting unit)
applying for single farm payment and the definition of the holding in the Farm Structure Surveys.
One holding can/could exist of several persons applying for the single farm payment.
The main linkage between the holdings in the statistical farm register and the reporting units in
IACS is the personal number for natural persons and organisational number for legal holdings.
These numbers are unique for each entity. In the farm register, there is for every holding
registered one personal number for each farmer on the holding. For units, which mismatch
according to this method, the client number for the Single payment application at the Swedish
Board of Agriculture followed by production location number is used. All remaining reporting
units in IACS are considered to form new holdings in the farm register.
The characteristics taken from IACS are areas for different crops and other uses of the
agricultural area. IACS does not contain information from all statistical holdings in the target
population, as there are holdings with more than 2 ha of arable land or more than 5 ha of
agricultural land (UAA) not applying for single farm payment. However it is judged that
farmers/enterprises are applying for single farm payment for nearly all arable land in Sweden.
The quality of the information in IACS is deemed to be very high, as there are controls on a part
of the holdings about the information delivered by the farmers. The farmers may also lose some
part of the single farm payment if the reported areas are incorrect.
The definitions of crop areas and other areas in IACS are in line with the definitions in the farm
structure surveys and the relevant areas in IACS can be translated to corresponding areas in the
farm register. The reference date in FSS 2010 is June 10, which corresponds to the reference time
(crop year) in the system for single farm payments.
The second administrative data source used in FSS 2010 is the Bovine Register. This register, in
Sweden called the Central Cattle Register (CDB), was set up in accordance with Council
Regulation (EC) No 1760/2000 of 17 July 2000. The register’s main objective is to make it
possible to trace contagious animal diseases. The Commission approved the CDB in Sweden for
use in pursuing this main objective from 1 November 1999. The register has also been approved
to be used for other objectives and since 2000 it has been used, and served as the basis, for
various EU cattle premiums (special beef premium, slaughter premium, suckler cow premium,
extensification aid, etc.).
24
The CDB is made up of the following two main parts:
- One part contains information on the identity of individual animals, both living and
dead, such as sex, date of birth, breed and age.
- Another part contains information on events relating to individual animals, such as
birth, slaughter, purchase and sale as well as transfer between different holdings, etc.
Farmers with bovine animals must report each event for each individual animal – such as birth,
transfer, sale for slaughter, etc., - to CDB within seven days. A calf should be tagged within 20
days of birth and then reported within seven days to CDB. Late reporting will incur additional
charges for the farmer.
There is not an exact correspondence between the responsible person/enterprise (the reporting
unit) for bovine animals and the definition of holding in the farm structure surveys. This depends
on the fact that the holders in the statistical farm register are not necessary the persons
responsible for the reporting to CDB. It could also be the case that a holding has more than one
production location in the farm register and that different persons are responsible for the
reporting to CDB for different production locations.
The main linkage between the holdings in the statistical farm register and the reporting units in
CDB is the personal number for natural persons and organisational number for legal enterprises.
These numbers are unique for each entity. In the farm register there is for every holding
registered one personal number for each farmer on the holding. For units that mismatch
according to this method, the linkage characteristics production location is used.
The quality of the information in CDB is judged to be very high, as there are both administrative
controls and field-controls on part of the holdings and as the farmers may lose some part of the
single farm payments if the reported information is incorrect.
The reported information about bovine animals in CDB, as date of birth and sex, can together
with information in a milk database on milk deliveries to dairies be translated to the definitions
of the different kinds of bovines in FSS 2010. However, as all cows on holdings delivering milk
to dairies are considered to be milk cows, there will be a small overestimate of the number of
milk cows and a corresponding underestimate of the number of other cows. The same method is
used in the statistical surveys on cattle according to the Council Directive 93/24/EEC.
The reference date for the transmission of information from CDB to the farm register is June 10,
the same reference date as for FSS 2010.
The third administrative data source used in FSS 2010 is the Organic Farming Register based on
the Council regulation EEC N. 2092/91. In 2010 there were three control bodies on the market
working with controls of agricultural holdings on which organic farming methods are applied.
The control bodies are authorized by the Swedish Board for Accreditation and Conformity
Assessment.
The data concerning the characteristics on organic farming in FSS 2010 are based on existing
information on individual holdings in registers at the control bodies. The registers cover all
holdings applying organic farming methods or are in the conversion period. To establish a link to
the statistical farm register and to have the information suitable for the FSS 2010, the Board of
Agriculture sent a questionnaire to the control bodies asking for information on:
- the personal/organisational number of the holder or holding,
25
- the client number of the holding at the control body,
- what kind of crops are grown and the corresponding areas in combination with if the
areas were under conversion or converted
- organic production methods applied in the animal production
Information on addresses and telephone numbers of the holder/holding was also transmitted from
the control bodies.
In the FSS questionnaires, as mentioned in section 2.2, holders were asked to fill in their client
number at the control body. By using the personal/organisational number of the holding
combined with the information on client number at the control body and in the FSS
questionnaires, a link between the Organic Farming Register and the statistical farm register
could be established. In cases of mismatch, addresses and telephone numbers were also used to
link holdings in the different registers. In the end there were only a few mismatches.
The fourth register used in the FSS 2010 was the register of Genetically Modified Crops. It is
based in the Swedish Board of Agriculture and contains information of what kind of crops that
are grown, the corresponding areas and where the areas are located.
The definition of the reporting unit is the same as for the holdings applying for the single farm
payment. Hence, the identification of the units is also the same, i.e. the personal number for
natural persons and organisational number for legal holdings. Should there be a mismatch; the
client number at the Swedish Board of Agriculture is used. The register contains information of
all areas grown with GM crops.
The reason why Sweden created a registry of GM crops was to have complete control over all the
GM crops grown. Hence, the register of GM crops should not contain any errors.
The fifth register used in the FSS 2010 was the register of Support for Rural Development. It is
based in the Swedish Board of Agriculture and contains information of all holdings seeking
support for different kinds of support for rural development.
The definition of the reporting unit is the same as for the holdings applying for the single farm
payment. Hence, the identification of the units is also the same, i.e. the personal number for
natural persons and organisational number for legal holdings. Should there be a mismatch; the
client number at the Swedish Board of Agriculture is used.
2.8 Specific topics
2.8.1 Common Land
Common land is an NE characteristic in Sweden and therefore was not included on the list of the
characteristics to be surveyed during the agricultural census, FSS 2010.
2.8.2 Geographical reference of the holding
For most of the agricultural holdings, the location of the holding was extracted from the
IACS-system. In those cases where this information was not available within the IACS, the
location of holding was extracted from co-ordinates from the Central Cattle Register (about
26
500-600 holdings). For another 2000- 3000 holdings which did not apply for subsidies in
2010 (mainly small farmers), the address of the holder was used for obtaining the location.
In another department of the Swedish Board of Agriculture we have specialists who work with a
data system called Geographic Information System (GIS). They have geographical coordinates
for every block as well as every production location number. One of these specialists connects
the geographical coordinates to every holding by using the following information:
1. Block nearest the location of the holding (65 800 holdings)
2. Production location (200 holdings)
For the remaining holdings which did not apply for subsidies in 2010 (2000-3000 holdings), the
connection between the geographical co-ordinates to the addresses was managed with the help of
GIS specialists at Statistics Sweden. In some cases we could see that the holdings did apply for
subsidies during earlier years. Through information on IACS for the previous years we were able
to extract the location for these holdings. In few other cases we had to deal with holdings for
which no information was available on IACS for previous years. For some of these holdings we
were able to find the location on other administrative registers, while for a few number of those
we had to use the address of the holder. If there was any conflict between the address and the
municipality, we chose to accept municipality as a location reference.
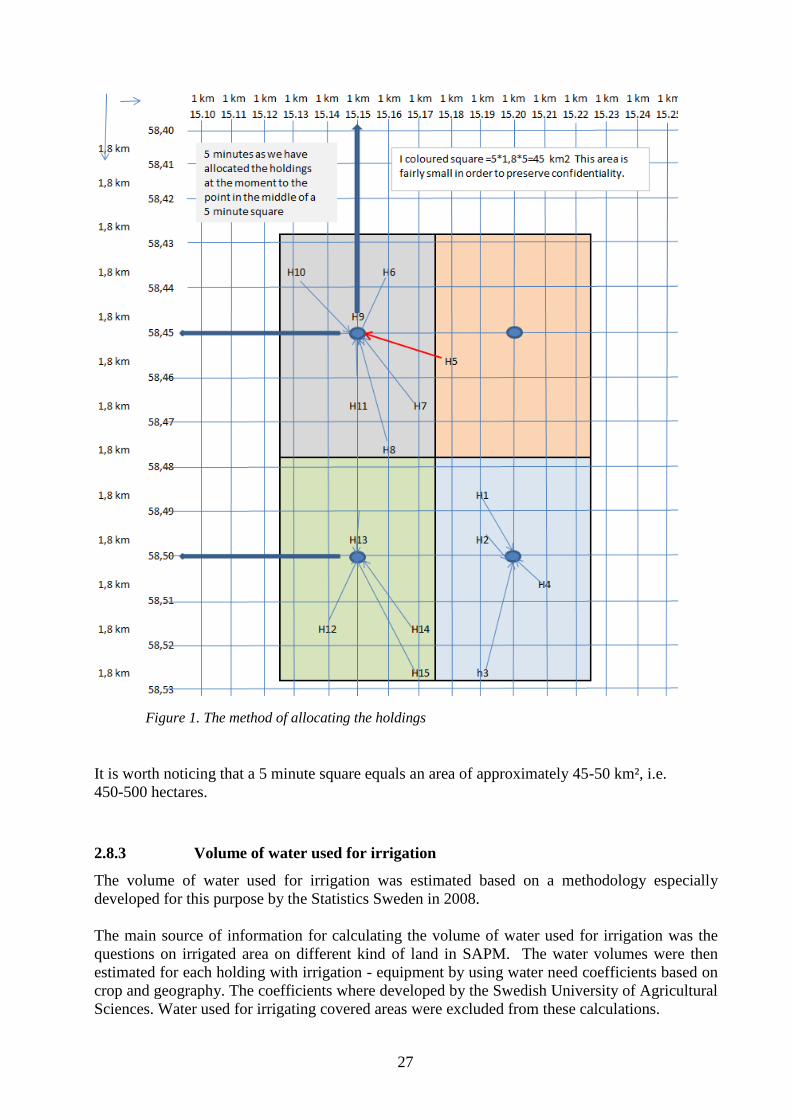
Figure 1 illustrates how the location of holdings has been obtained. We have rounded the minutes
to the nearest 5 minute arc. The holding H10 for example found at the left corner of the figure is
located at 15 degrees 13 minutes. After rounding the coordinates to the nearest 5 minute arc, H10
has been moved to 15 degrees and 15 minutes and so on.
The holding H5 is an illustration for how we have handled single holdings. The H5 found at 15
degrees 18 minutes, which after rounding should have been located to 15 degrees 20 minutes, has
now been moved to 15 degrees 15 minutes (shown by the red arrow). This in order to ensure that
direct identification of the holding cannot take place.
27
Figure 1. The method of allocating the holdings
It is worth noticing that a 5 minute square equals an area of approximately 45-50 km², i.e.
450-500 hectares.
2.8.3 Volume of water used for irrigation
The volume of water used for irrigation was estimated based on a methodology especially
developed for this purpose by the Statistics Sweden in 2008.
The main source of information for calculating the volume of water used for irrigation was the
questions on irrigated area on different kind of land in SAPM. The water volumes were then
estimated for each holding with irrigation - equipment by using water need coefficients based on
crop and geography. The coefficients where developed by the Swedish University of Agricultural
Sciences. Water used for irrigating covered areas were excluded from these calculations.
28
When all agricultural holdings with irrigation equipment were assigned specific irrigated areas
for each drop, the water volumes used for irrigation at each holding were estimated. This was
done by using the water need coefficients which was divided by regions and crop. Thereafter, the
national total water use for irrigation was calculated by summarizing the water use for all
holdings. In the same way one can calculate the water use by regions.
2.9 Response-burden policy
In order to tackle down the non-response, the following measurements were taken:
Written reminders
During the data collection procedure three reminders were sent out to the holdings which did not
provide information within the deadline for the survey (June 23rd
, 2010). The first reminder was
sent out on June 25th
, the second one on July 15th
, while the third one was sent out in the
beginning of September 2010.
Telephone interviews/Follow up interviews
Telephone interviews were used in two different cases: to complete partly answered
questionnaires and to reduce the non-response. The highest non-response rate was on the SP
questionnaire which included all the SAPM variables. The highest partial non-response rate was
on the section of labour force and rural development of the FSS questionnaire (SFK; SFE; SJ).
Telephone interviews and follow up interviews were planned in such a way so important and
large holdings were given priority. About half of the SAPM population (of total 8 731 holdings)
were telephone interviewed by the FSS staff, which was specifically trained to handle the nature
of these variables but also difficult respondents. Given the nature of the SAPM variables and the
fact that this was our first survey on production methods compiled together with the FSS, it was
important to recruit staff that had an educational agricultural background.
3. ACCURACY AND RELIABILITY OF THE DATA COLLECTED
3.1 Data processing, analysis and estimation
3.1.1 Estimation and sampling errors – for SAPM and/or OGA, if applicable
During spring 2011 statistics for the number of holdings, crop areas and the number of animals of
different kinds have been disseminated nationally. Estimates for these characteristics were based
on data from all holdings in the population, which means that the estimates are based on a
census. Thus there are no sampling errors for these characteristics in the national statistics. .
The extrapolation factor was calculated using Horvitz-Thomson estimation in each stratum
described in 2.7. The extrapolation factor was N/n in each stratum. The Relative Sample Error
(RSE) is for some main characteristics presented in the tables below. The RSE concerns
extrapolation from the SAPM-sample. In general these characteristics where included in the
census and do not have any RSE in practice
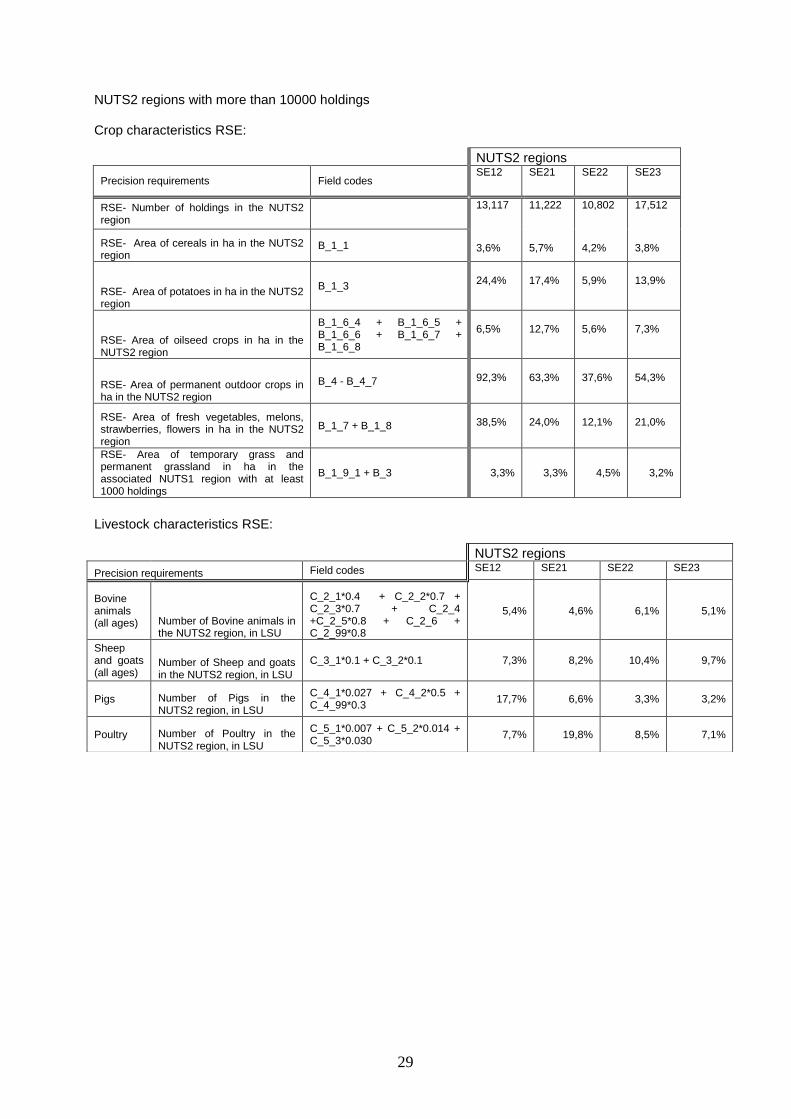
29
NUTS2 regions
Precision requirements Field codes SE12 SE21 SE22 SE23
RSE- Number of holdings in the NUTS2 region
13,117 11,222 10,802 17,512
RSE- Area of cereals in ha in the NUTS2 region
B_1_1 3,6%
5,7%
4,2%
3,8%
RSE- Area of potatoes in ha in the NUTS2 region
B_1_3
24,4%
17,4%
5,9%
13,9%
RSE- Area of oilseed crops in ha in the NUTS2 region
B_1_6_4 + B_1_6_5 + B_1_6_6 + B_1_6_7 + B_1_6_8
6,5%
12,7%
5,6%
7,3%
RSE- Area of permanent outdoor crops in ha in the NUTS2 region
B_4 - B_4_7
92,3%
63,3%
37,6%
54,3%
RSE- Area of fresh vegetables, melons, strawberries, flowers in ha in the NUTS2 region
B_1_7 + B_1_8
38,5%
24,0%
12,1%
21,0%
RSE- Area of temporary grass and permanent grassland in ha in the associated NUTS1 region with at least 1000 holdings
B_1_9_1 + B_3 3,3% 3,3% 4,5% 3,2%
Livestock characteristics RSE:
NUTS2 regions with more than 10000 holdings Crop characteristics RSE:
NUTS2 regions
Precision requirements Field codes SE12 SE21 SE22 SE23
Bovine animals (all ages) Number of Bovine animals in
the NUTS2 region, in LSU
C_2_1*0.4 + C_2_2*0.7 + C_2_3*0.7 + C_2_4 +C_2_5*0.8 + C_2_6 + C_2_99*0.8
5,4% 4,6% 6,1% 5,1%
Sheep and goats (all ages)
Number of Sheep and goats in the NUTS2 region, in LSU
C_3_1*0.1 + C_3_2*0.1 7,3% 8,2% 10,4% 9,7%
Pigs Number of Pigs in the NUTS2 region, in LSU
C_4_1*0.027 + C_4_2*0.5 + C_4_99*0.3
17,7% 6,6% 3,3% 3,2%
Poultry Number of Poultry in the NUTS2 region, in LSU
C_5_1*0.007 + C_5_2*0.014 + C_5_3*0.030
7,7% 19,8% 8,5% 7,1%
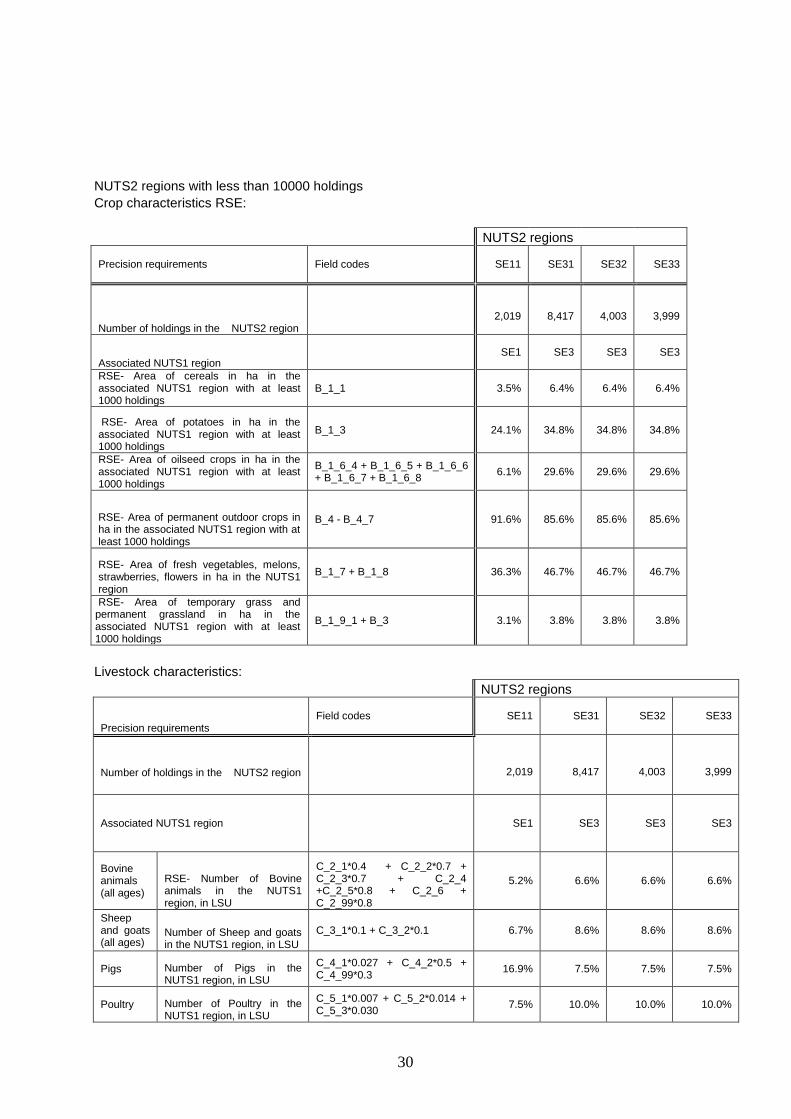
30
NUTS2 regions with less than 10000 holdings
Crop characteristics RSE:
NUTS2 regions
Precision requirements Field codes
SE11
SE31 SE32 SE33
Number of holdings in the NUTS2 region
2,019
8,417
4,003
3,999
Associated NUTS1 region SE1 SE3 SE3 SE3
RSE- Area of cereals in ha in the associated NUTS1 region with at least 1000 holdings
B_1_1 3.5% 6.4% 6.4% 6.4%
RSE- Area of potatoes in ha in the associated NUTS1 region with at least 1000 holdings
B_1_3 24.1% 34.8% 34.8% 34.8%
RSE- Area of oilseed crops in ha in the associated NUTS1 region with at least 1000 holdings
B_1_6_4 + B_1_6_5 + B_1_6_6 + B_1_6_7 + B_1_6_8
6.1% 29.6% 29.6% 29.6%
RSE- Area of permanent outdoor crops in ha in the associated NUTS1 region with at least 1000 holdings
B_4 - B_4_7 91.6% 85.6% 85.6% 85.6%
RSE- Area of fresh vegetables, melons, strawberries, flowers in ha in the NUTS1 region
B_1_7 + B_1_8 36.3% 46.7% 46.7% 46.7%
RSE- Area of temporary grass and permanent grassland in ha in the associated NUTS1 region with at least 1000 holdings
B_1_9_1 + B_3 3.1% 3.8% 3.8% 3.8%
Livestock characteristics: NUTS2 regions
Precision requirements Field codes
SE11
SE31 SE32 SE33
Number of holdings in the NUTS2 region
2,019
8,417
4,003
3,999
Associated NUTS1 region
SE1 SE3 SE3 SE3
Bovine animals (all ages)
RSE- Number of Bovine animals in the NUTS1 region, in LSU
C_2_1*0.4 + C_2_2*0.7 + C_2_3*0.7 + C_2_4 +C_2_5*0.8 + C_2_6 + C_2_99*0.8
5.2% 6.6% 6.6% 6.6%
Sheep and goats (all ages)
Number of Sheep and goats in the NUTS1 region, in LSU
C_3_1*0.1 + C_3_2*0.1 6.7% 8.6% 8.6% 8.6%
Pigs Number of Pigs in the NUTS1 region, in LSU
C_4_1*0.027 + C_4_2*0.5 + C_4_99*0.3
16.9% 7.5% 7.5% 7.5%
Poultry Number of Poultry in the NUTS1 region, in LSU
C_5_1*0.007 + C_5_2*0.014 + C_5_3*0.030
7.5% 10.0% 10.0% 10.0%
31
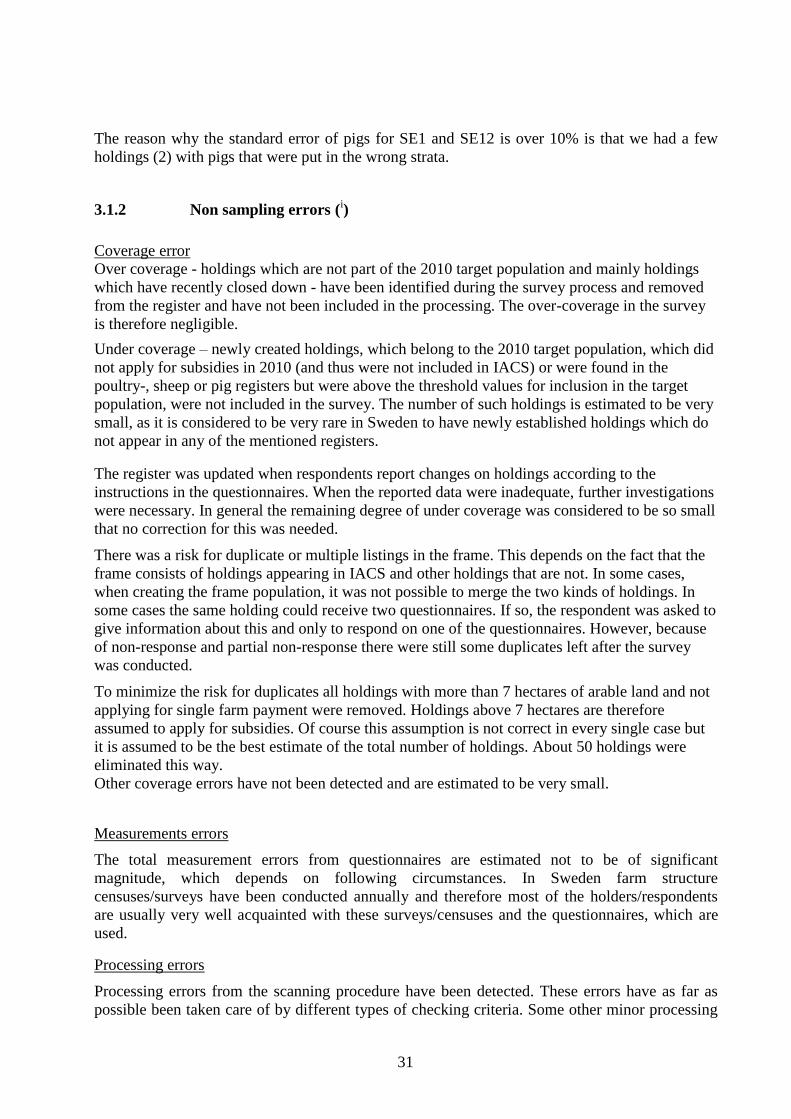
The reason why the standard error of pigs for SE1 and SE12 is over 10% is that we had a few
holdings (2) with pigs that were put in the wrong strata.
3.1.2 Non sampling errors (i)
Coverage error
Over coverage - holdings which are not part of the 2010 target population and mainly holdings
which have recently closed down - have been identified during the survey process and removed
from the register and have not been included in the processing. The over-coverage in the survey
is therefore negligible.
Under coverage – newly created holdings, which belong to the 2010 target population, which did
not apply for subsidies in 2010 (and thus were not included in IACS) or were found in the
poultry-, sheep or pig registers but were above the threshold values for inclusion in the target
population, were not included in the survey. The number of such holdings is estimated to be very
small, as it is considered to be very rare in Sweden to have newly established holdings which do
not appear in any of the mentioned registers.
The register was updated when respondents report changes on holdings according to the
instructions in the questionnaires. When the reported data were inadequate, further investigations
were necessary. In general the remaining degree of under coverage was considered to be so small
that no correction for this was needed.
There was a risk for duplicate or multiple listings in the frame. This depends on the fact that the
frame consists of holdings appearing in IACS and other holdings that are not. In some cases,
when creating the frame population, it was not possible to merge the two kinds of holdings. In
some cases the same holding could receive two questionnaires. If so, the respondent was asked to
give information about this and only to respond on one of the questionnaires. However, because
of non-response and partial non-response there were still some duplicates left after the survey
was conducted.
To minimize the risk for duplicates all holdings with more than 7 hectares of arable land and not
applying for single farm payment were removed. Holdings above 7 hectares are therefore
assumed to apply for subsidies. Of course this assumption is not correct in every single case but
it is assumed to be the best estimate of the total number of holdings. About 50 holdings were
eliminated this way.
Other coverage errors have not been detected and are estimated to be very small.
Measurements errors
The total measurement errors from questionnaires are estimated not to be of significant
magnitude, which depends on following circumstances. In Sweden farm structure
censuses/surveys have been conducted annually and therefore most of the holders/respondents
are usually very well acquainted with these surveys/censuses and the questionnaires, which are
used.
Processing errors
Processing errors from the scanning procedure have been detected. These errors have as far as
possible been taken care of by different types of checking criteria. Some other minor processing
32
errors have also been detected and been taken care off. On the whole the errors from processing
are judged not to be of significant magnitude, even though some errors still can exist on
individual holdings.
Non-response errors
Only a few (less than 100) of the respondents refused to fill in the questionnaire or give
information at telephone contact.
In the census as a whole, 4 % of the respondents did not answer the questionnaire at all. The
corresponding non-response for the survey according to the EU-legislation was 3 %. Some of
these holdings have probably been closed down while others have not been able to get in contact
with despite efforts put down in reminders by post and telephone calls. For part of these non-
respondents, information about crops and bovines were found in IACS or CDB, which confirmed
that these holdings still existed. The holdings where no information was found in administrative
registers where closed down due to the risk of double counting of e.g. crop areas.
Partial non-response was most frequent in the farm labour force section and the rural
development section. In the farm labour force section about 40 % of the respondents had at least
one missing value. However, only about 5 % had missing values for all characteristics in the
labour force section. The partial non-response has been considered to be the most serious type of
non-sampling errors. To avoid bias from partial non-response, much work has been done to
create new imputation methods minimizing the risk for bias from imputation.
Model assumption errors
In the questionnaires the holders are asked to give information about the total area of arable land
and total area of pasture and meadow. The total agricultural area from IACS, for individual
holdings, is not always corresponding to the information given by the holders in the
questionnaires. In the end, data from IACS is used for crop areas and areas of pasture and
meadows. This procedure could cause errors on individual holdings. However the procedure used
should not cause any systematic errors.
3.1.3 Methods for handling missing or incorrect data items
Different methods were adopted to complete missing data.
The following ones were the most important methods used:
a: Following methods were used for correcting general information about the
holdings.
- Analysis of holding transfers indicated on the questionnaires. This often resulted in the
closure of holdings, as these holdings usually had been combined with other holdings.
- From the telephone directory information was collected about telephone numbers for
holdings.
- From the enterprise database information was collected about addresses and if holdings are
still existing.
b: Following methods are among those, which were used to complete/correct data on
the survey characteristics:
33
- From telephone interviews with the respondents
- From the taxation register, information was collected about spouses and about incomes from
other sources than agriculture
- Information from the Farm Structure Survey 2010 for parts of the SAPM
- Information for the same holdings from previous Farm Structure Surveys
- Information from the 2008 horticultural survey
- Information from other registers.
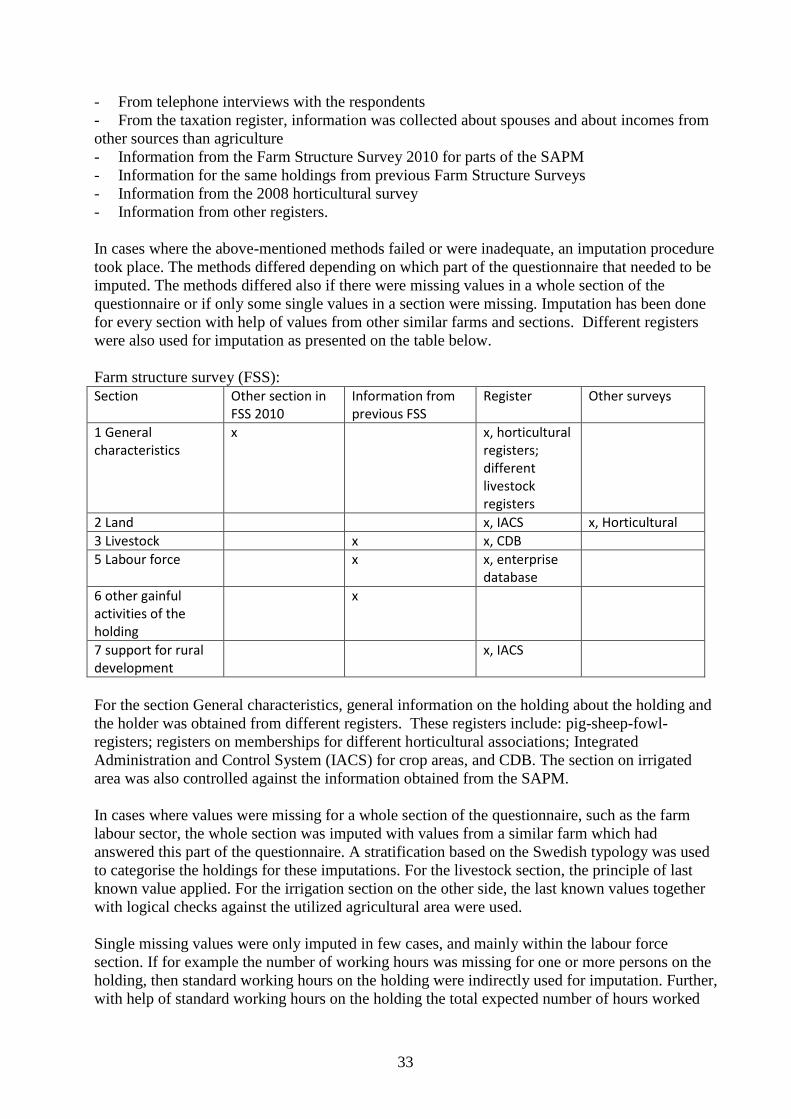
In cases where the above-mentioned methods failed or were inadequate, an imputation procedure
took place. The methods differed depending on which part of the questionnaire that needed to be
imputed. The methods differed also if there were missing values in a whole section of the
questionnaire or if only some single values in a section were missing. Imputation has been done
for every section with help of values from other similar farms and sections. Different registers
were also used for imputation as presented on the table below.
Farm structure survey (FSS):
Section Other section in FSS 2010
Information from previous FSS
Register Other surveys
1 General characteristics
x x, horticultural registers; different livestock registers
2 Land x, IACS x, Horticultural
3 Livestock x x, CDB
5 Labour force x x, enterprise database
6 other gainful activities of the holding
x
7 support for rural development
x, IACS
For the section General characteristics, general information on the holding about the holding and
the holder was obtained from different registers. These registers include: pig-sheep-fowl-
registers; registers on memberships for different horticultural associations; Integrated
Administration and Control System (IACS) for crop areas, and CDB. The section on irrigated
area was also controlled against the information obtained from the SAPM.
In cases where values were missing for a whole section of the questionnaire, such as the farm
labour sector, the whole section was imputed with values from a similar farm which had
answered this part of the questionnaire. A stratification based on the Swedish typology was used
to categorise the holdings for these imputations. For the livestock section, the principle of last
known value applied. For the irrigation section on the other side, the last known values together
with logical checks against the utilized agricultural area were used.
Single missing values were only imputed in few cases, and mainly within the labour force
section. If for example the number of working hours was missing for one or more persons on the
holding, then standard working hours on the holding were indirectly used for imputation. Further,
with help of standard working hours on the holding the total expected number of hours worked
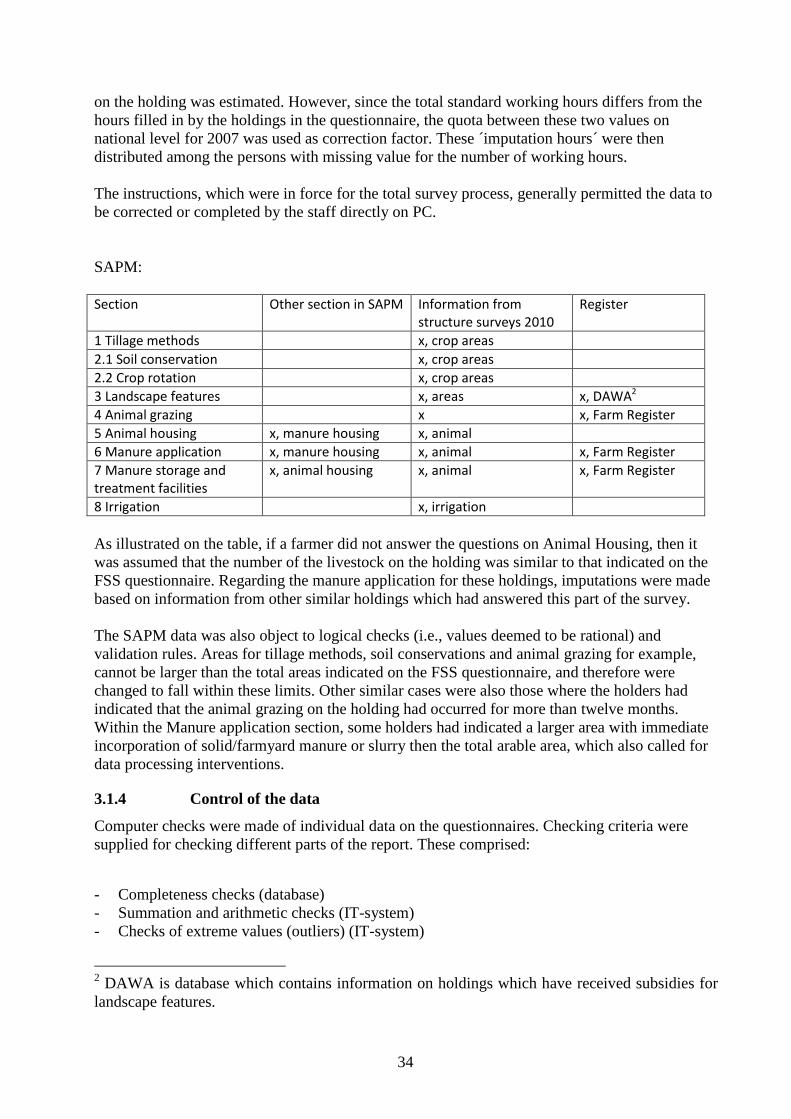
34
on the holding was estimated. However, since the total standard working hours differs from the
hours filled in by the holdings in the questionnaire, the quota between these two values on
national level for 2007 was used as correction factor. These ´imputation hours´ were then
distributed among the persons with missing value for the number of working hours.
The instructions, which were in force for the total survey process, generally permitted the data to
be corrected or completed by the staff directly on PC.
SAPM:
Section Other section in SAPM Information from structure surveys 2010
Register
1 Tillage methods x, crop areas
2.1 Soil conservation x, crop areas
2.2 Crop rotation x, crop areas
3 Landscape features x, areas x, DAWA2
4 Animal grazing x x, Farm Register
5 Animal housing x, manure housing x, animal
6 Manure application x, manure housing x, animal x, Farm Register
7 Manure storage and treatment facilities
x, animal housing x, animal x, Farm Register
8 Irrigation x, irrigation
As illustrated on the table, if a farmer did not answer the questions on Animal Housing, then it
was assumed that the number of the livestock on the holding was similar to that indicated on the
FSS questionnaire. Regarding the manure application for these holdings, imputations were made
based on information from other similar holdings which had answered this part of the survey.
The SAPM data was also object to logical checks (i.e., values deemed to be rational) and
validation rules. Areas for tillage methods, soil conservations and animal grazing for example,
cannot be larger than the total areas indicated on the FSS questionnaire, and therefore were
changed to fall within these limits. Other similar cases were also those where the holders had
indicated that the animal grazing on the holding had occurred for more than twelve months.
Within the Manure application section, some holders had indicated a larger area with immediate
incorporation of solid/farmyard manure or slurry then the total arable area, which also called for
data processing interventions.
3.1.4 Control of the data
Computer checks were made of individual data on the questionnaires. Checking criteria were
supplied for checking different parts of the report. These comprised:
- Completeness checks (database)
- Summation and arithmetic checks (IT-system)
- Checks of extreme values (outliers) (IT-system)
2 DAWA is database which contains information on holdings which have received subsidies for
landscape features.
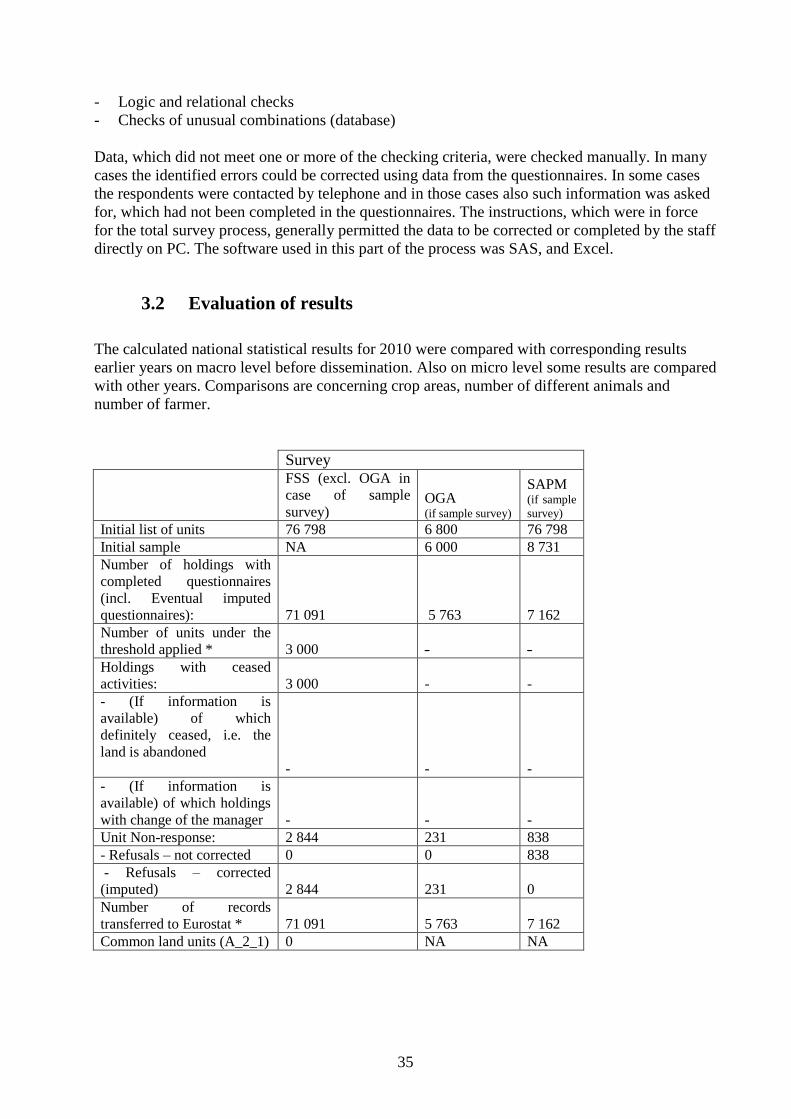
35
- Logic and relational checks
- Checks of unusual combinations (database)
Data, which did not meet one or more of the checking criteria, were checked manually. In many
cases the identified errors could be corrected using data from the questionnaires. In some cases
the respondents were contacted by telephone and in those cases also such information was asked
for, which had not been completed in the questionnaires. The instructions, which were in force
for the total survey process, generally permitted the data to be corrected or completed by the staff
directly on PC. The software used in this part of the process was SAS, and Excel.
3.2 Evaluation of results
The calculated national statistical results for 2010 were compared with corresponding results
earlier years on macro level before dissemination. Also on micro level some results are compared
with other years. Comparisons are concerning crop areas, number of different animals and
number of farmer.
Survey
FSS (excl. OGA in
case of sample
survey) OGA (if sample survey)
SAPM (if sample
survey)
Initial list of units 76 798 6 800 76 798
Initial sample NA 6 000 8 731
Number of holdings with
completed questionnaires
(incl. Eventual imputed
questionnaires): 71 091 5 763 7 162
Number of units under the
threshold applied * 3 000 - -
Holdings with ceased
activities: 3 000 - -
- (If information is
available) of which
definitely ceased, i.e. the
land is abandoned
- - -
- (If information is
available) of which holdings
with change of the manager - - -
Unit Non-response: 2 844 231 838
- Refusals – not corrected 0 0 838
- Refusals – corrected
(imputed) 2 844 231 0
Number of records
transferred to Eurostat * 71 091 5 763 7 162
Common land units (A_2_1) 0 NA NA
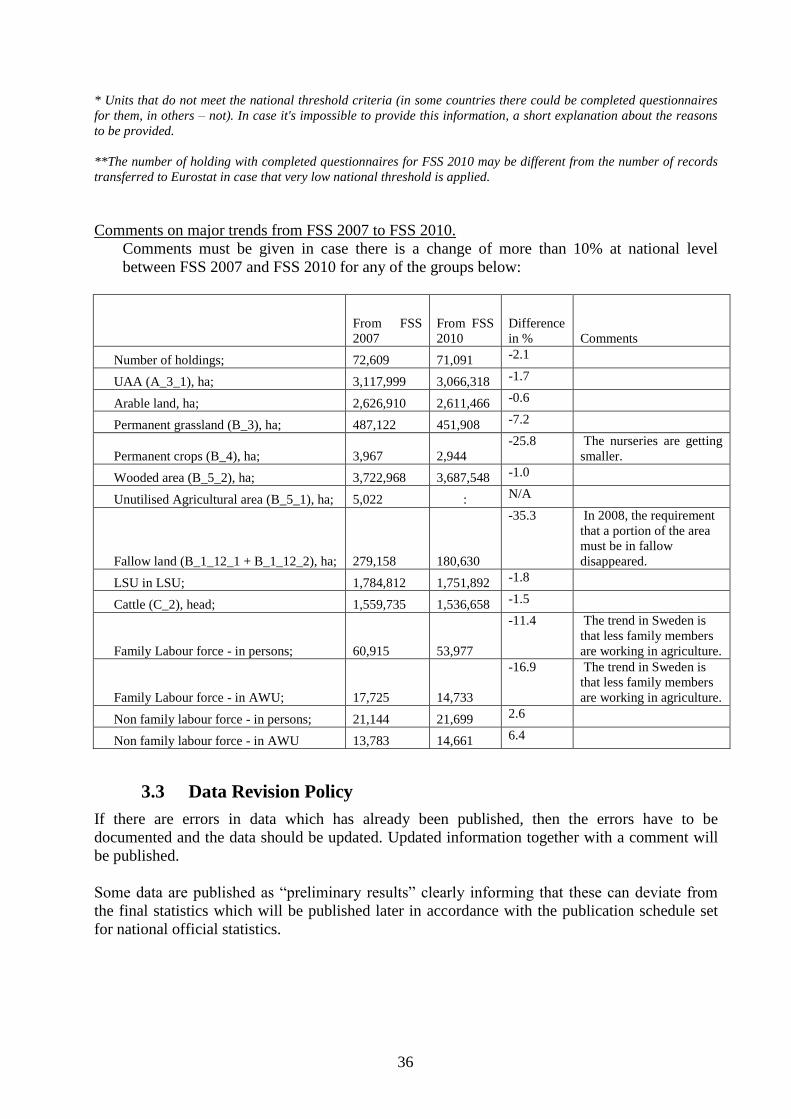
36
* Units that do not meet the national threshold criteria (in some countries there could be completed questionnaires
for them, in others – not). In case it's impossible to provide this information, a short explanation about the reasons
to be provided.
**The number of holding with completed questionnaires for FSS 2010 may be different from the number of records
transferred to Eurostat in case that very low national threshold is applied.
Comments on major trends from FSS 2007 to FSS 2010.
Comments must be given in case there is a change of more than 10% at national level
between FSS 2007 and FSS 2010 for any of the groups below:
From FSS
2007
From FSS
2010
Difference
in % Comments
Number of holdings; 72,609 71,091 -2.1
UAA (A_3_1), ha; 3,117,999 3,066,318 -1.7
Arable land, ha; 2,626,910 2,611,466 -0.6
Permanent grassland (B_3), ha; 487,122 451,908 -7.2
Permanent crops (B_4), ha; 3,967 2,944
-25.8 The nurseries are getting
smaller.
Wooded area (B_5_2), ha; 3,722,968 3,687,548 -1.0
Unutilised Agricultural area (B_5_1), ha; 5,022 : N/A
Fallow land (B_1_12_1 + B_1_12_2), ha; 279,158 180,630
-35.3 In 2008, the requirement
that a portion of the area
must be in fallow
disappeared.
LSU in LSU; 1,784,812 1,751,892 -1.8
Cattle (C_2), head; 1,559,735 1,536,658 -1.5
Family Labour force - in persons; 60,915 53,977
-11.4 The trend in Sweden is
that less family members
are working in agriculture.
Family Labour force - in AWU; 17,725 14,733
-16.9 The trend in Sweden is
that less family members
are working in agriculture.
Non family labour force - in persons; 21,144 21,699 2.6
Non family labour force - in AWU 13,783 14,661 6.4
3.3 Data Revision Policy
If there are errors in data which has already been published, then the errors have to be
documented and the data should be updated. Updated information together with a comment will
be published.
Some data are published as “preliminary results” clearly informing that these can deviate from
the final statistics which will be published later in accordance with the publication schedule set
for national official statistics.
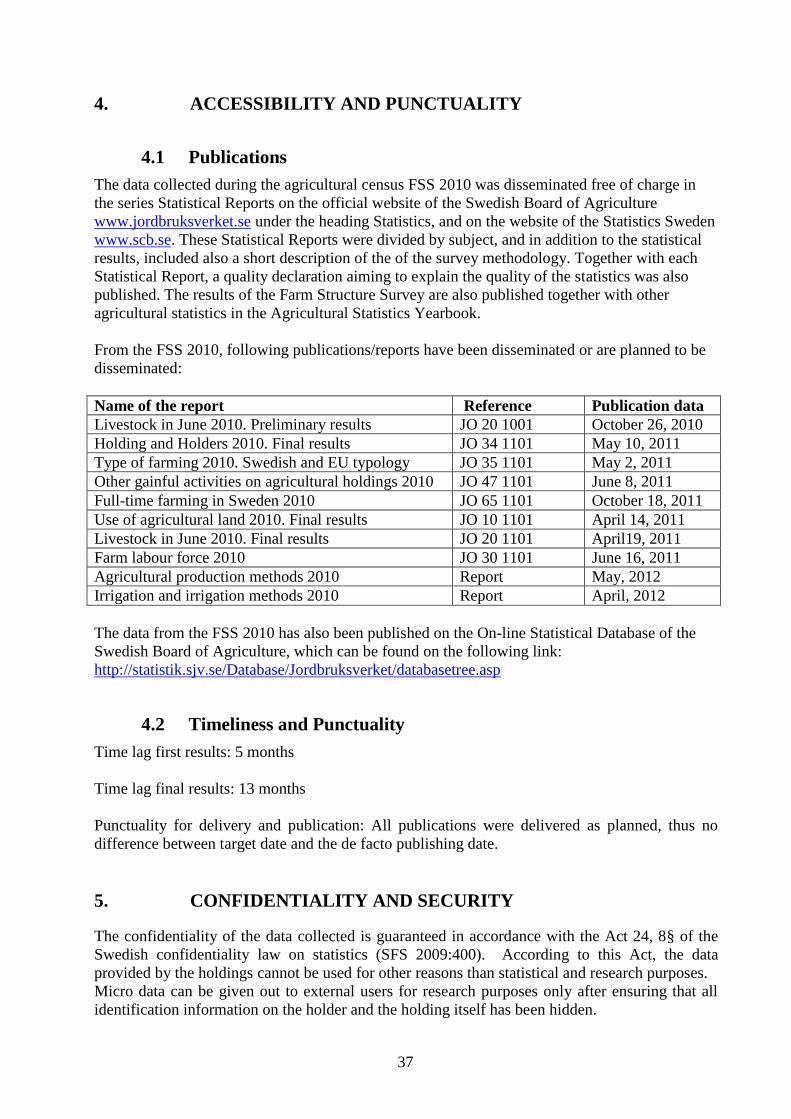
37
4. ACCESSIBILITY AND PUNCTUALITY
4.1 Publications
The data collected during the agricultural census FSS 2010 was disseminated free of charge in
the series Statistical Reports on the official website of the Swedish Board of Agriculture
www.jordbruksverket.se under the heading Statistics, and on the website of the Statistics Sweden
www.scb.se. These Statistical Reports were divided by subject, and in addition to the statistical
results, included also a short description of the of the survey methodology. Together with each
Statistical Report, a quality declaration aiming to explain the quality of the statistics was also
published. The results of the Farm Structure Survey are also published together with other
agricultural statistics in the Agricultural Statistics Yearbook.
From the FSS 2010, following publications/reports have been disseminated or are planned to be
disseminated:
Name of the report Reference Publication data
Livestock in June 2010. Preliminary results JO 20 1001 October 26, 2010
Holding and Holders 2010. Final results JO 34 1101 May 10, 2011
Type of farming 2010. Swedish and EU typology JO 35 1101 May 2, 2011
Other gainful activities on agricultural holdings 2010 JO 47 1101 June 8, 2011
Full-time farming in Sweden 2010 JO 65 1101 October 18, 2011
Use of agricultural land 2010. Final results JO 10 1101 April 14, 2011
Livestock in June 2010. Final results JO 20 1101 April19, 2011
Farm labour force 2010 JO 30 1101 June 16, 2011
Agricultural production methods 2010 Report May, 2012
Irrigation and irrigation methods 2010 Report April, 2012
The data from the FSS 2010 has also been published on the On-line Statistical Database of the
Swedish Board of Agriculture, which can be found on the following link:
http://statistik.sjv.se/Database/Jordbruksverket/databasetree.asp
4.2 Timeliness and Punctuality
Time lag first results: 5 months
Time lag final results: 13 months
Punctuality for delivery and publication: All publications were delivered as planned, thus no
difference between target date and the de facto publishing date.
5. CONFIDENTIALITY AND SECURITY
The confidentiality of the data collected is guaranteed in accordance with the Act 24, 8§ of the
Swedish confidentiality law on statistics (SFS 2009:400). According to this Act, the data
provided by the holdings cannot be used for other reasons than statistical and research purposes.
Micro data can be given out to external users for research purposes only after ensuring that all
identification information on the holder and the holding itself has been hidden.
38
The same law applies during the dissemination of the results. For ensuring non-identification of
individual holdings during the dissemination, the number of the holdings within a region or
municipality is not disclosed if the region or the municipality in question has less than three
agricultural holdings. In such cases the symbol [..] is given in the table cell.
REFERENCES
Water use for irrigation. Report on Grant Agreement No 71301.2006.002-2006.470, Brundell P.,
Kanlén F., Westöö A-K. June 2008
http://www.scb.se/Pages/GsaSearch____287280.aspx?QueryTerm=water+use+for+irrigation&Pa
geIndex=1&hl=sv
ANNEXES
Questionnaire(s)
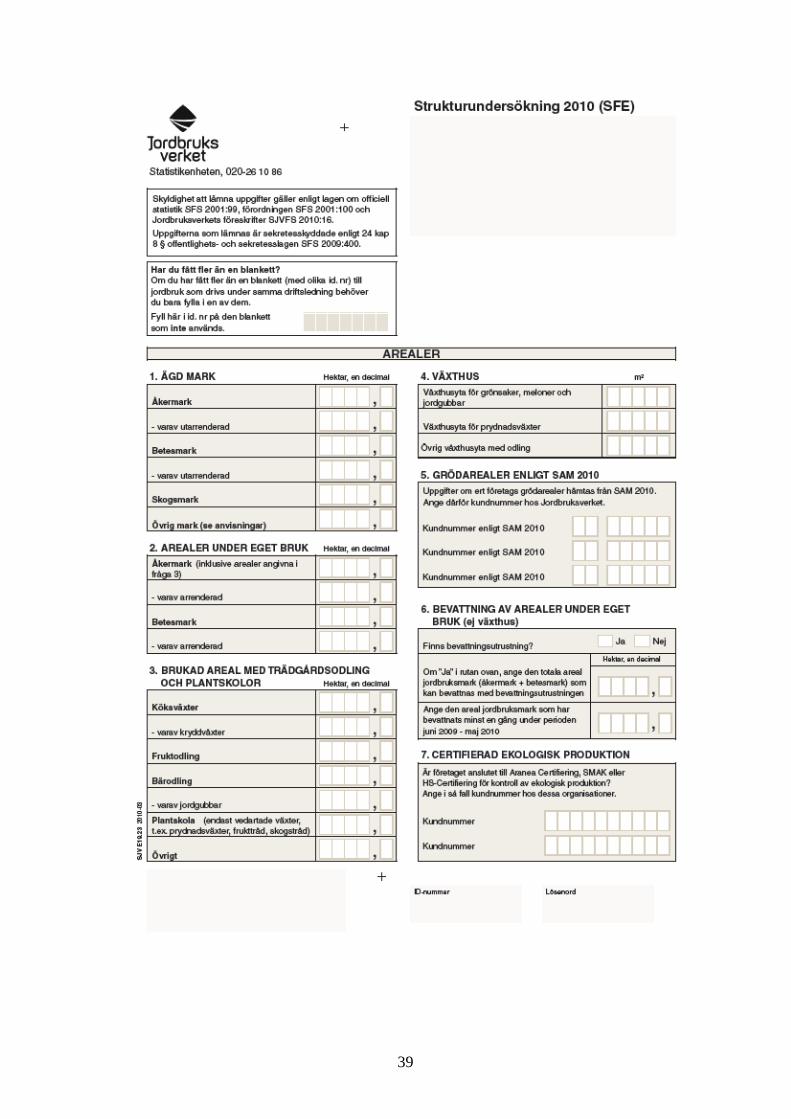
39

40
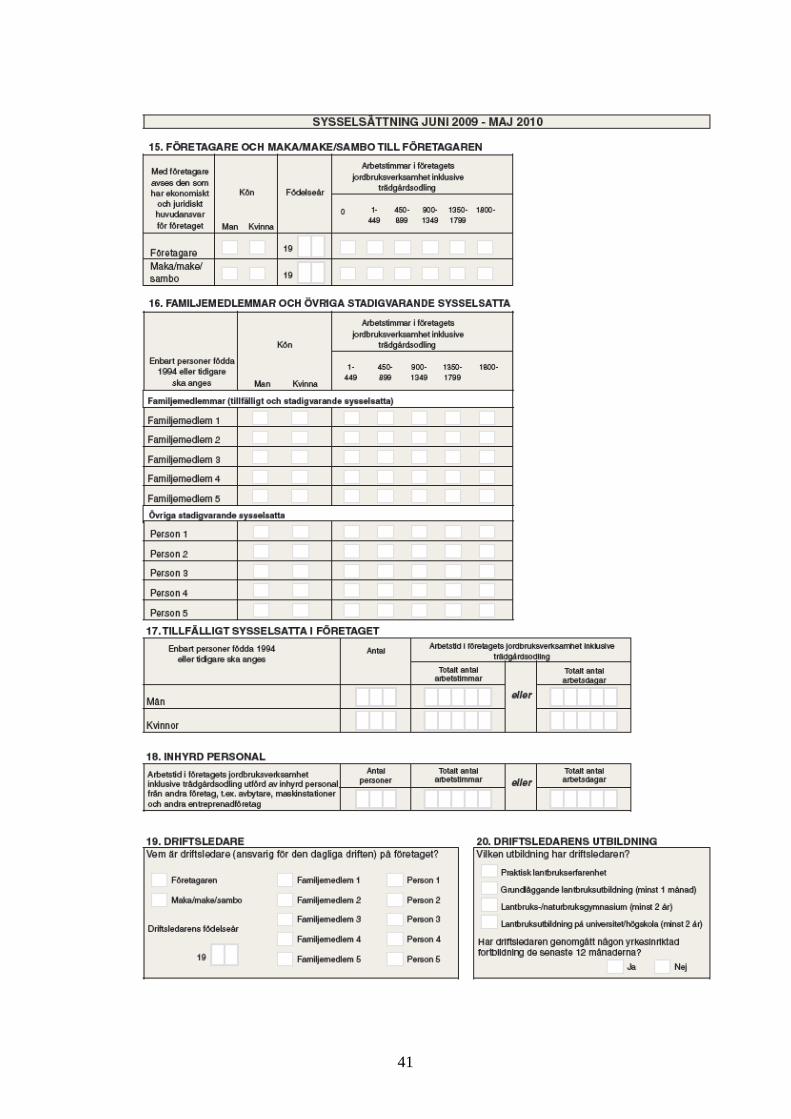
41
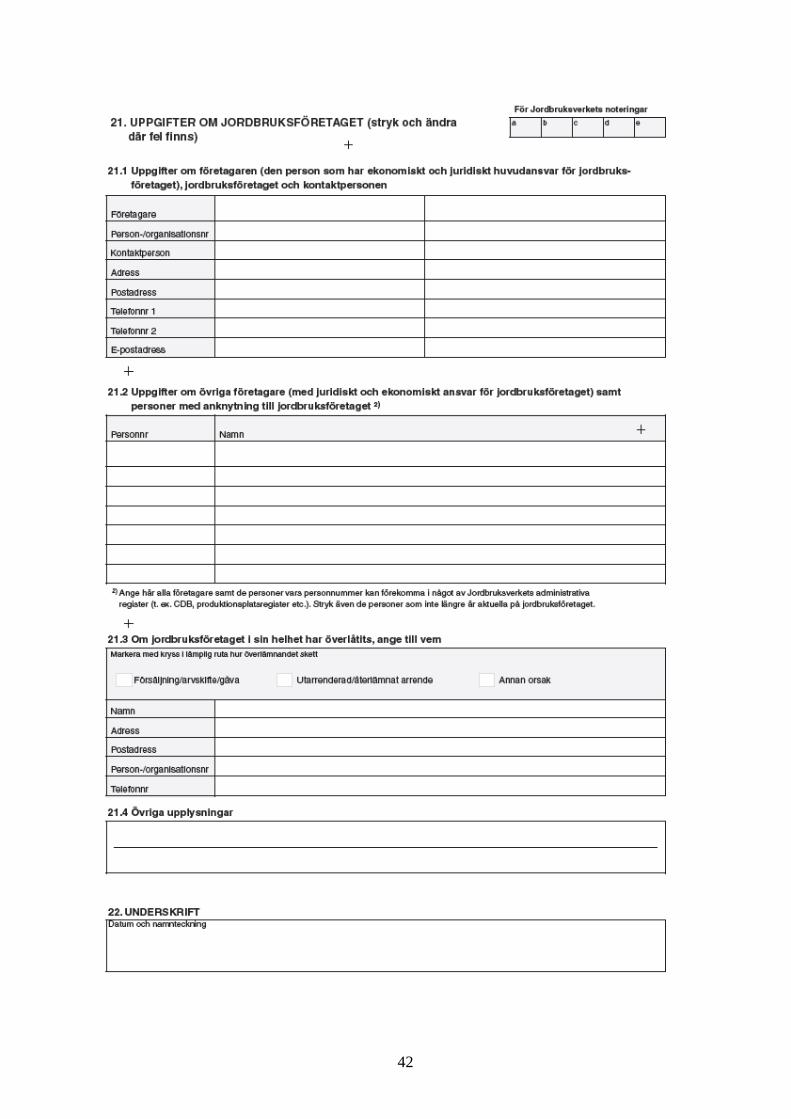
42
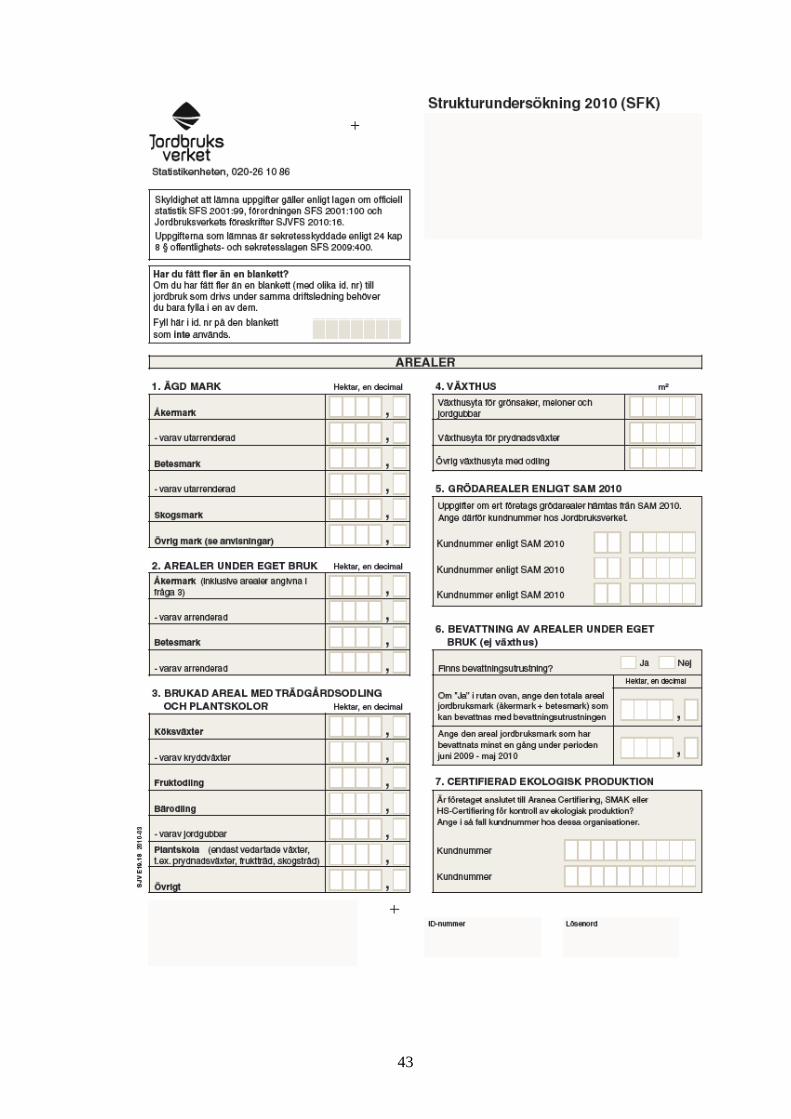
43
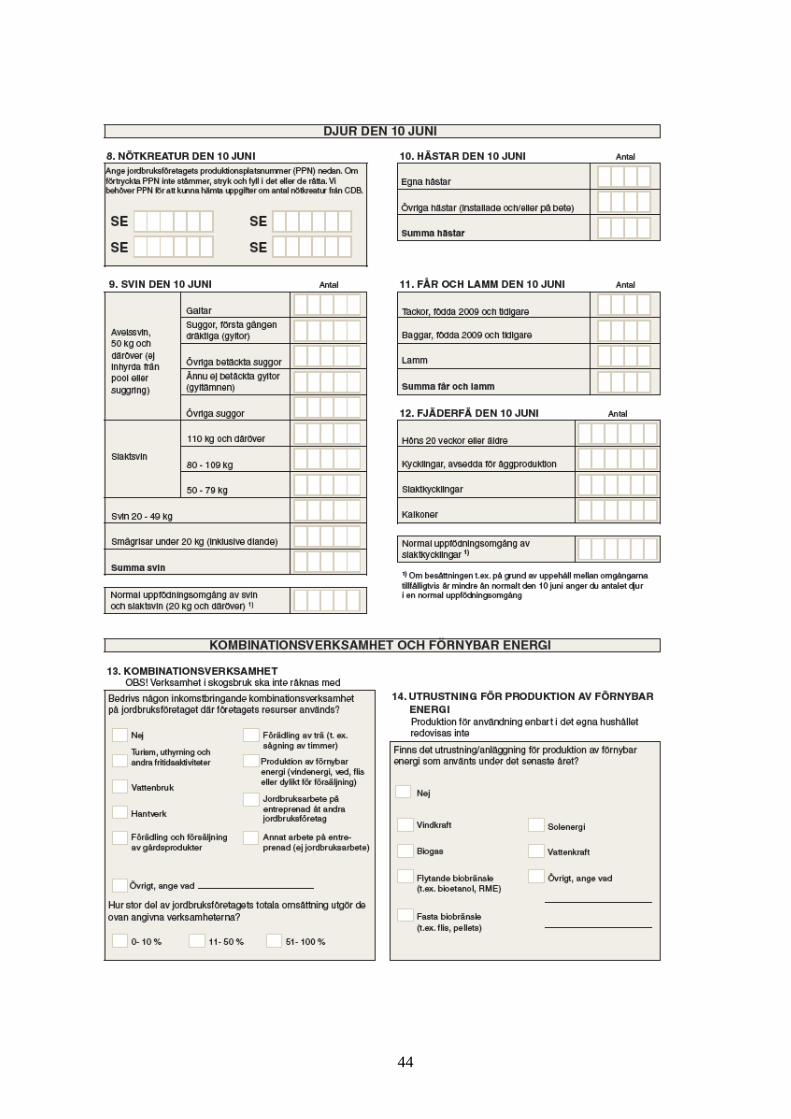
44
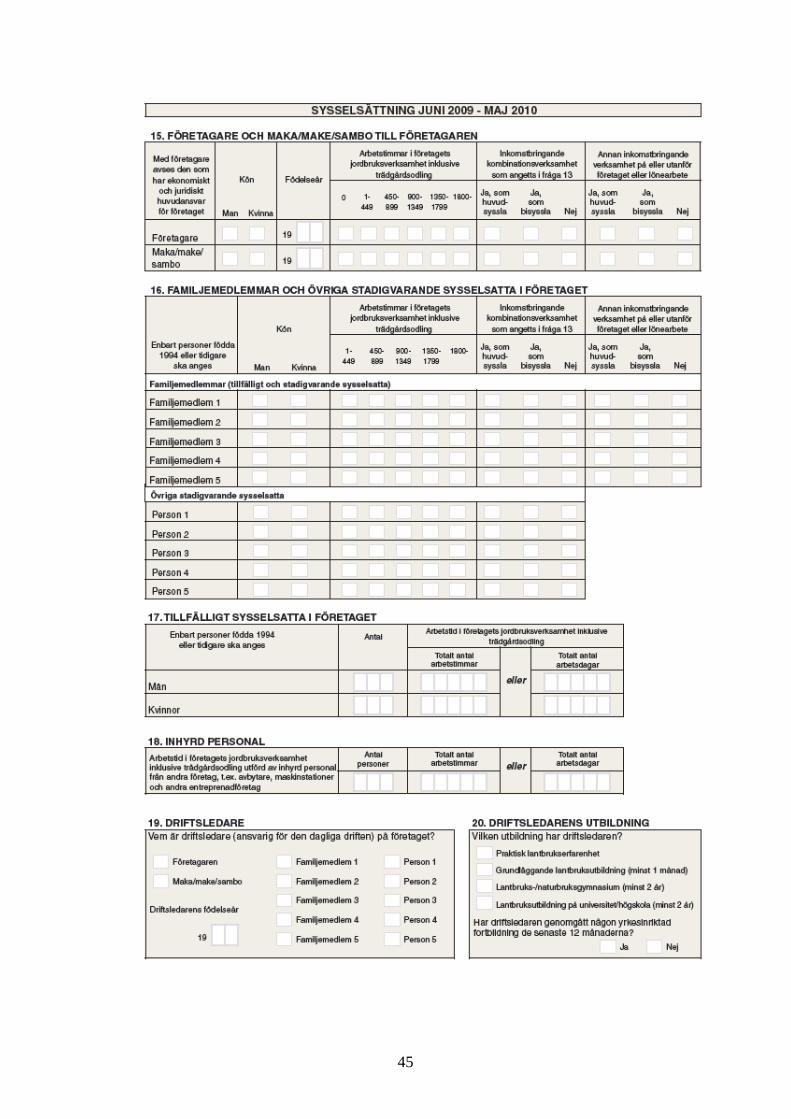
45
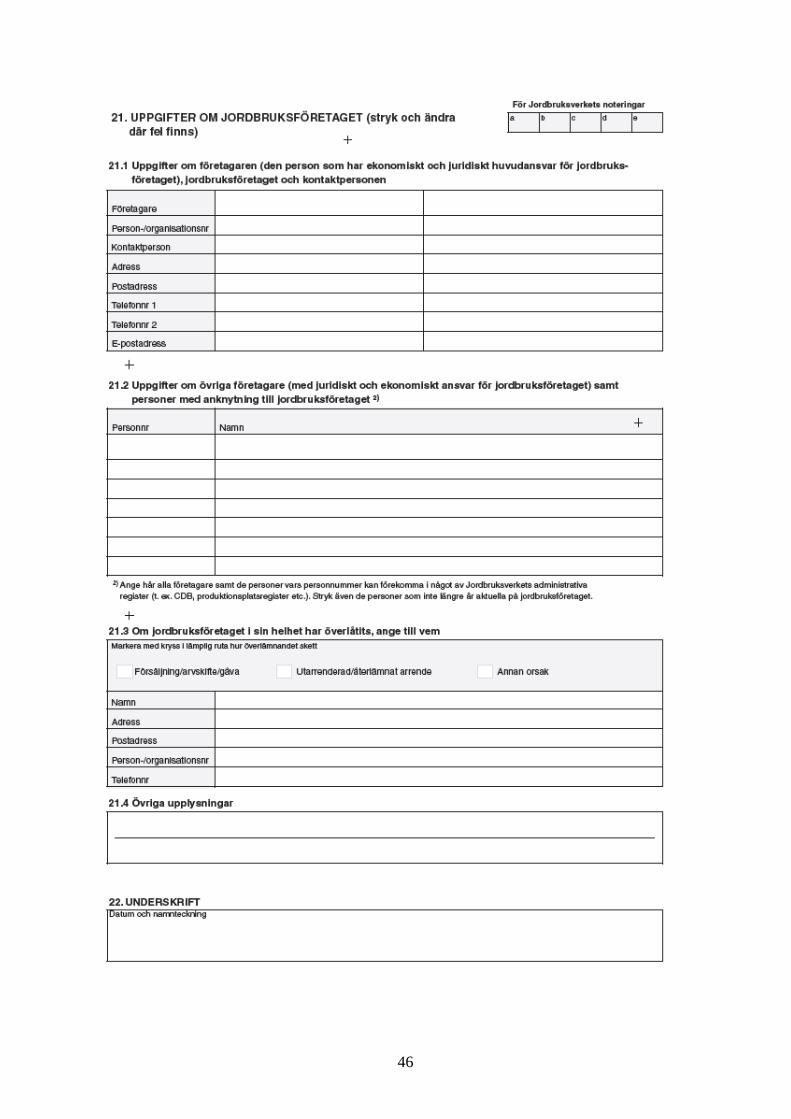
46
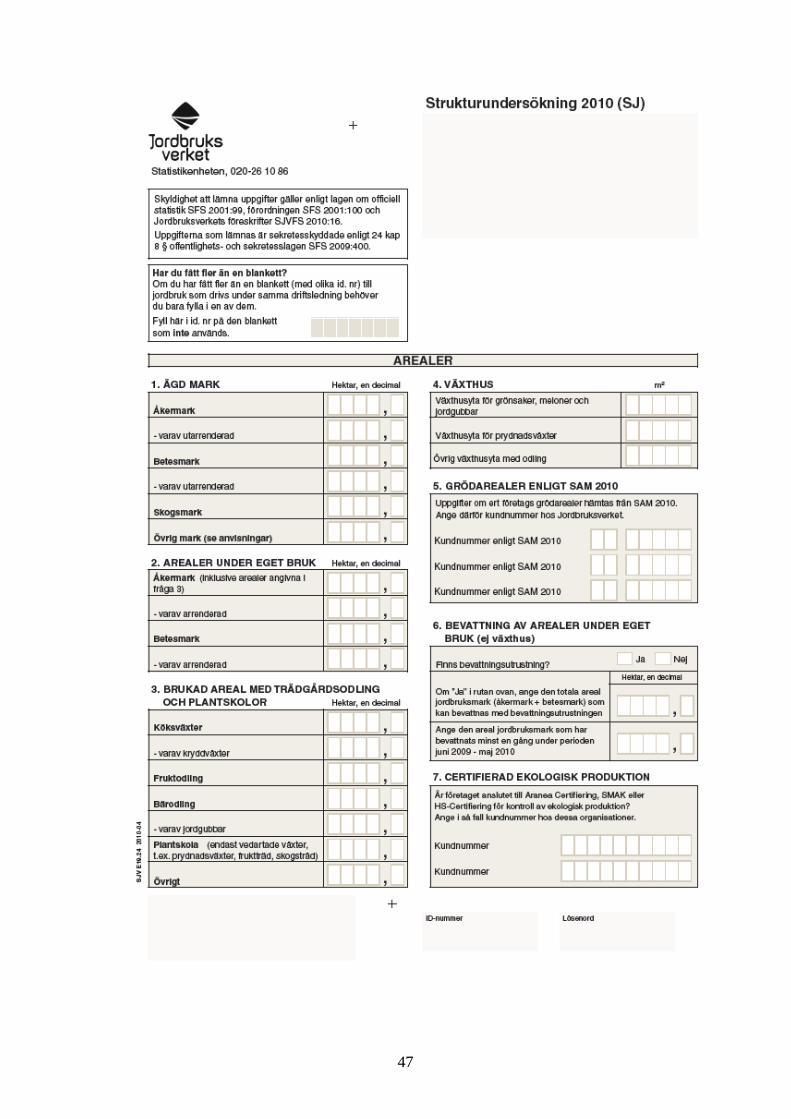
47
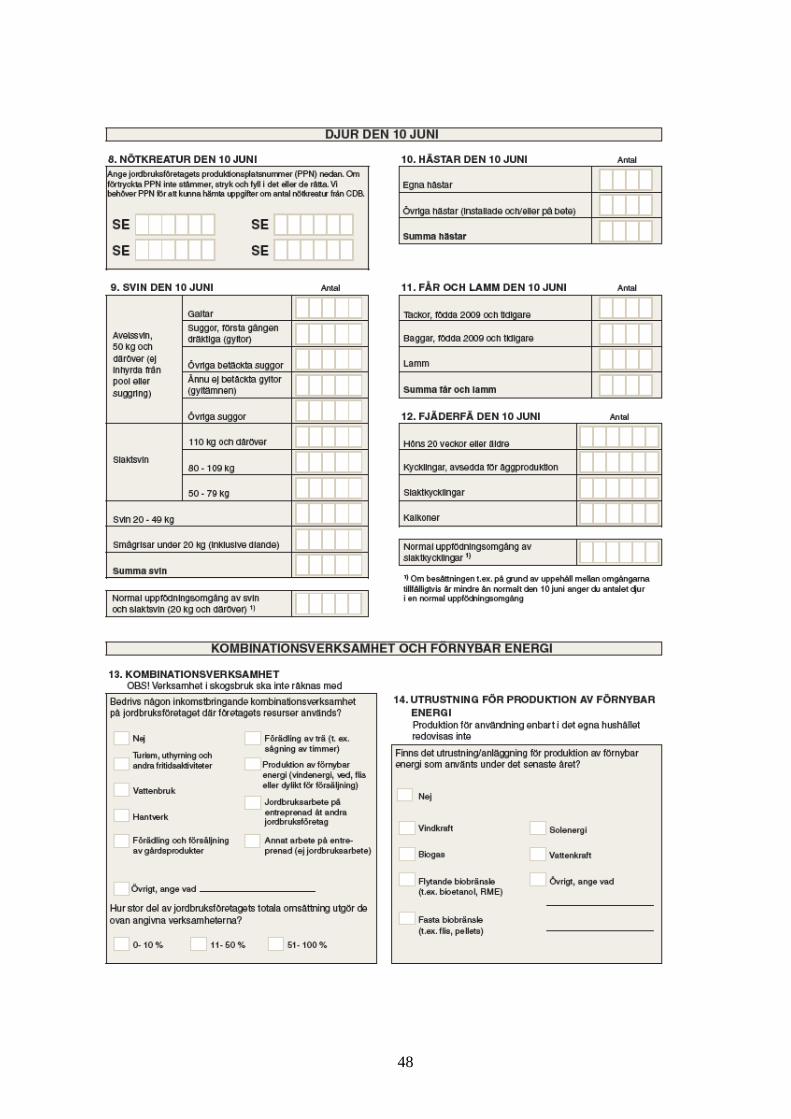
48
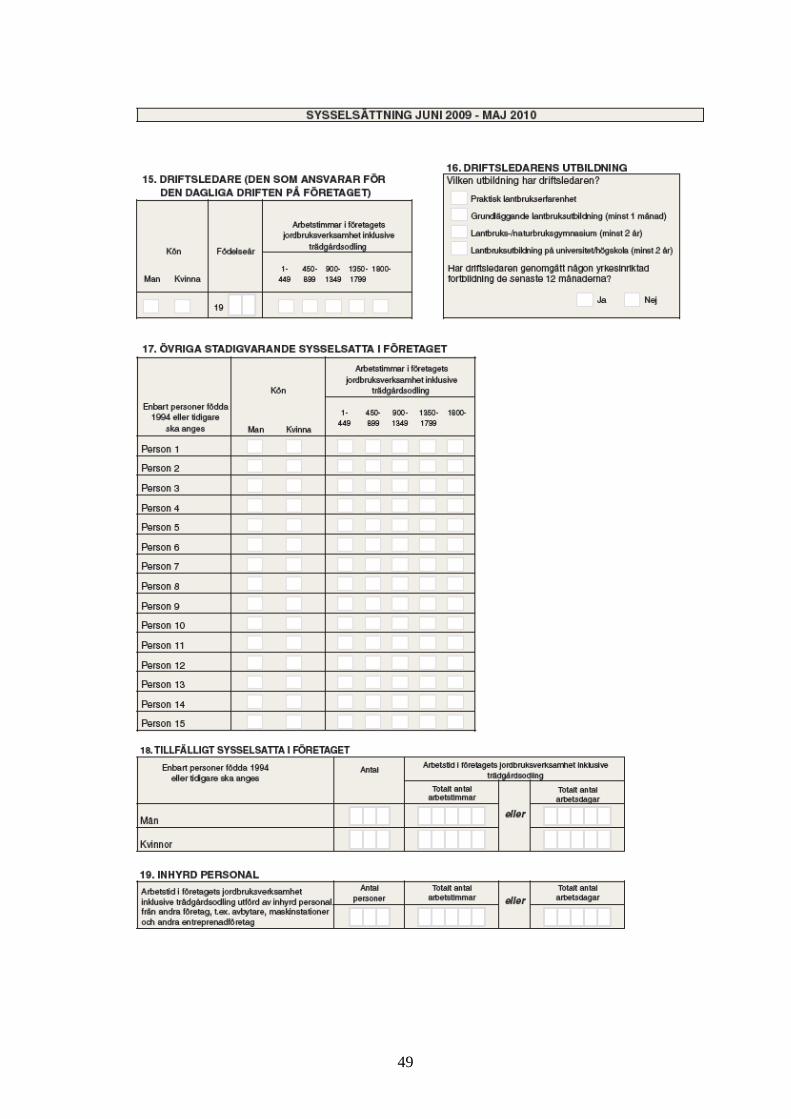
49
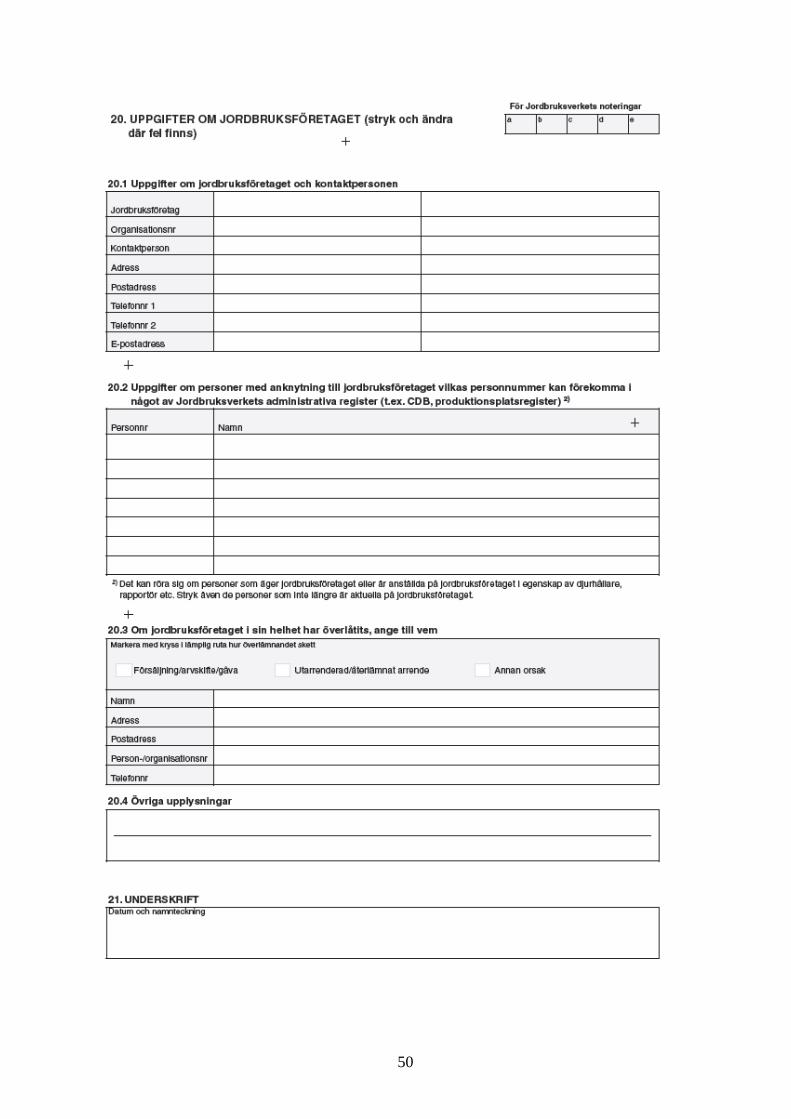
50
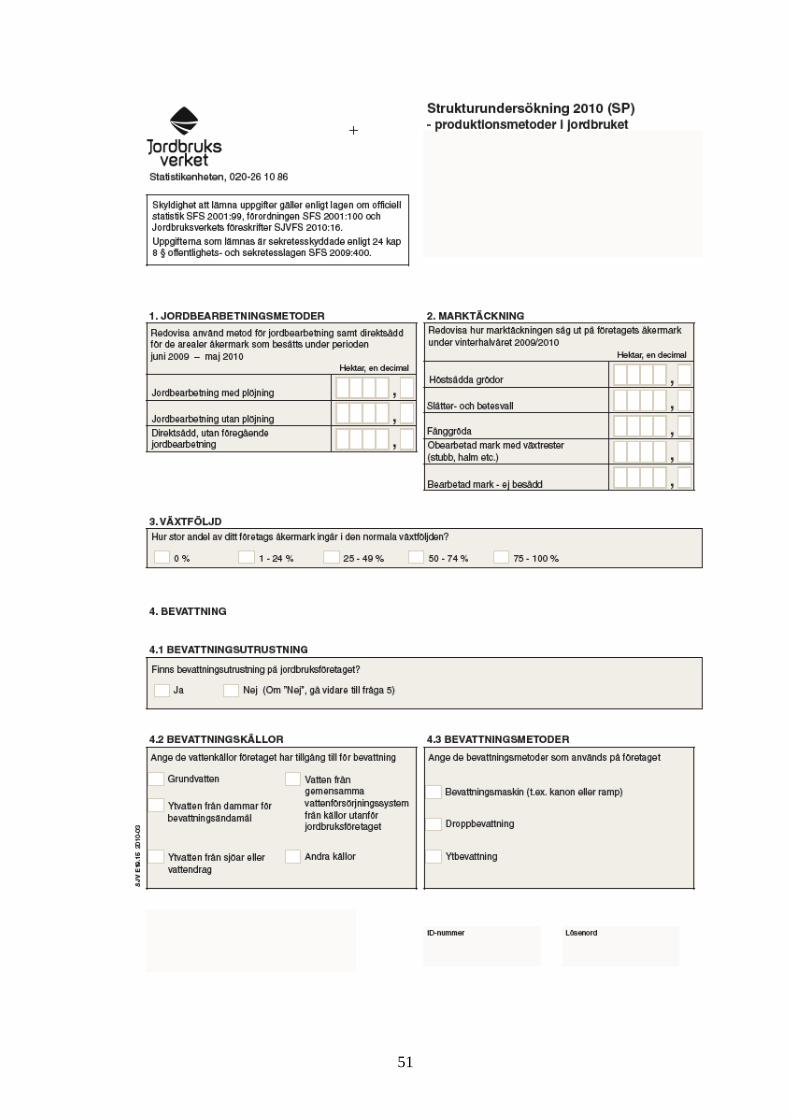
51
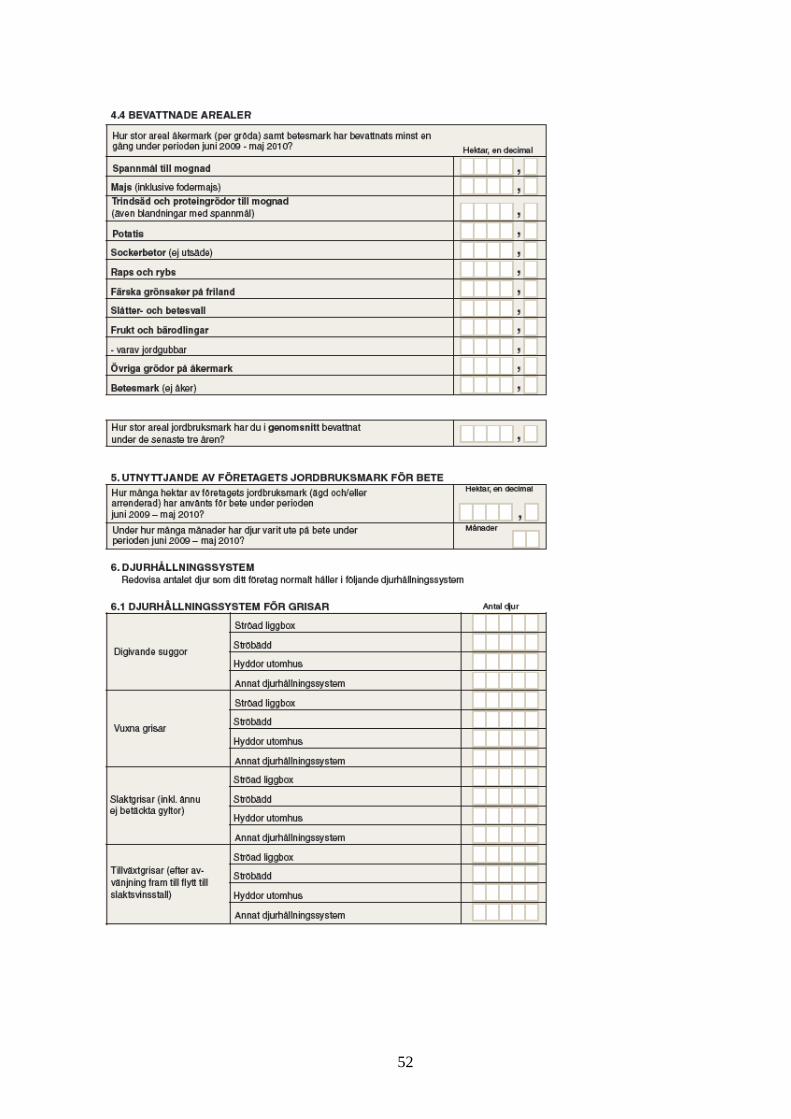
52
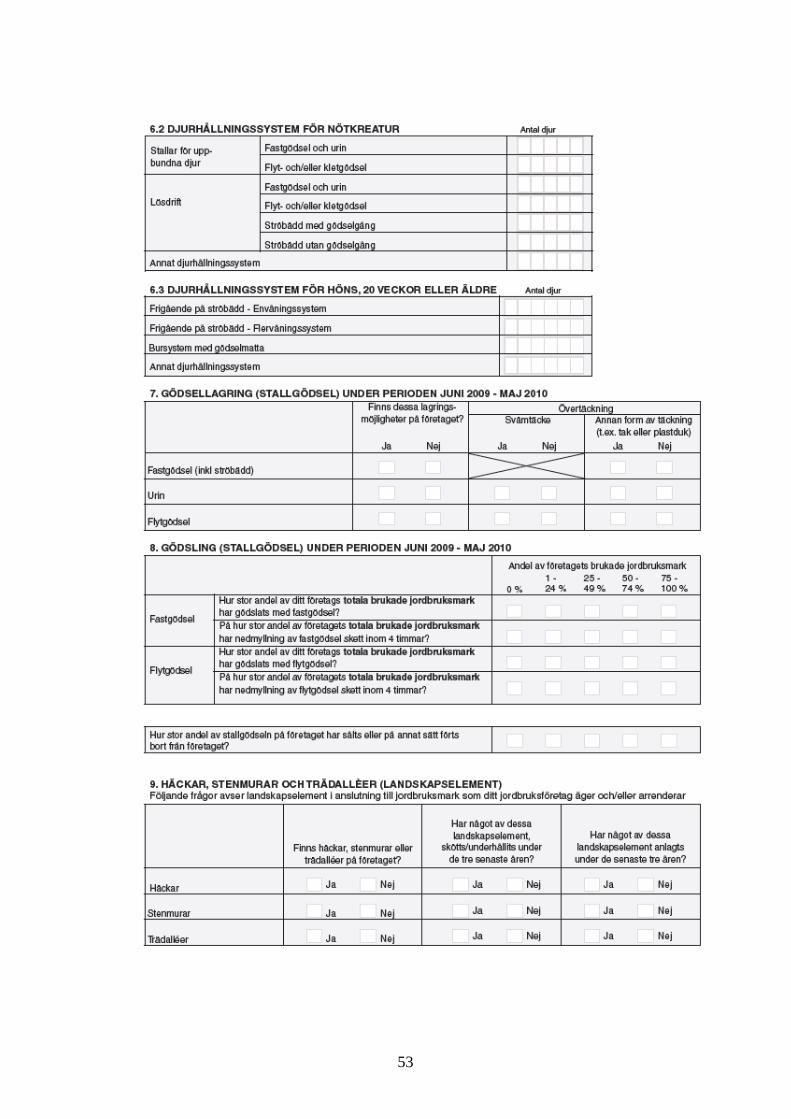
53
54
ENDNOTES
(
i) Non-sampling error is the error attributable to all sources other than sampling error. Non-sampling errors
arise during the planning, conducting, data processing and final estimation stages of all types of survey.