Embed Size (px)
Citation preview
1
EPI-820 Evidence-Based Medicine
LECTURE 5: SCREENING
Mat Reeves BVSc, PhD
2
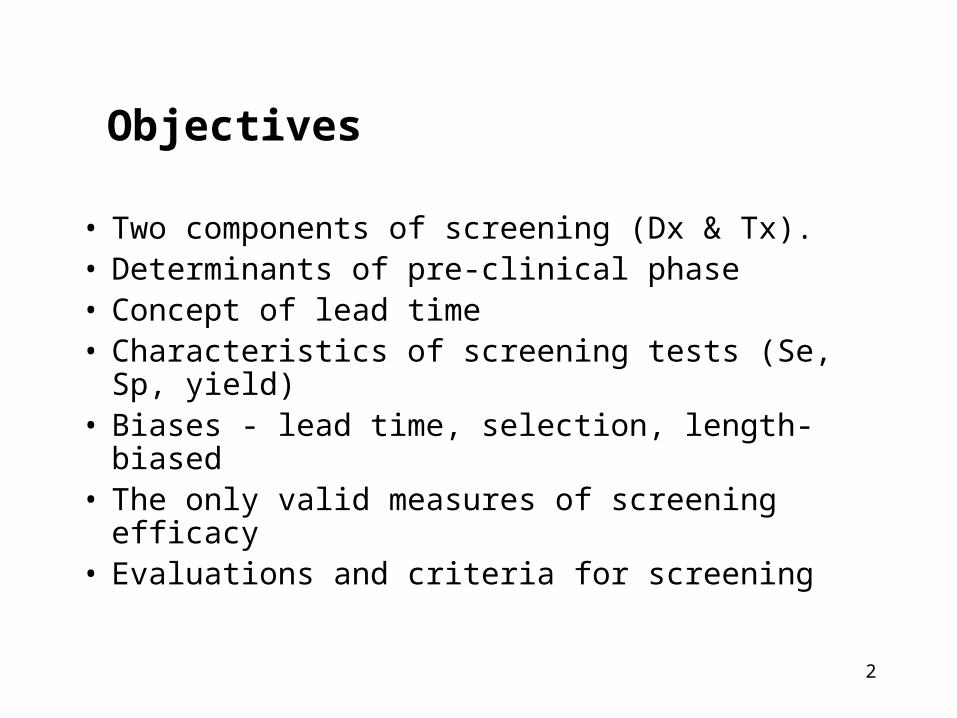
Objectives
• Two components of screening (Dx & Tx).• Determinants of pre-clinical phase• Concept of lead time • Characteristics of screening tests (Se, Sp,
yield) • Biases - lead time, selection, length-biased• The only valid measures of screening efficacy• Evaluations and criteria for screening
3
I. Introduction
• Objective: to reduce mortality and/or morbidity by early detection and treatment.
• Secondary prevention.
• Asymptomatic individuals are classified as either unlikely or possibly having disease.
4
Introduction
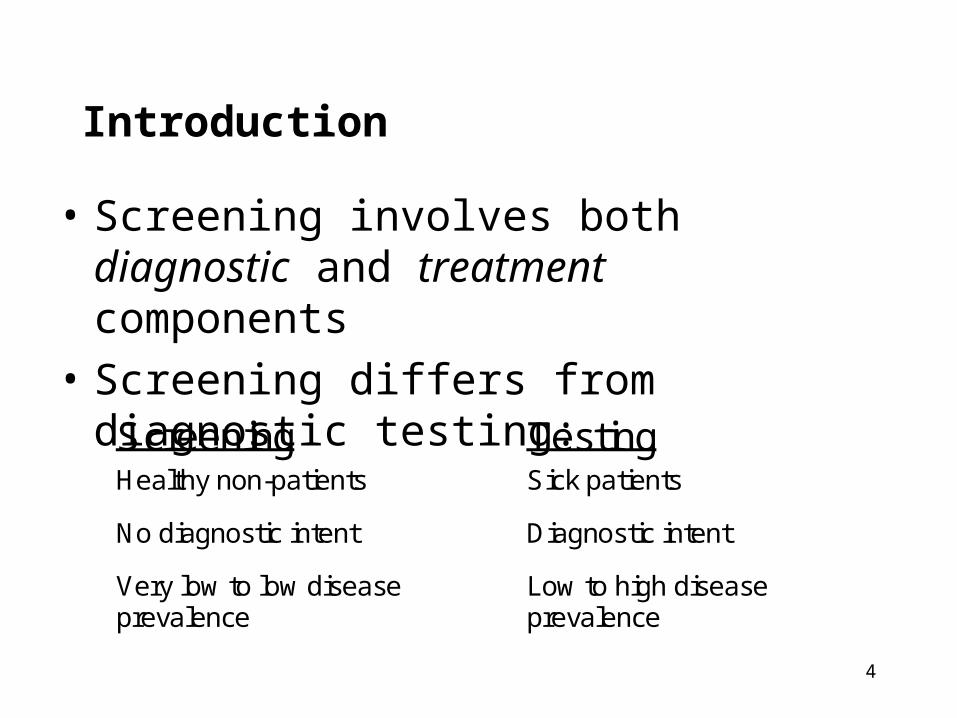
• Screening involves both diagnostic and treatment components
• Screening differs from diagnostic testing:
Screening Testing Healthy non-patients Sick patients
No diagnostic intent Diagnostic intent
Very low to low disease prevalence
Low to high disease prevalence
5
Screening - Introduction
• There are two forms of screening which involve fundamentally different formats, organization and intent:
• Mass or population-based screening
• Case finding
• This lecture covers mass screening for non-infectious (chronic) diseases only.
6
II. Characteristics of Disease
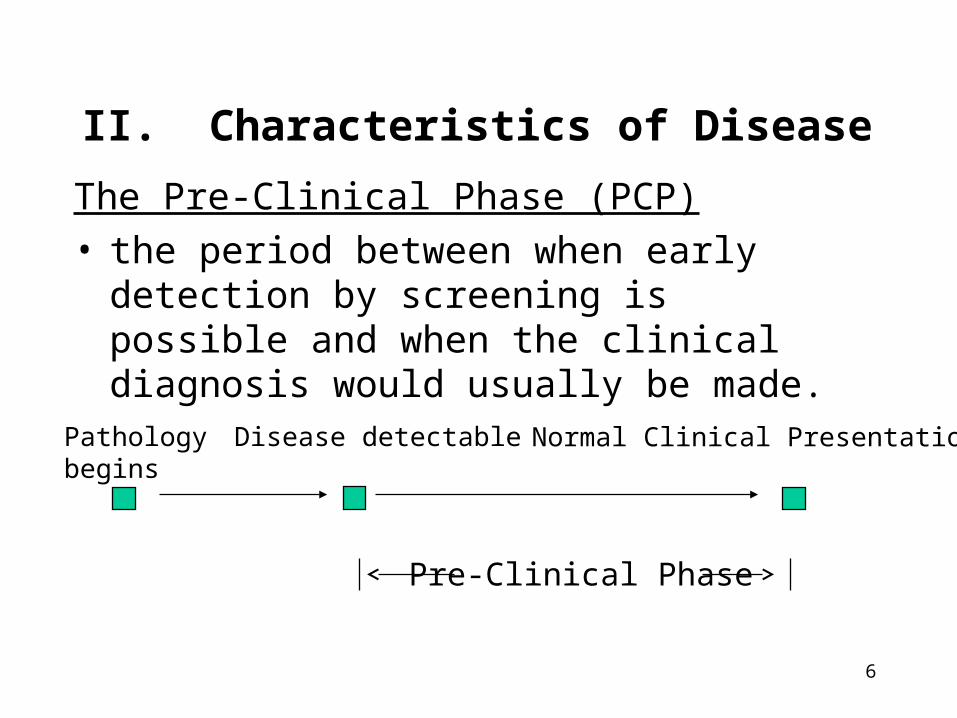
The Pre-Clinical Phase (PCP)• the period between when early detection by
screening is possible and when the clinical diagnosis would usually be made.
Pathology begins
Disease detectable Normal Clinical Presentation
Pre-Clinical Phase
7
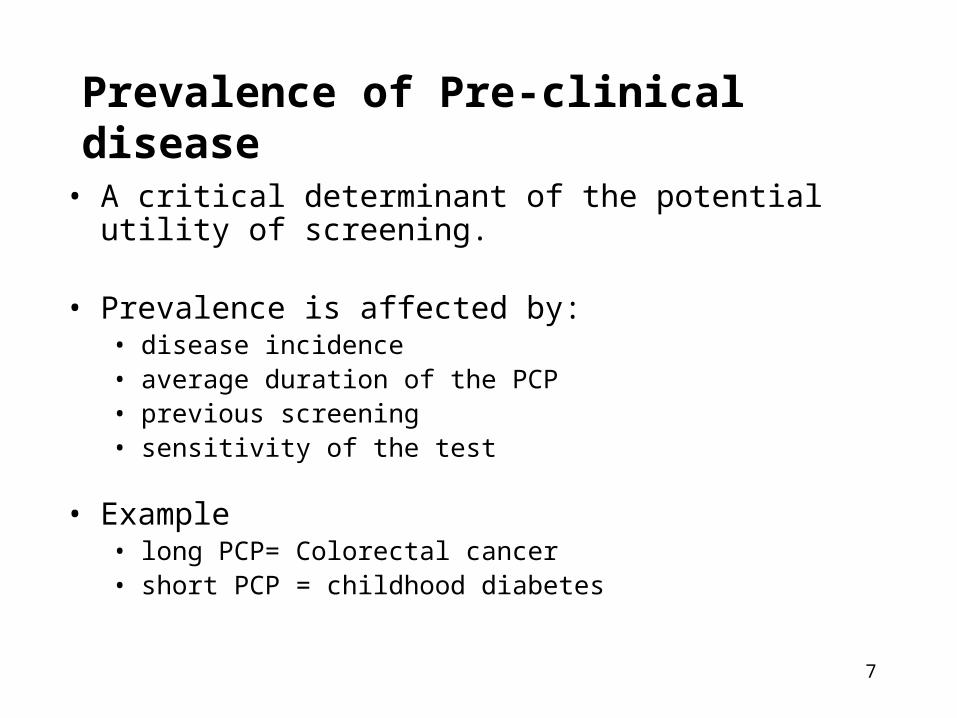
Prevalence of Pre-clinical disease
• A critical determinant of the potential utility of screening.
• Prevalence is affected by:• disease incidence• average duration of the PCP • previous screening • sensitivity of the test
• Example • long PCP= Colorectal cancer• short PCP = childhood diabetes
8
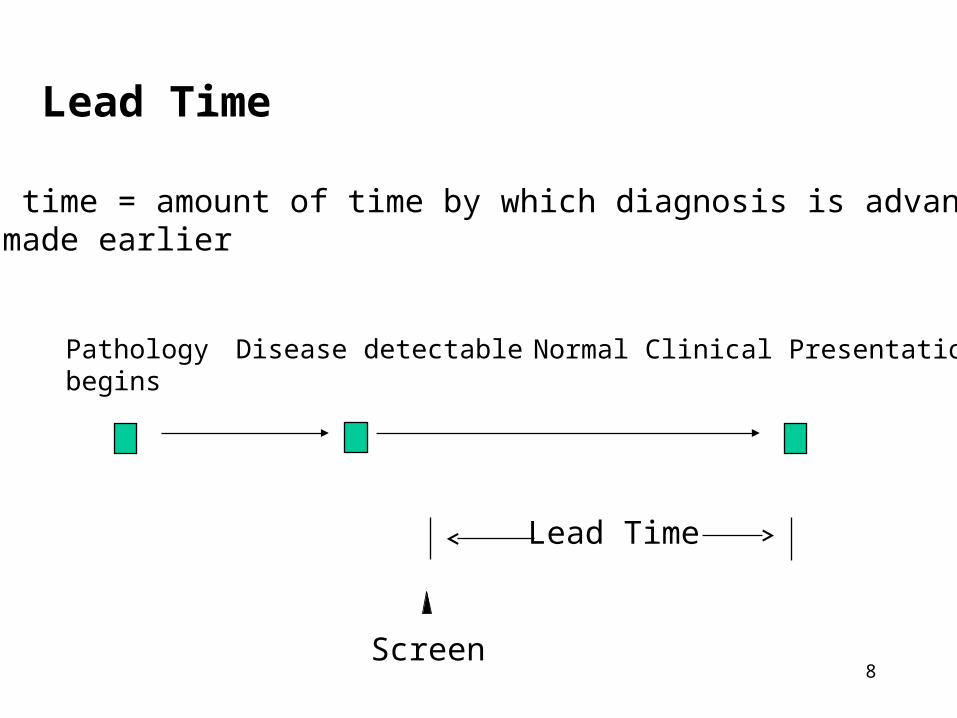
Lead Time
Lead time = amount of time by which diagnosis is advanced or made earlier
Pathology begins
Disease detectable Normal Clinical Presentation
Lead Time
Screen
9
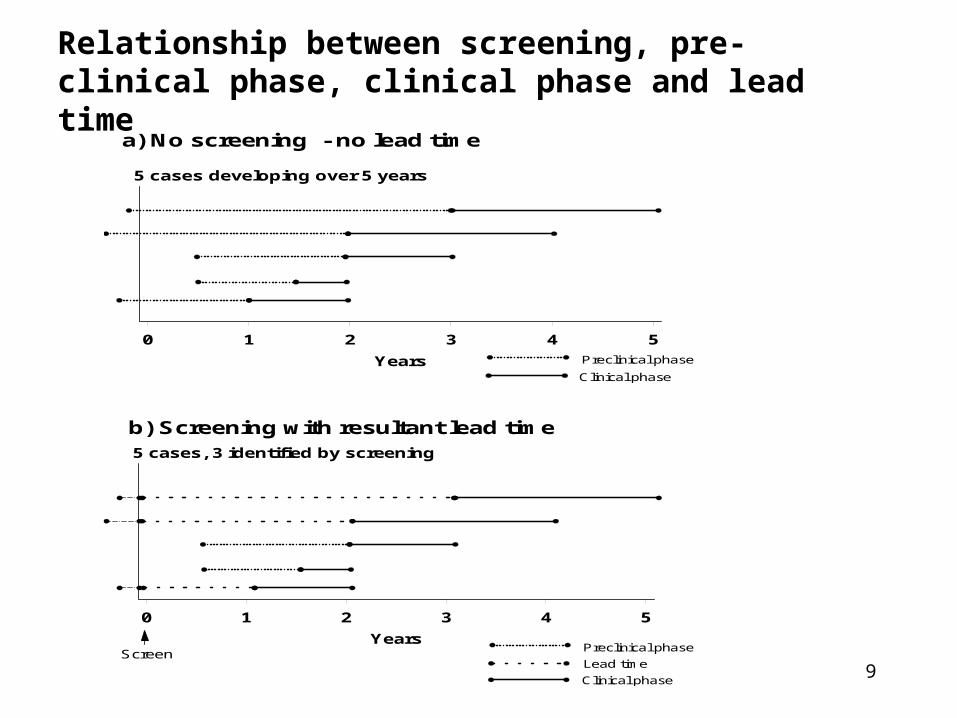
a) No screening - no lead time
Clinical phase
Preclinical phase
5 cases developing over 5 years
0 1 2 3 4 5
Years
Relationship between screening, pre-clinical phase, clinical phase and lead time
b) Screening with resultant lead time
Lead time
Preclinical phase
Clinical phase
Screen
5 cases, 3 identified by screening
0 1 2 3 4 5
Years
10
Lead Time
• Equals the amount of time by which treatment is advanced or made “early”
• Not a theory or statistical artifact but what is expected and must occur with early detection
• Does not imply improved outcome
• Necessary but not sufficient condition for effective screening.

11
Lead Time
• Impossible to determine lead time for any individual, can only compare distribution between screened and non-screened populations (RCT)
• Knowledge of expected lead time useful to:• Indicates amount of time diagnosis and treatment must be
advanced• Determine frequency of screening
• Example lead times:• Mam screening women 40-49 = 1-2 years• Mam screening women 50-69 = 3-4 years• Invasive Colo-rect cancer = 7-10 years

12
Example of Estimation of Lead Time Distributions
within an Screening RCT
0123456789
10
0 1 2 3 4 5
Screened Group
Non-screened Group
Cu
mu
lati
ve N
um
ber
of
Cas
es
Years after Screening
Total lead time = 5 + 4 + 5 + 2.5 + 2 = 18.5 years Average lead time = 18.5/ 9 = 2.05 years
13
IV. Characteristics of screening tests
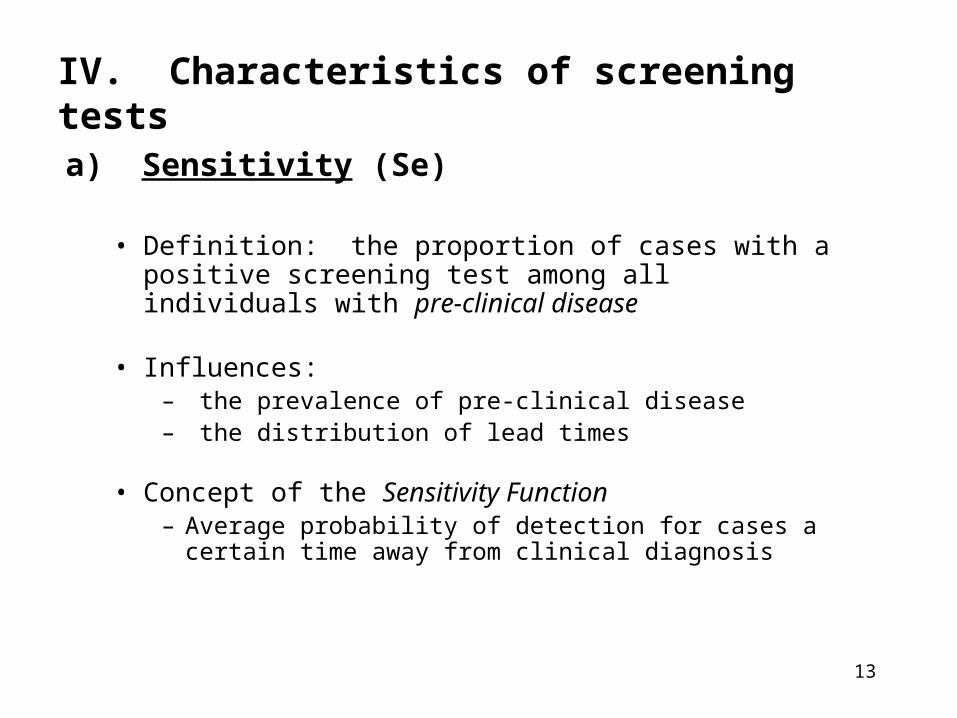
a) Sensitivity (Se)
• Definition: the proportion of cases with a positive screening test among all individuals with pre-clinical disease
• Influences:– the prevalence of pre-clinical disease – the distribution of lead times
• Concept of the Sensitivity Function– Average probability of detection for cases a certain time away
from clinical diagnosis
14
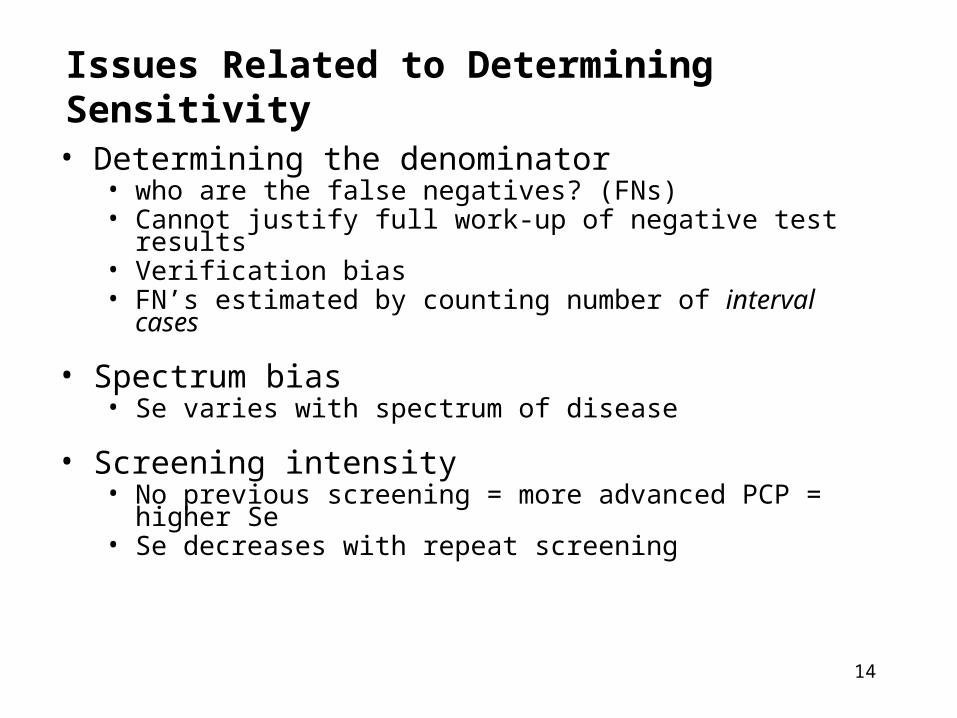
Issues Related to Determining Sensitivity
• Determining the denominator• who are the false negatives? (FNs)• Cannot justify full work-up of negative test results• Verification bias• FN’s estimated by counting number of interval cases
• Spectrum bias • Se varies with spectrum of disease
• Screening intensity• No previous screening = more advanced PCP = higher Se• Se decreases with repeat screening
15
IV. Characteristics of screening tests
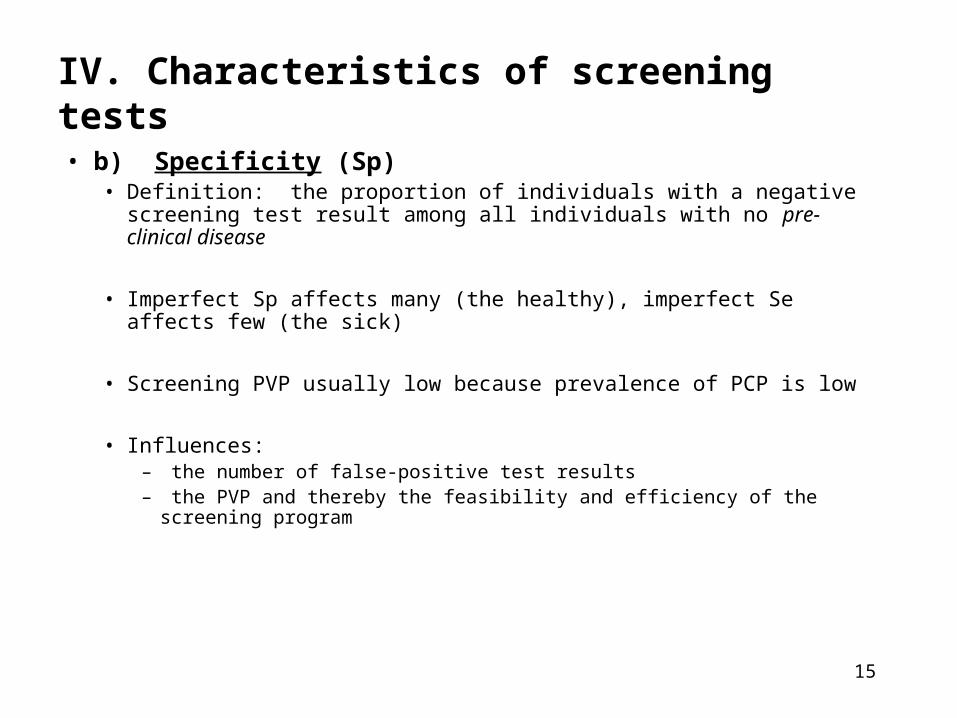
• b) Specificity (Sp)• Definition: the proportion of individuals with a negative screening
test result among all individuals with no pre-clinical disease
• Imperfect Sp affects many (the healthy), imperfect Se affects few (the sick)
• Screening PVP usually low because prevalence of PCP is low
• Influences:– the number of false-positive test results – the PVP and thereby the feasibility and efficiency of the screening
program

16
IV. Characteristics of screening tests
c) Yield• Definition: the amount of previously unrecognized
disease that is diagnosed and treated as a result of screening.
• Another measure of screening efficiency .
• Influenced by:– Se – Prevalence of PCP
17
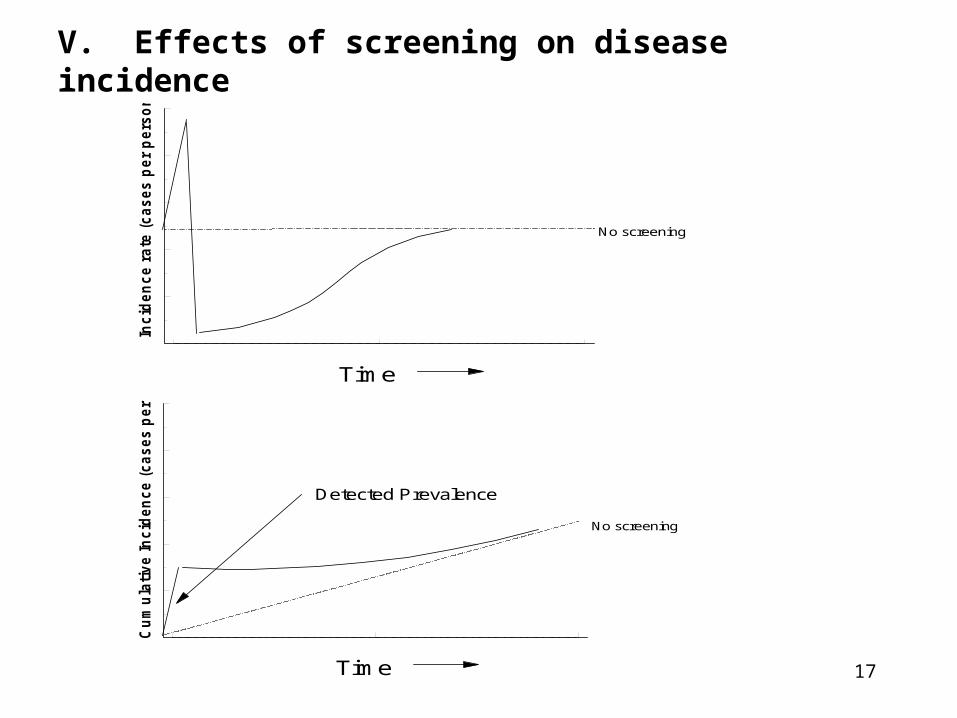
V. Effects of screening on disease incidence
Inc
ide
nc
e r
ate
(c
as
es
pe
r p
ers
on
-ye
ar)
Time
No screening
Time
No screening
Cu
mu
lati
ve In
cid
en
ce (
ca
ses p
er
pers
on
)
Detected Prevalence
18
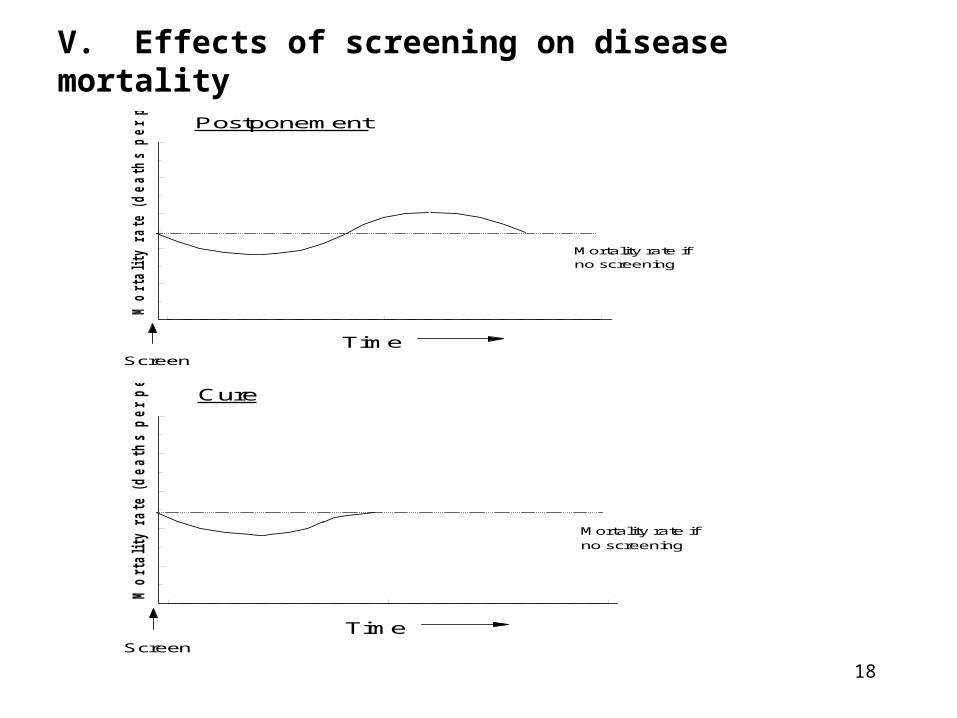
V. Effects of screening on disease mortality
Mo
rta
lity
ra
te
(d
ea
th
s p
er p
ers
on
-y
ea
r)
TimeScreen
Postponement
Mortality rate if no screening
Mo
rtality r
ate (
dea
th
s p
er p
erso
n-y
ear)
TimeScreen
Cure
Mortality rate if no screening
19
VI. Evaluation of Screening Outcomes
a) Study Designs• RCT
• Compare disease-specific cumulative mortality rate between those randomized (or not) to screening
• Eliminates confounding and lead time bias• But, problems of:
– Expense, time consuming, logistically difficult, ethical concerns, changing technology.
20
VI. Evaluation of Screening Outcomes
a) Study Designs• Observational Studies
• Cohort:– Compare disease-specific cumulative mortality rate
between those who choose (or not) to be screened
• Case-control:– Compare screening history between those with
advanced disease (or death) and healthy.
• Ecological:– Compare screening patterns and disease experience
(both incidence and mortality) between populations
21
Problems with Observational Studies
• Confounding due to health awareness - screenees are more healthy (selection bias)
• More susceptible to effects of lead-time bias and length-biased sampling
• Poor quality, often retrospective data
• CCS: Difficult to determine appropriate control group
• Difficult to distinguish screening from diagnostic examinations
22
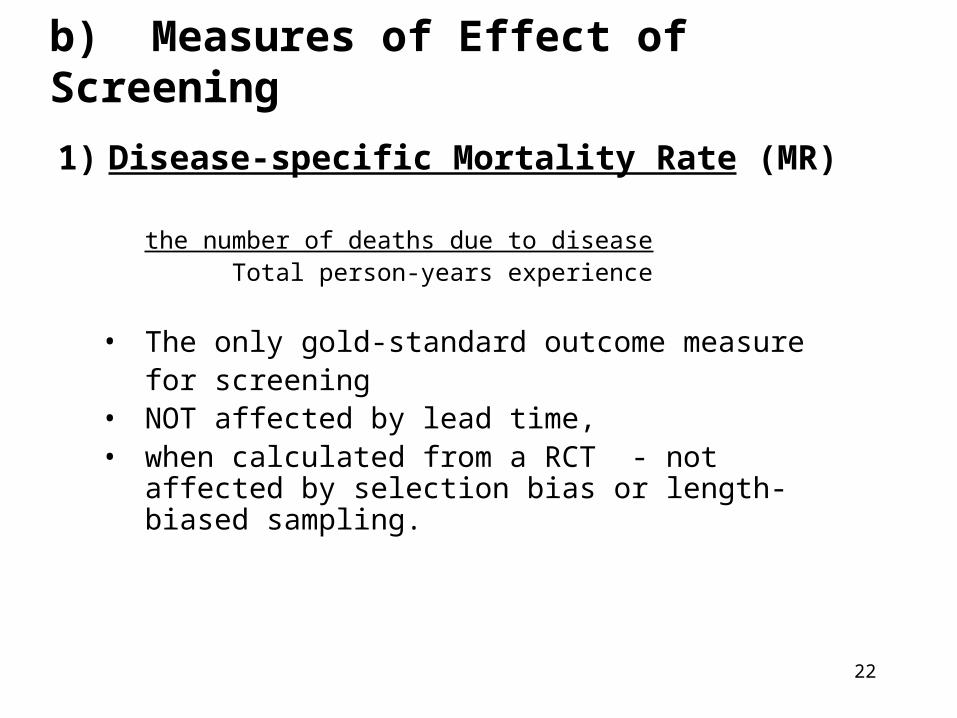
b) Measures of Effect of Screening
1) Disease-specific Mortality Rate (MR)
the number of deaths due to disease Total person-years experience
• The only gold-standard outcome measure for screening
• NOT affected by lead time, • when calculated from a RCT - not affected by
selection bias or length-biased sampling.
23
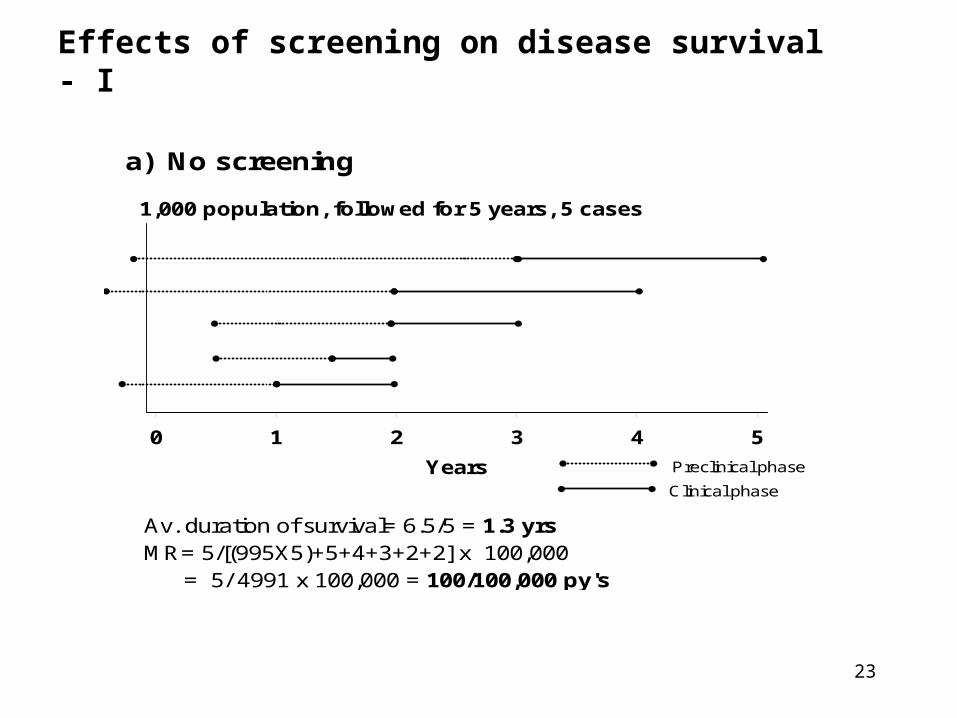
Effects of screening on disease survival - I
a) No screening
1,000 population, followed for 5 years, 5 cases
0 1 2 3 4 5
Years
Av. duration of survival= 6.5/5 = 1.3 yrsMR= 5/[(995X5)+5+4+3+2+2] x 100,000 = 5/ 4991 x 100,000 = 100/100,000 py's
Clinical phase
Preclinical phase
24
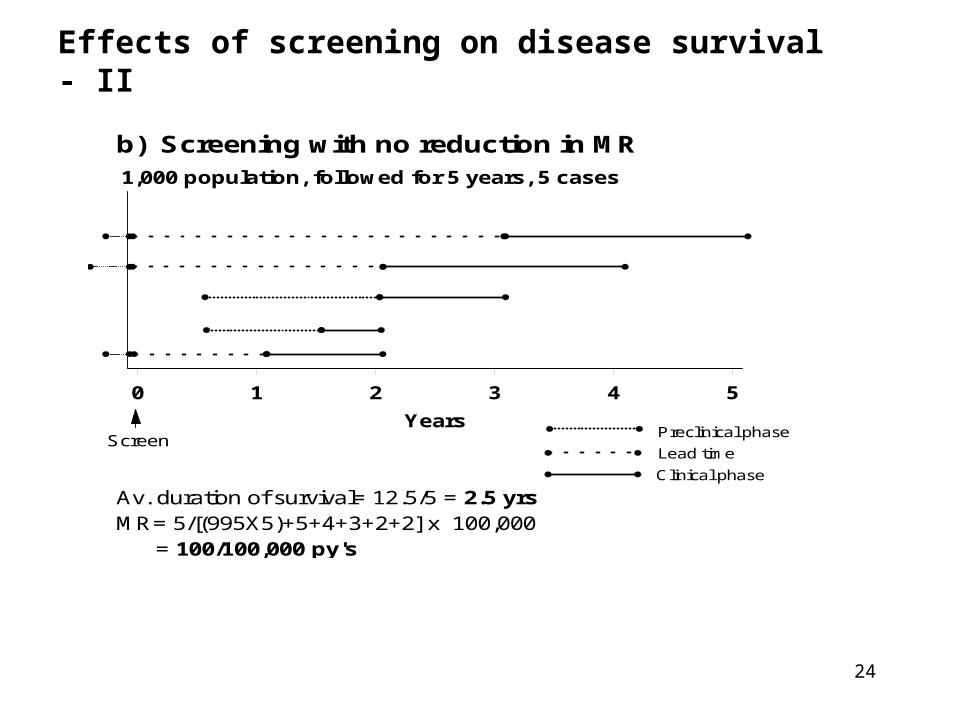
Effects of screening on disease survival - II
b) Screening with no reduction in MR1,000 population, followed for 5 years, 5 cases
0 1 2 3 4 5
Years
Av. duration of survival= 12.5/5 = 2.5 yrsMR= 5/[(995X5)+5+4+3+2+2] x 100,000 = 100/100,000 py's
Lead time
Preclinical phase
Clinical phase
Screen
25
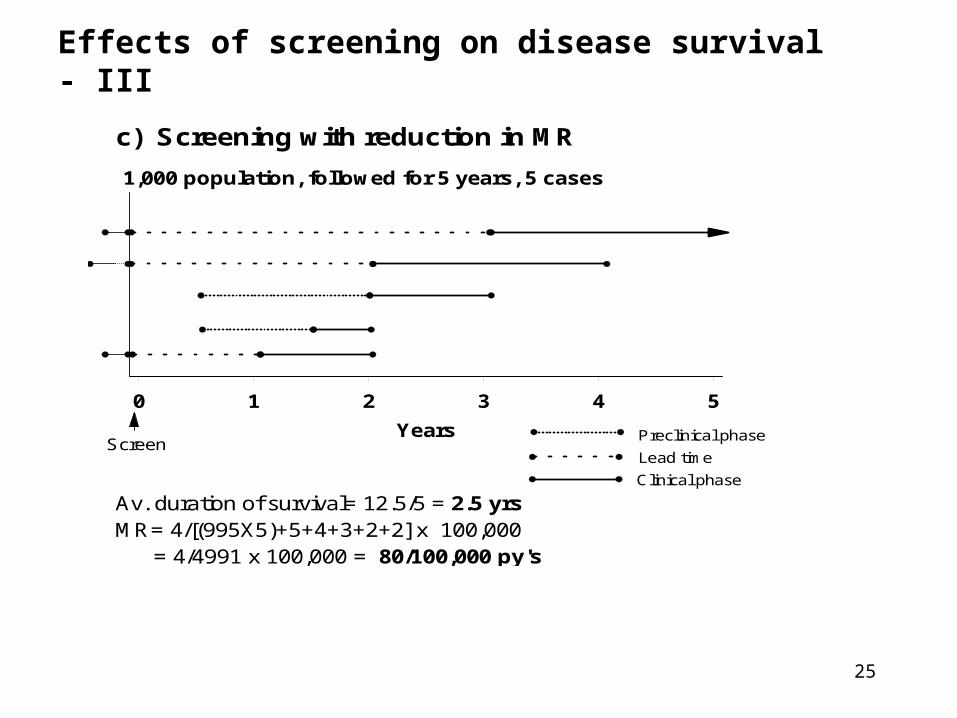
Effects of screening on disease survival - III
c) Screening with reduction in MR
1,000 population, followed for 5 years, 5 cases
0 1 2 3 4 5
Years
Av. duration of survival= 12.5/5 = 2.5 yrsMR= 4/[(995X5)+5+4+3+2+2] x 100,000 = 4/4991 x 100,000 = 80/100,000 py's
Lead time
Preclinical phase
Clinical phase
Screen
26
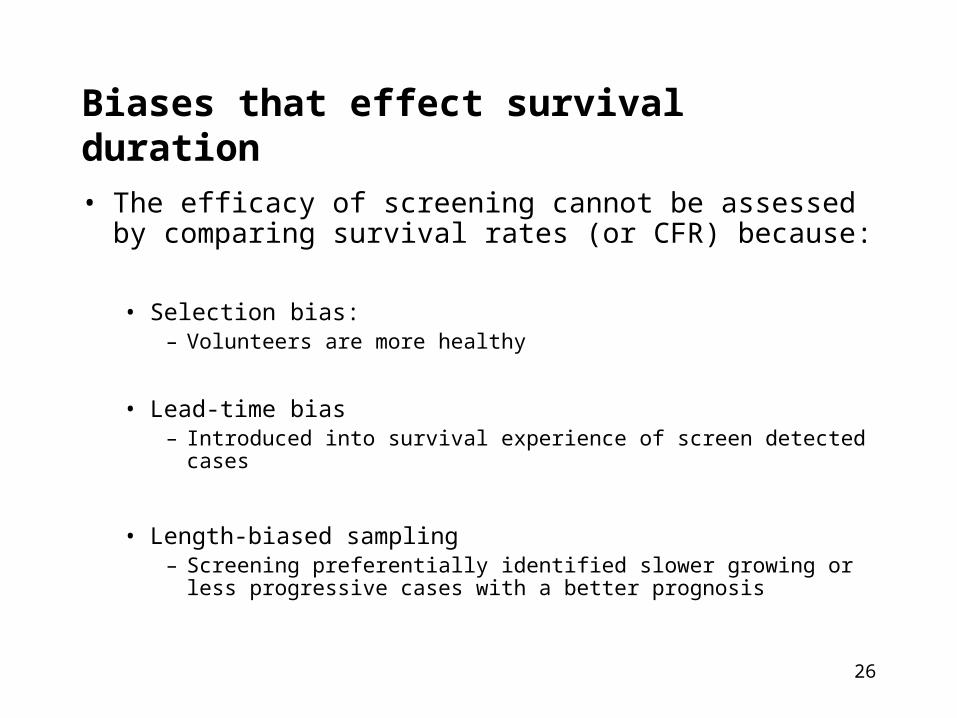
Biases that effect survival duration
• The efficacy of screening cannot be assessed by comparing survival rates (or CFR) because:
• Selection bias:– Volunteers are more healthy
• Lead-time bias– Introduced into survival experience of screen detected cases
• Length-biased sampling– Screening preferentially identified slower growing or less
progressive cases with a better prognosis
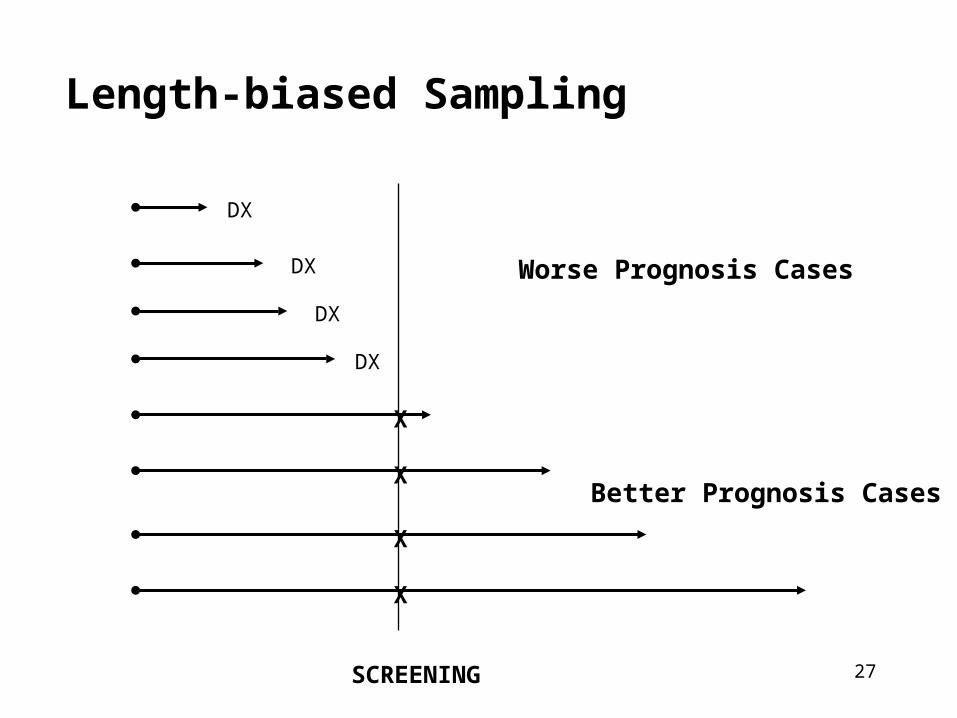
27
Length-biased Sampling
SCREENING
DX
DX
DX
DX
X
X
X
X
Better Prognosis Cases
Worse Prognosis Cases
28
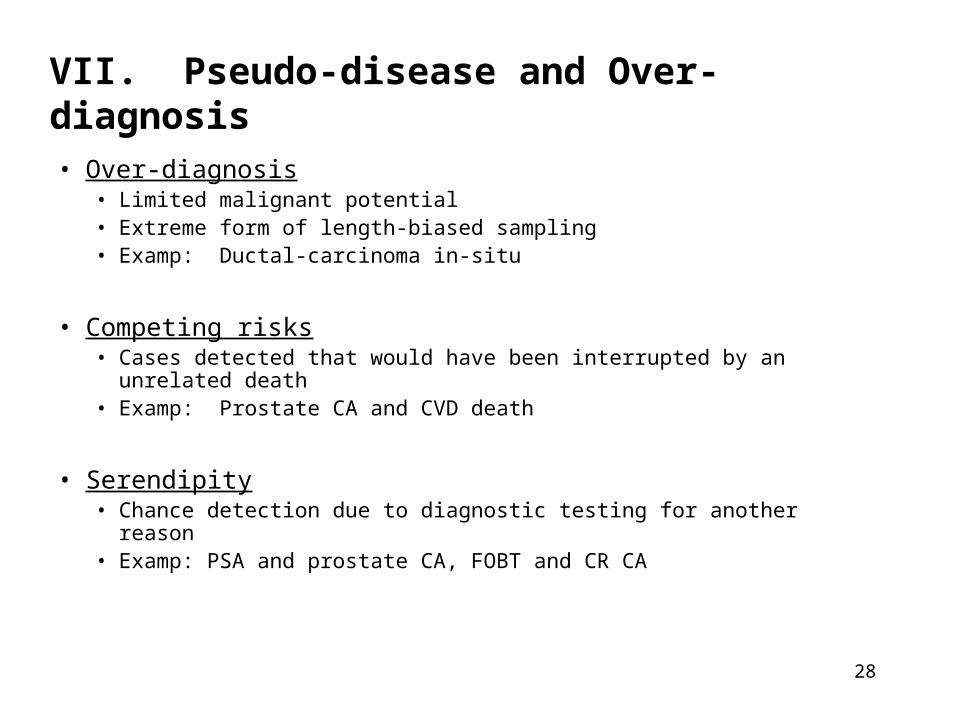
VII. Pseudo-disease and Over-diagnosis
• Over-diagnosis• Limited malignant potential• Extreme form of length-biased sampling• Examp: Ductal-carcinoma in-situ
• Competing risks• Cases detected that would have been interrupted by an unrelated
death• Examp: Prostate CA and CVD death
• Serendipity• Chance detection due to diagnostic testing for another reason • Examp: PSA and prostate CA, FOBT and CR CA
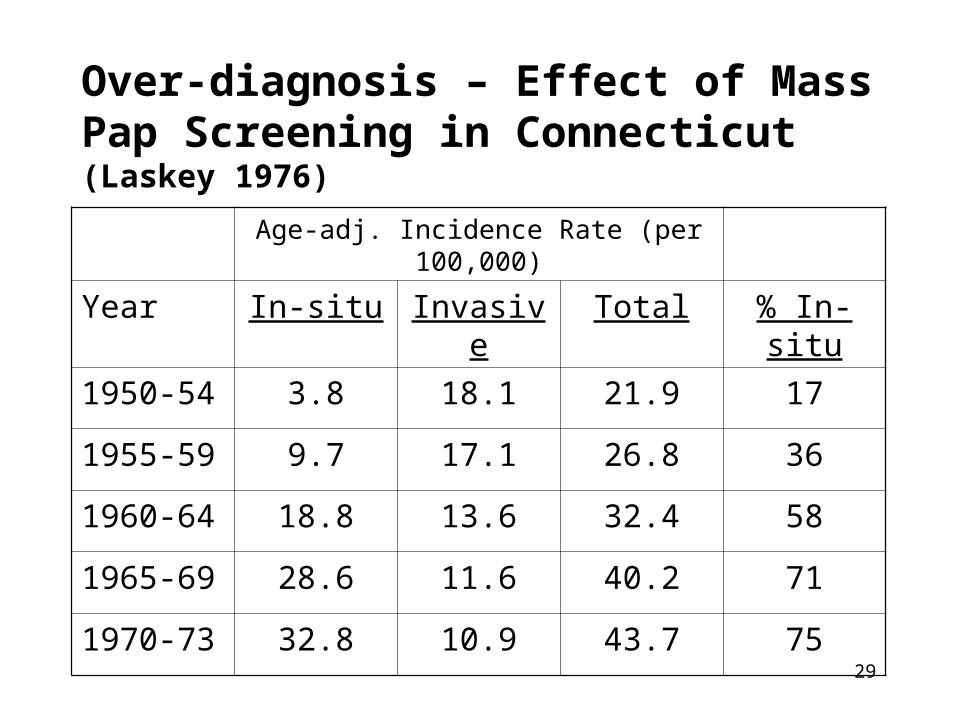
29
Over-diagnosis – Effect of Mass Pap Screening in Connecticut (Laskey 1976)
Age-adj. Incidence Rate (per 100,000)
Year In-situ Invasive Total % In-situ
1950-54 3.8 18.1 21.9 17
1955-59 9.7 17.1 26.8 36
1960-64 18.8 13.6 32.4 58
1965-69 28.6 11.6 40.2 71
1970-73 32.8 10.9 43.7 75
30
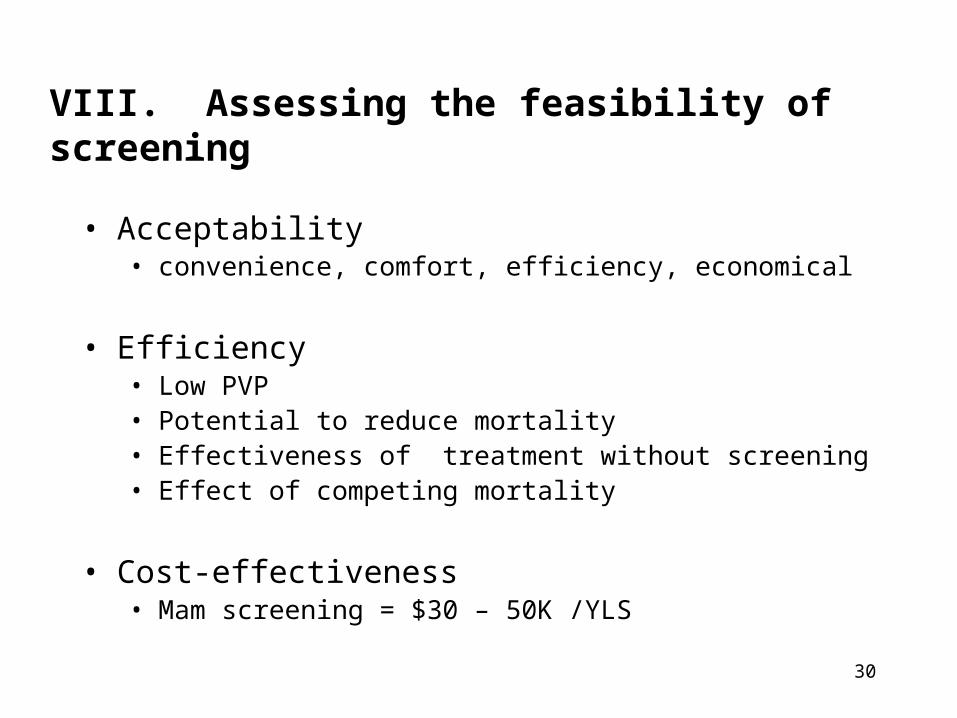
VIII. Assessing the feasibility of screening
• Acceptability • convenience, comfort, efficiency, economical
• Efficiency• Low PVP• Potential to reduce mortality• Effectiveness of treatment without screening• Effect of competing mortality
• Cost-effectiveness• Mam screening = $30 – 50K /YLS
31
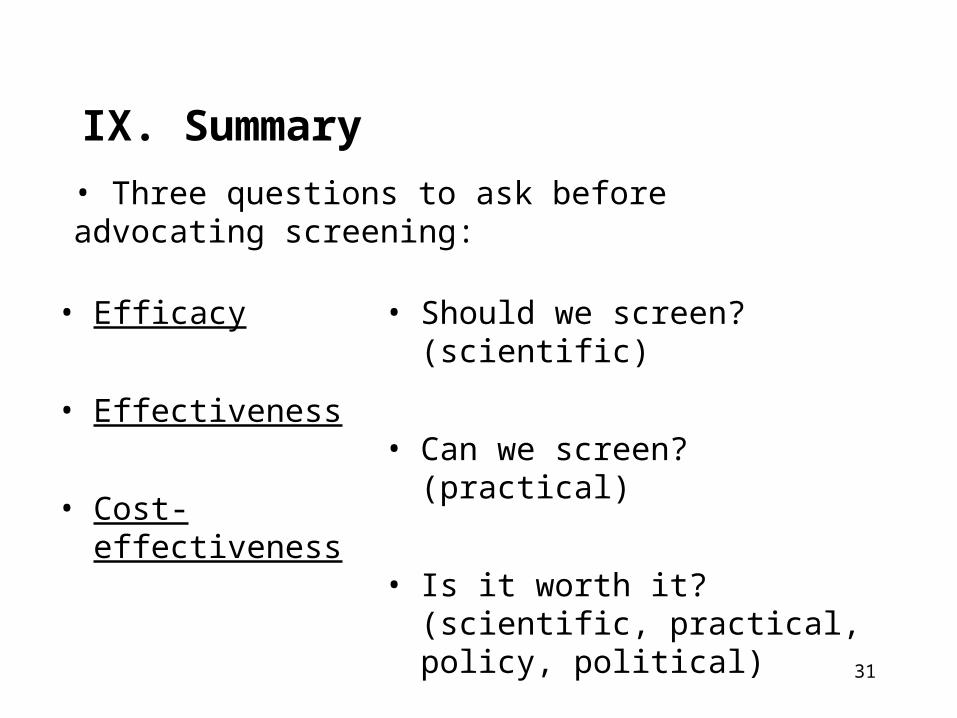
IX. Summary
• Efficacy
• Effectiveness
• Cost-effectiveness
• Should we screen? (scientific)
• Can we screen? (practical)
• Is it worth it? (scientific, practical, policy, political)
• Three questions to ask before advocating screening:
32
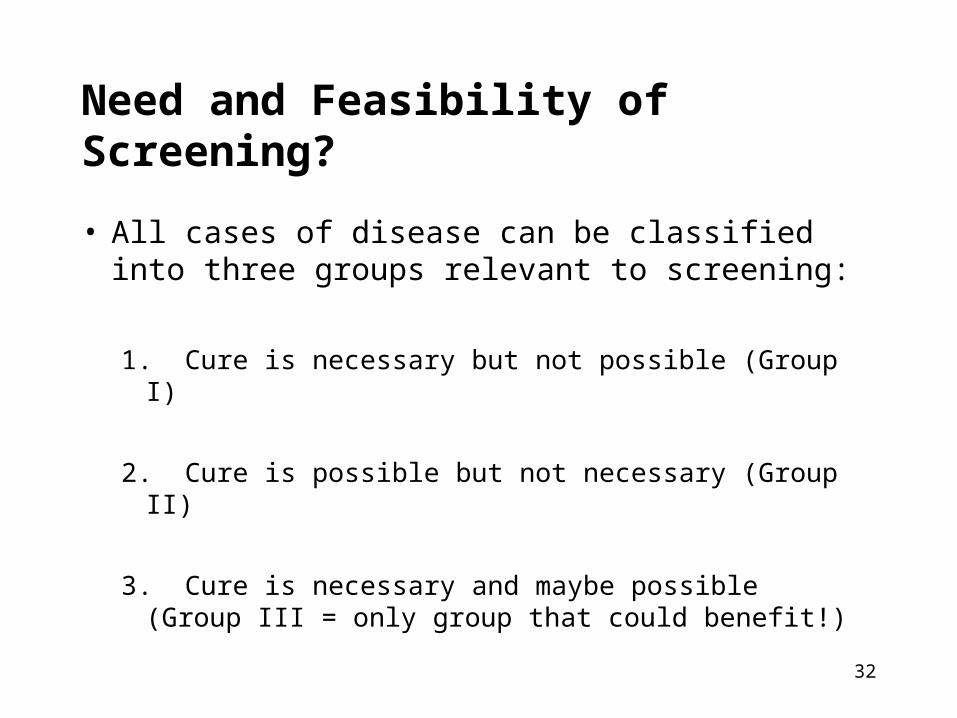
Need and Feasibility of Screening?
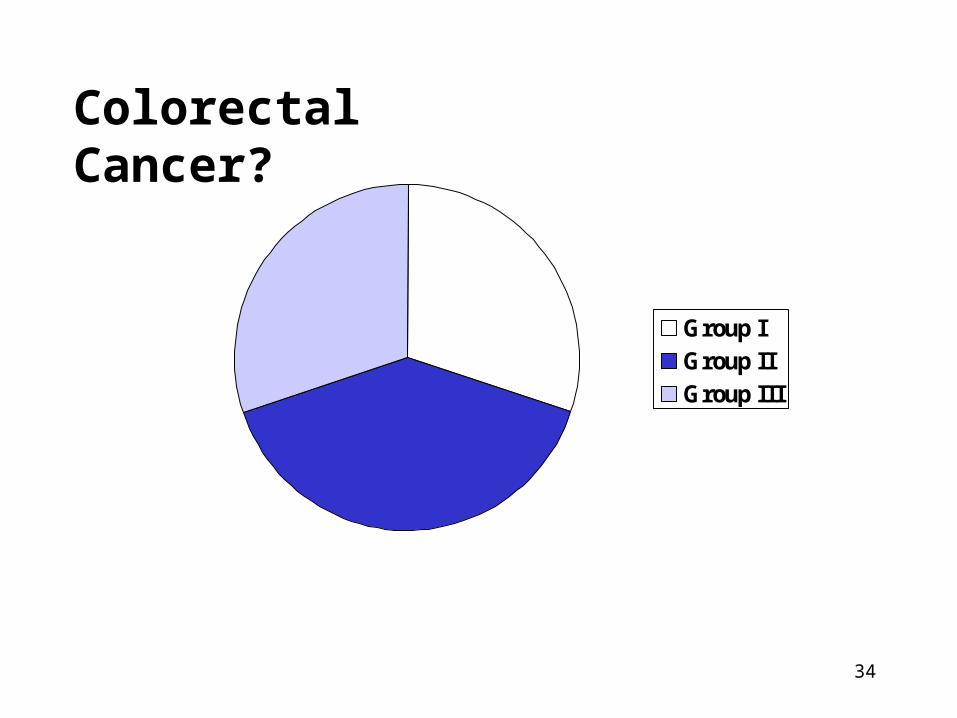
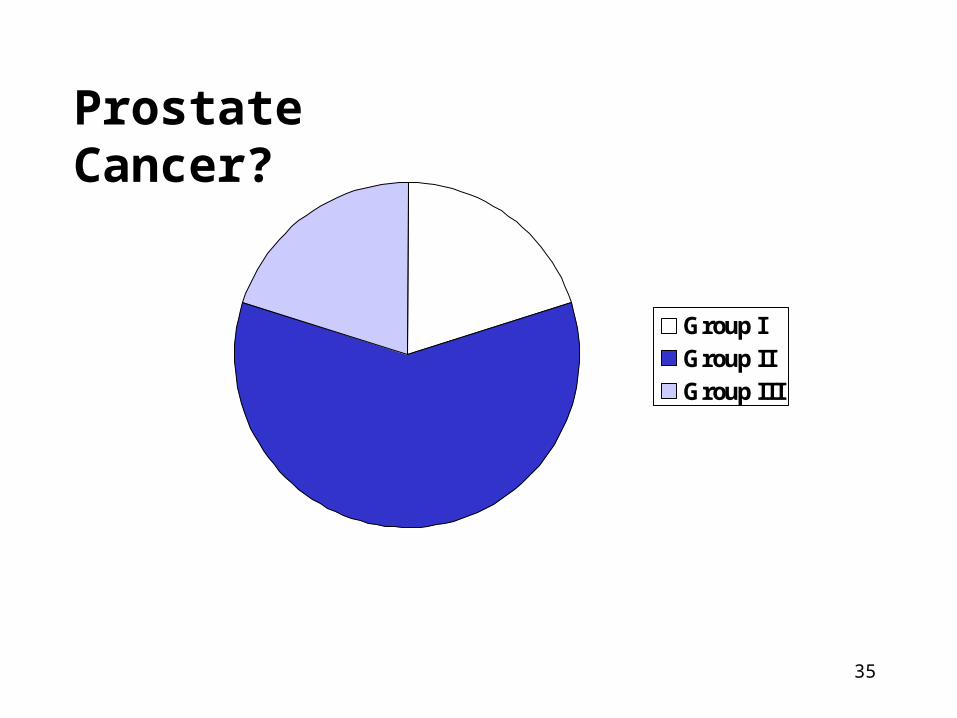
• All cases of disease can be classified into three groups relevant to screening:
1. Cure is necessary but not possible (Group I)
2. Cure is possible but not necessary (Group II)
3. Cure is necessary and maybe possible (Group III = only group that could benefit!)
33
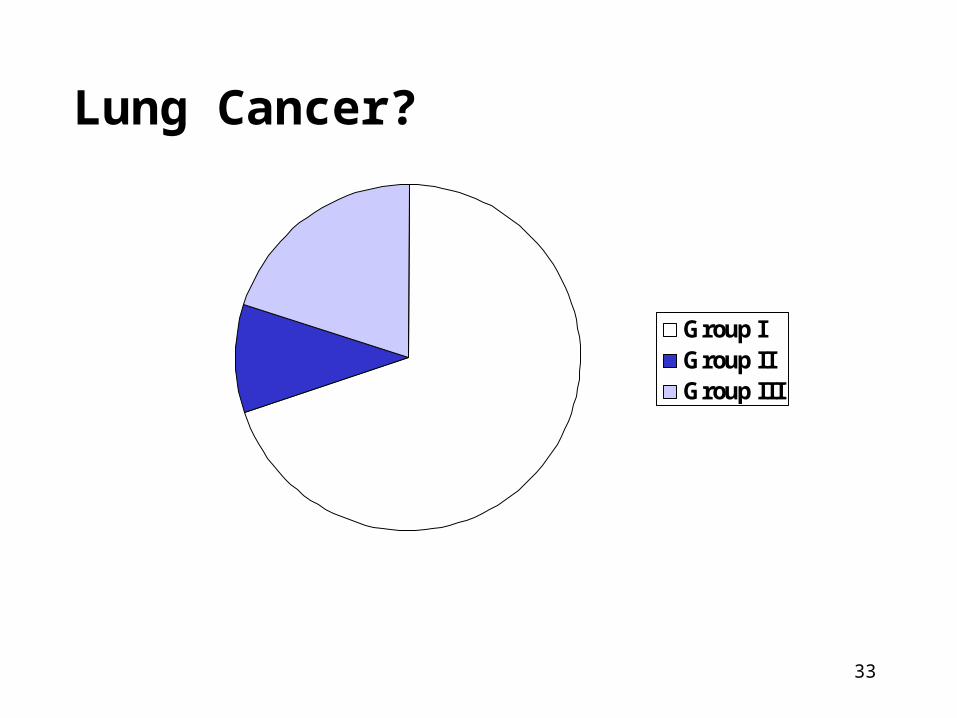
Group IGroup IIGroup III
Lung Cancer?
34
Group IGroup IIGroup III
Colorectal Cancer?
35
Group IGroup IIGroup III
Prostate Cancer?