Embed Size (px)
Citation preview
1
FERMENTATIONPROCESS
Iman Rusmana
Department of BiologyFMIPA IPB
2
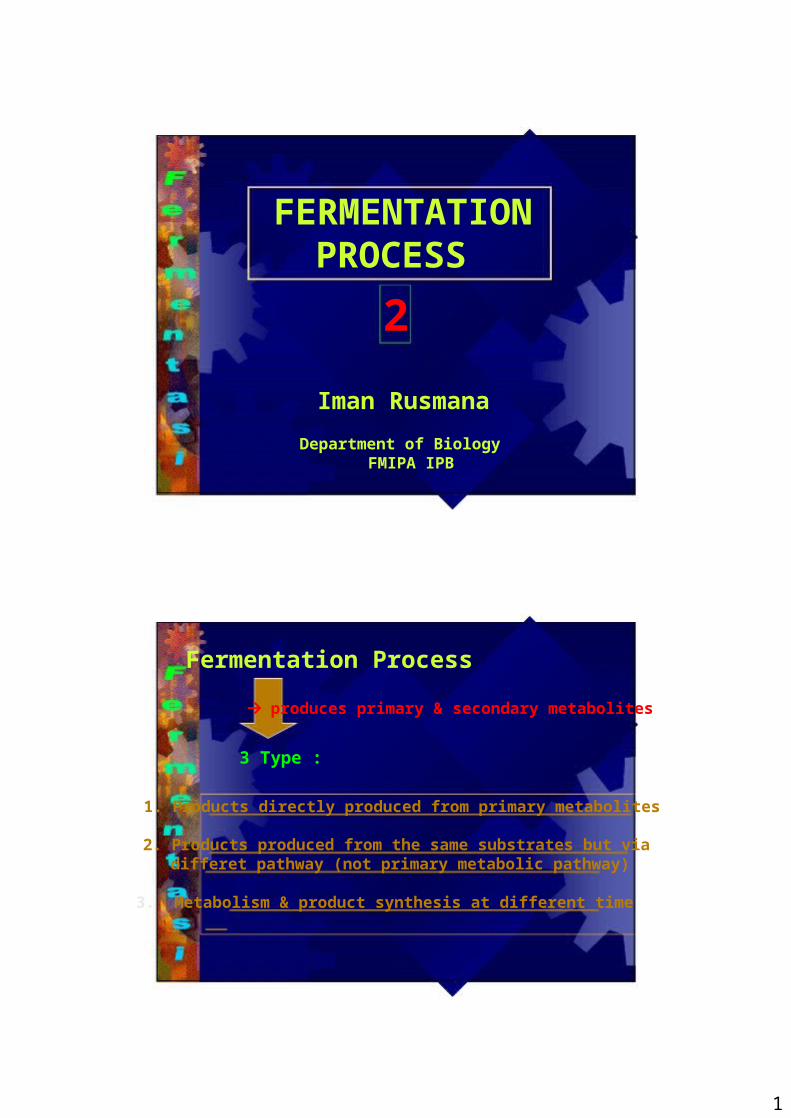
Fermentation Process
produces primary & secondary metabolites
3 Type :
1. Products directly produced from primary metabolites
2. Products produced from the same substrates but viadifferet pathway (not primary metabolic pathway)
3. Metabolism & product synthesis at different time
Total ProductivityProduct Sinthesis
Filling
Prediction optimalization of production process
2
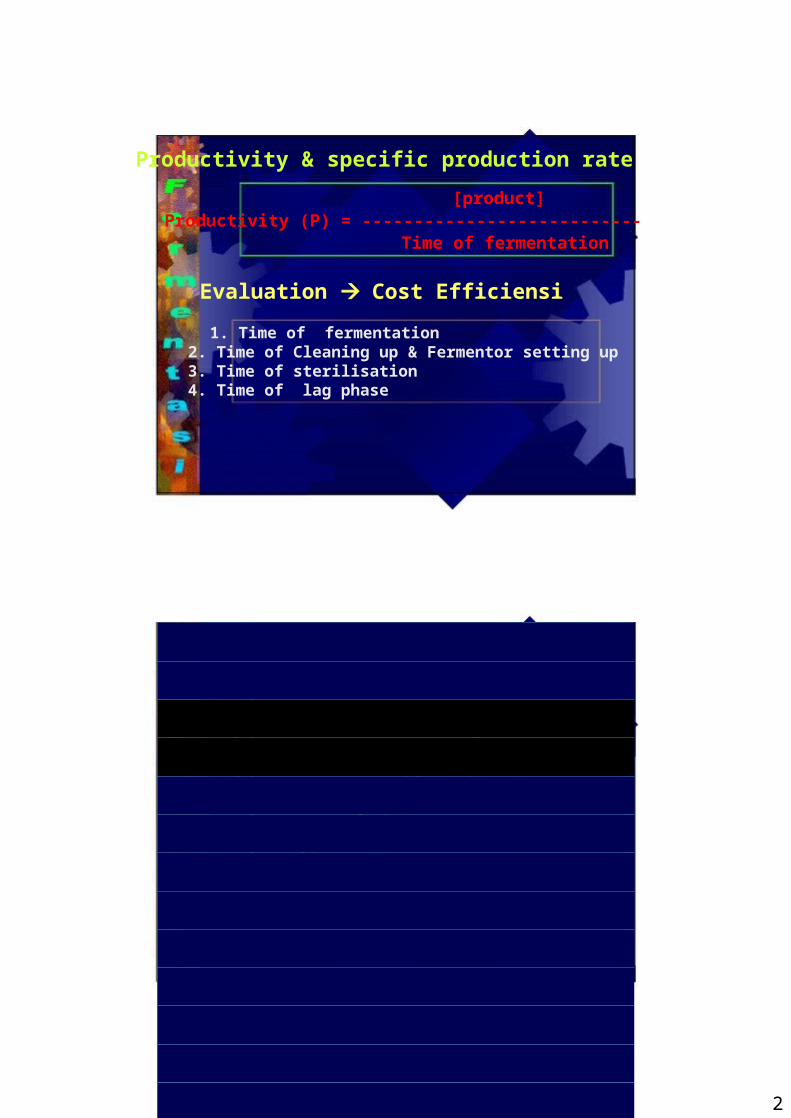
Productivity & specific production rate
[product]Productivity (P) = ---------------------------
Time of fermentation
1. Time of fermentation2. Time of Cleaning up & Fermentor setting up3. Time of sterilisation4. Time of lag phase
Evaluation Cost Efficiensi
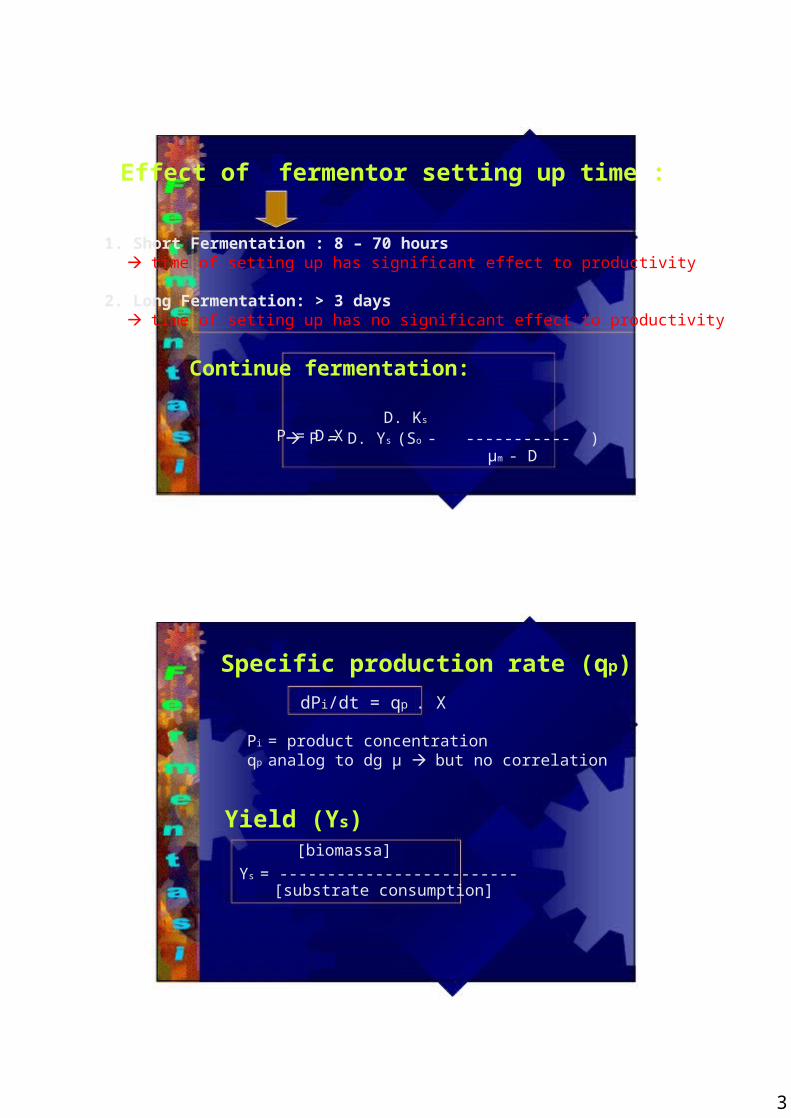
Effect of fermentor setting up time :
1. Short Fermentation : 8 – 70 hourstime of setting up has significant effect to productivity
2. Long Fermentation: > 3 daystime of setting up has no significant effect to productivity
Continue fermentation:
D. Ks
P = D.X P = D. Ys (So - ----------- )µm - D
Specific production rate (qp)
dPi/dt = qp . X
Pi = product concentrationqp analog to dg µ but no correlation
Yield (Ys)[biomassa]
Ys = -------------------------[substrate consumption]
3
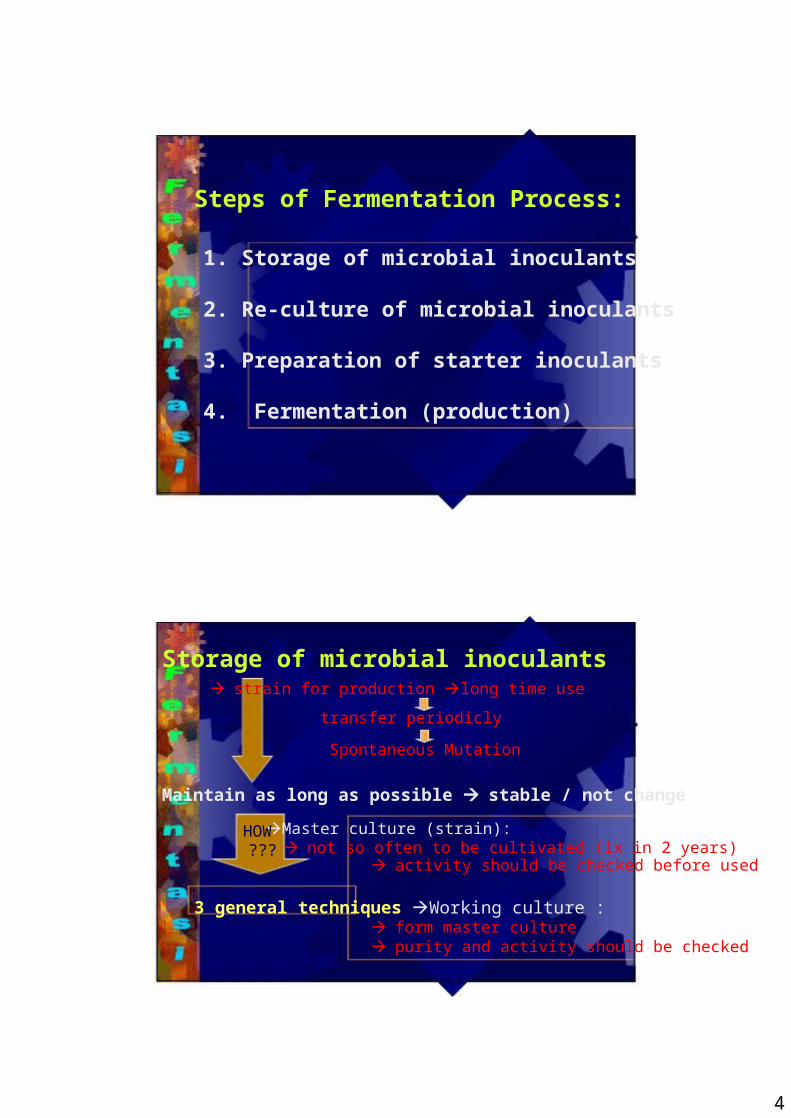
Steps of Fermentation Process:
1. Storage of microbial inoculants
2. Re-culture of microbial inoculants
3. Preparation of starter inoculants
4. Fermentation (production)
Storage of microbial inoculantsstrain for production long time use
transfer periodicly
Spontaneous Mutation
Maintain as long as possible stable / not change
Master culture (strain):not so often to be cultivated (1x in 2 years)
HOW???
activity should be checked before used
3 general techniques Working culture :form master culturepurity and activity should be checked
4
5
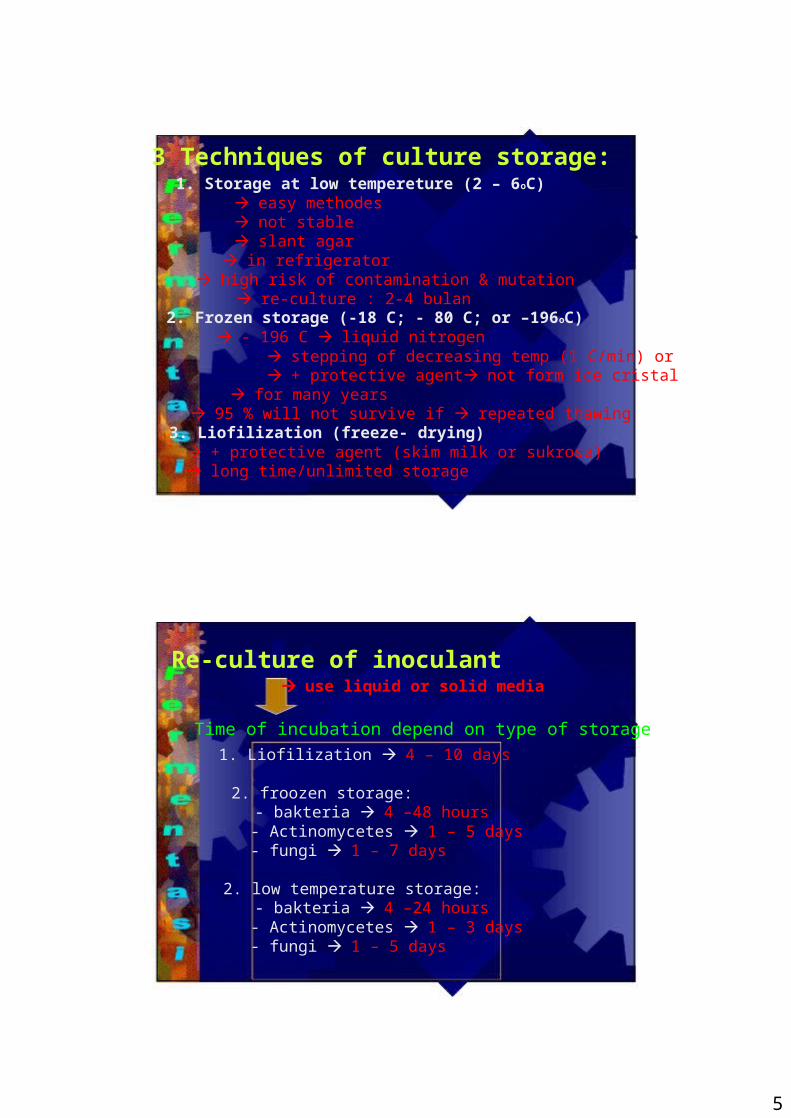
3 Techniques of culture storage:1. Storage at low tempereture (2 – 6oC)
easy methodesnot stableslant agarin refrigeratorhigh risk of contamination & mutation
re-culture : 2-4 bulan2. Frozen storage (-18 C; - 80 C; or –196oC)
- 196 C liquid nitrogenstepping of decreasing temp (1 C/min) or+ protective agentnot form ice cristal
for many years95 % will not survive if repeated thawing
3. Liofilization (freeze- drying)+ protective agent (skim milk or sukrosa)long time/unlimited storage
Re-culture of inoculantuse liquid or solid media
Time of incubation depend on type of storage
1. Liofilization 4 – 10 days
2. froozen storage:- bakteria 4 –48 hours- Actinomycetes 1 – 5 days- fungi 1 – 7 days
2. low temperature storage:- bakteria 4 –24 hours- Actinomycetes 1 – 3 days- fungi 1 – 5 days
6
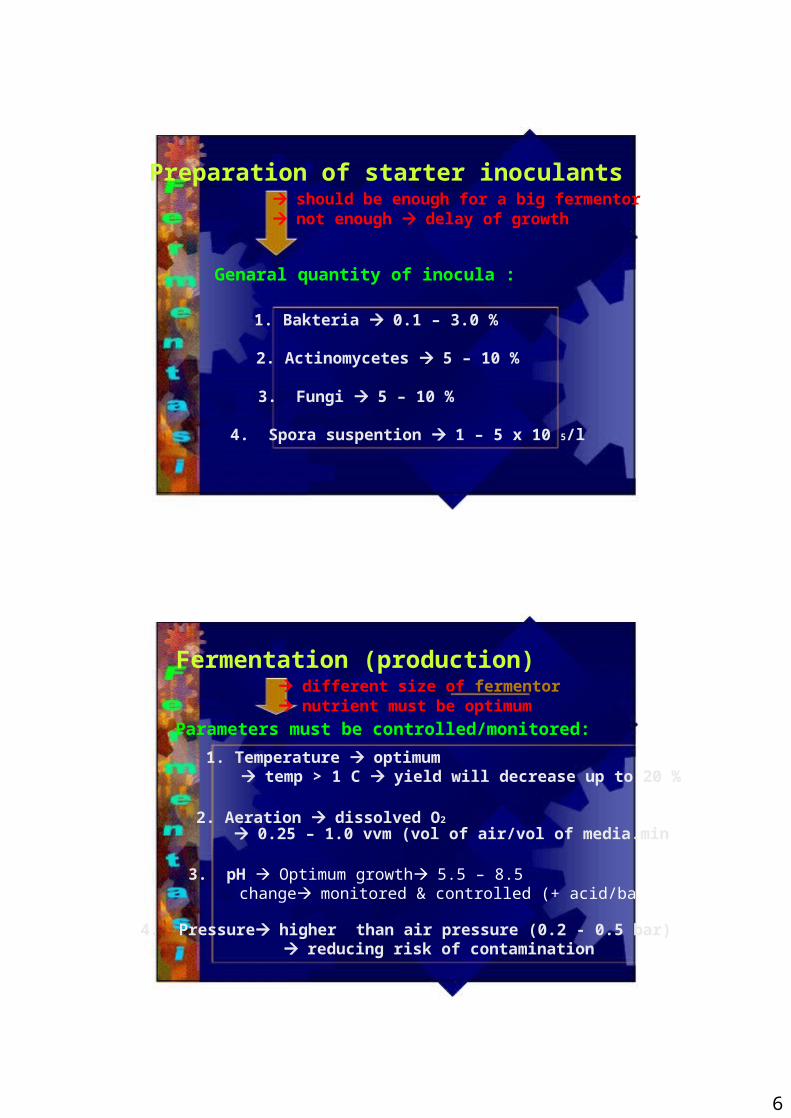
Preparation of starter inoculantsshould be enough for a big fermentornot enough delay of growth
Genaral quantity of inocula :
1. Bakteria 0.1 – 3.0 %
2. Actinomycetes 5 – 10 %
3. Fungi 5 – 10 %
4. Spora suspention 1 – 5 x 10 5/l
Fermentation (production)different size of fermentornutrient must be optimum
Parameters must be controlled/monitored:
1. Temperature optimumtemp > 1 C yield will decrease up to 20 %
2. Aeration dissolved O2
0.25 – 1.0 vvm (vol of air/vol of media.min
4. Pressurehigher than air pressure (0.2 - 0.5 bar)reducing risk of contamination
3. pH Optimum growth5.5 – 8.5changemonitored & controlled (+ acid/basa)
7
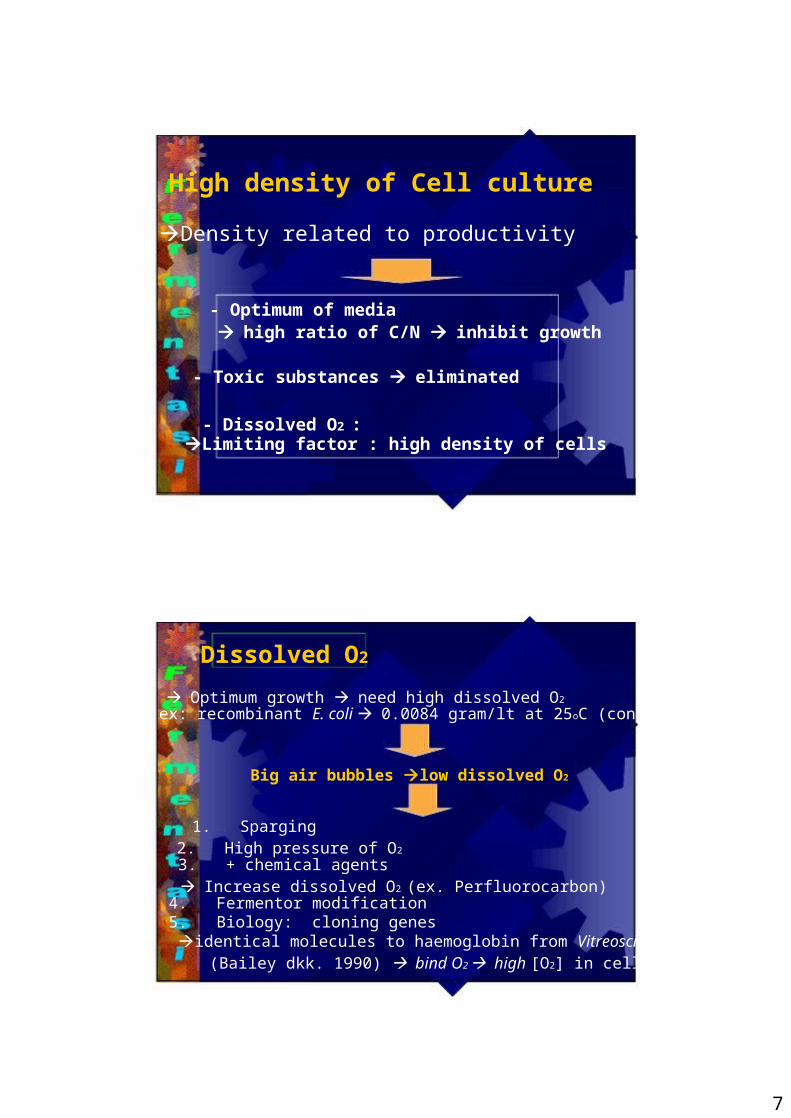
High density of Cell culture
Density related to productivity
- Optimum of mediahigh ratio of C/N inhibit growth
- Toxic substances eliminated
- Dissolved O2 :Limiting factor : high density of cells
Optimum growth need high dissolved O2
ex: recombinant E. coli 0.0084 gram/lt at 25oC (continue)
Big air bubbles low dissolved O2
1. Sparging2. High pressure of O2
3. + chemical agentsIncrease dissolved O2 (ex. Perfluorocarbon)
4. Fermentor modification5. Biology: cloning genes
identical molecules to haemoglobin from Vitreoscilla(Bailey dkk. 1990) bind O2 high [O2] in cells
Dissolved O2

3
Molecular biology agents
40 - 80 Enzyme, antibiotics
Back
8
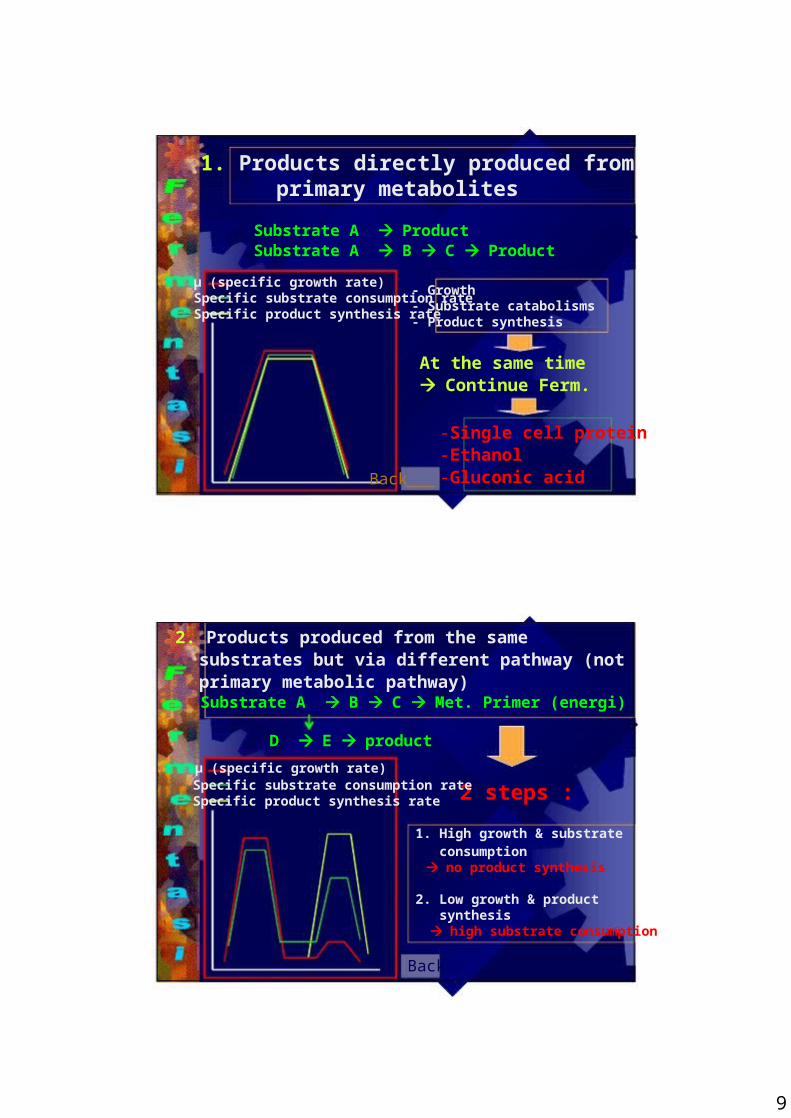
1. Products directly produced fromprimary metabolites
Substrate A ProductSubstrate A B C Product
- Growth- Substrate catabolisms- Product synthesis
At the same timeContinue Ferm.
-Single cell protein-Ethanol-Gluconic acid
µ (specific growth rate)Specific substrate consumption rateSpecific product synthesis rate
Back
2 steps :
1. High growth & substrateconsumption
no product synthesis
2. Low growth & productsynthesis
high substrate consumption
Back
9
2. Products produced from the samesubstrates but via different pathway (notprimary metabolic pathway)Substrate A B C Met. Primer (energi)
D E product
µ (specific growth rate)Specific substrate consumption rateSpecific product synthesis rate
10
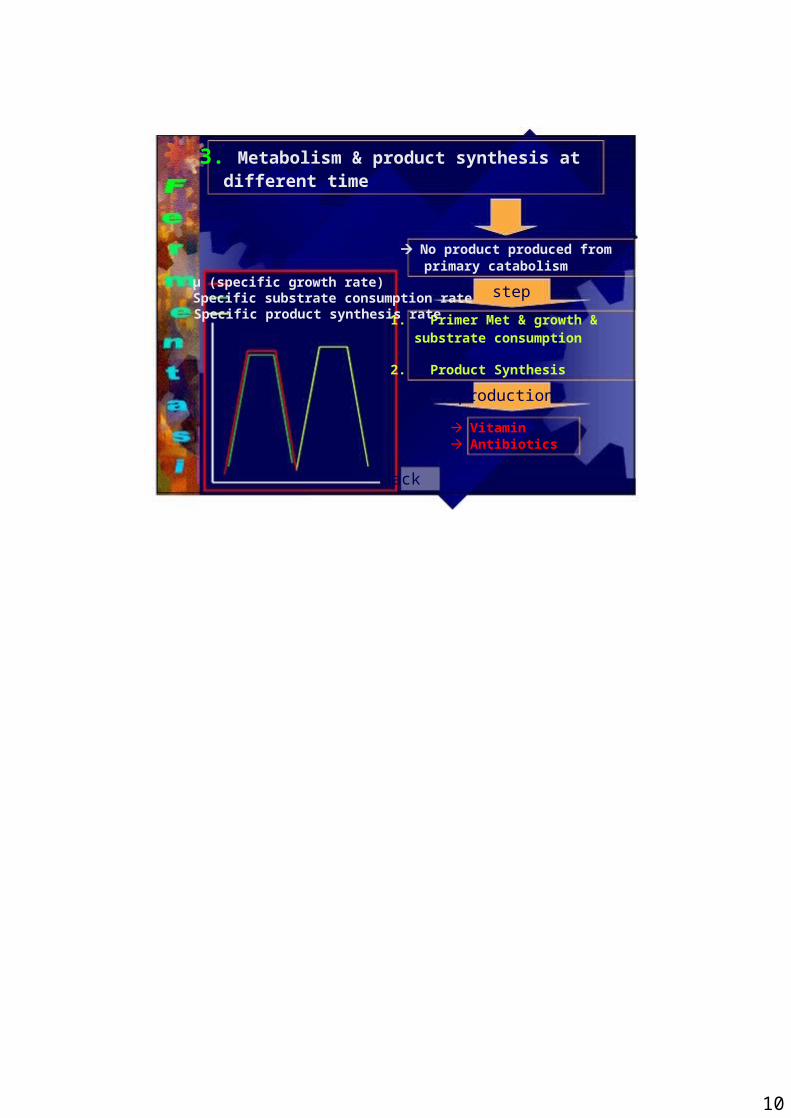
3. Metabolism & product synthesis atdifferent time
No product produced fromprimary catabolism
step
1. Primer Met & growth &substrate consumption
2. Product Synthesis
production
VitaminAntibiotics
Back
µ (specific growth rate)Specific substrate consumption rateSpecific product synthesis rate