Embed Size (px)
Citation preview
1
Global Renewable Energy Perspectives:A report from the Ninth World Renewable Energy Congress
Photo Sources: GE Energy, NREL
Climate Decision Making Center NSF SES-034578
Costa SamarasDept. of Engineering & Public PolicyCarnegie Mellon University
October 23, 2006
2
Agenda • Introduction and motivation
• Supply and demand challenges
• Renewables policy landscape
• Data resources• Research needs
3
Introduction and Motivation • World Renewable Energy Congress
– Held every two years in different locations
– Organized by the World Renewable Energy Network and UNESCO
– Publishers of Elsevier journal, Renewable Energy
– 2008 conference in Glasgow– http://www.wrenuk.co.uk/
Photo Sources: UNEP, Elsevier
4
Introduction and Motivation • 2006 World Renewable Energy Congress
– Held in Florence Italy, 19-25 August– More than 700 papers from 107 countries– Proceedings published by Elsevier; hard
copy and CD of papers available to those interested
– Paper I presented, Learning from wind: A framework for low-carbon energy diffusion
5
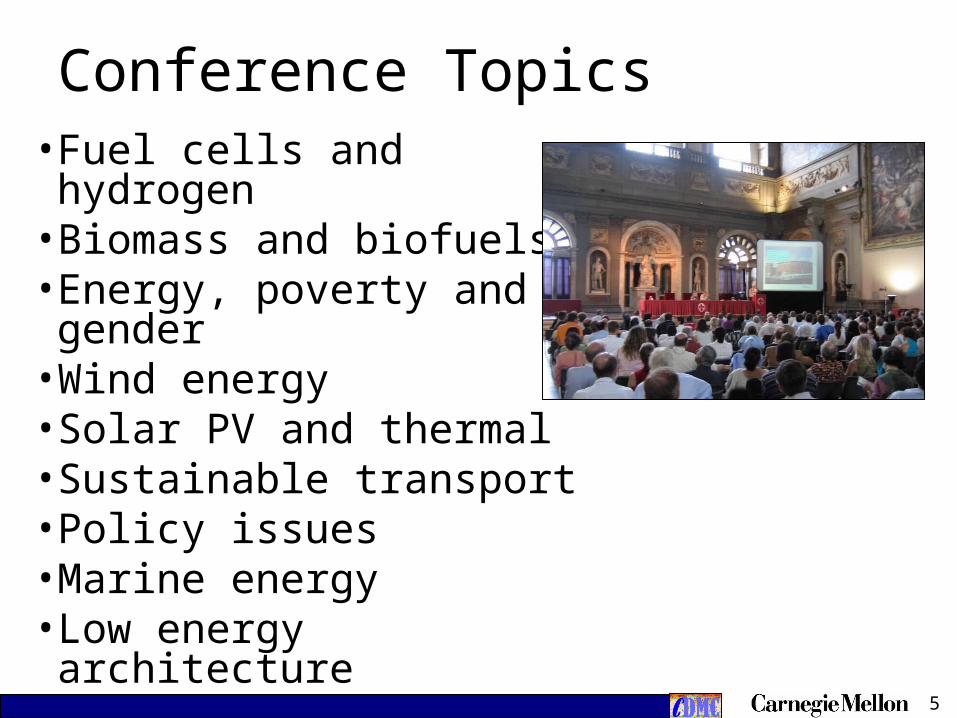
Conference Topics• Fuel cells and hydrogen• Biomass and biofuels• Energy, poverty and
gender• Wind energy• Solar PV and thermal• Sustainable transport• Policy issues• Marine energy• Low energy architecture
6
Major challenges - Demand
• 1.6-2 billion of world’s population currently do not have access to electricity
• Energy consumption to rise by factor of 2 or 3; long-lived fossil infrastructure
• 600 million people in China to migrate from rural to urban areas by 2050
– More than 70% of energy use is in cities
• 2.4 billion people using biomass for cooking and heating
7
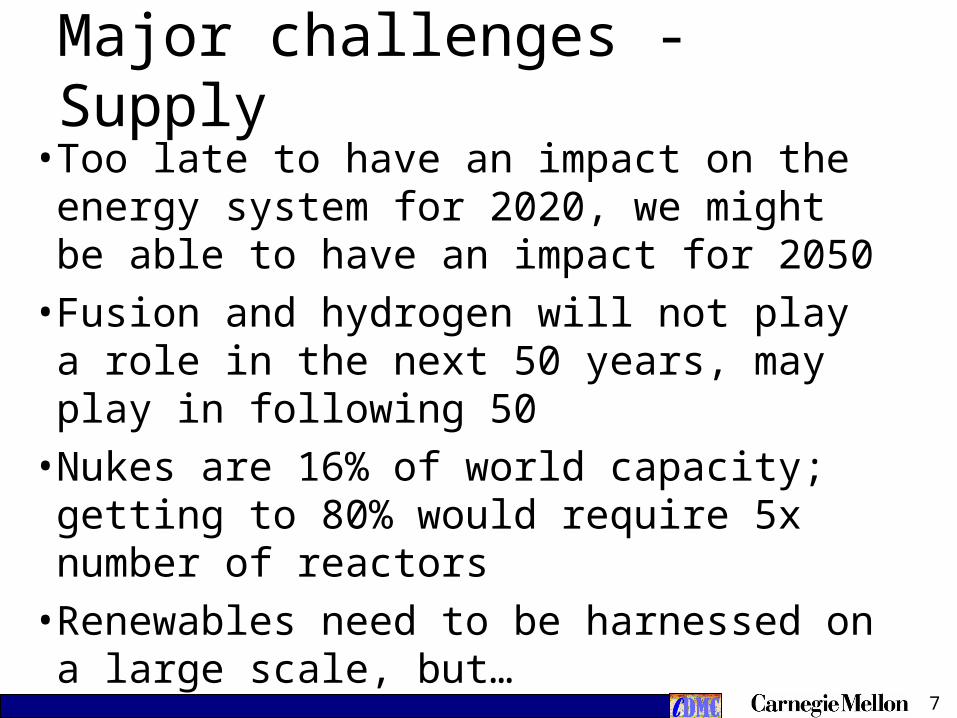
Major challenges - Supply
• Too late to have an impact on the energy system for 2020, we might be able to have an impact for 2050
• Fusion and hydrogen will not play a role in the next 50 years, may play in following 50
• Nukes are 16% of world capacity; getting to 80% would require 5x number of reactors
• Renewables need to be harnessed on a large scale, but…
8
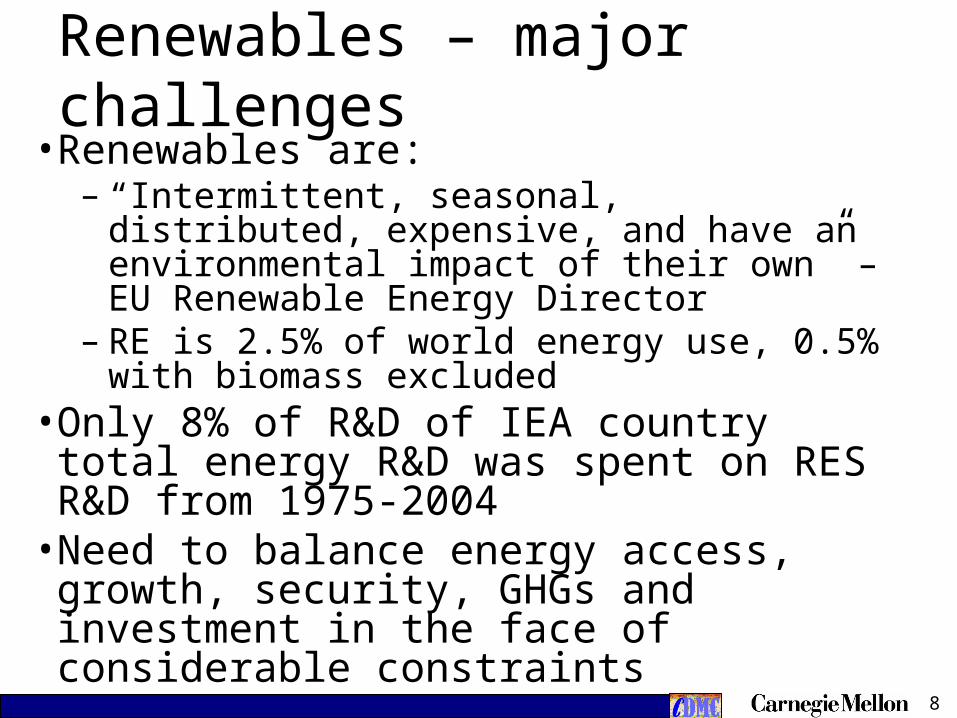
Renewables – major challenges • Renewables are:
– “Intermittent, seasonal, distributed, expensive, and have an environmental impact of their own” – EU Renewable Energy Director
– RE is 2.5% of world energy use, 0.5% with biomass excluded
• Only 8% of R&D of IEA country total energy R&D was spent on RES R&D from 1975-2004
• Need to balance energy access, growth, security, GHGs and investment in the face of considerable constraints
9
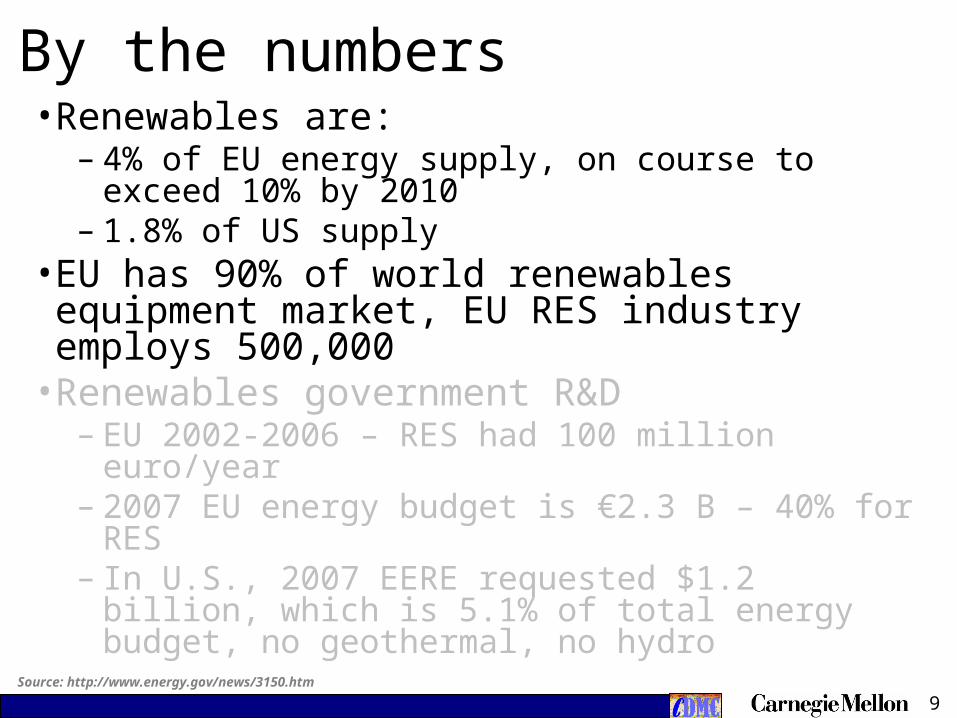
By the numbers • Renewables are:
– 4% of EU energy supply, on course to exceed 10% by 2010
– 1.8% of US supply• EU has 90% of world renewables equipment
market, EU RES industry employs 500,000• Renewables government R&D
– EU 2002-2006 – RES had 100 million euro/year– 2007 EU energy budget is €2.3 B – 40% for RES– In U.S., 2007 EERE requested $1.2 billion, which
is 5.1% of total energy budget, no geothermal, no hydro
Source: http://www.energy.gov/news/3150.htm
10
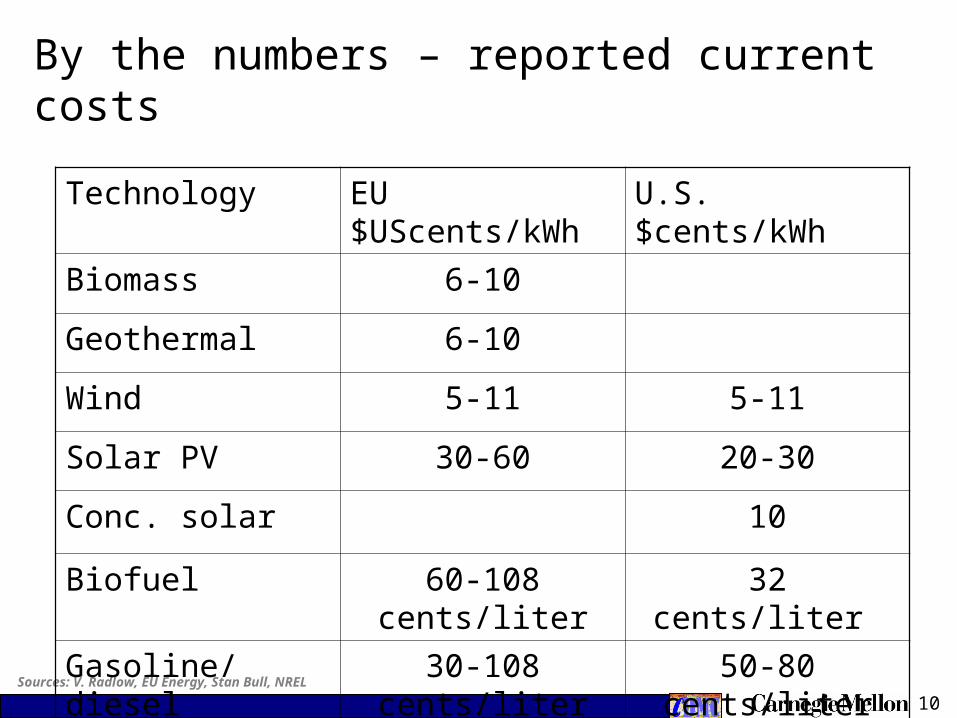
By the numbers – reported current costs
Sources: V. Radlow, EU Energy, Stan Bull, NREL
Technology EU $UScents/kWh U.S. $cents/kWh
Biomass 6-10
Geothermal 6-10
Wind 5-11 5-11
Solar PV 30-60 20-30
Conc. solar 10
Biofuel 60-108 cents/liter 32 cents/liter
Gasoline/diesel 30-108 cents/liter 50-80 cents/liter
11
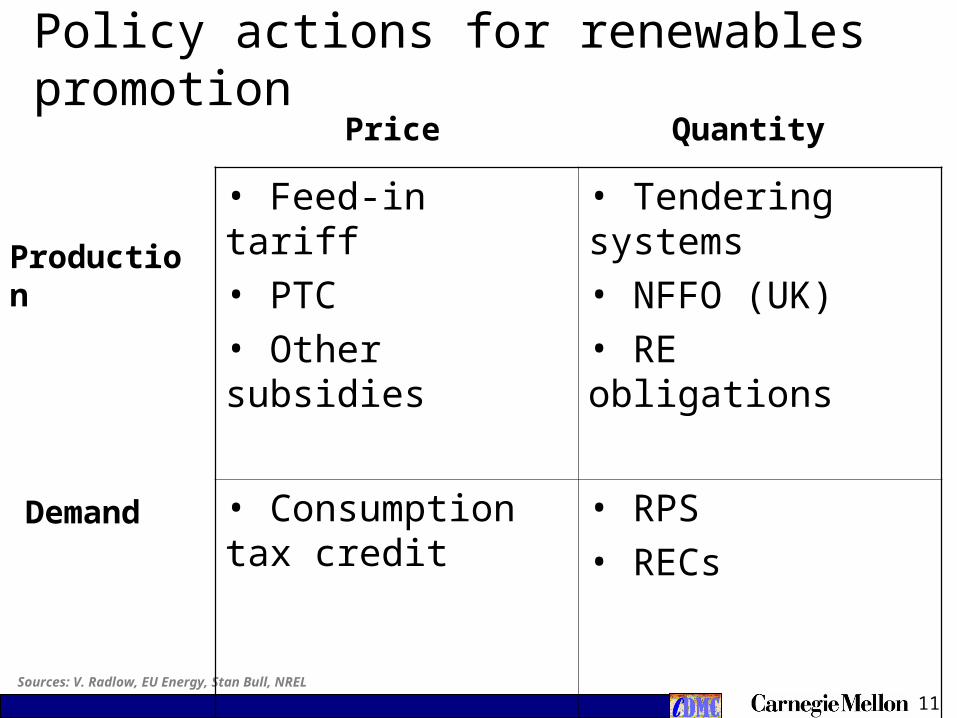
Policy actions for renewables promotion
Sources: V. Radlow, EU Energy, Stan Bull, NREL
• Feed-in tariff• PTC• Other subsidies
• Tendering systems• NFFO (UK)• RE obligations
• Consumption tax credit
• RPS• RECs
Production
Demand
Price Quantity
12
Policy evaluation and end goals • Criteria to judge RES policy
– supply effectiveness (kW, kWh)– cost effectiveness (kW/$)– economic efficiency ($/ton CO2)– equity (fair distribution of costs and benefits)
• Policy actions depend on end goals– FIT supports industry development– R&D promotes new applications– RECs support lowest cost technologies– Certified emissions reductions internalize
environmental externalities
13
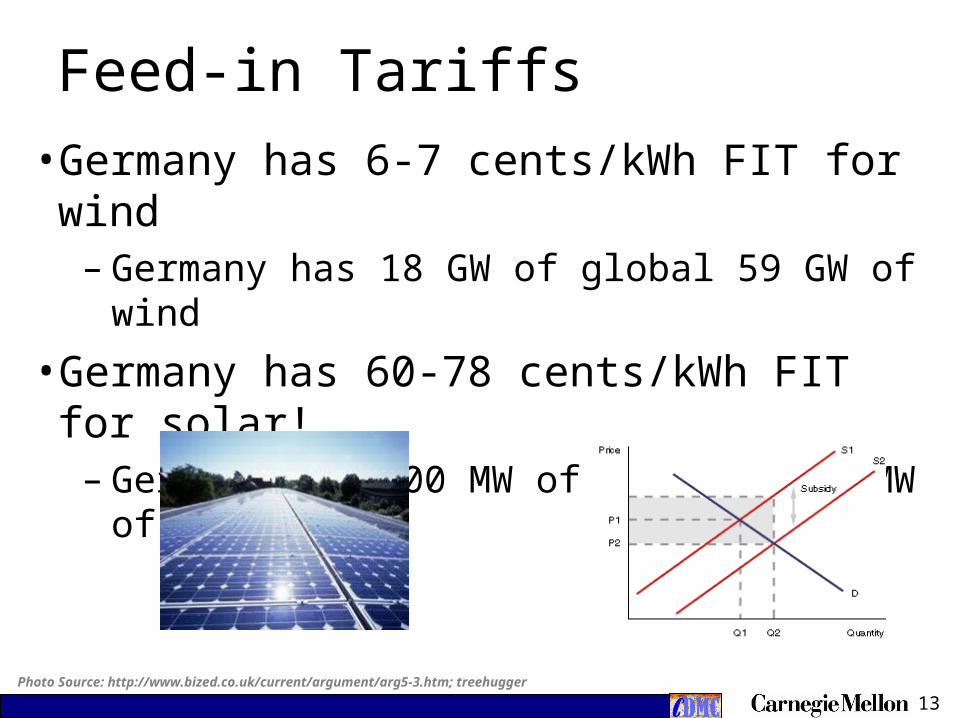
Feed-in Tariffs
• Germany has 6-7 cents/kWh FIT for wind– Germany has 18 GW of global 59 GW of wind
• Germany has 60-78 cents/kWh FIT for solar!– Germany has 800 MW of global 2600 MW of
solar PV
Photo Source: http://www.bized.co.uk/current/argument/arg5-3.htm; treehugger
14
Wind highlights • Wind and intermittency
– Some papers argued it is a power balancing issue and not a big concern, need 30% penetration before you notice 10% increase in system variability
• For 1 minute of silence observed for Tsunami, demand in UK dropped 1500 MW almost instantly, then came back after 1 minute was over; no problem
• High oil prices drive up price of offshore wind construction; high demand for construction equipment and crews that are more valuable for extraction
15
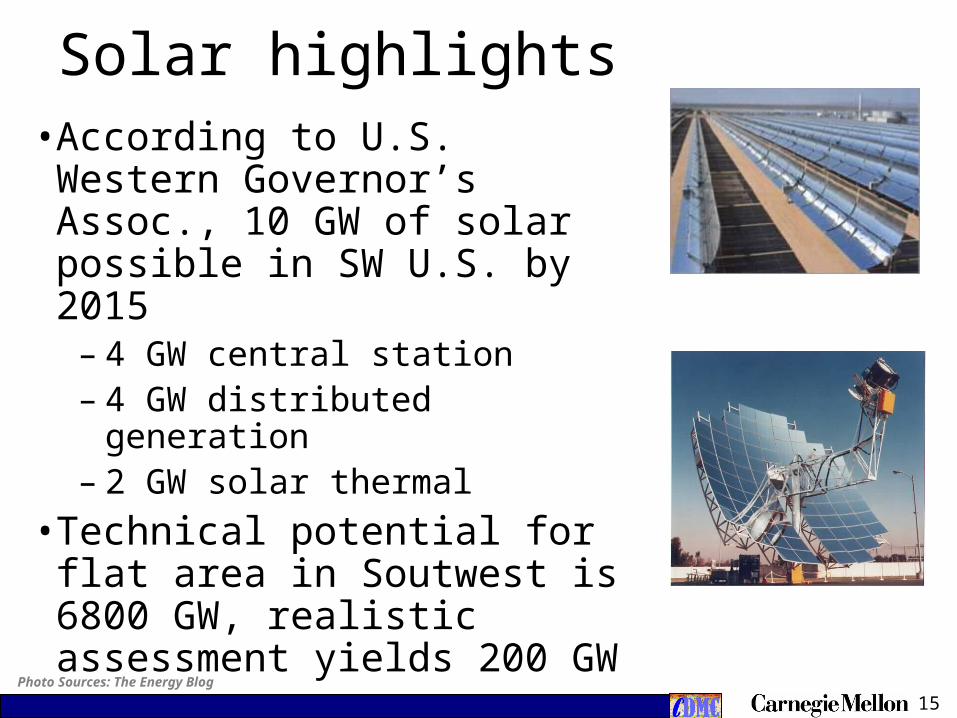
Solar highlights • According to U.S. Western
Governor’s Assoc., 10 GW of solar possible in SW U.S. by 2015
– 4 GW central station– 4 GW distributed generation– 2 GW solar thermal
• Technical potential for flat area in Soutwest is 6800 GW, realistic assessment yields 200 GW
Photo Sources: The Energy Blog
16
Interesting and surprising • Solar thermal responsible for 65 and 90% of
Greece, Cyprus residential hot water needs
• CO2 capture and sequestration– EOR may drive 16 of the next 20 planned CCS– Weyburn field gets 6.5 barrels of oil out for
every ton of CO2 purchased, currently trucking in CO2 at $110/ton
• Wind is 25% of Denmark’s capacity, but 80% is exported
17
Interesting and surprising • Consolidation in EU utility industry
– 8 companies control 2/3 of market, high buy premiums in M&A reflect expectation of high future profits
• Building of coal plants in China is understated– Small munis and villages building 50-150 MW coal plants
and are not tracked by the government; coal is usually shipped by truck
• Marine energy getting serious analysis– 25 MW wave energy planned for Portugal, thanks to
27 UScents/kWh FIT!– UK has more extractable tidal energy than all of Europe,
19 TWh– 1 MW wave power to be installed in Ireland
18
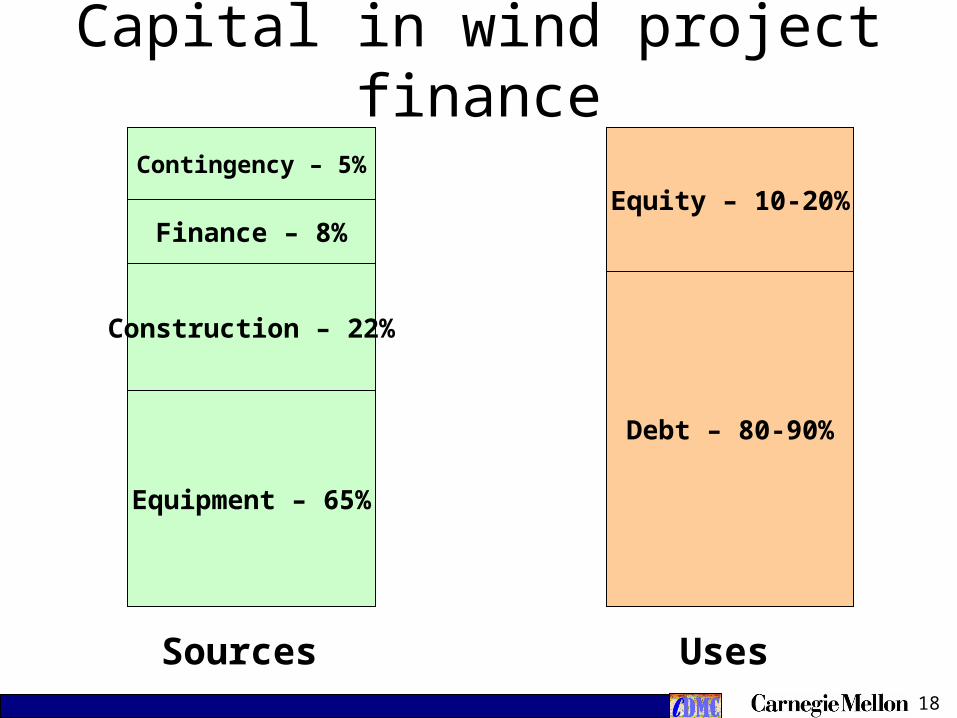
Equipment – 65%
Construction – 22%
Finance – 8%
Contingency – 5%
Debt – 80-90%
Capital in wind project finance
Equity – 10-20%
Sources Uses
19
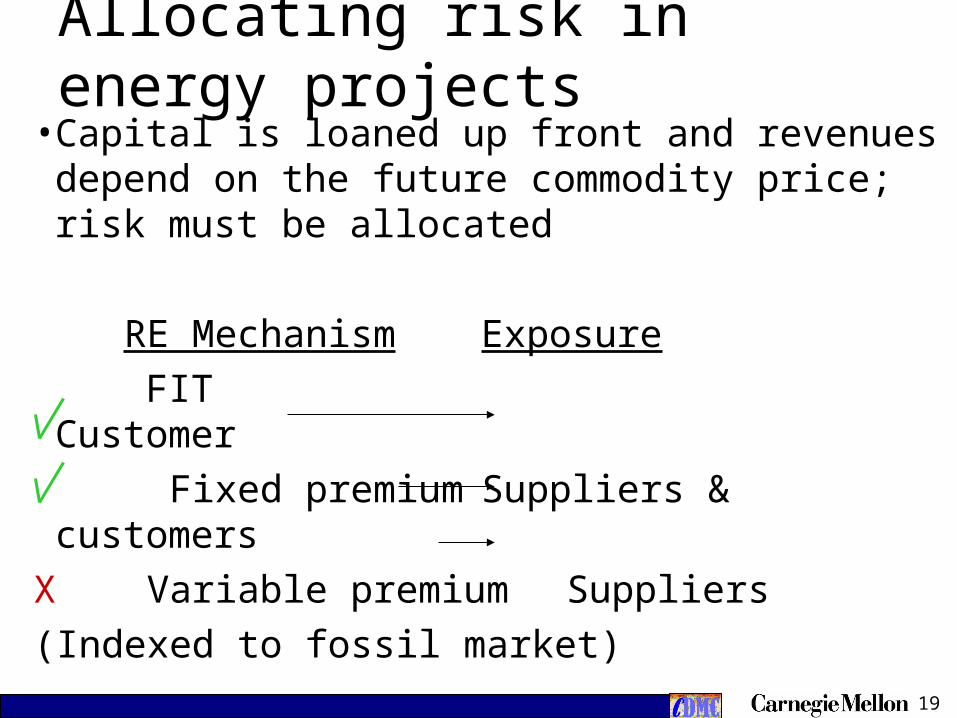
Allocating risk in energy projects• Capital is loaned up front and revenues
depend on the future commodity price; risk must be allocated
RE Mechanism Exposure
FIT Customer
Fixed premium Suppliers & customers
X Variable premium Suppliers
(Indexed to fossil market)
20
Allocating risk in energy projects• Financiers hedge at lowest possible price, so
if renewable premium is variable, financier assumes lowest price
• Margin on power purchase agreement is implicit risk management fee charged by electricity company
• Successful policy would have a FIT for first 1000 MW of new technology
21
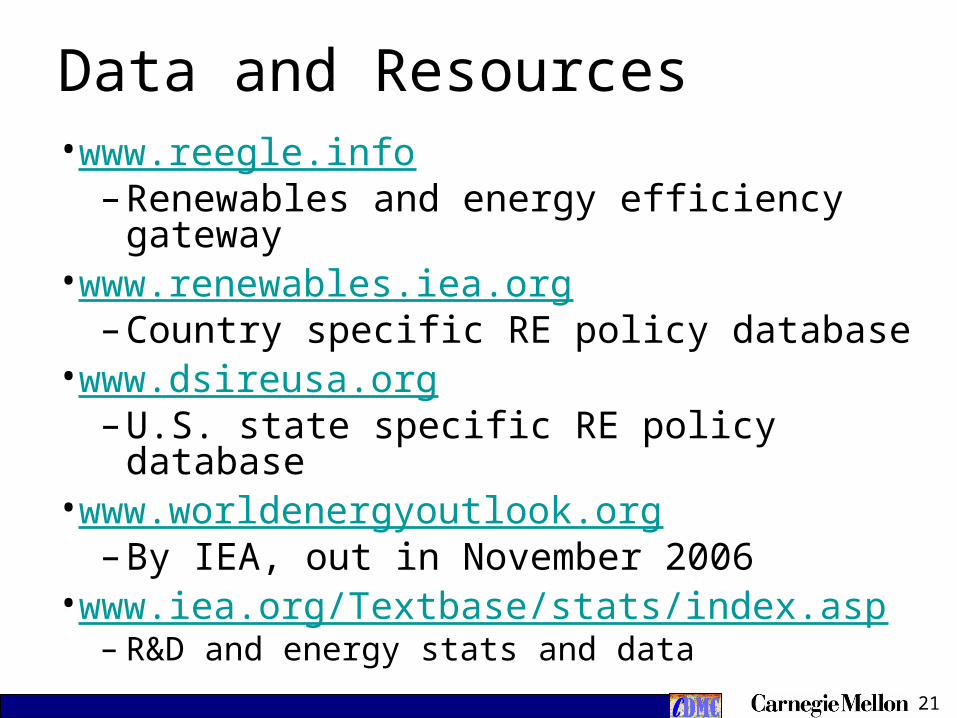
Data and Resources • www.reegle.info
– Renewables and energy efficiency gateway
• www.renewables.iea.org– Country specific RE policy database
• www.dsireusa.org– U.S. state specific RE policy database
• www.worldenergyoutlook.org– By IEA, out in November 2006
• www.iea.org/Textbase/stats/index.asp– R&D and energy stats and data
22
Potential research questions • Learning curve analysis for future energy
technologies • How much of an impact could production with
CCS from biomass/biorefineries make on CO2 ppm? What about bio syngas, methanol, or F-T fluid for transport?
• An evaluation of RE policies – i.e. $/ton CO2 for subsidies in Germany
• Price of coal-to-liquids (CTL) with CCS for transport fuels?
• Also have conference materials from Windpower 2006
23
Conclusions • Large investment in RE necessary,
predictable policy regime required• IEA/IPCC – Can not possibly substitute RES
for coal/oil/gas in time – Must get CCS online, including CCS for
biofuels/biorefineries– Biggest concern is CTL without CCS
• There is a race to find an economically compelling example of low-carbon power production, which will be the only way to persuade the developing world
24
Perspectives • On GHGs, Europe is “clinging to comforting
delusions of grandeur in a post imperial mindset, ‘doing their bit’ and nothing more” “Markets will respond to RE subsidies by investing in the least capital intensive qualifying ticket for the RE gravy train” – J. Constable, UK RE Foundation
• “EU actions and GHG contributions are ridiculously minute and amounts to a lot of posturing by bit players. Failure to address CO2 intensity by U.S., China, India, Brazil, a scathing failure” – M. Jefferson, IPCC, UNDP
25
Questions and comments
• For more information and resources:– Email: [email protected]– On CMU campus, stop by Hamburg A020