Embed Size (px)
Citation preview

1
How Much Water is in Crater Lake?
Using prisms to calculate volume.
Heather LehtoDepartment of Geology, University of South Florida, Tampa, FL 33620© 2009 University of South Florida Libraries. All rights reserved.
SSACgnp.GB1601.HL1.1
Supporting Quantitative Literacy TopicsUnit ConversionsEstimation and Accuracy
Core Quantitative Literacy TopicsContour MapsVolume
Core Geoscience SubjectBathymetric maps
H. L. Lehto
This material is based upon work supported by the National Science Foundation under Grant Number NSF DUE-0836566.Any opinions, findings, and conclusions or recommendations expressed in this material are those of the author(s) and do not necessarily reflect the views of the National Science Foundation.
2
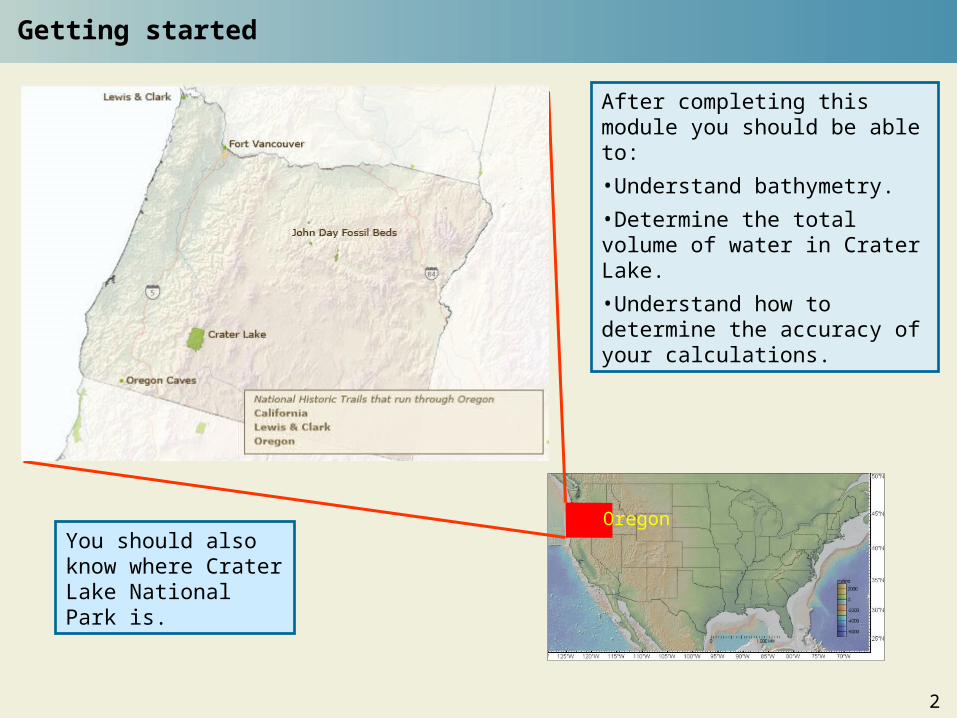
Getting started
You should also know where Crater Lake National Park is.
After completing this module you should be able to:
•Understand bathymetry.
•Determine the total volume of water in Crater Lake.
•Understand how to determine the accuracy of your calculations.
Oregon
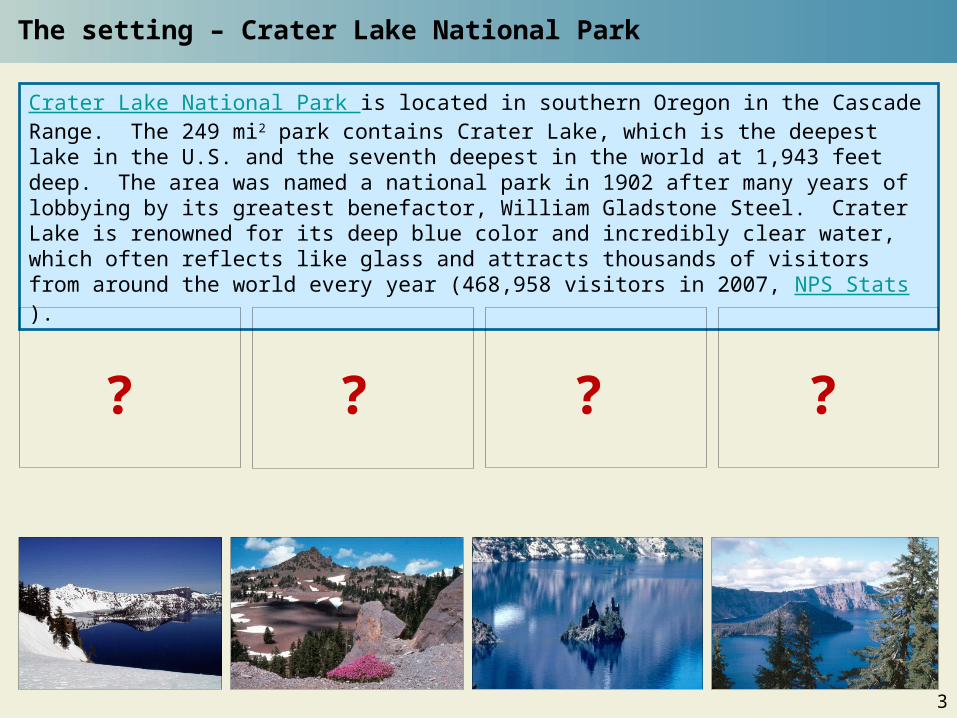
The setting – Crater Lake National Park
3
Crater Lake National Park is located in southern Oregon in the Cascade Range. The 249 mi2 park contains Crater Lake, which is the deepest lake in the U.S. and the seventh deepest in the world at 1,943 feet deep. The area was named a national park in 1902 after many years of lobbying by its greatest benefactor, William Gladstone Steel. Crater Lake is renowned for its deep blue color and incredibly clear water, which often reflects like glass and attracts thousands of visitors from around the world every year (468,958 visitors in 2007, NPS Stats).
? ???
Geologic setting
4
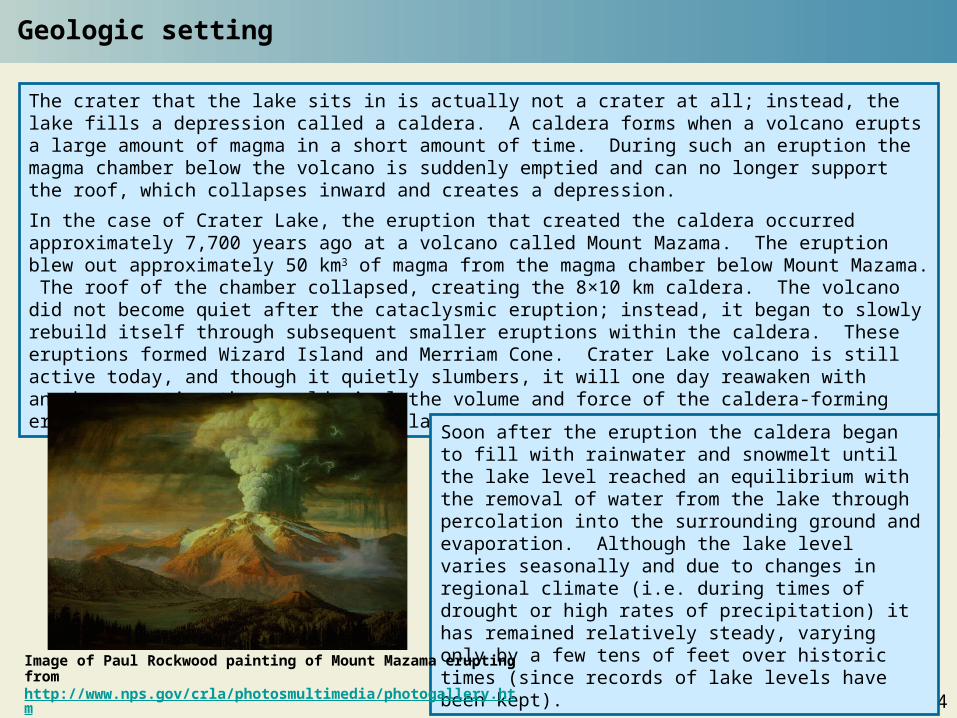
The crater that the lake sits in is actually not a crater at all; instead, the lake fills a depression called a caldera. A caldera forms when a volcano erupts a large amount of magma in a short amount of time. During such an eruption the magma chamber below the volcano is suddenly emptied and can no longer support the roof, which collapses inward and creates a depression.
In the case of Crater Lake, the eruption that created the caldera occurred approximately 7,700 years ago at a volcano called Mount Mazama. The eruption blew out approximately 50 km3 of magma from the magma chamber below Mount Mazama. The roof of the chamber collapsed, creating the 8×10 km caldera. The volcano did not become quiet after the cataclysmic eruption; instead, it began to slowly rebuild itself through subsequent smaller eruptions within the caldera. These eruptions formed Wizard Island and Merriam Cone. Crater Lake volcano is still active today, and though it quietly slumbers, it will one day reawaken with another eruption that could rival the volume and force of the caldera-forming eruption which formed the spectacular landscape we see today.
Soon after the eruption the caldera began to fill with rainwater and snowmelt until the lake level reached an equilibrium with the removal of water from the lake through percolation into the surrounding ground and evaporation. Although the lake level varies seasonally and due to changes in regional climate (i.e. during times of drought or high rates of precipitation) it has remained relatively steady, varying only by a few tens of feet over historic times (since records of lake levels have been kept).
Image of Paul Rockwood painting of Mount Mazama erupting from http://www.nps.gov/crla/photosmultimedia/photogallery.htm
5
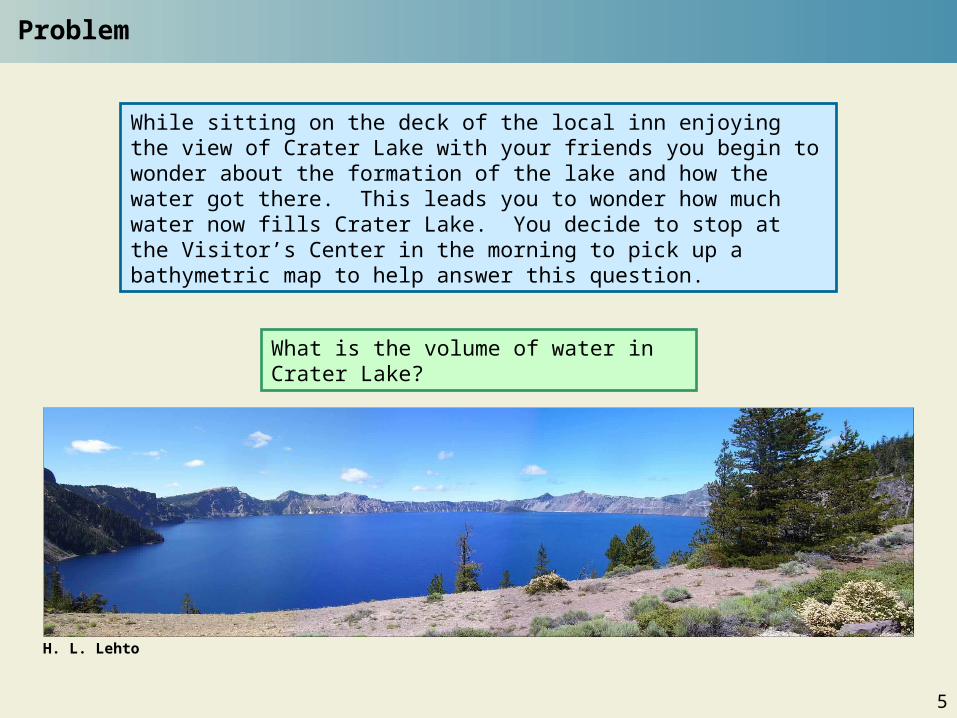
While sitting on the deck of the local inn enjoying the view of Crater Lake with your friends you begin to wonder about the formation of the lake and how the water got there. This leads you to wonder how much water now fills Crater Lake. You decide to stop at the Visitor’s Center in the morning to pick up a bathymetric map to help answer this question.
Problem
What is the volume of water in Crater Lake?
H. L. Lehto
6
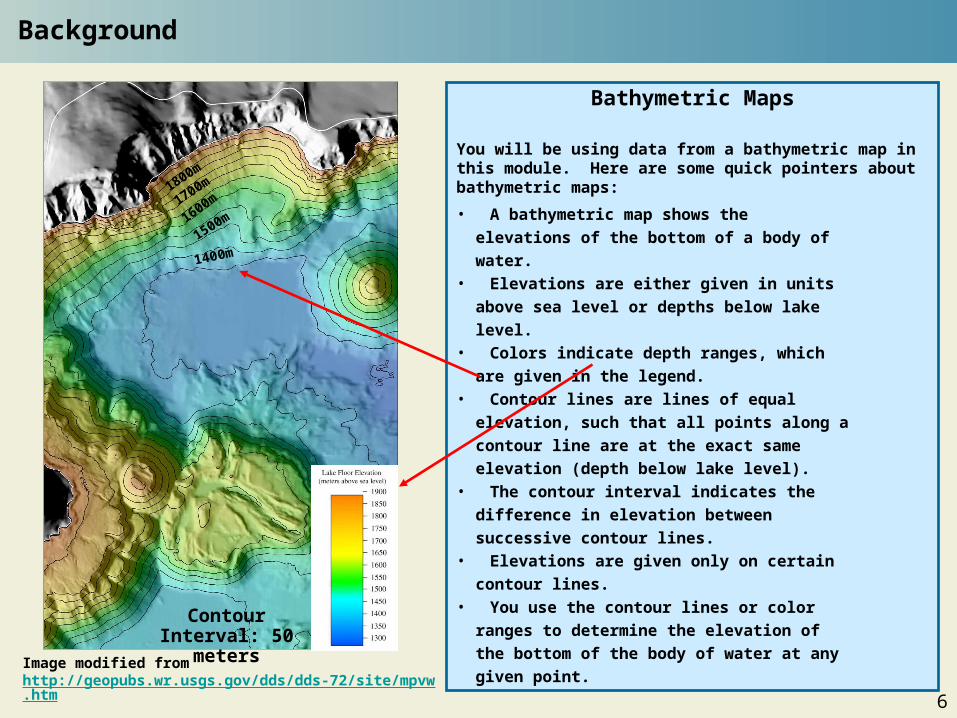
Bathymetric Maps
You will be using data from a bathymetric map in this module. Here are some quick pointers about bathymetric maps:
• A bathymetric map shows the
elevations of the bottom of a body of
water.• Elevations are either given in units
above sea level or depths below lake
level.• Colors indicate depth ranges, which
are given in the legend.• Contour lines are lines of equal
elevation, such that all points along a
contour line are at the exact same
elevation (depth below lake level).• The contour interval indicates the
difference in elevation between
successive contour lines.• Elevations are given only on certain
contour lines.• You use the contour lines or color
ranges to determine the elevation of
the bottom of the body of water at any
given point.
Background
Contour Interval: 50 meters
1400m1500m1600m1700m1800m
Image modified from http://geopubs.wr.usgs.gov/dds/dds-72/site/mpvw.htm
7
Bathymetry of Crater Lake
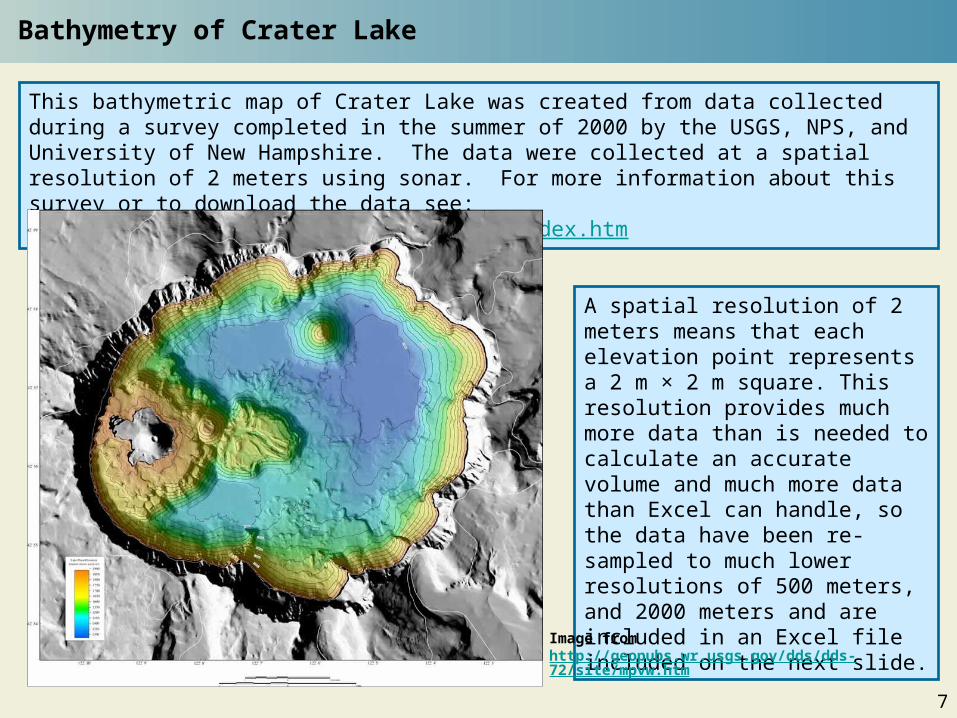
This bathymetric map of Crater Lake was created from data collected during a survey completed in the summer of 2000 by the USGS, NPS, and University of New Hampshire. The data were collected at a spatial resolution of 2 meters using sonar. For more information about this survey or to download the data see: http://geopubs.wr.usgs.gov/dds/dds-72/index.htm
A spatial resolution of 2 meters means that each elevation point represents a 2 m × 2 m square. This resolution provides much more data than is needed to calculate an accurate volume and much more data than Excel can handle, so the data have been re-sampled to much lower resolutions of 500 meters, and 2000 meters and are included in an Excel file included on the next slide.
Image from http://geopubs.wr.usgs.gov/dds/dds-72/site/mpvw.htm
8
Volumes and prisms
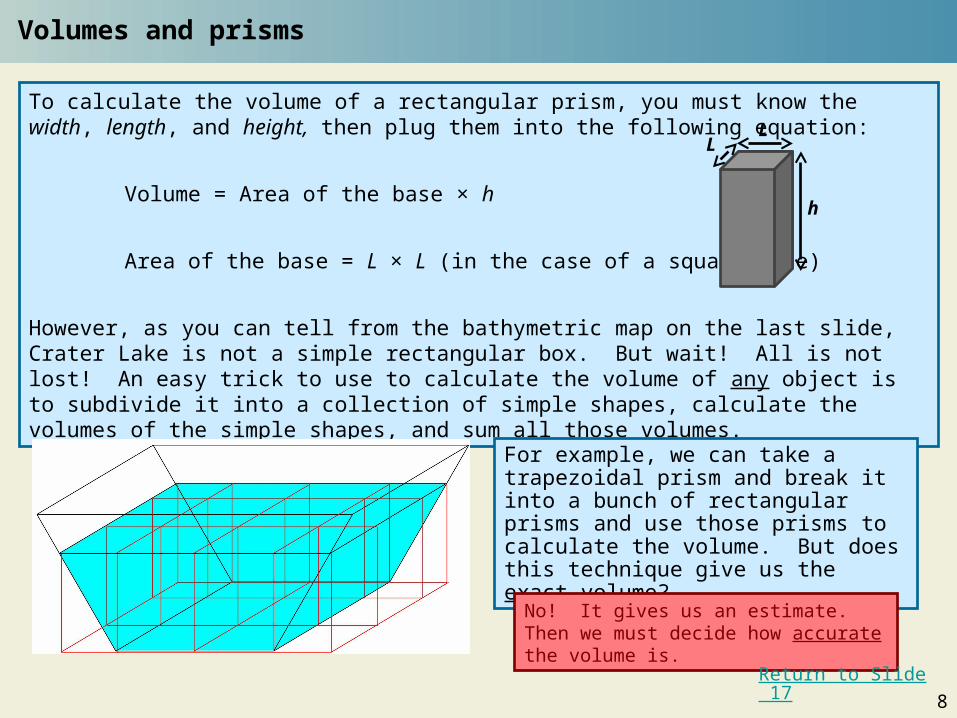
To calculate the volume of a rectangular prism, you must know the width, length, and height, then plug them into the following equation:
Volume = Area of the base × h
Area of the base = L × L (in the case of a square base)
However, as you can tell from the bathymetric map on the last slide, Crater Lake is not a simple rectangular box. But wait! All is not lost! An easy trick to use to calculate the volume of any object is to subdivide it into a collection of simple shapes, calculate the volumes of the simple shapes, and sum all those volumes.
LL
h
For example, we can take a trapezoidal prism and break it into a bunch of rectangular prisms and use those prisms to calculate the volume. But does this technique give us the exact volume?
No! It gives us an estimate. Then we must decide how accurate the volume is.
Return to Slide 17
Volumes and prisms (con’t)
9
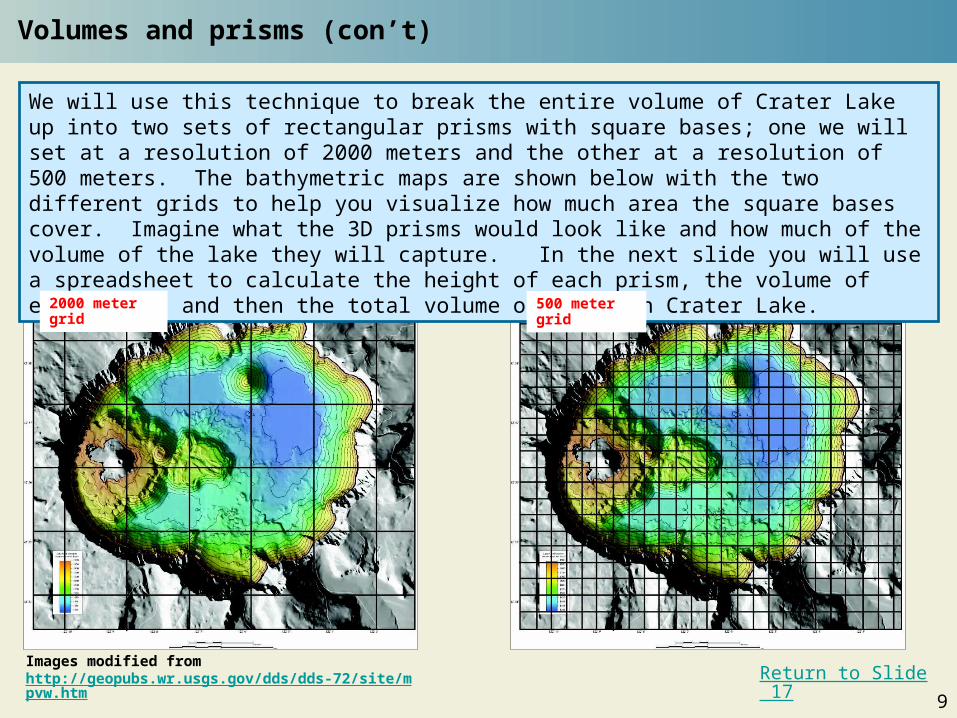
We will use this technique to break the entire volume of Crater Lake up into two sets of rectangular prisms with square bases; one we will set at a resolution of 2000 meters and the other at a resolution of 500 meters. The bathymetric maps are shown below with the two different grids to help you visualize how much area the square bases cover. Imagine what the 3D prisms would look like and how much of the volume of the lake they will capture. In the next slide you will use a spreadsheet to calculate the height of each prism, the volume of each prism, and then the total volume of water in Crater Lake.
Images modified from http://geopubs.wr.usgs.gov/dds/dds-72/site/mpvw.htm
2000 meter grid 500 meter grid
Return to Slide 17
10
The spreadsheet (provided)
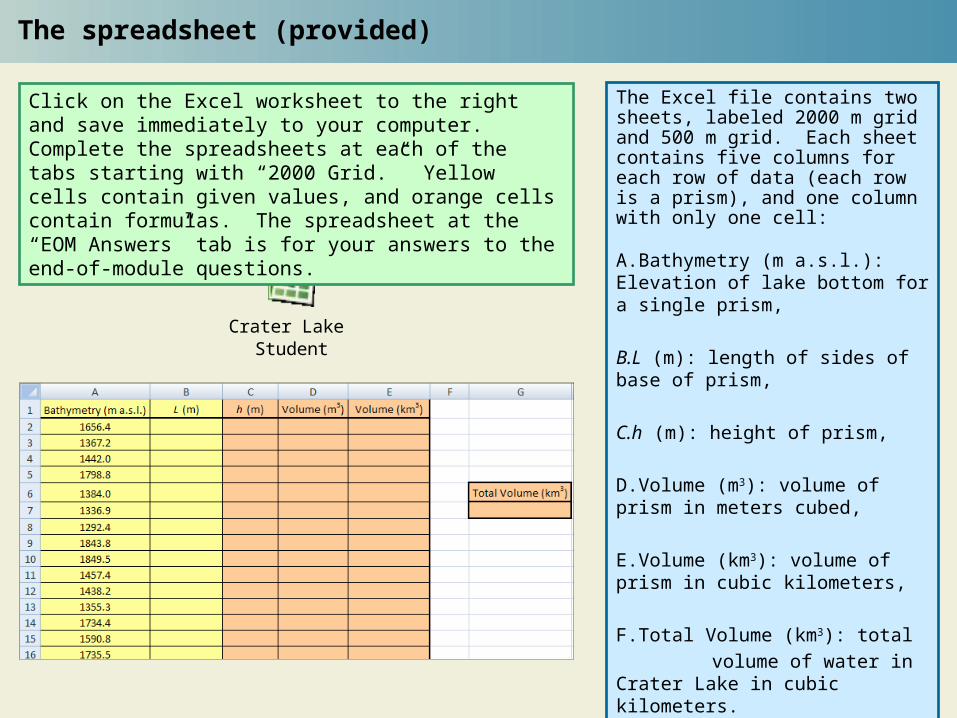
The Excel file contains two sheets, labeled 2000 m grid and 500 m grid. Each sheet contains five columns for each row of data (each row is a prism), and one column with only one cell:
A.Bathymetry (m a.s.l.): Elevation of lake bottom for a single prism,
B.L (m): length of sides of base of prism,
C.h (m): height of prism,
D.Volume (m3): volume of prism in meters cubed,
E.Volume (km3): volume of prism in cubic kilometers,
F.Total Volume (km3): total
volume of water in Crater Lake in cubic kilometers.
Crater Lake Student
Click on the Excel worksheet to the right and save immediately to your computer. Complete the spreadsheets at each of the tabs starting with “2000 Grid.” Yellow cells contain given values, and orange cells contain formulas. The spreadsheet at the “EOM Answers” tab is for your answers to the end-of-module questions.
Determine the length
11
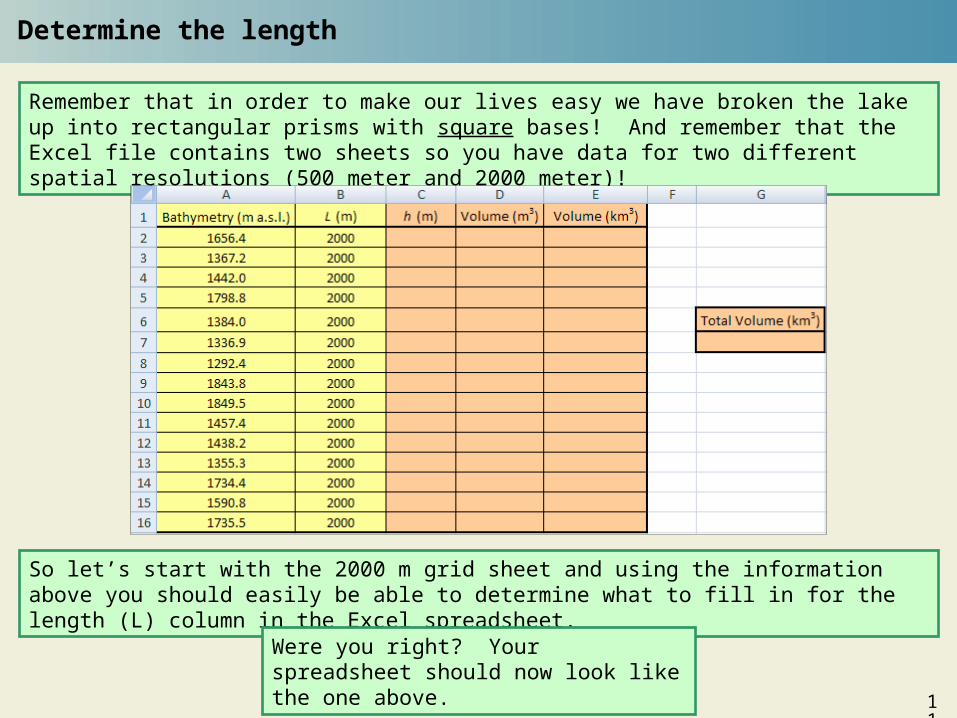
Remember that in order to make our lives easy we have broken the lake up into rectangular prisms with square bases! And remember that the Excel file contains two sheets so you have data for two different spatial resolutions (500 meter and 2000 meter)!
So let’s start with the 2000 m grid sheet and using the information above you should easily be able to determine what to fill in for the length (L) column in the Excel spreadsheet.
Were you right? Your spreadsheet should now look like the one above.
12
Calculate the height
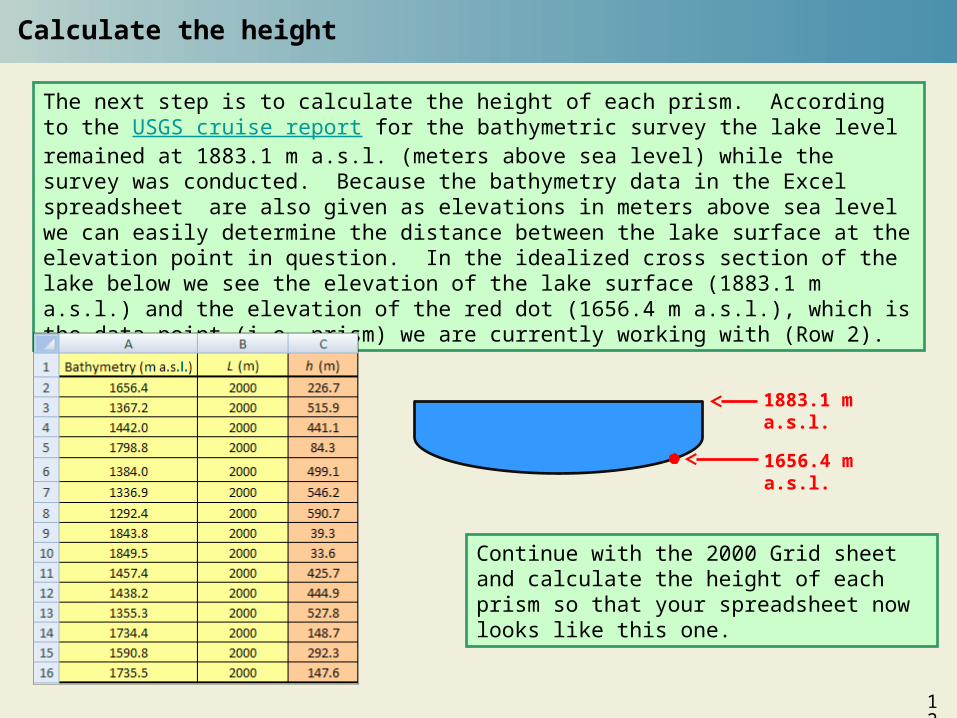
The next step is to calculate the height of each prism. According to the USGS cruise report for the bathymetric survey the lake level remained at 1883.1 m a.s.l. (meters above sea level) while the survey was conducted. Because the bathymetry data in the Excel spreadsheet are also given as elevations in meters above sea level we can easily determine the distance between the lake surface at the elevation point in question. In the idealized cross section of the lake below we see the elevation of the lake surface (1883.1 m a.s.l.) and the elevation of the red dot (1656.4 m a.s.l.), which is the data point (i.e. prism) we are currently working with (Row 2).
Continue with the 2000 Grid sheet and calculate the height of each prism so that your spreadsheet now looks like this one.
1883.1 m a.s.l.
1656.4 m a.s.l.
13
Calculate the volume
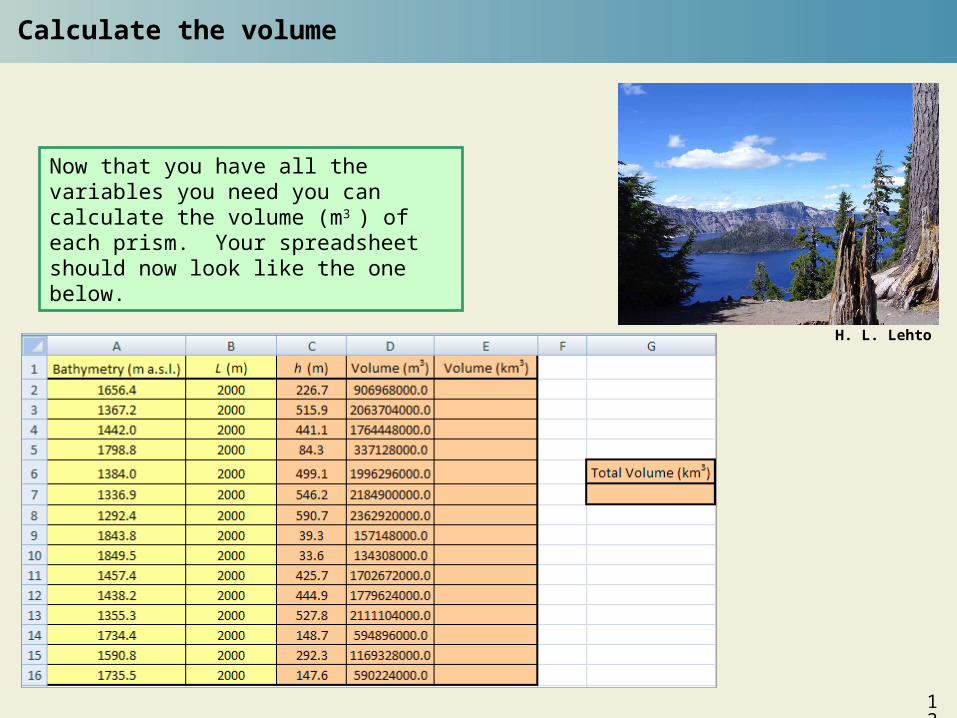
Now that you have all the variables you need you can calculate the volume (m3 ) of each prism. Your spreadsheet should now look like the one below.
H. L. Lehto
14
Conversions
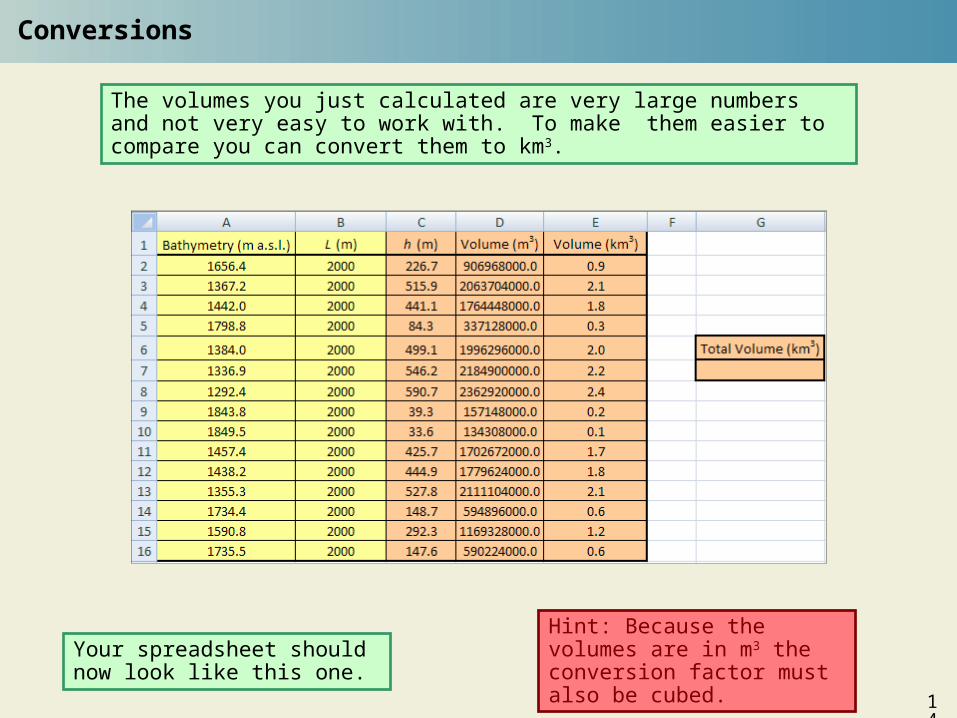
Hint: Because the volumes are in m3 the conversion factor must also be cubed.
The volumes you just calculated are very large numbers and not very easy to work with. To make them easier to compare you can convert them to km3.
Your spreadsheet should now look like this one.
15
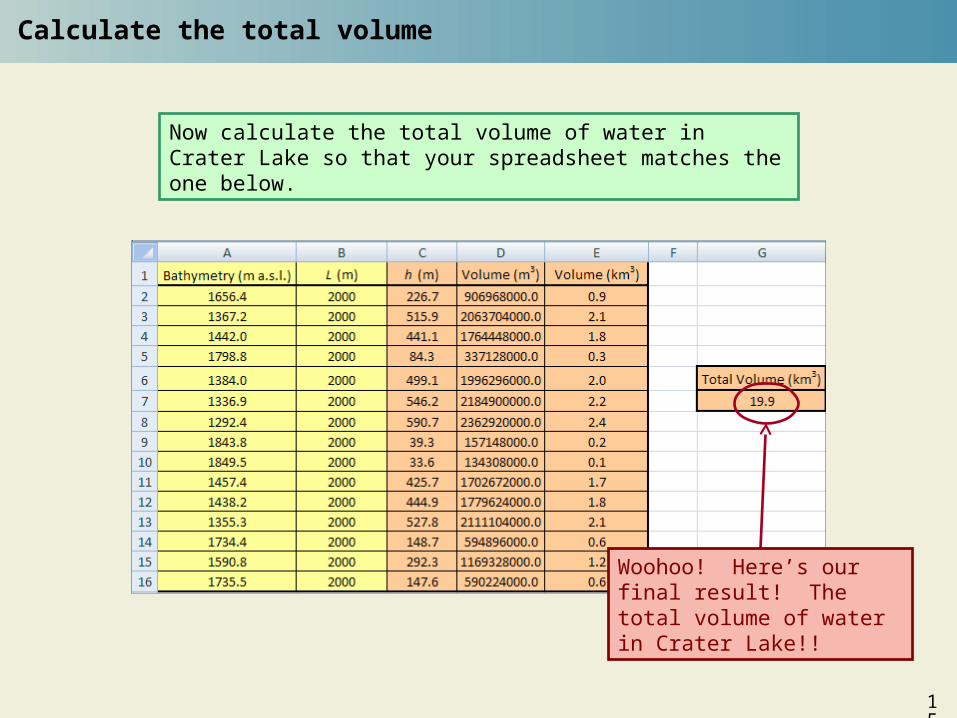
Calculate the total volume
Now calculate the total volume of water in Crater Lake so that your spreadsheet matches the one below.
Woohoo! Here’s our final result! The total volume of water in Crater Lake!!
16
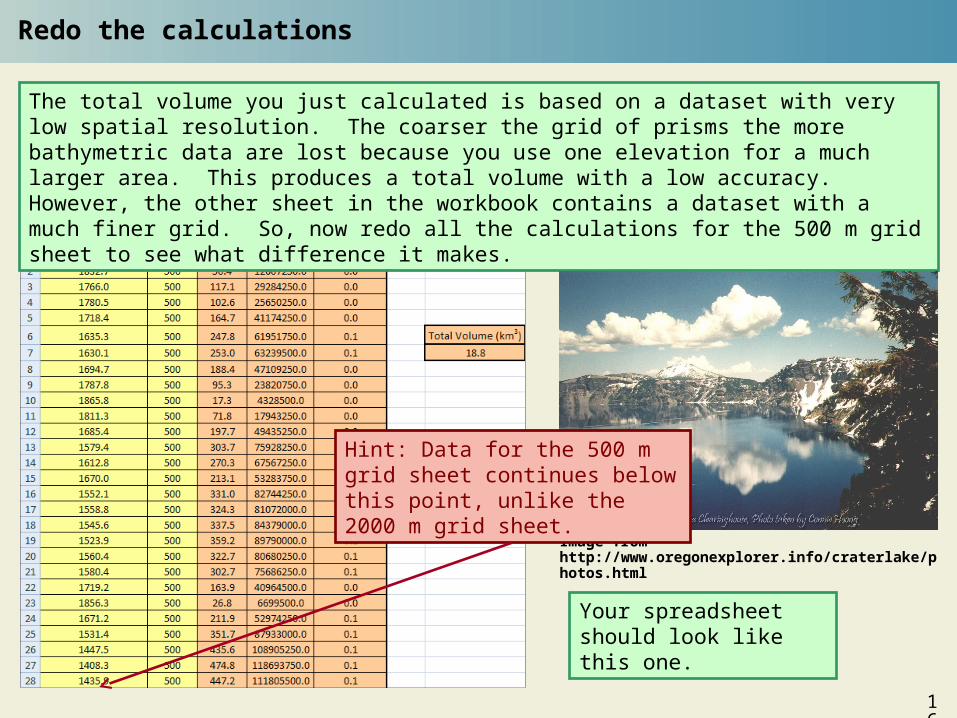
Redo the calculations
The total volume you just calculated is based on a dataset with very low spatial resolution. The coarser the grid of prisms the more bathymetric data are lost because you use one elevation for a much larger area. This produces a total volume with a low accuracy. However, the other sheet in the workbook contains a dataset with a much finer grid. So, now redo all the calculations for the 500 m grid sheet to see what difference it makes.
Your spreadsheet should look like this one.
Image from http://www.oregonexplorer.info/craterlake/photos.html
Hint: Data for the 500 m grid sheet continues below this point, unlike the 2000 m grid sheet.
17
Volume and accuracy
To understand why the volumes are so different we must think about the sources of error in the calculations. Think back to the trapezoidal prism from Slide 8 that we broke into rectangular prisms. Those prisms did not fit the larger volume well. There were areas of some rectangular prisms that didn’t contain “water” (i.e. areas that were not blue). These prisms were “adding” extra volume to the total volume that wasn’t really there.
Also, you can tell from the bathymetric map that the bottom of Crater Lake is NOT flat. But our technique assumes that it is. So some of the rectangular prisms that make up the interior of the lake are also sources of error.
The actual volume of water in Crater Lake is 18.7 km3 (Nathenson et al., 2007). Which of the grids (500 or 2000) produced the most accurate volume (i.e. the volume that most closely matched the known volume)?
Now think back to the bathymetric maps shown on Slide 9. Which grid (500 or 2000) fits the lake area best? In other words which grid has less unfilled space adding to the volume calculations?
Did the best fitting grid (answer from above) produce the most accurate volume?
18
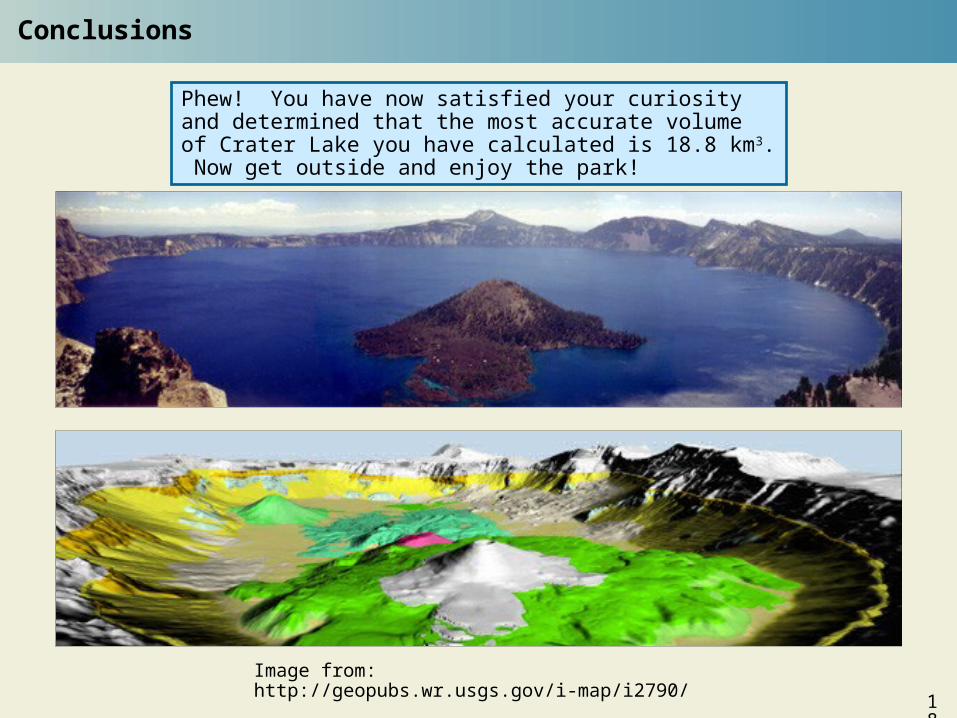
Conclusions
Phew! You have now satisfied your curiosity and determined that the most accurate volume of Crater Lake you have calculated is 18.8 km3. Now get outside and enjoy the park!
Image from: http://geopubs.wr.usgs.gov/i-map/i2790/

19
End-of-module assignment
1. Now that you know the most accurate volume of water in Crater Lake convert this volume into gallons. If the government decided to sell each gallon of water in the lake for $1, would they be able to pay off the national debt?
2. You just learned that the rectangular prism technique has sources of error that stem from the shape of the prism used. How might you design a new technique for calculating the volume of a complex shape such as Crater Lake? What 3D shape or mixture of shapes might you use to reduce the amount of error associated with “unfilled” volumes?
3. The volcanism that began to rebuild Crater Lake resulted in the formation of two smaller volcanic vents. One, called Wizard Island, rises above the lake surface while the other, Merriam Cone, remains hidden beneath the water. Using the spreadsheet attached below calculate the volume of Merriam Cone using an elevation of 1289 m a.s.l. as the base of the cone. The only difference between this calculation and the one you used in the module is that this time your volume is upside down so you will need to use the absolute value (ABS) function in Excel to calculate the height.
4. The estimated height of the summit of Mount Mazama is 3,700 m. The diameter of the caldera rim of Crater Lake is 9.7 km and the elevation of the bottom of the lake is 1943 m a.s.l. Assuming that the lake bottom is flat (big assumption) use the above information to create a spreadsheet to calculate the volume of the former summit of Mount Mazama that was blown away during the cataclysmic eruption ~7,700 years ago (in km3). Hint: A cone is a reasonable approximation for the shape of the summit.
5. If Crater Lake were to begin erupting lava flows and rebuilding it’s summit at an eruption rate of 2.0 × 10-
3 km3/year how many years would it take for the volcano to reach the same height (and therefore volume) that Mount Mazama was before the eruption ~7,700 years ago.
20
References
Cranson, K. R. 1980. Crater Lake, gem of the Cascades: the geological story of Crater Lake National Park. Lansing, Mich: K.R. Cranson Press.
Nathenson, Manuel, Bacon, C. R., Ramsey, D. W. 2007. Subaqueous geology and a filling model for Crater Lake, Oregon. Hydrobiologia. 574: 13-27.
The National Park Service website. http://www.nps.gov/crla/
USGS website Crater Lake Revealed. http://geopubs.wr.usgs.gov/i-map/i2790/
USGS website 2000 multibeam sonar survey of Crater Lake, Oregon; data, GIS, images, and movies. http://geopubs.wr.usgs.gov/dds/dds-72/
USGS website Cruise Report R/V Surf Surveyor Cruise S1-00-CL Mapping the Bathymetry of Crater Lake, Oregon. http://geopubs.wr.usgs.gov/open-file/of00-405/
CVO Website Crater Lake, Oregon, Mount Mazama, Oregon. http://vulcan.wr.usgs.gov/Volcanoes/CraterLake/framework.html