Embed Size (px)
Citation preview
1
IEPM-BWIEPM-BWIEPM-BWIEPM-BW
Warren Matthews (SLAC)
Presented at the UCL Monitoring Infrastructure Workshop, London, May 15-16, 2003.
2
Overview / GoalsOverview / GoalsOverview / GoalsOverview / Goals
• IEPM-BW monitoring and results
• Other measurements
• Publishing
• Troubleshooting Tools
• Further work
3
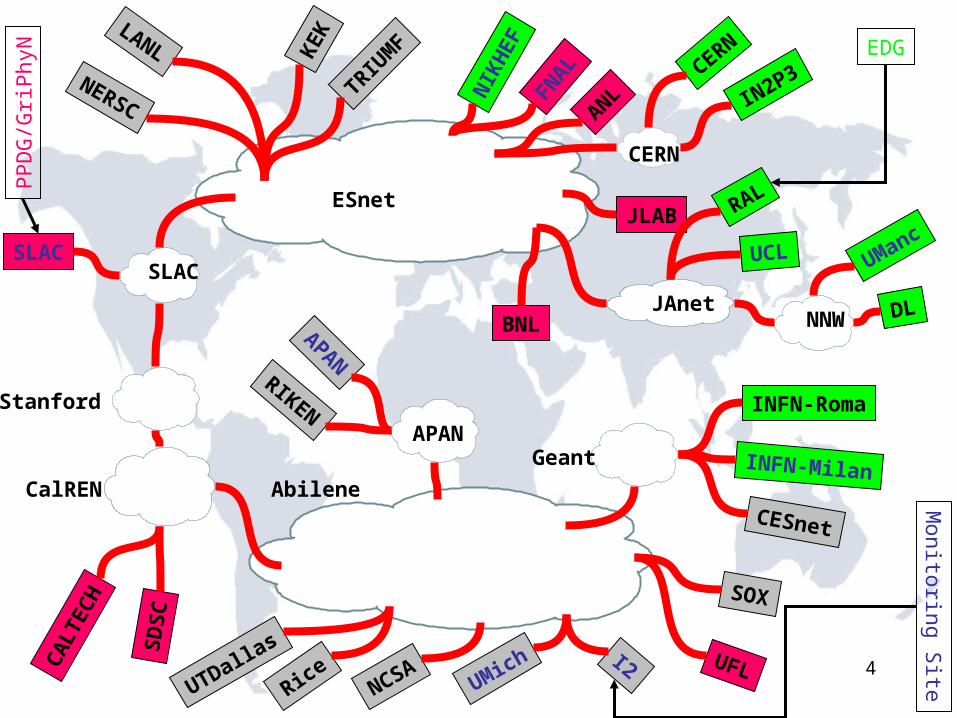
IEPM-BWIEPM-BWIEPM-BWIEPM-BW
• SLAC package for monitoring and analysis
• Currently 10 monitoring sites
• SLAC, FNAL, GATech (SOX), INFN
(Milan), NIKHEF, APAN (Japan)
• Manchester, UMich, UCL, Internet2
• 2-36 targets
4
SNV
SLAC
CHI
ESnetNY
Stanford
CalREN
NERSC
LANL
JLAB
TRIUM
F
KE
K
Abilene
SLAC
SNV
FNAL
ANLNIK
HE
F
CERN
IN2P3
CERN
CA
LT
EC
H
SDSC
BNLJAnet
HSTN
SEA
ATL
CLVIPLS
RAL
UCL UManc
DLNNW
NY
RiceUTDallas
NCSAUMich I2
SOX
UFL
APANRIKEN INFN-Roma
INFN-Milan
CESnet
APANGeant
EDGP
PD
G/G
riP
hyN
Monitoring S
ite
ORNL
5
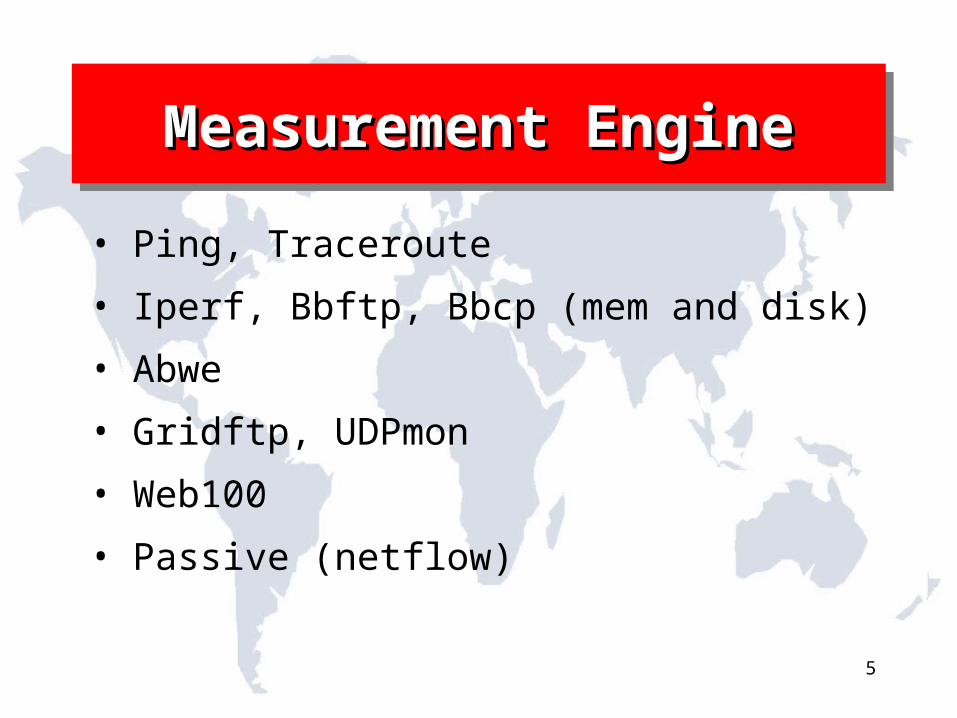
Measurement EngineMeasurement EngineMeasurement EngineMeasurement Engine
• Ping, Traceroute
• Iperf, Bbftp, Bbcp (mem and disk)
• Abwe
• Gridftp, UDPmon
• Web100
• Passive (netflow)
6
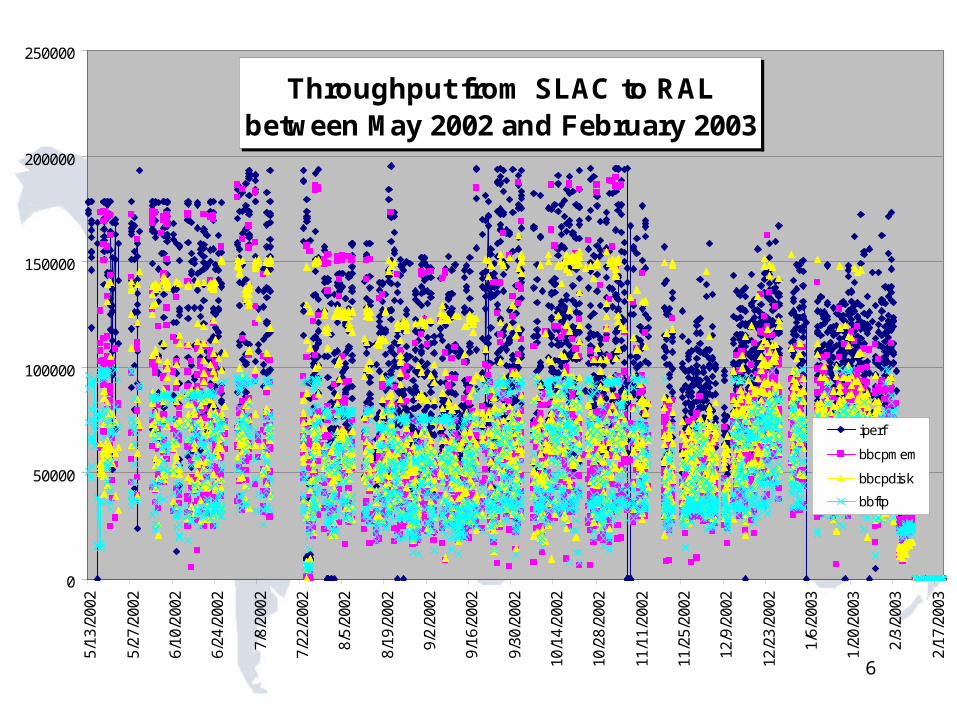
Throughput from SLAC to RAL between May 2002 and February 2003
0
50000
100000
150000
200000
250000
5/13/2002
5/27/2002
6/10/2002
6/24/2002
7/8/2002
7/22/2002
8/5/2002
8/19/2002
9/2/2002
9/16/2002
9/30/2002
10/14/2002
10/28/2002
11/11/2002
11/25/2002
12/9/2002
12/23/2002
1/6/2003
1/20/2003
2/3/2003
2/17/2003
iperf
bbcpmem
bbcpdisk
bbftp
7
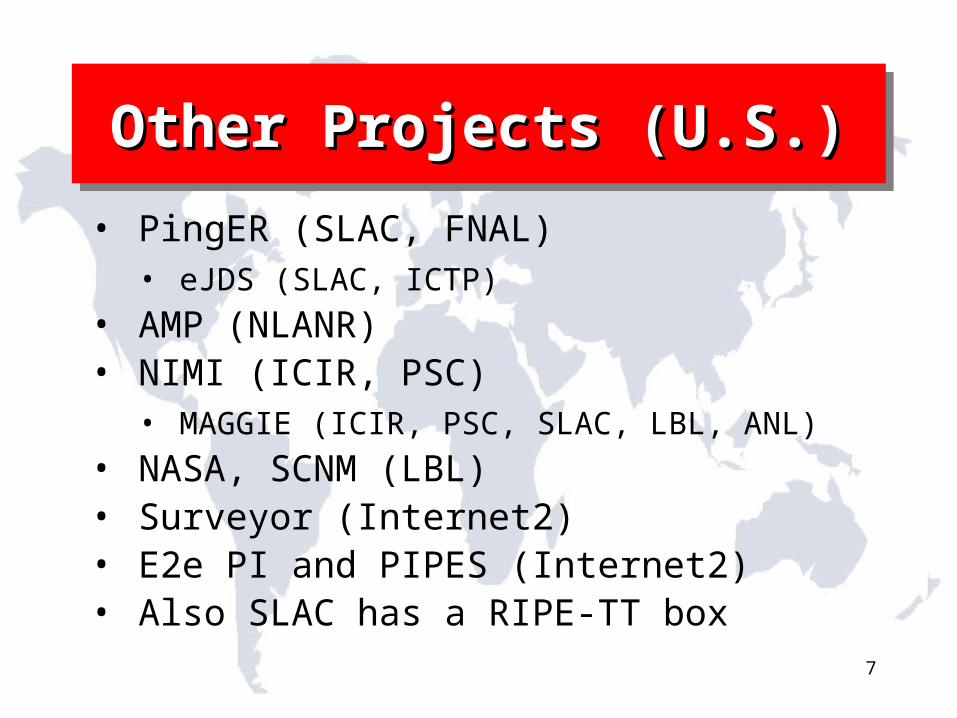
Other Projects (U.S.)Other Projects (U.S.)Other Projects (U.S.)Other Projects (U.S.)
• PingER (SLAC, FNAL)• eJDS (SLAC, ICTP)
• AMP (NLANR)• NIMI (ICIR, PSC)
• MAGGIE (ICIR, PSC, SLAC, LBL, ANL)• NASA, SCNM (LBL)• Surveyor (Internet2)• E2e PI and PIPES (Internet2)• Also SLAC has a RIPE-TT box
8
PublishingPublishingPublishingPublishing
• Web Service
—SOAP::Lite perl module
—Python
—Java
• NMWG
• OGSA
9
PublishingPublishingPublishingPublishing
• NMWG Properties document
• Path.delay.roundtrip (Demo)
• Hop.bandwidth.capacity (tracespeed)
• Guthrie (demo)
• Almost 1000 nodes in database
• PingER Networks
• Arena
10
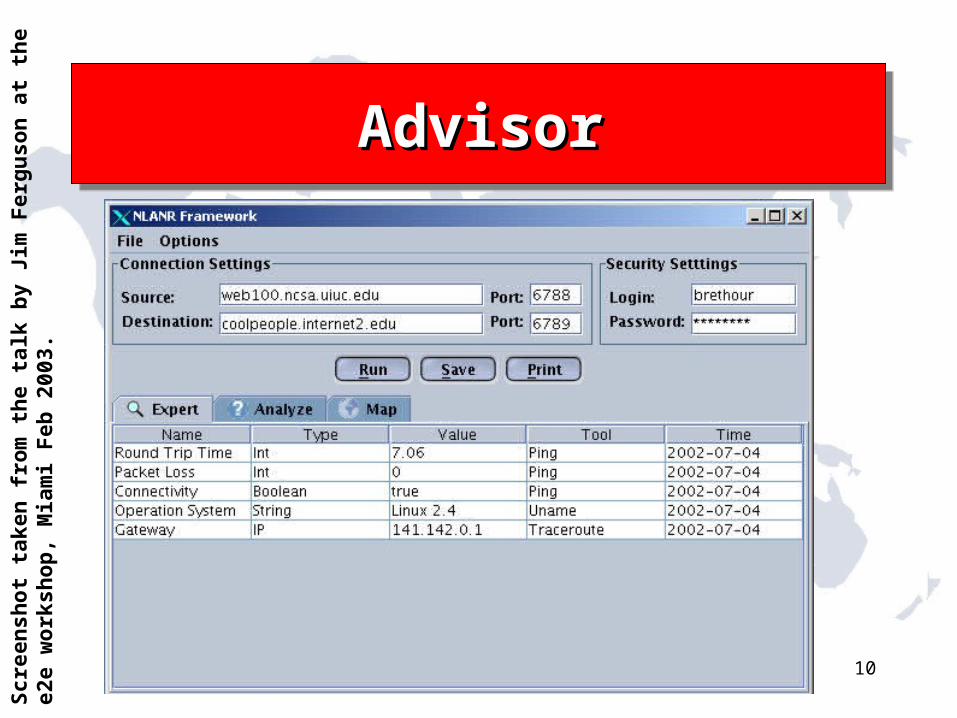
AdvisorAdvisorAdvisorAdvisor
Scr
een
shot
tak
en f
rom
th
e ta
lk b
y Ji
m F
ergu
son
at
the
e2e
wor
ksh
op, M
iam
i F
eb 2
003.
11
MonaLisaMonaLisaMonaLisaMonaLisa
• Front-end visualization
• Vital component for development of the LHC Computing Model
• JINI/JAVA and WSDL/SOAP
• demo
12
TroubleshootingTroubleshootingTroubleshootingTroubleshooting
• RIPE-TT Testbox Alarm
• AMP Automatic Event Detection
• Our approach is diurnal changes
13
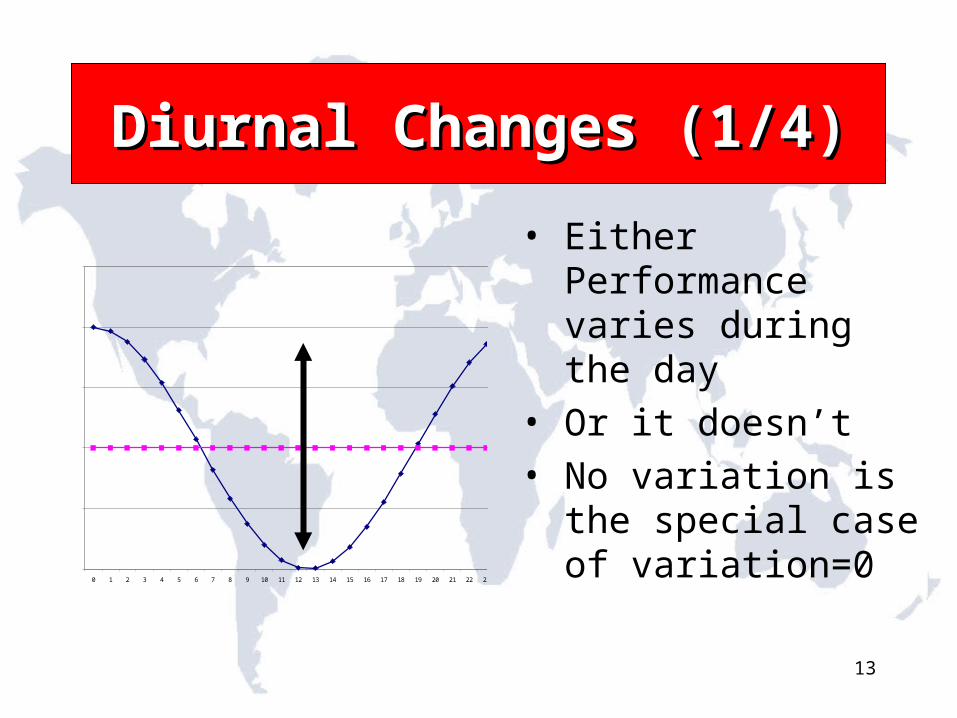
Diurnal Changes (1/4)Diurnal Changes (1/4)
• Either Performance varies during the day
• Or it doesn’t• No variation is
the special case of variation=0
0
0.5
1
1.5
2
2.5
0 1 2 3 4 5 6 7 8 9 10 11 12 13 14 15 16 17 18 19 20 21 22 23
14
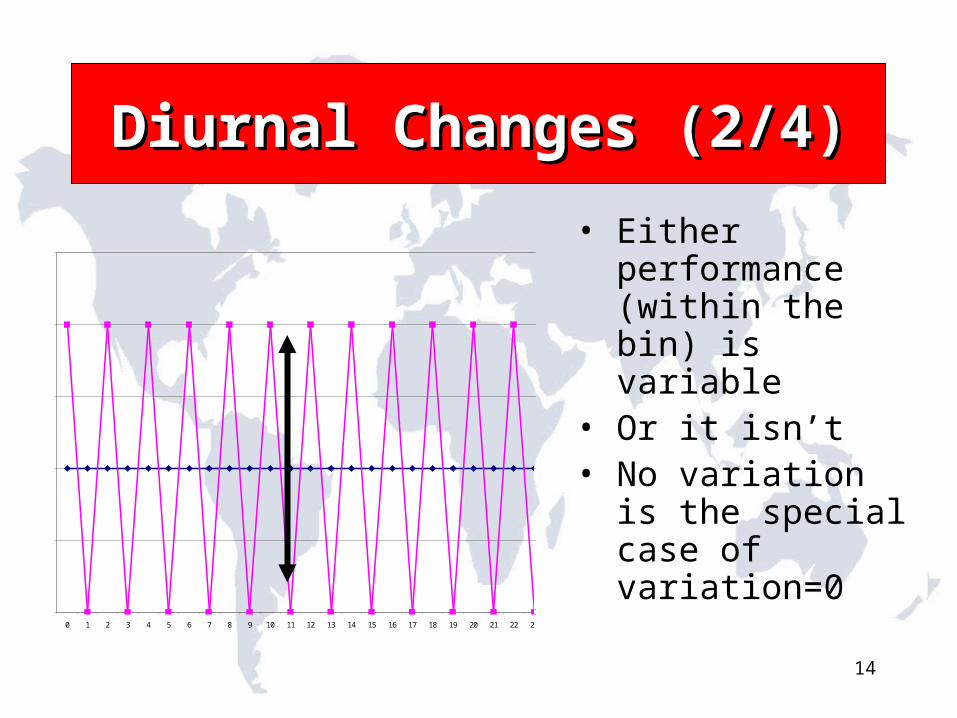
Diurnal Changes (2/4)Diurnal Changes (2/4)
• Either performance (within the bin) is variable
• Or it isn’t• No variation is
the special case of variation=0
0
0.5
1
1.5
2
2.5
0 1 2 3 4 5 6 7 8 9 10 11 12 13 14 15 16 17 18 19 20 21 22 23
15
Diurnal Changes (3/4)Diurnal Changes (3/4)
• Parameterize performance in terms of hour and variability within that hourly bin
• Measurements can be classified in terms of how they differ from historical value
• Recent problems are flagged due to difference from historical value
• Compare to measurement in previous bin to reduce false-positives
16
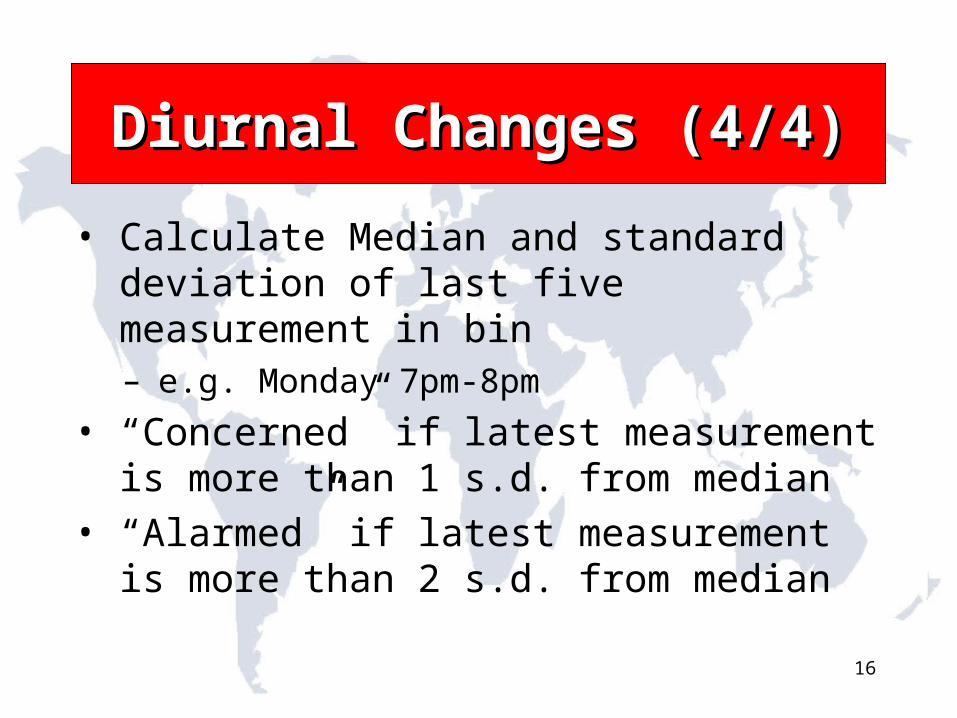
Diurnal Changes (4/4)Diurnal Changes (4/4)
• Calculate Median and standard deviation of last five measurement in bin– e.g. Monday 7pm-8pm
• “Concerned” if latest measurement is more than 1 s.d. from median
• “Alarmed” if latest measurement is more than 2 s.d. from median
17
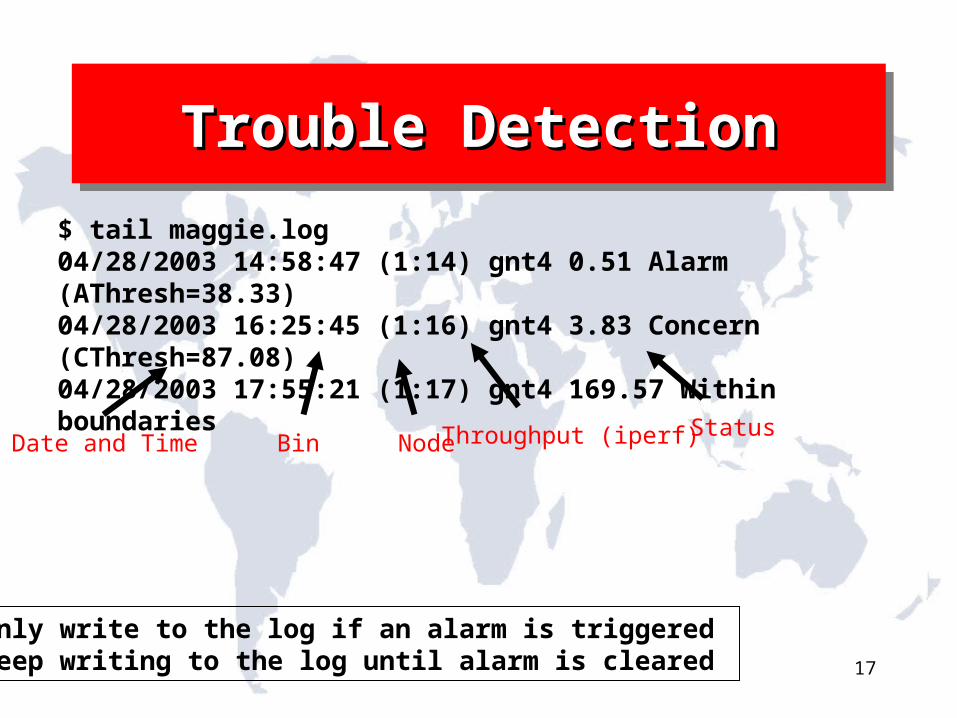
Trouble DetectionTrouble DetectionTrouble DetectionTrouble Detection
$ tail maggie.log04/28/2003 14:58:47 (1:14) gnt4 0.51 Alarm (AThresh=38.33)04/28/2003 16:25:45 (1:16) gnt4 3.83 Concern (CThresh=87.08)04/28/2003 17:55:21 (1:17) gnt4 169.57 Within boundaries
Date and Time Bin Node Throughput (iperf) Status
Only write to the log if an alarm is triggeredKeep writing to the log until alarm is cleared
18
Trouble StatusTrouble StatusTrouble StatusTrouble Status
• Tempted to make color-coded web page
• All the hard work still left to do
• Use knowledge to see common point of
failure
• Production table would be >> 36x700
• Instead figure out where to flag
19
Net RatNet RatNet RatNet Rat
• Alarm System– Multiple tools– Multiple measurement points
• Cross reference– Trigger further measurements– Starting point for human intervention– Informant database
• hop.performance• No measurement is ‘authoritative’
– Cannot even believe a measurement
20
LimitationsLimitationsLimitationsLimitations
• Could be over an hour before alarm is generated
• More frequent measurements impact the network and measurements overlap
• Low impact tools allow finer grained measurement
21
Where next ?Where next ?Where next ?Where next ?
• GLUE, OGSA, CIM
• Work with Other Projects
• Publishing and troubleshooting
• Discovery
• Security
22
Toward a Monitoring Toward a Monitoring
InfrastructureInfrastructure
Toward a Monitoring Toward a Monitoring
InfrastructureInfrastructure• Certainly the need
– DOE Science Community– Japanese Earth Simulator– Grid– Troubleshooting / E2Epi
• Many of the ingredients– Many monitoring projects– PIPES– MAGGIE
23
SummarySummary
“It is widely believed that a ubiquitous monitoring
infrastructure is required”.
24
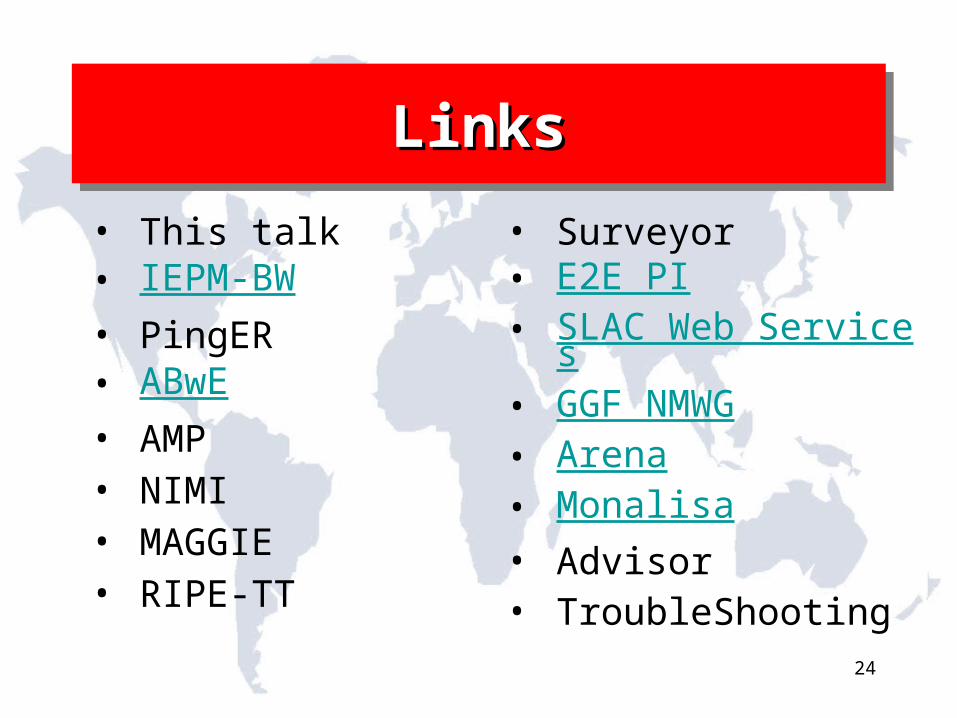
LinksLinksLinksLinks
• This talk• IEPM-BW• PingER• ABwE• AMP• NIMI• MAGGIE• RIPE-TT
• Surveyor• E2E PI• SLAC Web Services• GGF NMWG• Arena• Monalisa• Advisor• TroubleShooting

25
CreditsCreditsCreditsCredits• Les Cottrell• Connie Logg, Jerrod Williams• Jiri Navratil• Fabrizio Coccetti• Brian Tierney• Frank Nagy, Maxim Grigoriev• Eric Boyd, Jeff Boote• Vern Paxson, Andy Adams• Iosif Legrand• Jim Ferguson, Steve Englehart• Local admins and other volunteers• DoE/MICS
26
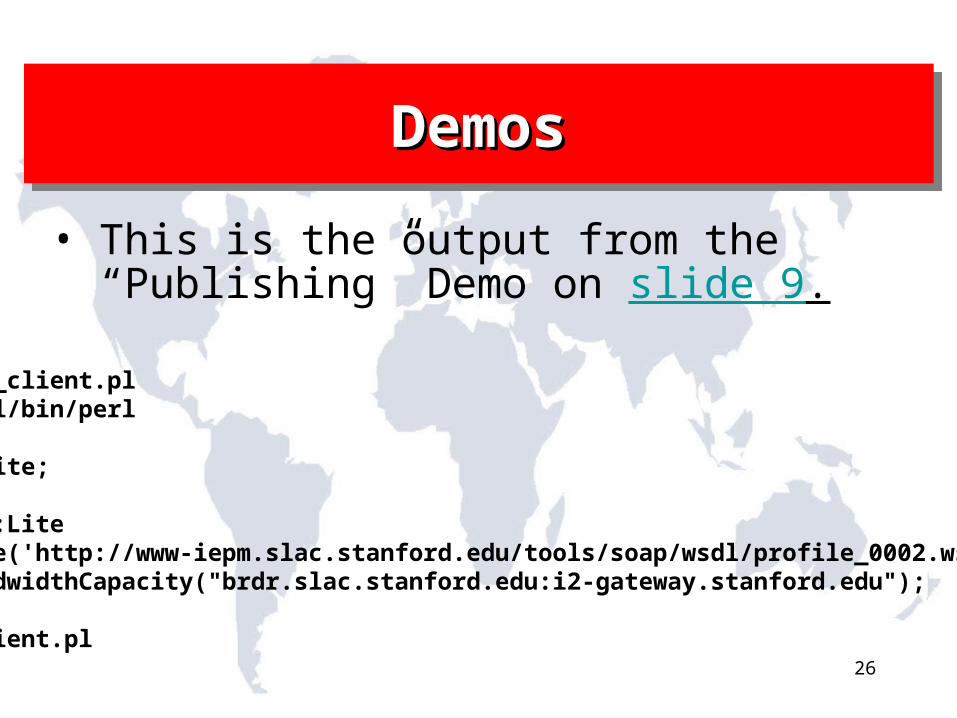
DemosDemosDemosDemos
• This is the output from the “Publishing” Demo on slide 9.
$ more soap_client.pl #!/usr/local/bin/perl
use SOAP::Lite;
print SOAP::Lite -> service('http://www-iepm.slac.stanford.edu/tools/soap/wsdl/profile_0002.wsdl') -> hopBandwidthCapacity("brdr.slac.stanford.edu:i2-gateway.stanford.edu");
$ ./soap_client.pl1000Mb
27
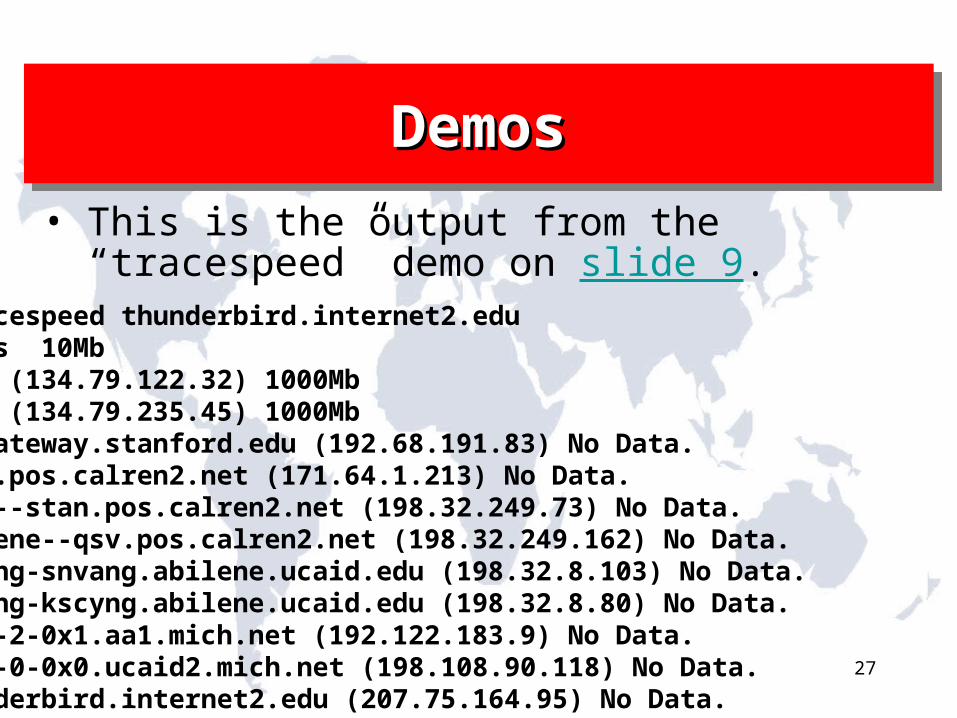
DemosDemosDemosDemos
• This is the output from the “tracespeed” demo on slide 9.
$ ./tracespeed thunderbird.internet2.edu 0 doris 10Mb 1 core (134.79.122.32) 1000Mb 2 brdr (134.79.235.45) 1000Mb 3 i2-gateway.stanford.edu (192.68.191.83) No Data. 4 stan.pos.calren2.net (171.64.1.213) No Data. 5 sunv--stan.pos.calren2.net (198.32.249.73) No Data. 6 abilene--qsv.pos.calren2.net (198.32.249.162) No Data. 7 kscyng-snvang.abilene.ucaid.edu (198.32.8.103) No Data. 8 iplsng-kscyng.abilene.ucaid.edu (198.32.8.80) No Data. 9 so-0-2-0x1.aa1.mich.net (192.122.183.9) No Data.10 so-0-0-0x0.ucaid2.mich.net (198.108.90.118) No Data.11 thunderbird.internet2.edu (207.75.164.95) No Data.
28
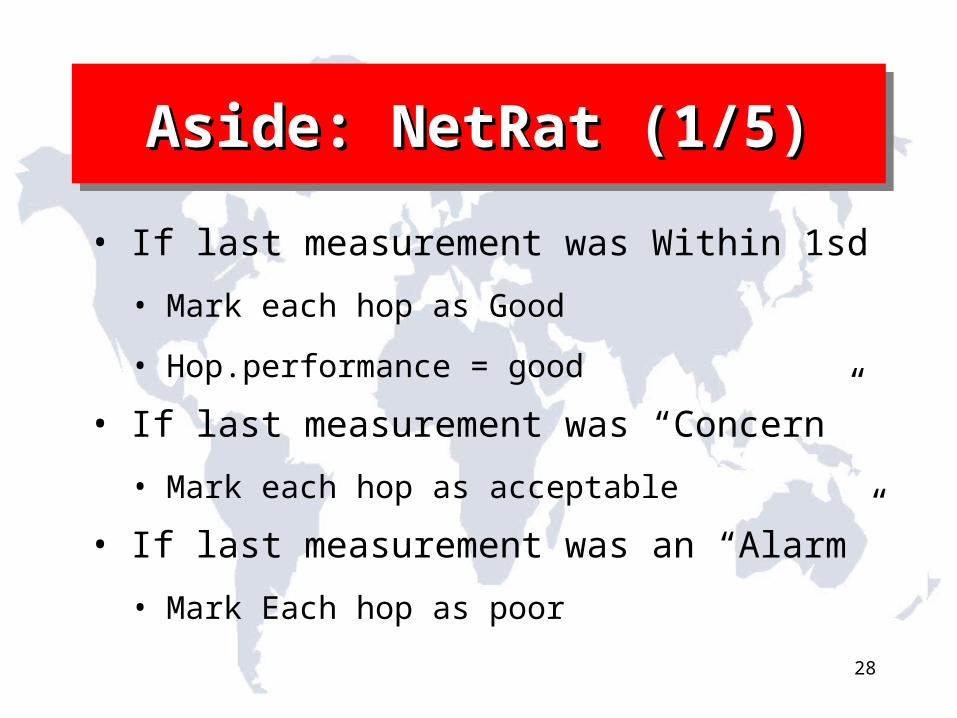
Aside: NetRat (1/5)Aside: NetRat (1/5)Aside: NetRat (1/5)Aside: NetRat (1/5)
• If last measurement was Within 1sd
• Mark each hop as Good
• Hop.performance = good
• If last measurement was “Concern”
• Mark each hop as acceptable
• If last measurement was an “Alarm”
• Mark Each hop as poor
29
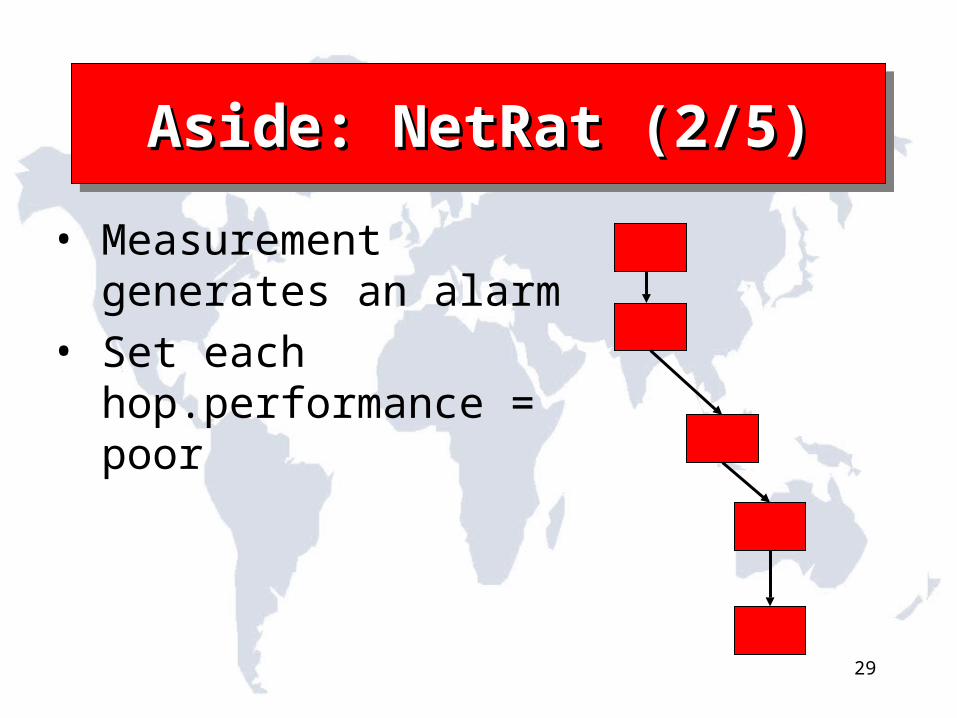
Aside: NetRat (2/5)Aside: NetRat (2/5)Aside: NetRat (2/5)Aside: NetRat (2/5)
• Measurement generates an alarm
• Set each hop.performance = poor
30
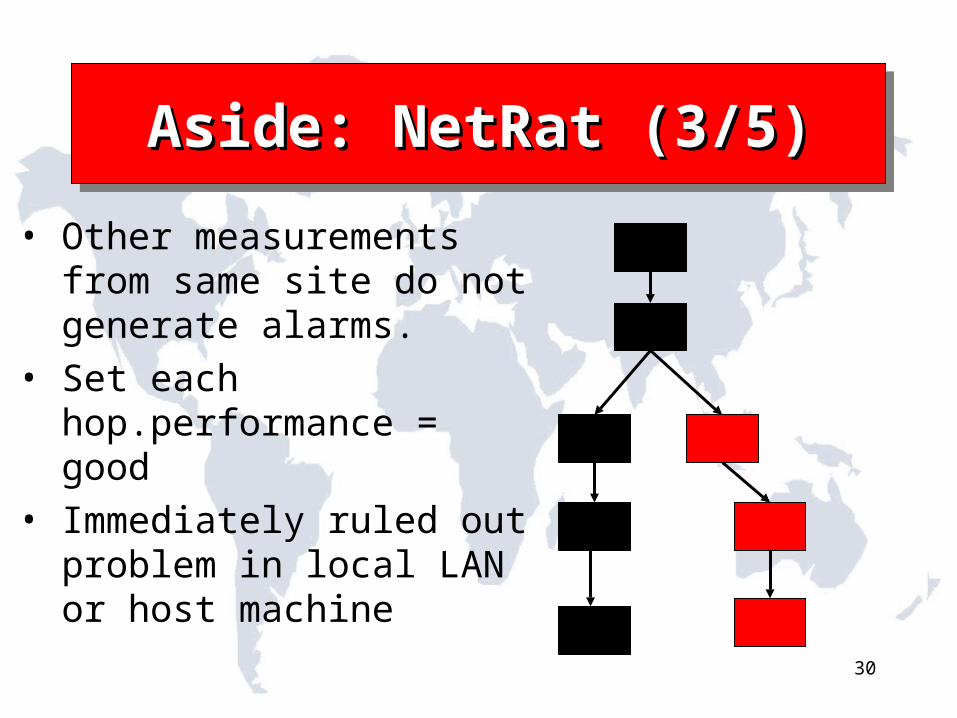
Aside: NetRat (3/5)Aside: NetRat (3/5)Aside: NetRat (3/5)Aside: NetRat (3/5)
• Other measurements from same site do not generate alarms.
• Set each hop.performance = good
• Immediately ruled out problem in local LAN or host machine
31
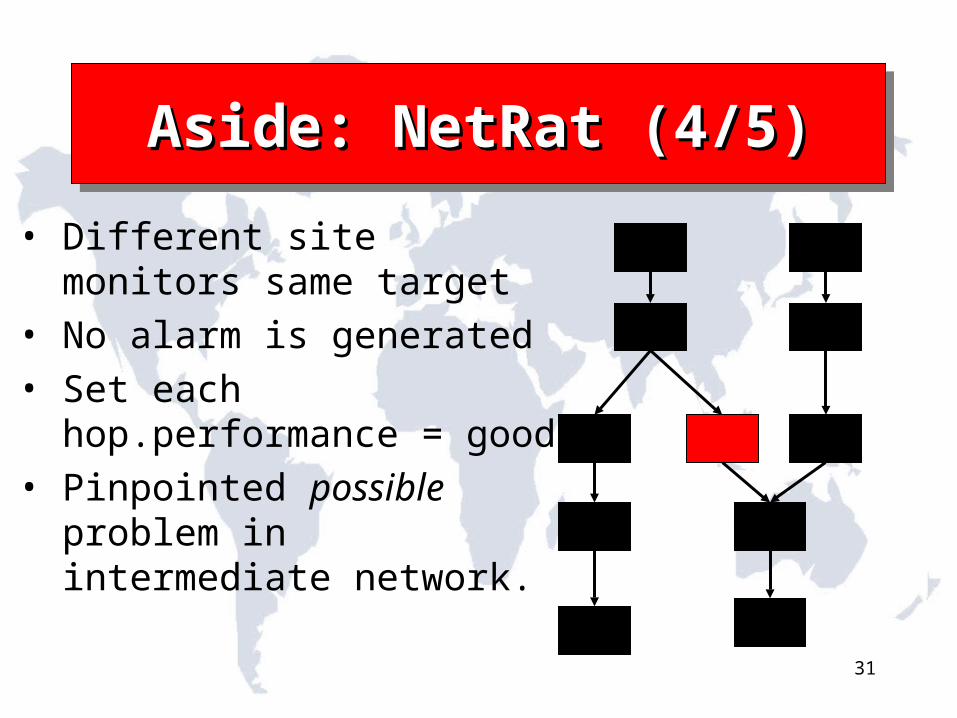
Aside: NetRat (4/5)Aside: NetRat (4/5)Aside: NetRat (4/5)Aside: NetRat (4/5)
• Different site monitors same target
• No alarm is generated• Set each
hop.performance = good• Pinpointed possible
problem in intermediate network.