Embed Size (px)
Citation preview

Technological Bias and Unemployment:
A Macroeconomic Perspective
Henri R. Sneessens 1
June 1998
Revised August 1999
1IRES, Universit�e Catholique de Louvain, and Facult�e Libre des Sciences Economiques de Lille.
Paper prepared for the XIth S�eminaire franco-am�ericain CREST-NBER on \Information and Com-
munication Technologies, Employment and Earnings", organized by the CSERC at the Universit�e de
Nice-Sophia Antipolis, 22-23 June 1998. I am grateful to Michel Lubrano and an anonymous referee
for useful comments on an earlier version. This research is part of a research programme supported
by the Belgian government (Poles d'attraction inter-universitaires PAI No P4/01). Financial support
from the Direction de la Pr�evision, Minist�ere de l'Economie et des Finances, Paris, is also gratefully
acknowledged.

Abstract
This paper focuses on the macroeconomic impact of introducing new technologies (among
which information technologies) when the latter stimulate the relative demand for high-
skilled labour. The fact that there is biased technical progress (or at least, that growth has
asymmetric e�ects) is little disputed. Evaluating its e�ect on unemployment still remains a
di�cult task. This paper stresses the need to rely on a genuine structural analysis. To clarify
some of these issues, we develop a simple analytical framework with two types of labour (high-
and low-skilled). This framework is used to distinguish macroeconomic vs structural shocks,
and to illustrate the interactions between macroeconomic and structural phenomena as well
as their implications for the interpretation of simple mismatch indicators. The framework
is next used as a reference setup wherein to evaluate and compare the empirical modelling
approaches used by di�erent authors and the results they obtain.

1 Introduction
This paper focuses on the macroeconomic impact of the introduction of new technologies
(among which information technologies) when the latter stimulate the relative demand for
high-skilled labour. To what extent the deterioration of the position of low-skilled workers
(either in terms of employment perspectives or of real wages) should be seen as a consequence
of such biased technological change? What are, in such a scenario, the consequences of
relative wage rigidities, especially in Europe? Can such a phenomenon have contributed
to the persistence of high aggregate unemployment rates? These are the main questions
addressed in this paper. Our objective is obviously not to propose a de�nite and complete
answer, but rather to try and explain the di�culties met in examining these questions, and
by so doing to put available empirical results (sometimes contradictory) in better perspective.
The contrast between the US and the EU countries in terms of social insurance coverage, wage
dispersion and unemployment rate changes over the last twenty years suggests that the poor
employment performance of European economies may at least in part result from too little
adjustment to structural changes. In part, but how much? Many studies downplay the role of
structural factors. They stress the fact that both high- and low-skilled unemployment rates
have increased, especially over the last ten years, while relative unemployment rates (high-
and low-skilled rates compared to the aggregate rate) have decreased. The interpretation
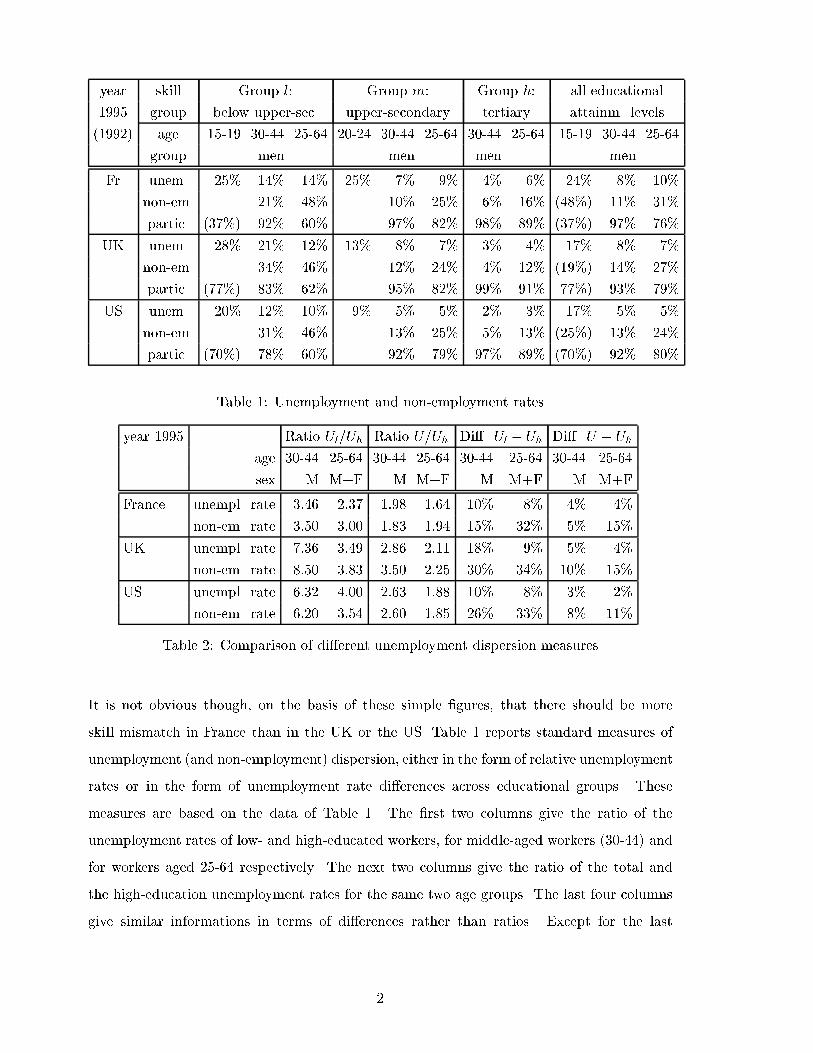
of raw data is far from easy though. As an example, Table 1 reports the 1995 values of
the unemployment and non-employment rates across age and education groups for three
countries: France, the United Kingdom and the United-States. Implicit participation rates
are also indicated. A few clear conclusions can be drawn from this table. In all three countries,
unemployment is decreasing with education, and middle-aged workers (30-44), especially the
low-educated ones, appear better protected against unemployment (this is even more striking
in terms of non-employment rates). The unemployment rate is larger in France than in the
UK, and larger in the UK than in the US (UFr > UUK > UUS), and this holds true for all
education groups for workers aged 25-64. Workers aged 15-19 seem particularly vulnerable
in France. The unemployment rate for low-educated young workers is 25%, a value similar to
that of the other two countries; the non-employment rate however is likely to be much larger,
if we compare the participation rates of male workers aged 15-24 (given between parentheses)
in the three countries.
1
year skill Group l: Group m: Group h: all educational
1995 group below upper-sec. upper-secondary tertiary attainm. levels
(1992) age 15-19 30-44 25-64 20-24 30-44 25-64 30-44 25-64 15-19 30-44 25-64
group men men men men
Fr unem. 25% 14% 14% 25% 7% 9% 4% 6% 24% 8% 10%
non-em. 21% 48% 10% 25% 6% 16% (48%) 11% 31%
partic. (37%) 92% 60% 97% 82% 98% 89% (37%) 97% 76%
UK unem. 28% 21% 12% 13% 8% 7% 3% 4% 17% 8% 7%
non-em. 34% 46% 12% 24% 4% 12% (19%) 14% 27%
partic. (77%) 83% 62% 95% 82% 99% 91% 77%) 93% 79%
US unem. 20% 12% 10% 9% 5% 5% 2% 3% 17% 5% 5%
non-em. 31% 46% 13% 25% 5% 13% (25%) 13% 24%
partic. (70%) 78% 60% 92% 79% 97% 89% (70%) 92% 80%
Table 1: Unemployment and non-employment rates
year 1995 Ratio Ul=Uh Ratio U=Uh Di�. Ul � Uh Di�. U � Uh
age 30-44 25-64 30-44 25-64 30-44 25-64 30-44 25-64
sex M M+F M M+F M M+F M M+F
France unempl. rate 3:46 2:37 1:98 1:64 10% 8% 4% 4%
non-em. rate 3:50 3:00 1:83 1:94 15% 32% 5% 15%
UK unempl. rate 7:36 3:49 2:86 2:11 18% 9% 5% 4%
non-em. rate 8:50 3:83 3:50 2:25 30% 34% 10% 15%
US unempl. rate 6:32 4:00 2:63 1:88 10% 8% 3% 2%
non-em. rate 6:20 3:54 2:60 1:85 26% 33% 8% 11%
Table 2: Comparison of di�erent unemployment dispersion measures
It is not obvious though, on the basis of these simple �gures, that there should be more
skill mismatch in France than in the UK or the US. Table 1 reports standard measures of
unemployment (and non-employment) dispersion, either in the form of relative unemployment
rates or in the form of unemployment rate di�erences across educational groups. These
measures are based on the data of Table 1. The �rst two columns give the ratio of the
unemployment rates of low- and high-educated workers, for middle-aged workers (30-44) and
for workers aged 25-64 respectively. The next two columns give the ratio of the total and
the high-education unemployment rates for the same two age groups. The last four columns
give similar informations in terms of di�erences rather than ratios. Except for the last
2

age group 15-24 25-54 55-64 65 and over total
year 1972 1992 1972 1992 1972 1992 1972 1992 1972 1992
France 58% 37% 97% 95% 73% 44% 18% 4% 87% 75%
UK 78% 77% 96% 94% 88% 66% 18% 9% 94% 85%
US 73% 70% 94% 93% 79% 67% 23% 16% 89% 88%
Table 3: Male participation rates. Source: R.Barrell et al., 1995, NIESR
column, all measures of dispersion give almost always the same ranking, whether in terms of
unemployment or of non-employment. The UK comes �rst with the highest unemployment
dispersion indicator, the US comes next; France has almost always the lowest coe�cient. If
one looks at the last column however, France and the UK seem to share very similar fates,
with dispersion indicators substantially larger than in the US.
This exercice suggests at the very least that one should be very careful and avoid inferring
too much from raw data and simple statistics. The danger of relying too much on simple
unemployment dispersion indicators is illustrated in Figure 1. The �gure shows the corre-
lation across OECD countries between the aggregate unemployment rate and a measure of
unemployment dispersion. In the left panel,dispersion is measured as the ratio of the low-
and the high-skill unemployment rates; in the right panel, it is measured by unemployment
rate di�erences. The correlation is nil in the �rst case, positive in the second.
P
Os
Fi
UKUSDe
Ne
ItSw
Fr
Be
Dk
Ei
Es
0%
2%
4%
6%
8%
10%
12%
14%
0% 2% 4% 6% 8% 10% 12% 14% 16%
aggregate U
Ul - Uh
Es
Ei
Dk
Be
FrSw
It
Ne DeUS
UK
Fi
Os
P
0
1
2
3
4
5
6
0% 2% 4% 6% 8% 10% 12% 14% 16%
aggregate U
Ul / Uh
Figure 1: Relationship between unemployment rate level and dispersion
(dispersion measured by ratios -left- or di�erences -right-)
3

A conclusion about the role and importance of biased technical change and skill mismatch
can obviously not be reached by such simple correlation exercises. Furthemore, comparisons
as those made in Tables 1 and 1 may give di�erent results for di�erent years or di�erent types
of disaggregation. They fail to take into account trends observed over the recent past, both
in terms of unemployment rates and participation rates. Table 3 illustrates how much partic-
ipation rates may have changed from 1972 to 1992 for di�erent age groups. There are striking
cross-country di�erences, which surely should be accounted for and explained if one wants to
understand cross-country similarities and di�erences. There is, at the OECD level, a clear
negative correlation between unemployment and participation rates for youngsters aged 15-24
(see OECD, 1996, �gure 3.6). A full understanding of the structural component of today's
unemployment problem calls for a better understanding of all these aspects simultaneously.
The di�culties met in evaluating the macroeconomic impact of a biased technological change
are at least in part due to the many dimensions of the problem (skills, age, sex, sectors)
and the many interactions between them, the nature of which is in uenced by labour market
(implicit or explicit) institutions and rules. Macroeconomic and structural phenomena are
strongly interrelated. Evaluating the macroeconomic consequences of asymmetric shocks
like a biased technical progress cannot be done without a correct understanding of these
interactions. A correct appraisal of the macroeconomic consequences of a biased technological
change therefore goes through an adequate (i.e., realistic and workable) representation of these
phenomena.
This paper's objective is to clarify some methodological issues and provide a key to interprete
and compare results obtained by di�erent researchers starting from di�erent speci�cations and
data sets. To this end, we �rst propose a simple and in many ways quite standard analytical
framework (section 2). In section 3, this framework is used to distinguish macroeconomic vs
structural shocks, and to illustrate the interactions between macroeconomic and structural
phenomena as well as their implications for the interpretation of simple dispersion indicators
like those mentioned above. We also discuss the limits of such a simple representation of
the economy and suggest some extensions. Section 4 is then devoted to a discussion and
comparison of a few empirical evaluations of the contribution of biased technological change
to aggregate unemployment. Section 5 concludes.
4

2 Analytical Framework
We use a model of equilibrium unemployment extended to include structural features. The
usual NAIRU model is extended to include two types of labour (low- and high-skilled labour)
and the corresponding labour markets 1. In line with the equilibrium unemployment litera-
ture, we focus on the price and wage formation behaviours and do not model explicitly the
demand side of the economy.
There are various ways to introduce asymmetric e�ects of growth on the welfare (income
or employment opportunities) of low- vs high-skilled workers. Capital accumulation as such
may have asymmetric e�ects when the capital-labour substitution elasticities are di�erent for
the two groups of workers (see Krusell et al., 1997, e.g.). Globalization and changes in the
structure of the economy provide another explanation. We focus here on a third possibility,
biased technical progress 2.
Firm's Behaviour
Let us consider a setup with one type of goods (one sector) and monopolistically competitive
�rms. All �rms have access to the same production technologies using three types of input:
low- and high-skilled labour plus capital. For convenience, we assume a constant elasticity of
� substitution between low- and high-skilled employment (denoted Nl and Nh respectively)
and neglect the capital stock. This simpli�cation avoids technicalities and complications not
essential for our purpose, which is to clarify a few key concepts and issues 3.
The �rm's optimal price (output) and technology choices can then be summarized in the
following two relationships:
(Xi
(�i)��e� itwi
�(1��))1=(1��)
= a0 ; i � (l; h): (1)
1This section is based on the �rst section of Sneessens (1994).2These three \explanations" may of course be strongly interrelated, for example when there is embodied
technical progress which facilitates communication and globalization.3Neglecting the capital stock implicitly amounts to assuming that the two types of labour have the same
elasticity of substitution with respect to capital, which may not be the case. High-skilled labour is usually
considered to be less substitutable to capital. In such a case, higher real interest rates -as observed in Europe
over the last ten or �fteen years- have a favourable e�ect on low-skilled employment opportunities, ceteris
paribus.
5

logNl � logNh = � (1� �) ( l � h) t� � (logwl � logwh) ; (2)
where wl and wh stand for the real wage cost of low- and high-skilled labour respectively,
coe�cients l and h represent asymmetric exogenous rates of technical progress, and a0
re ects the e�ect of capital accumulation and unbiased technical progress at given markup
rate 4. Equation (1) is the factor price frontier determined by cost minimization and price
behaviour; equation (2) determines the optimal low-to-high skilled labour ratio.
Wage Formation
To represent the wage formation process, we rely on a standard monopoly-union-right-to-
manage argument and use the following two simple relationships:
logwl = �0 + �l t � �l log ul ; (3)
logwh = �0 + �h t � �h log uh ; (4)
where the �'s measure the trend in wage demands generated by technical progress.
Equilibrium Unemployment
Equations (1) to (4) can be solved for the two equilibrium unemployment rates.
We proceed in two steps. We �rst combine the factor price frontier (1) and the wage equations
(3)-(4) to obtain the so-called equilibrium unemployment frontier (see Layard et al., 1991,
p308). Log-linearization yields 5:
��l log ul + (1� �)�h log uh
= �0 + ��0 + (1� �) �0
+ � (�l � l) t + (1� �) (�h � h) t
(5)
where �0 � � log a0. This equilibrium condition describes a negative relationship between
the two unemployment rates. This relationship should be understood as follows. Ceteris
4More precisely, we write the production function as: Y = �n�l�e ltNl
���
+ �h�e htNh
���o��=�
,
where � � 1 and �l + �h = 1. The substitution elasticity is equal to � = 1=(1 + �). With this speci�cation,
it can be shown that a0 �� �1+�
��Y
�(1��)=�, where � is the markup rate.
5Parameter � is de�ned as: � ����l (e
� ltwl)1��
=nP
j��j (e
� jtwj)1��
o.
6

paribus, if one of the two types of labour experiences a lower unemployment rate and exerts
pressure to receive a larger real wage, the other's wage must necessarily decrease (one moves
along a given factor price frontier), which can be obtained only through an increase in the
corresponding unemployment rate.
A second relationship between the two equilibrium unemployment rates is obtained by re-
casting the technological equation (2) in terms of unemployment rates. We �rst use the
approximation logNi � logLi = log(1 � ui) � �ui where Li stands for the labour force
of type i, and next use equations (3) and (4) to eliminate the wage rates. We obtain the
following equilibrium technological constraint:
[ul � uh] + � [�l log ul � �h log uh]
= f0 + � f (�0 � �0) + (�l � �h) t g
+ [ (�l � �h) + (1� �) ( l � h) ] t :
(6)
Parameter �i stands for the growth rate of the labour force of type i; the value of the scale
parameter f0 depends on the aggregate labour force's initial composition. This equilibrium
condition describes a positive relationship between the two unemployment rates. This rela-
tionship follows from the �rms' optimal technology choices and can be understood as follows.
If one of the two unemployment rates increases, the corresponding relative wage will decrease,
which induces the �rm to change technology and reduce its relative demand for the other
type of labour, whose unemployment rate also increases as a result.
The equilibrium unemployment frontier (5) and the equilibrium technological constraint (6)
determine together the equilibrium low- and high-skilled unemployment rates. This is illus-
trated in the left panel of Figure 2, in the ul � uh space. The downward-sloping relationship
corresponds to equation (5), the upward-sloping one to equation (6) . The equilibrium combi-
nation of unemployment rates is determined by their intersection. Technology, price and wage
shocks may shift these curves up or down, thereby changing the equilibrium unemployment
rate values.
3 Macroeconomic vs Structural Shocks
The analytical framework developed in the previous section allows one to distinguish two
types of shocks. We shall call macroeconomic shocks all the shocks that have identical direct
7

0%
2%
4%
6%
8%
10%
0% 1% 2% 3% 4% 5%
Uh
Ul
0%
2%
4%
6%
8%
10%
0% 1% 2% 3% 4% 5%
Uh
Ul
Figure 2: Determination of equilibrium unemployment rates (left)
and e�ect of a macroeconomic shock (right)
impacts on the two labour markets 6; we call structural shocks all the shocks that have
di�erent direct impacts. We discuss and illustrate the consequences of each type of shock in
turn, next derive implications about the use of so-called mismatch indicators. We close the
section with a few quali�cations.
Macroeconomic Shocks
The macroeconomic shocks include all the shocks that a�ect the price equation (changes in a0
re ecting global productivity shocks, e.g.), plus all the shocks that a�ect symmetrically the
two wage equations (i.e., wage shocks such that ��0 = ��0, or ��l = ��h), the two labour
demands (technological shocks satisfying � l = � h), or the two labour supplies (labour
force changes such that ��l = ��h). By de�nition, a macroeconomic shock will thus shift
the downward-sloping equilibrium unemployment frontier but leave unchanged the upward-
sloping equilibrium technological constraint (see right panel of Figure 2). A macroeconomic
shock thus necessarily changes the two unemployment rates (low- and high-skilled) in the same
direction, although the magnitude of the change may di�er from one market to the next. In
other words, symmetric shocks can have asymmetric e�ects. A macroeconomic shock may
thus change the dispersion of unemployment and wage rates. The outcome depends on the
6It is worth stressing that there is no room for macroeconomic demand shocks in this model.
8

slope and position of the technological constraint schedule.
To illustrate the consequences of a macroeconomic shock, let us consider the case of a global
productivity slowdown (�a0 < 0). We start with the particular case where low- and high-
skilled wage rates are equally sensitive to their own unemployment rate (i.e., �l = �h = �).
This particular case is unlikely to be most realistic for countries with o�cial or de facto
minimum wage rules, but it may serve as a useful starting point. Using this assumption and
simplifying the notation yields the following expressions for the equilibrium unemployment
frontier and the equilibrium technological constraint respectively:
� log ul + (1� �) log uh = m0 ; (7)
[ul � uh] + � � [log ul � log uh] = s0 ; (8)
where m0 and s0 summarize all the terms on the right-hand side of the original equations. A
productivity slowdown corresponds to an increase in m0 at �xed s0, as illustrated in the right
panel of Figure 2. Such a shock increases both unemployment rates. It can easily be checked
by di�erentiating the second equation that the productivity slowdown will have asymmetric
e�ects when the high- and low-skilled unemployment rates have di�erent initial values. More
precisely, an increase in m0 implies �ul � �uh when the initial unemployment rate values
satisfy ul � uh, i.e., the macroeconomic shock exacerbates the initial di�erences between the
two unemployment rates. The same equation also implies that the ratio of the low- and high-
skilled unemployment rates decreases and comes closer to one (this is also apparent in the
right panel of Figure 2), which implies a lower variance of the relative unemployment rates 7.
This decrease is larger the larger the initial discrepancy between the two unemployment rates.
We brie y consider the other extreme case, where the two wage rates have totally di�erent
sensitivities to their own unemployment rate. Let us assume for instance that low-skilled
wages are totally insensitive to unemployment (�h > �l = 0). It can then easily be checked
that a productivity slowdown increases the di�erence between the two unemployment rates,
but may increase or decrease their relative value and the variance of relative unemployment
rates.
This example illustrates how a macroeconomic shock can have structural e�ects, i.e., change
7The variance of the relative unemployment rates is proportional to (ul � uh)=u, where the aggregate
unemployment rate u is given by u = �ul + (1� �)uh.
9

the di�erence and/or the ratio between the two unemployment rates. Whether the dispersion
of unemployment rates (either in levels or in relative terms) is increased or decreased crucially
depends on initial conditions and on wage rigidities (sensitivity to own unemployment rate) 8.
Structural Shocks
Structural shocks include all types of asymmetric shocks: asymmetric shocks on wages, tech-
nical progress and labour force. At variance with a macroeconomic shock, a structural shock
does shift the equilibrium technological constraint schedule (equ.(6)). Simultaneously, it may
or may not shift the equilibrium unemployment frontier (as the macroeconomic shock does),
depending on the type of structural shock considered. Because they may a�ect both the
unemployment frontier and the technological constraint, structural shocks may have all kinds
of e�ects on the constellation of equilibrium unemployment rates. By way of example, we
brie y discuss three speci�c cases : labour force composition change, asymmetric wage shock,
and biased technological progress.
Labour force composition changes (�f0 6= 0 or ��l 6= ��h) shift only the technological
constraint and thus have an opposite e�ect on the two equilibrium unemployment rates (see
left panel of Figure 3). All other types of structural shocks shift both the unemployment
frontier and the technological constraint.
An exogenous increase in low-skilled wage claims (higher minimum wages e.g., represented
here by ��0 > 0) will shift both curves upwards (ul is measured along the vertical axis) and
may thus increase both the low- and the high-skilled equilibrium unemployment rates (see
right panel of Figure 3).
A biased technological progress unfavourable to low-skilled workers (either l � h when � � 1,
or l � h when � � 1) moves the technological constraint upwards and the unemployment
frontier inwards; ceteris paribus (in particular, at unchanged minimum wage and unchanged
�l and �h), the high-skilled unemployment rate will certainly decrease, the low-skilled and the
aggregate unemployment rates may increase or decrease. This analysis is of course partial
and fails to take into account induced the e�ects that biased technical progress may have
8Allowing di�erent elasticities of substitution between labour and capital for the two types of skill would
introduce yet another channel by which macroeconomic shocks -a change in the capital usage cost e.g.- could
have structural implications.
10

0%
2%
4%
6%
8%
10%
0% 1% 2% 3% 4% 5%
Uh
Ul
0%
2%
4%
6%
8%
10%
0% 1% 2% 3% 4% 5%
Uh
Ul
Figure 3: E�ect of changes in labour force composition (left) or minimum wage (right)
on wage demand behaviours (represented by coe�cients �l and �h). When such e�ects are
allowed for, biased technological change may well have no e�ect at all on unemployment.
To illustrate this point, let us �rst de�ne exogenous mismatch (EMI) as the net exogenous
relative labour demand change induced by a biased technological progress. This net change
is measured by the last bracketed term on the right-hand side of equation (6), i.e. :
EMI � (�l � �h) + (1� �) ( l � h) : (9)
When EMI = 0, the e�ect of biased technical progress is matched by labour force compo-
sition changes (which we also took as exogenous). A net exogenous relative labour demand
shift (EMI > 0) leaves all unemployment rates unchanged if and only if two \neutrality
conditions" are simultaneously satis�ed. The �rst neutrality condition is that average wage
growth be compatible with average labour productivity growth, that is:
��l + (1� �)�h = � l + (1� �) h : (10)
With this condition satis�ed, the unemployment frontier (5) keeps the same position (the
tradeof between the two unemployment rates remains una�ected). The second neutrality
condition is that the imbalance between skill demands and supplies generated by EMI > 0
be compensated by relative wage changes. From equation (6), it can be seen that the wage
11

growth coe�cients must then satisfy :
�l = �h �EMI
�� �h: (11)
When this second neutrality condition is satis�ed, biased technical progress leaves the position
of the equilibrium technological constraint (6) una�ected. Combining the two conditions
yields:
�l = � l + (1� �) h � (1� �)EMI
�;
�h = � l + (1� �) h + �EMI
�:
In other words, when EMI is di�erent from zero, the stabilization of all unemployment rates
is achieved at the cost of a growing wage dispersion.
An alternative scenario is the one where, although EMI is positive, the high- and low-skilled
wages grow at the same rate, compatible with total exogenous productivity gains, so that
only the �rst neutrality condition (10) remains satis�ed. With �l = �h and EMI > 0, the
technological constraint (6) shifts upwards; the two unemployment rates change and move in
opposite directions. Ceteris paribus, the relative wage of low-skilled workers decreases by an
amount determined by the unemployment rate sensitivity of individual wages (equations (3)
and (4)). Compensating this e�ect by minimum wage increases (��0 > 0) would however
break the �rst neutrality condition as well and shift out the unemployment frontier, which
could eventually yield an increase in both unemployment rates. The fact that we actually
observed a rise in both the low- and the high-skilled unemployment rates should thus not be
interpreted as a proof that biased technological progress has not contributed to the rise and
persistence of aggregate unemployment in EU countries.
Pursuing an objective of stable relative wages in the face of an exogenous, technology-induced
net labour demand shift is thus bound to have macroeconomic e�ects, the size of which
will depend on many parameters of the model (sensitivity of wages to unemployment and
minimum wage rules a.o.), plus other propagation mechanisms that we have so far neglected,
like labour supply behaviours, or the government budget constraint and its impact on labour
taxes and wage costs in a context of growing unemployment.
12

Mismatch Indicators
Can we �nd a simple aggregate indicator that would measure the contribution of structural
shocks to observed aggregate unemployment changes? The answer is (most probably) nega-
tive. This comes from the fact that macroeconomic and structural phenomena are intimately
interrelated phenomena.
Because symmetric shocks can have asymmetric e�ects, mismatch indices cannot give in-
formation on the nature of the shocks. Observed changes in the di�erence or the relative
value of the low- and the high-skilled unemployment rates may a priori be the result of either
macroeconomic or structural shocks. Furthemore, the propagation mechanism started by a
structural shock may well lead to substantial aggregate unemployment changes with little
apparent structural imbalances (at least in terms of unemployment rate dispersion), as in the
case illustrated by the right panel of Figure 3. Hence, unchanged unemployment dispersion
does not mean that there has been no structural shock and no structural problem.
\Mismatch indicators" may of course be designed for more speci�c and less ambitious ob-
jectives. For instance, Layard et al. (1991) use the variance of relative unemployment rates
not to measure the contribution of structural shocks to observed aggregate unemployment
changes, but rather more simply to \assess how the structure of unemployment is related
to its average level (both of course being endogenous)." (Layard et al., 1991, p307; my
emphasis). In the particular case where the elasticity of wage claims to unemployment is
identical for both groups of workers (�l = �h = �), the variance of relative unemployment
rates measures by how much the aggregate unemployment rate could be decreased by mov-
ing along a given unemployment frontier towards the point where all unemployment rates are
equal9. It says of course nothing about the nature of the shocks that produced the observed
unemployment dispersion; it says also nothing about the nature of the shocks that pushed
the unemployment frontier in its current position. A shift of the unemployment frontier and
a movement alongside it may be two sides of the same phenomenon.
9The result is obtained by adding and subtracting the log of aggregate unemployment in the unemployment
frontier equation, under the assumption �l = �h = �. The equilibrium unemployment frontier can then be
written as:
log u = �0
0 �
n� log
�ulu
�+ (1� �) log
�uhu
�o� �
0
0 �1
2var
�uiu
�:
.
13
There exists also (in our framework) a conceptually simple and natural indicator to mea-
sure the importance of biased technological shocks. It is the exogenous mismatch indicator
EMI de�ned in equation (9). This is essentially the mismatch indicator used in Manacorda-
Petrongolo (1996) and Manacorda-Manning (1997). This indicator measures the size of the
shock, not its e�ect on unemployment rates, which depends on induced wage changes (see
above discussion).
Quali�cations and Extensions
Our representation of the way structural phenomena interact with macroeconomic phenomena
remains extremely stylized. Structural phenomena are multidimensional. We focused here
on one particular dimension (skills) because the available empirical evidence suggest that
biased technological progress (or more generally, a biased growth process) may have had
profound implications on the wage and employment opportunities of the various skill groups
in all sectors of the economy. Still, one should keep in mind that, even if biased technological
process were the sole structural shock, the existence of other structural dimensions (sectors,
age, sex) may considerably a�ect the propagation mechanism and the �nal outcome of a
biased technological shock, both at the aggregated and the disaggregated levels. For reasons
related to institutions and bargaining power, some groups are better protected than others
(typically middle-aged workers), and this asymmetry like the others may have macroeconomic
e�ects. De-industrialization may also interact with biased technological change, especially if
there are wage rigidities and if moving from the manufacturing to the service sector implies
relatively larger wage losses for low-skilled workers10.
Another limitation of our simple framework deserves special attention too. We proceeded so
far as if neither macroeconomic nor structural shocks had any induced e�ect on the labour
force composition. There are serious reasons to believe that this is not the case. For instance,
in the face of a biased technological shock unfavourable to low-skilled workers, public and
private reactions can modify the composition of the labour force, either by changing the
participation rates (early retirement programmes, longer compulsory education, discourage-
ment e�ects) or by changing the composition of the population of working age (acquisition
of skills by low-skilled workers). Macroeconomic shocks may also induce (genuine or appar-
10The change in aggregate unemployment is positively correlated to industrial employment losses in OECD
countries over the period 1983-1993. See OECD (1997, p.36).
14

ent) changes in the composition of the labour force, either by the de-skilling of long-term
unemployed workers, or by the so-called \ladder e�ect", when high-skilled workers take the
job of low-skilled ones. Observed changes in the composition of the labour force should thus
be decomposed into population of working age and participation rate changes. This means
replacing in equation (6) the trend coe�cients (�l��h) by (�l��h) � ( l� h)+ (�l��h),
where i and �i stand for trend changes respectively in the population of working age and
in the participation rate of group i � (l; h), which then allows one to examine separately the
determinant of each variable.
Yet another \missing link" is the absence of relationship between the technical progress
parameters and the wage demand parameters. The way workers' claims adjust in reaction
to a (biased or unbiased) technological change is crucial and re ects the characteristics of
the institutional environment as well as the nature of the prevailing \social consensus" about
income distribution and wage inequalities. The e�ect of exogenous productivity growth on
wage claims depends on strategic interactions across sectors or segments of the labour market;
it also depends on the bargaining power of the various groups of workers (skill, age, sex,
sectors) and on e�ciency wage considerations (to determine the share accruing to wages
rather than pro�ts)11.
4 Empirical Models
Simple as it is, the model of the previous section provides useful insights and helps under-
stand why evaluating the contribution of structural factors to the rise and persistence of
unemployment in EU countries may be a di�cult task. It also provides a nice reference setup
to compare the empirical modelling approaches used by di�erent authors and the results they
obtain.
Because simple measures of unemployment dispersion cannot provide reliable measures of
the size of structural shocks, the empirical evaluation of the macroeconomic consequences of
biased technological shocks necessarily goes through a genuine structural analysis. The latter
involves at least two types of information, �rst about changes in net labour demands (the last
bracketed term in equation (6)); second about the determinants of real wages (especially their
trend increase and their sensitivity to unemployment; see equation (5)). Some studies focus
11Ag�enor and Aizenman (1997) provide an interesting analysis of such interactions and their implications.
15

on one of these two issues; others look at both issues simultaneously and draw conclusions
about the factors that may explain unemployment. We brie y review a few of them.
Evidence on Biased Technological Progress
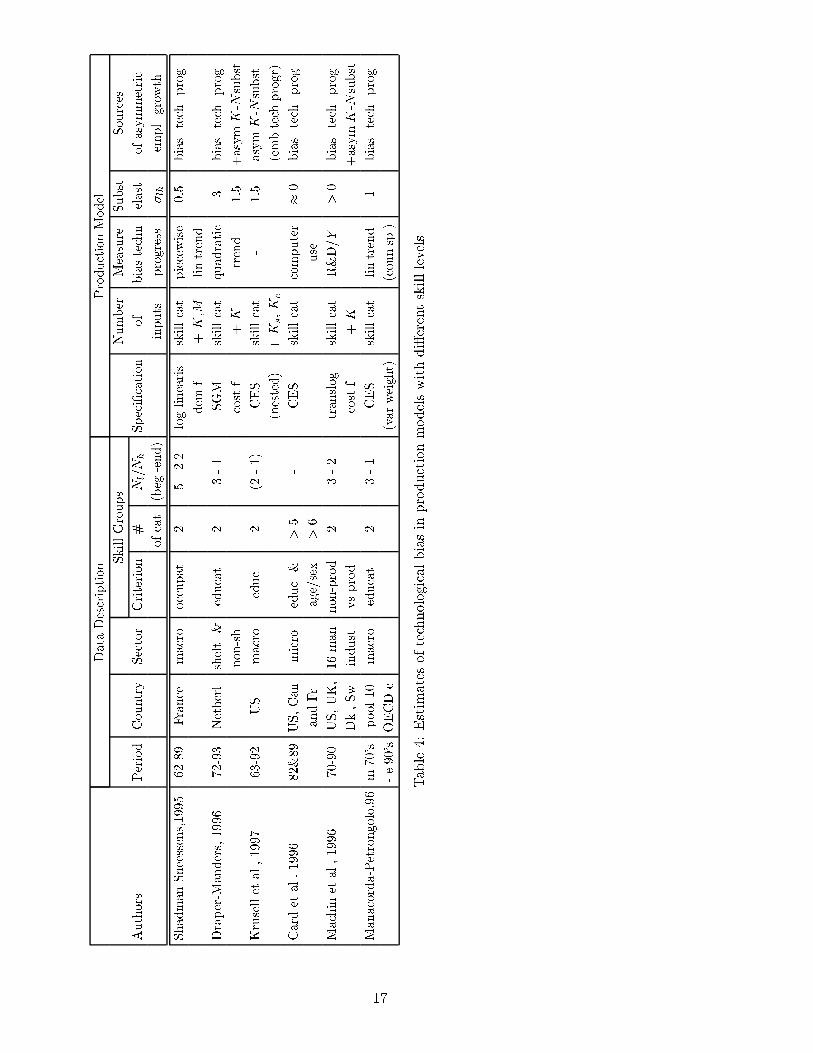
There exits a number of empirical studies aiming to test the biased technological progress
hypothesis via the estimation of production or labour demand functions (see synthesis in
table 4). These studies may di�er by the speci�cation of the production function and/or by
the nature of the data and the de�nition of the skill groups. The type of a priori restrictions
used to identify the parameters may also play a substantial role.
16
DataDescription
ProductionModel
SkillGroups
Number
Measure
Subst.
Sources
Authors
Period
Country
Sector
Criterion
#
Nl=Nh
Speci�cation
of
bias.techn.elast.
ofasymmetric
ofcat.(beg.-end)
inputs
progress
�lh
empl.growth
Shadman-Sneessens,1995
62-89
France
macro
occupat.
2
5-2.2
log-linearis.
skillcat.
piecewise
0:5
bias.tech.prog.
dem.f.
+K,M
lin.trend
Draper-Manders,1996
72-93
Netherl.shelt.&
educat.
2
3-1
SGM
skillcat.
quadratic
3
bias.tech.prog.
non-sh.
costf.
+K
trend
1:5
+asym.K-Nsubst.
Kruselletal.,1997
63-92
US
macro
educ
2
(2-1)
CES
skillcat.
-
1:5
asym.K-Nsubst.
(nested)
+Ks,Ke
(emb.tech.progr)
Cardetal.,1996
82&89
US,Can.
micro
educ.&
>5
-
CES
skillcat.
computer
�
0
bias.tech.prog.
andFr.
age/sex
>6
use
Machinetal.,1996
70-90
US,UK,16man.non-prod.
2
3-2
translog
skillcat.
R&D=Y
>0
bias.tech.prog.
Dk.,Sw.
indust.
vsprod.
costf.
+K
+asym.K-Nsubst.
Manacorda-Petrongolo,96
m.70's
pool10
macro
educat.
2
3-1
CES
skillcat.
lin.trend
1
bias.tech.prog.
-e.90'sOECDc.
(var.weight)
(coun.sp.)
Table4:Estimatesoftechnologicalbiasinproductionmodelswithdi�erentskilllevels
17
Shadman-Mehta and Sneessens (1995) estimate the parameters of a four-input production
function (low- and high-skilled labour, capital and energy) with exogenous labour-augmenting
technical progress. The model allows a structural break in the exogenous rates of technical
progress in 1974. The parameters are estimated on French annual aggregate data over the
period 1962-1989. Skills are de�ned by occupation. A simpli�ed version of the model is used
in Sneessens and Shadman-Mehta (1995). The elasticities of substitution between capital and
the two types of skills are not signi�cantly di�erent; the elasticity of substitution between
low- and high-skilled workers is estimated at around 0.50. There is strong evidence though
of asymmetric technical progress unfavourable to the low-skilled (i.e., given � < 1, they �nd
( l � h) > 0). It is worth stressing that this asymmetry is reduced by 50% after 1974
((1� �) ( l � h) = 0:0480 before 1974, 0:0245 afterwards) . The trend in the relative labour
supply observed during the same periods are respectively (�l��h) = �0:045 before 1974,and
�0:023 afterwards. This implies a positive but decreasing exogenous net labour demand shift
in favour of high-skilled labour, equal to (4:80 � 4:50) = 0:30 percentage points per annum
before 1974, (2:45 � 2:30) = 0:15 afterwards.
Draper-Manders (1996) use a exible functional form (the Symmetric Generalized McFadden
cost function) to estimate why low-skilled employment has decreased relatively to high-skilled
employment in the Netherlands over the period 1972-1993. Most of the change is explained
by biased technological change.
Krusell et al. (1997) estimate a four-input nested-CES production function on US data.
High- and low-skilled labour inputs are measured in e�ciency units. Each of the two labour
input indices is de�ned as a productivity-weigthed sum of all hours worked by individuals in
di�erent age-sex-education cells. The high-skilled worker group includes all individuals with
education attainment level at least equal to college completion. The (normalized) relative
value of the low-skilled labour input index decreases from 2 to 1 over the period covered by
the analysis. The authors �nd evidence of a biased, unfavourable e�ect of growth on the
demand for low-skilled labour. This e�ect however does not come trough an exogenous trend
technical progress, but rather through the process of capital accumulation itself, because
low- and high-skilled labour have di�erent elasticities of substitution vis-�a-vis the capital
stock once the latter is decomposed into structures and equipment. Their results suggest
that nearly all the increased wage inequality could be the consequence of economic growth
driven by the introduction of new technologies embodied in capital equipment.
18

Card et al. (1996) estimate CES employment equations (together with labour supply equa-
tions and wage exibility parameters; see below) on micro data from three di�erent countries:
US, Canada and France. The micro data are aggregated in age-education cells (skill is thus
proxied by educational attainment); two observations are available for each cell: one in the
late 70's-early 80's, the other in the late 80's. Measures of exogenous labour supply changes
(population of working-age changes) are directly available from the data. The bias in techni-
cal progress is proxied by the proportion of workers using computers in each group towards
the end of the eighties, assuming that the progression of this ratio has been similar in all
three countries during the period considered. The model performs well at least for men
aged between 25-54. The coe�cient associated to the biased technical progress indicator is
correctly signed and statistically di�erent from zero; the estimated elasticity of substitution
is however extremely low (0:16), implying that relative wages should have little impact on
relative employment. The di�culty may come from the representation of wage determination
and/or labour supply behaviours included in the model.
Machin et al. (1996) estimate a translog cost function on panel data covering 16 manufactur-
ing industries and four countries (US, UK, Denmark, Sweden). Four productive factors are
distinguished: low- and high-skilled labour, physical capital and R&D (in percentage points
of value-added). The R&D variable is meant to capture the e�ects of investment in new tech-
nologies. Skills are de�ned by production vs non-production status, but the authors checked
the robustness of their �ndings on US and UK data by using an education criterion. As in
Krusell et al. (1997), the authors �nd evidence of important skill-capital and skill-technology
complementarities. This implies biased technological progress, not large enough however
to explain the observed changes in the skill structure in the US and the UK. The authors
give some evidence that institutional factors (giving better protection to low-skilled workers)
rather than international trade can explain these di�erences. These �ndings stress again the
need to try and take simultaneously into account the several dimensions of macroeconomic
and structural interactions.
Manacorda-Petrongolo (1996) estimate a CES relative employment function on annual data
from ten OECD countries (US, Canada, Australia plus seven EU countries including France,
Italy, Spain and the UK). Skill is here proxied by educational attainment. Due to a lack
of data on relative wages, the number of observations may vary considerably from country
to country. By pooling all the countries' observations and imposing the same elasticity of
19

substitution in all countries, it is possible to estimate a country-speci�c coe�cient of biased
exogenous technical progress (corresponding to (1 � �) ( l � h) in equation (6))12. The
estimated elasticity of substitution is not signi�cantly di�erent from one. In all countries the
technical progress coe�cient is positive (technical progress is unfavourable to the low-skilled);
it varies from 0:051 in Australia to 0:076 in the UK. These estimates are next compared to
the trend change in labour force composition (�l��h). The proportion of low-skilled (i.e. low
educational attainment) workers has decreased everywhere; the estimated net labour demand
shift however remains positive, hence unfavourable to the low-skilled, in all countries but one
(the Netherlands). The net shift appears to have been much higher in the US than in France
during the eighties ((4:92 � 3:21) = 1:71 percentage points per annum in the US, against
(6:54� 6:09) = 0:45 in France), despite a lower biased technical progress e�ect in the US. In
the US, the net shift increases from �0:82 in the seventies to 1:71 in the eighties, an increase
mainly due to a reduction in the relative rate of growth of high-skilled labour supply.
Manacorda-Manning (1997) build on this previous work by taking into account explicitly
that educational attainment may be an imperfect measure of skill. To this end, they have to
start with a continuum of skill levels and next aggregate in two or more groups. Assuming
a unitary elasticity of substitution between skills (Cobb-Douglas production function), they
are able to obtain yearly estimates of exogenous net labour shifts for the US and �ve EU
countries. There is again in all countries evidence of shifts unfavourable to the low-skilled.
In four EU countries (France, Germany, Italy and the UK), the shift keeps the same value
throughout the eighties; it is decreasing in the Netherlands, increasing in the US.
It seems fair to conclude that there is fairly strong evidence of biased technological change
unfavourable to the low-skilled13. In almost all countries, the composition of the labour force
did not change rapidly enough to compensate this bias, which means that the relative wage
cost of the low-skilled had to decrease to stabilize the di�erence in unemployment rates.
There are only a few studies that examine how this net demand shift may have changed
over time. A tentative conclusion is that the net demand shift has remained stable or even
decreased in France and has increased in the US. It is worth recalling though that taking
12The authors estimate (1� �) ( l � h) as one coe�cient, without imposing that it be equal to zero when
� is one. This amounts to using a Cobb-Douglas function with changing wage share coe�cients.13Estimates of biased \technological change" relying on unexplained trend coe�cients may well of course
pick up the e�ects of factors others than technical progress, like international trade and globalization or
changes in the structure of the economy.
20

observed changes in the labour force composition as given, as if they were exogenous, may be
misleading, especially when there are early retirement programmes and when changes in the
compulsory schooling age reduces the participation rates of older and younger workers. In
such a case, the calculated net demand shifts may seriously underestimate the true magnitude
of the shock14.
The relative wage adjustment needed to o�set a net demand shift of course depends on the
size of the elasticity of substitution. There is not much consensus (to say the least) about
the latter. The estimates reported here vary from almost zero to three15.
Evidence on Wage Rigidities
A biased technological change may leave relative employment unchanged if relative wage costs
are suitably adjusted. Whether this will occur or not depends on many factors, including
a.o. the sensitivity of wages to unemployment rate changes, the existence of insider-outsider
e�ects, wage rivalry, etc...
Cohen (1997), comparing France and the US, obtains that bargaining power on the vari-
ous segments of the labour market is similar in the two countries, except for workers with
no diploma,where the bargaining power is 20% higher in France. In Sneessens and Shad-
man (1995), the French low-skilled wage rate appears to be insensitive to unemployment
rate changes, while the skilled wage rate is sensitive to changes in its own unemployment
rate. Card et al. (1996) obtain a larger wage rigidity in all age-education cells in France,
compared to the US. There is a single coe�cient measuring wage exibility, which broadly
corresponds to the ratio between the realized wage adjustment and the one that would be
needed to restore full-employment. If the adjustment needed to restore full employment is
larger on the low-skilled labour market segment (which seems a most plausible assumption
in situations of biased technical progress unfavourable to the low-skilled), their result implies
a larger non-adjustment of low-skilled wages.
14In Card et al. (1996), participation rates are endogenous, but solely a function of the real wage rate. Part
of the di�culty however is avoided when focusing on men aged 25-54, whose participation rates have been
more stable.15See also for instance Bound-Johnson (1992), who report a value larger than 2. Values of � larger than one
are typically associated to negative values of l� h, so that the relative wage implications remain essentially
unchanged.
21

Manacorda-Petrongolo (1996) impose the same elasticity of wages to unemployment across
skill groups, and obtain similar values for the UK and the US (around �0:03). They allow
however from trend e�ects similar to those of equations (3)-(4) (our coe�cients �l and �h)
and obtain striking di�erences between the two countries. The trends are positive and similar
for low- and high-skilled workers in the UK (a case similar to the \second scenario" discussed
in the previous section) ; they are negative in the US, especially for low-skilled workers (twice
larger -in absolute value- for low-skilled workers; this case is similar to the \�rst scenario"
discussed in the previous section).
Risager (1992) develops and estimate on Danish data (1951-1987) a model with two types
of skills and wage rivalry. For both types of labour, own-unemployment wage elasticities are
not signi�cantly di�erent from zero; there are however signi�cant insider-outsider e�ects on
the low-skilled segment of the labour market (highly signi�cant negative lagged employment
e�ects). The model implies a fairly constant long-run relative wage.
A fair conclusion seems to be that there is more wage rigidity in Europe than in the US,
and more wage rigidity at the low end of the wage spectrum. Simultaneously, we should
recognize that our understanding of the many dimensions of the wage formation process
remains limited . Wage-wage interactions in particular remain poorly understood and taken
into account, which certainly limits our ability to evaluate correctly the link between biased
technical progress (or structural shocks in general) and aggregate unemployment.
This di�culty may contribute to explain the controversy about the e�ect of minimum wages.
Whether minimum wage laws have signi�cant macroeconomic implications remains a debated
issue. Empirical work based on fairly aggregated data (see for instance Bazen-Martin, 1991)
suggested that minimum wages might have little employment consequences. More recent
studies based on micro data (Di Nardo et al., 1996; Abowd et al., 1996) suggest however that
an increase in the minimum wage implies a dramatic reduction in employment opportunities
for workers paid at the minimum wage. One easy way of reconciling the two results is
to consider that the proportion of workers paid the minimum wage is quite small, so that
aggregate e�ects are almost negligeable. This argument of course neglects the impact of
wage-wage interactions.
22

Biased Technological Change and Unemployment
There is thus fairly convincing evidence of exogenous net labour demand shifs and of wage
rigidities, especially for low wages. This suggests that exogenous net relative labour de-
mand changes induced by biased technological progress must have contributed to observed
unemployment changes. As suggested before, quantifying this contribution may turn out to
be a di�cult task, given in particular the many interactions between macroeconomic and
structural phenomena. Not all the author do the exercise.
In Card et al. (1996), relative wage rigidities have almost no impact on relative employment
because the elasticity of substitution � is close to zero. The authors conclude that stronger
relative wage rigidities in France can therefore not be held responsible for low-skilled unem-
ployment.
Sneessens and Shadman-Mehta (1995) reach a di�erent conclusion. Biased technical progress
together with minimum wage changes play a dominant role. The two factors together explain
�ve out of the eight percentage point unemployment increase observed in France between
1962 and 1989. As for the UK, Manacorda-Petrongolo (1996) conclude for that exogenous
net labour demand shifts account for half the increase observed in aggregate unemployment
between 1975 and 1992 (three percentage points out of six), the rest being accounted for by
increased wage pressure (the trend terms in the wage equations). In the US, exogenous net
labour demand shifts, although stronger, have been fully o�set by relative (and absolute)
wage changes.
5 Conclusions
The fact that there is biased technical progress (or at least, that growth has asymmetric
e�ects) is little disputed. Evaluating its e�ect on unemployment still remains a di�cult task.
We �rst stressed the danger of working with simple measures of unemployment dispersion
because they cannot provide reliable measures of the size of structural shocks. We emphasized
instead the need to have a genuine structural analysis. The latter involves at least two
types of information, �rst about net exogenous changes in relative labour demands, second
about the determinants of real wages (especially their trend increase and their sensitivity to
unemployment).
23

To clarify these issues, we developed a simple analytical framework with two types of labour
(high- and low-skilled) and examined its implications. It was shown in this setup that pur-
suing an objective of stable relative wages in the face of exogenous, technology-induced net
relative labour demand shifts is bound to have macroeconomic e�ects, the size of which will
depend on many parameters like the sensitivity of wages to unemployment and labour sup-
ply behaviours, plus other propagation mechanisms like the government budget constraint
and its impact on labour taxes and wage costs in a context of growing unemployment. The
fact that we actually observed a rise in both the high- and the low-skilled unemployment
rates should thus not too quickly be interpreted as a proof that biased technological progress
has not contributed to the rise and persistence of aggregate unemployment in EU countries.
We next used the model as a reference setup wherein to compare the empirical modelling
approaches used by di�erent authors and the results they obtain.
Existing empirical evaluations of the impact of biased technical progress and of structural
shocks in general still fail to take into account a certain number of important factors and
mechanisms. One key di�culty is to distinguish endogenous and exogenous changes in the
labour force composition. The sharp reduction in the participation rates of younger and
older workers in many EU countries is probably an endogenous rather than an exogenous
phenomenon. The failure to take it into acount probably leads to the underestimation of the
e�ect of biased technological progress.
Biased technical progress has probably been at work for a long time. A most relevant question
in this perspective is why it should lead today to structural imbalances, while it was com-
patible in the past with full-employment and reduced inequalities. Existing empirical models
with structural features allow too few interactions between macroeconomic and structural
phenomena, and between di�erent types of structural shocks (deindustrialisation vs technical
progress, e.g.). The former may lead to overestimating the importance of structural shocks
(by ignoring the structural implications of macro shocks, especially the so-called \ladder ef-
fect"); the latter may lead to its underestimation (by neglecting the amplifying e�ects of
structural interactions).
Ignoring macroeconomic and structural interactions may be a serious shortcoming. Dr�eze
(1997) shows that when there are real rigidities similar to those considered here (relative
real wage rigidities), pessimistic self-ful�lling demand expectations can make the \size" of
the economy arbitrarily small, via capital scrapping and persistent unemployment. Such a
24

macroeconomic evolution can clearly have structural implications, especially if high-skilled
workers can reduce their own unemployment risk by moving to the low-skilled labour market
and taking the job of low-skilled workers (ladder e�ect). It may explain our di�culty to
disentangle the e�ects of macroeconomic and of structural shocks. More work on these issues
should be most welcome.
25

References
Abowd, J.M., F.Kramarz, T.Lemieux, D.N.Margolis (1996),\Minimum Wages and Youth
Unemployment in France and the United States", DT No 9652, INSEE, Paris.
Ag�enor P.R., and J.Aizenman (1997),\Technological Change, Relative Wages and Unemploy-
ment", European Economic Review, 41:2, 187-206.
Barrell, R., M.Lansbury, J.Morgan and N.Pain, (1995), `US Labour Markets. The Process of
Job Creation", NIESR, December 1995.
Bazen, S., and J.Martin (1991), \L'incidence du salaire minimum sur les gains et l'emploi en
France", Revue �economique de l'OCDE, 16.
Bound, J., and G.Johnson (1996), \Changes in the structure of wages in the 1980's: An
evaluation of alternative explanations", American Economic Review, 82:2, 371-392.
Card, D, F.Kramarz and T.Lemieux (1996), \Changes in the relative structure of wages and
employment: A comparison of the United-States, Canada and France", NBER WP 6487.
Cohen, D. (1997), \A comparison of inequalities across French and US labour markets",
paper presented at the CEPR Conference on Unemployment Persistence and the Long-run:
Reevaluating the natural rate, Vigo, November 1997.
Di Nardo, J., N.M.Fortin and T.Lemieux (1996), \Labor Market Institutions and the Distri-
bution of Wages, 1973-1992: A Semi-parametric Approach", Econometrica, 64:5, 1001-1044.
Draper N. and T.Manders (1996), \Structural Changes in the Demand for Labour", Centraal
Planbureau, Research Memo No 128, The Hague.
Dr�eze, J.H. (1997), \Walras-Keynes Equilibria, Coordination and Macroeconomics", Euro-
pean Economic Review, 41:9, 1737-1762.
Krusell,P., L.Ohanian, J.V.Rios-Rull, and F.Violante (1997), \Capital-Skill Complementarity
and Inequality", Federal Reserve Bank of Minneapolis, Research Department Sta� Report #
236.
Layard, R., S.Nickell and R.Jackman (1991), Unemployment. Macroeconomic Performance
and the labour market, Oxford University Press: Oxford.
Machin, S., A.Ryan and J.Van Reen (1996), \Technology and changes in skill structure:
Evidence from an international panel of industries", Center for Economic Performance, The
Labour Market Consequences of Technical and Structural Change Discussion Paper Series,
26

DP No 4, London School of Economics.
Manacorda, M., and B. Petrongolo (1996), \Skill Mismatch and Unemployment in OECD
countries", Center for Economic Performance, Discussion Paper No 307, London School of
Economics (forthcoming in Economica).
Manacorda, M., and A.Manning (1997), \Just Can't Get Enough: More On Skill-Biased
Change and Unemployment", mimeo, Center for Economic Performance, London School of
Economics.
OECD (1996), Regards sur l'�education. Analyse, Paris.
OECD (1997), Implementing the OECD jobs strategy. Member countries' experience, Paris.
Risager, O. (1992), \Wage rivalry and insider-outsider relations: Evidence from skilled and
unskilled men in Denmark", The Scandinavian Journal of Economics, 94-4, 543-559.
Shadman-Mehta, F., and H.R.Sneessens (1995), \Skill Demand and Factor Substitution",
CEPR Discussion Paper n1279.
Sneessens, H.R. (1994), "Croissance, quali�cations et chomage", Revue francaise d'�economie,
IX, 1-33.
Sneessens, H.R., and F.Shadman-Mehta (1995), \Real Wages, Skill Mismatch and Unemploy-
ment Persistence; France, 1962-89", Annales d'�economie et de statistique, 37/38, 255-292.
27