Embed Size (px)
Citation preview
1
Increasing Human Population
The Greatest Environmental Problem
Spring 2012, Lecture 2

2
US Census Bureau Population Estimate
Click link below to see Latest Census Bureau Estimate of U.S. and World Populations
United State Population Clock
World Population Clock
3
4
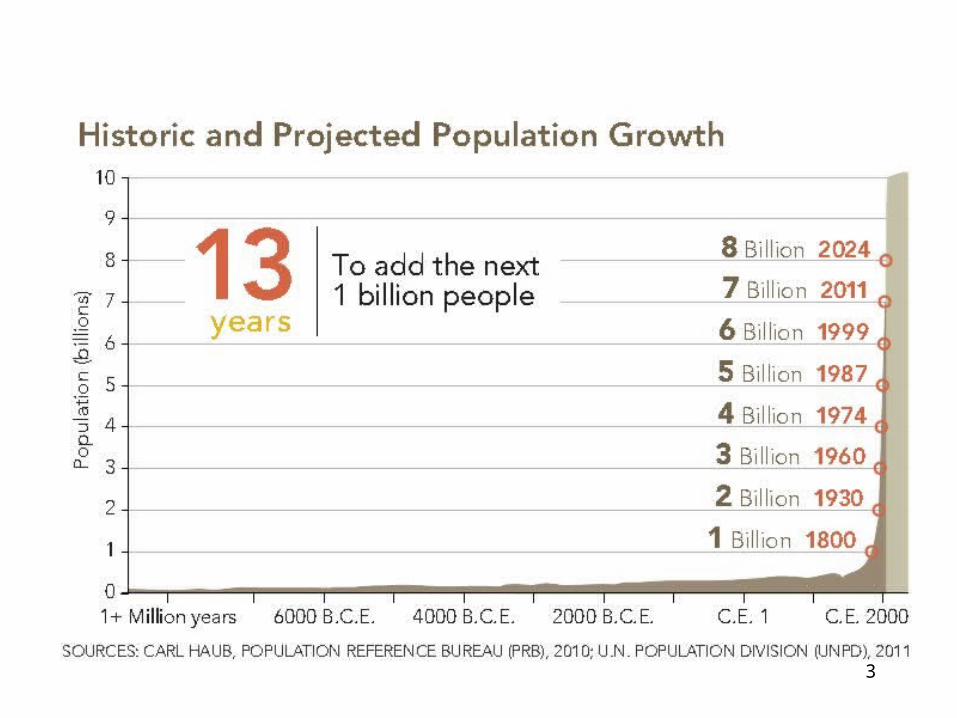
United Nations Population Division – 2012 EstimatesYear Population Year Population
1950 2 529 229 2005 6 506 649
1955 2 772 982 2010 6 895 889
1960 3 038 413 2015 7 284 296
1965 3 331 007 2020 7 656 528
1970 3 696 186 2025 8 002 978
1975 4 076 419 2030 8 321 380
1980 4 453 007 2035 8 611 867
1985 4 863 290 2040 8 874 041
1990 5 306 425 2045 9 106 022
1995 5 726 239 2050 9 306 128
2000 6 122 770
In thousands
5
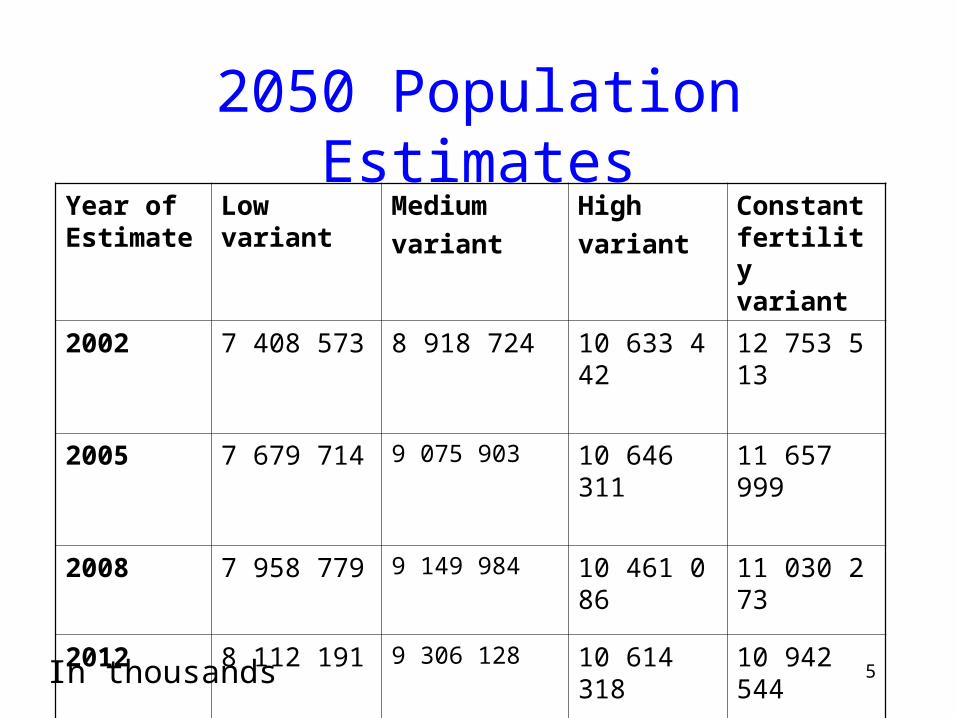
2050 Population EstimatesYear of Estimate
Low variant Medium
variant
High
variant
Constant fertility variant
2002 7 408 573 8 918 724 10 633 442 12 753 513
2005 7 679 714 9 075 903 10 646 311 11 657 999
2008 7 958 779 9 149 984 10 461 086 11 030 273
2012 8 112 191 9 306 128 10 614 318 10 942 544
In thousands
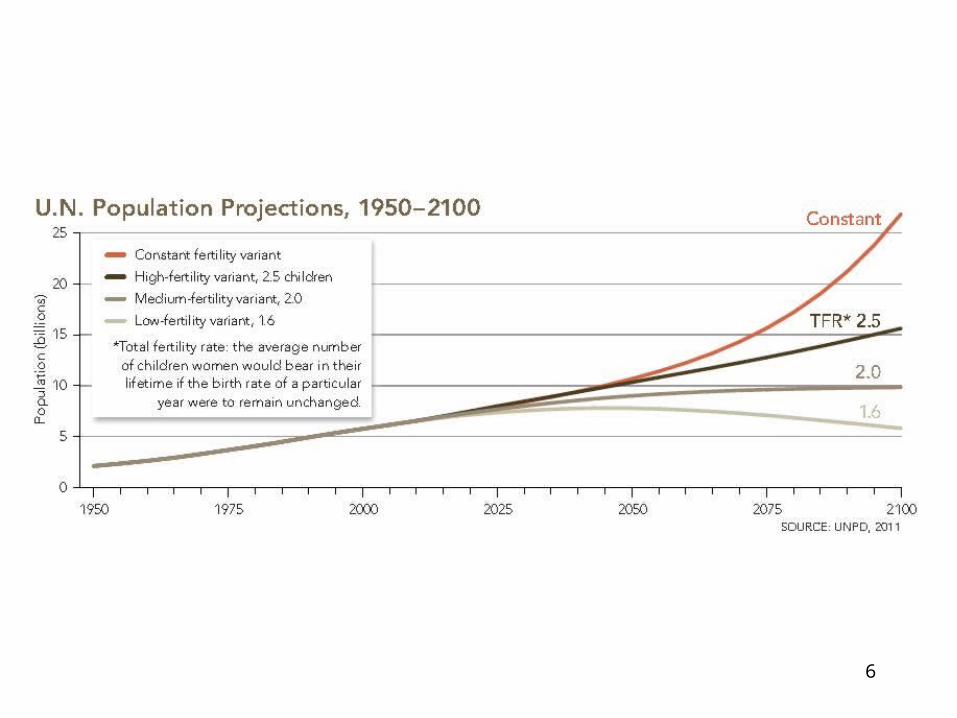
6
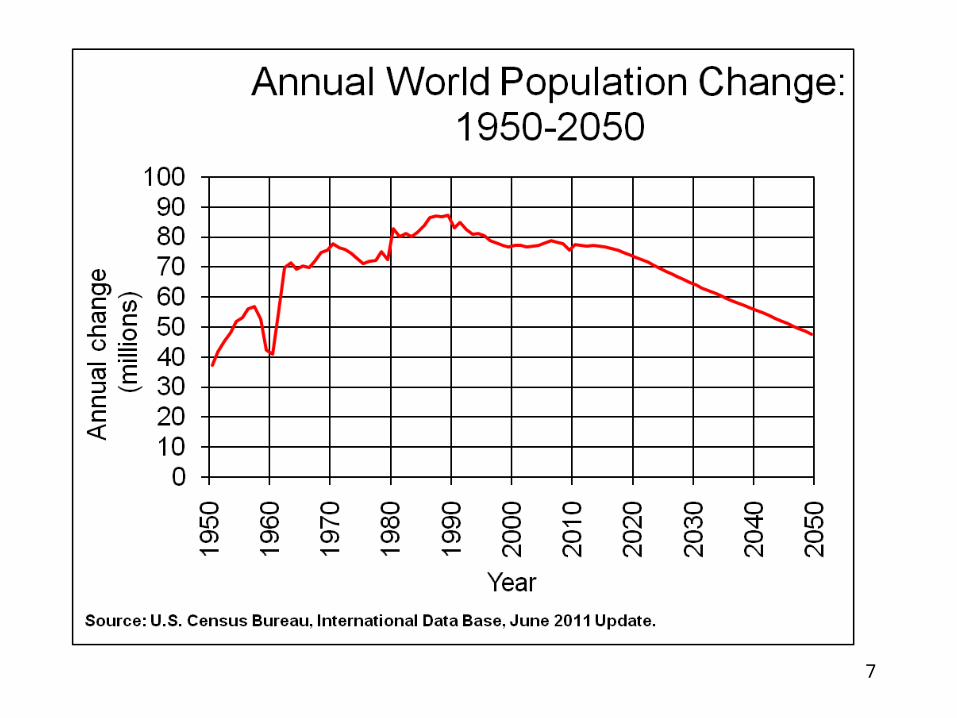
7

8
Thomas Malthus (1798)
“An Essay on the Principle of Population”
• Populations grow geometrically while supporting resources grow arithmetically• Population, if not purposefully checked (“preventative checks”), would outpace resources and lead to unplanned “positive checks” that would return population to sustainable levels
9
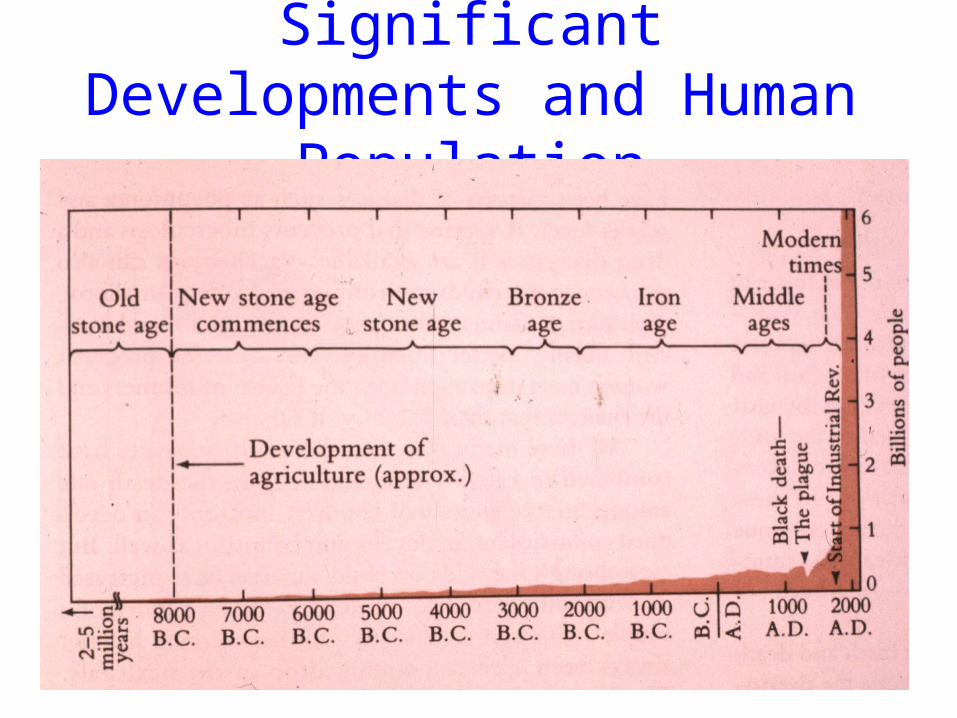
Significant Developments and Human Population
10
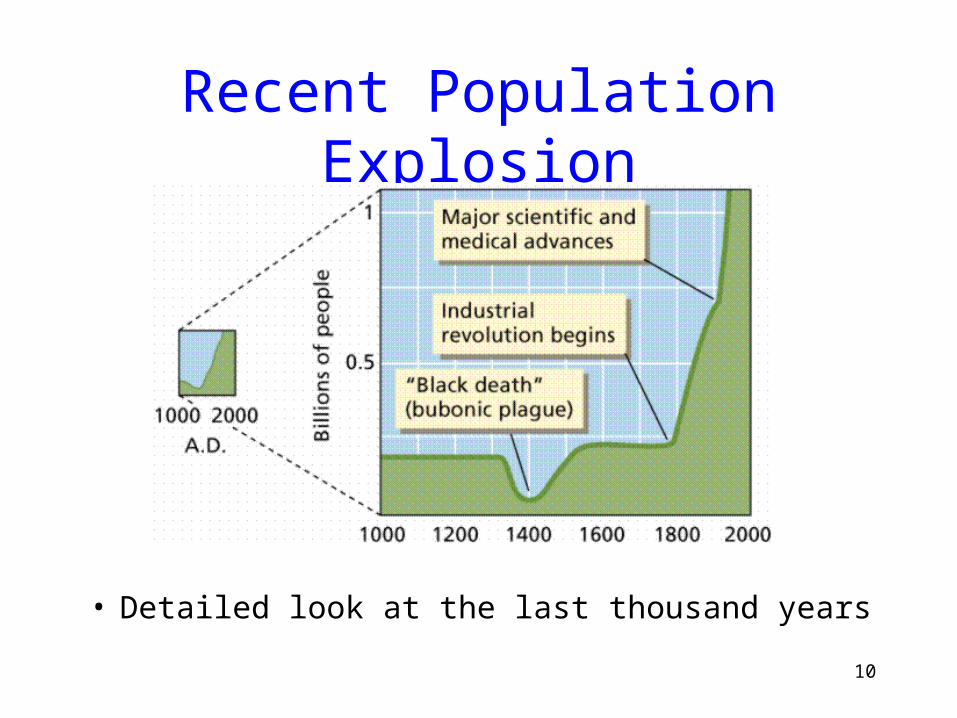
Recent Population Explosion
• Detailed look at the last thousand years
11
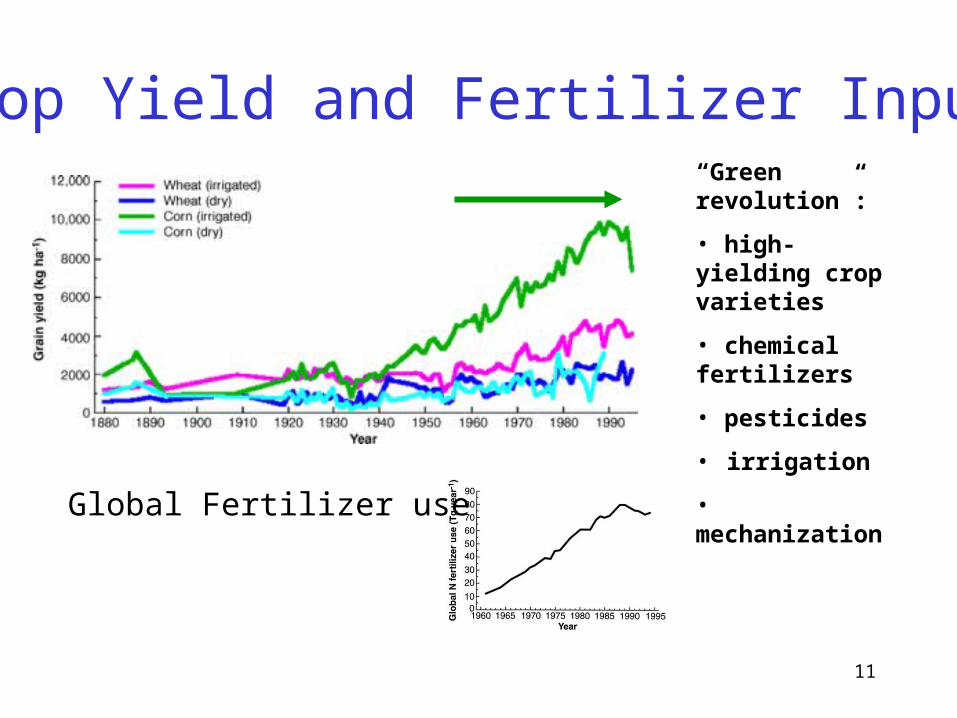
Global Fertilizer use
Crop Yield and Fertilizer Input“Green revolution”:
• high-yielding crop varieties
• chemical fertilizers
• pesticides
• irrigation
• mechanization
12
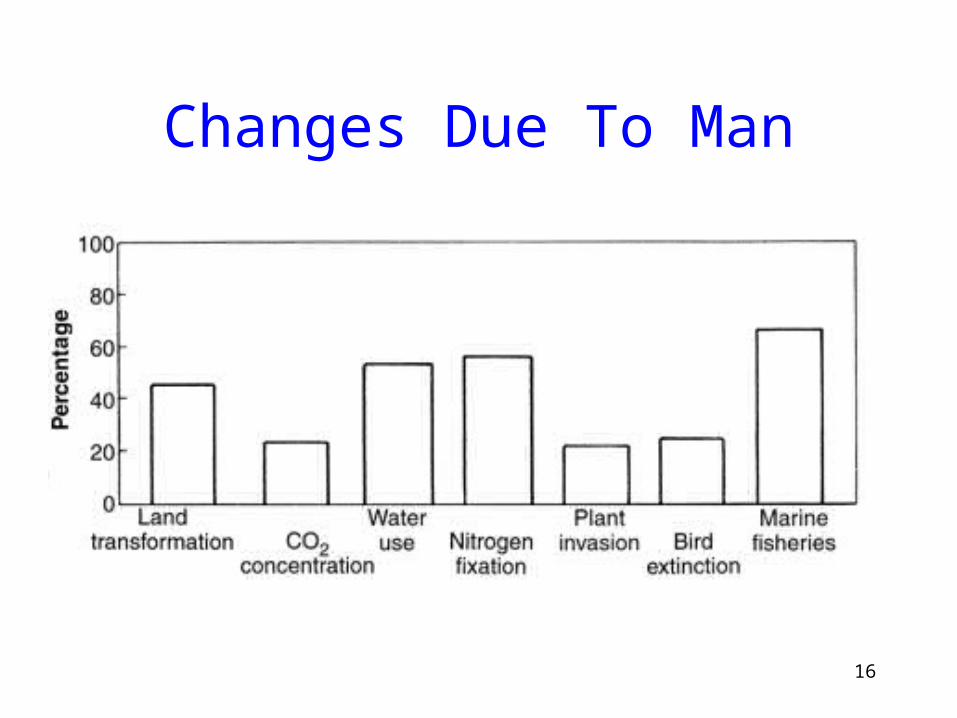
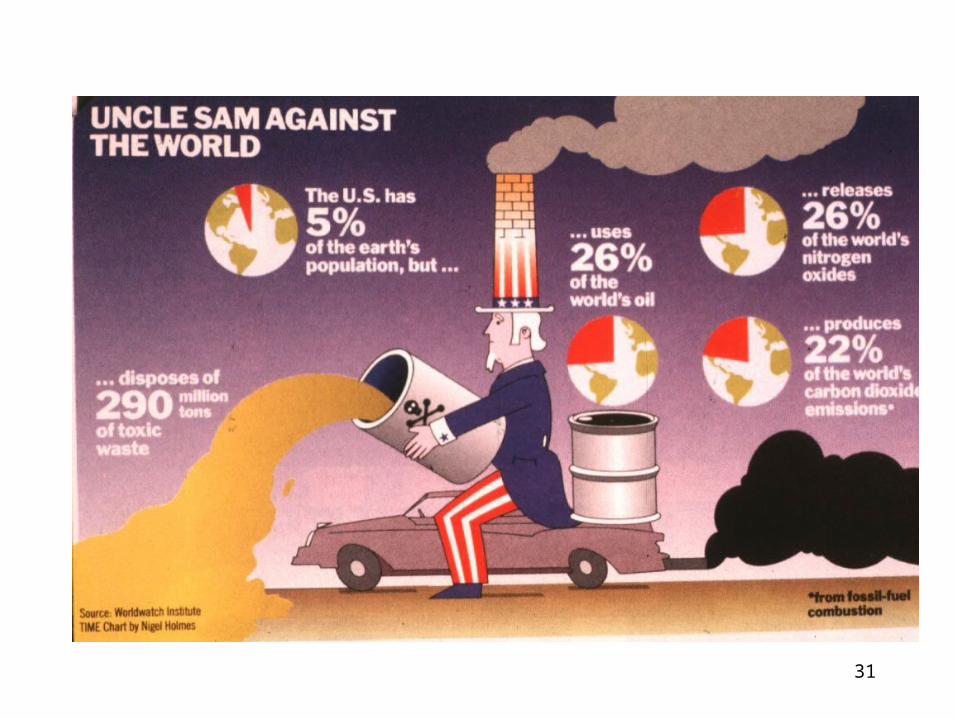
Humans Have:
• Transformed or degraded 39-50% of the Earth's land surface
• Increased atmospheric CO2 concentration by 40%
• Overexploited or depleted 22% of marine fisheries
• 44% more are at the limit of exploitation

New South Wales, Australia
13Figure shows the trend in the total catch for marine fisheries in NSW since 1984–85.
14
Changes Due to Man• About 20% of bird species have become extinct in
the past 200 years, almost all of them because of human activity
• Man uses more than half of the accessible surface fresh water
• On many islands, more than half of plant species have been introduced by man
• On continental areas, man has introduced 20% or more of the plant species present
15
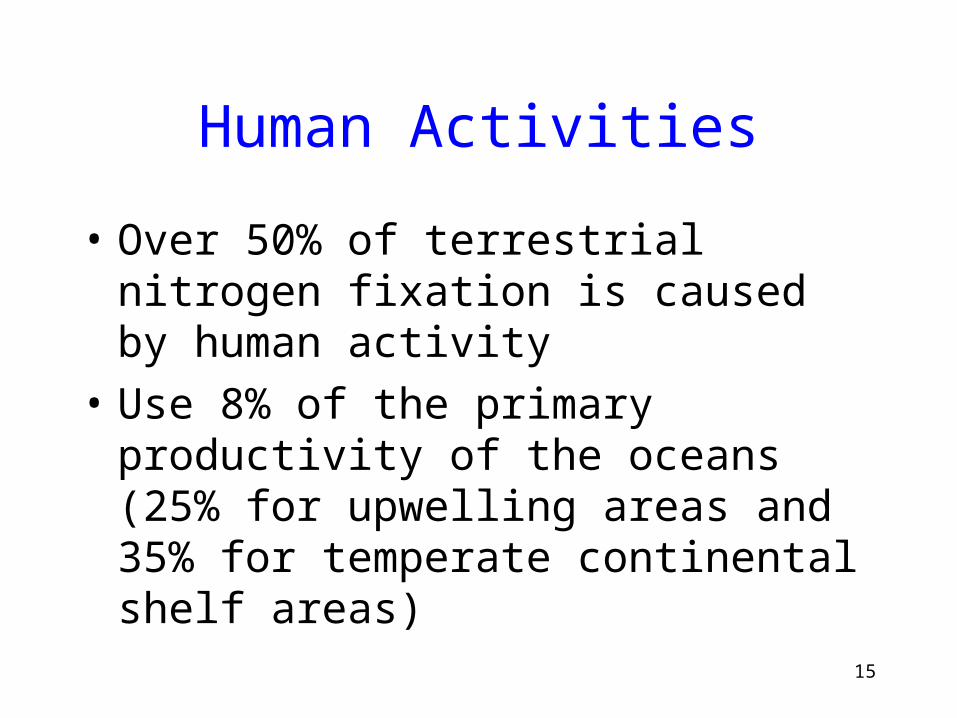
Human Activities
• Over 50% of terrestrial nitrogen fixation is caused by human activity
• Use 8% of the primary productivity of the oceans (25% for upwelling areas and 35% for temperate continental shelf areas)
16
Changes Due To Man
17
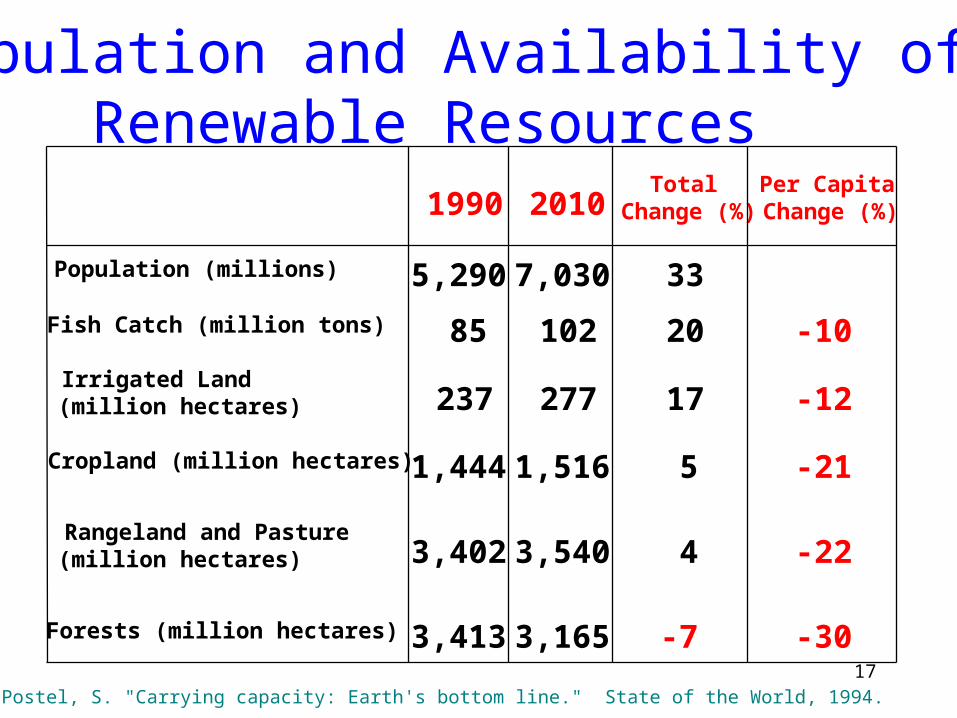
Population and Availability of Renewable Resources
Source: Postel, S. "Carrying capacity: Earth's bottom line." State of the World, 1994.
1990 2010Total
Change (%)Per Capita Change (%)
Population (millions) 5,290 7,030 33
Fish Catch (million tons) 85 102 20 -10
Irrigated Land (million hectares) 237 277 17 -12
Cropland (million hectares) 1,444 1,516 5 -21
Rangeland and Pasture (million hectares) 3,402 3,540 4 -22
Forests (million hectares) 3,413 3,165 -7 -30
18
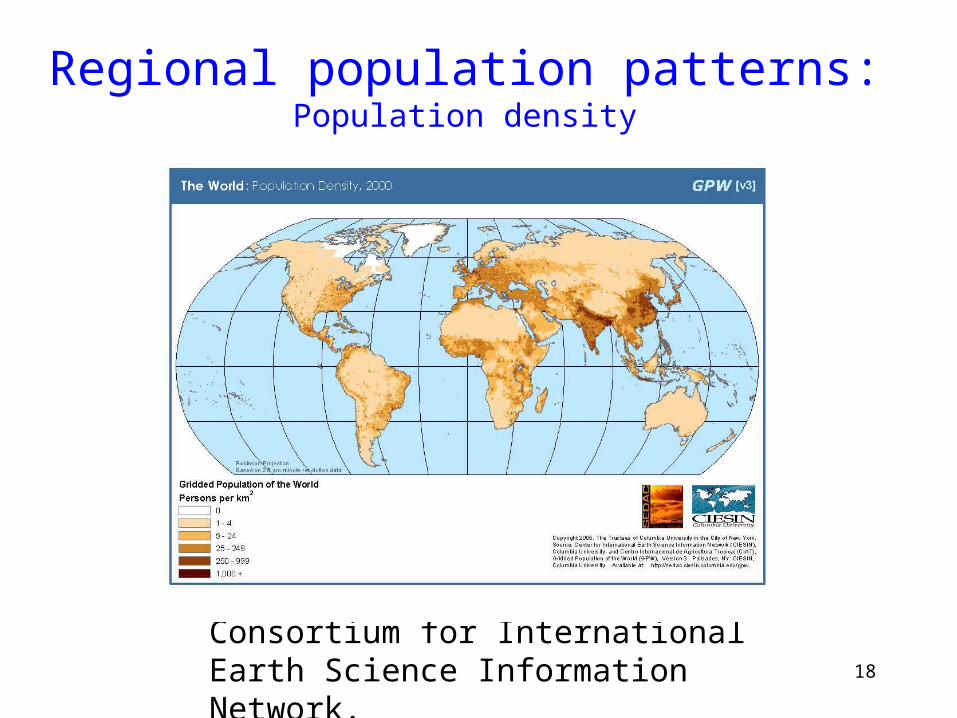
Regional population patterns:Population density
Consortium for International Earth Science Information Network.
19
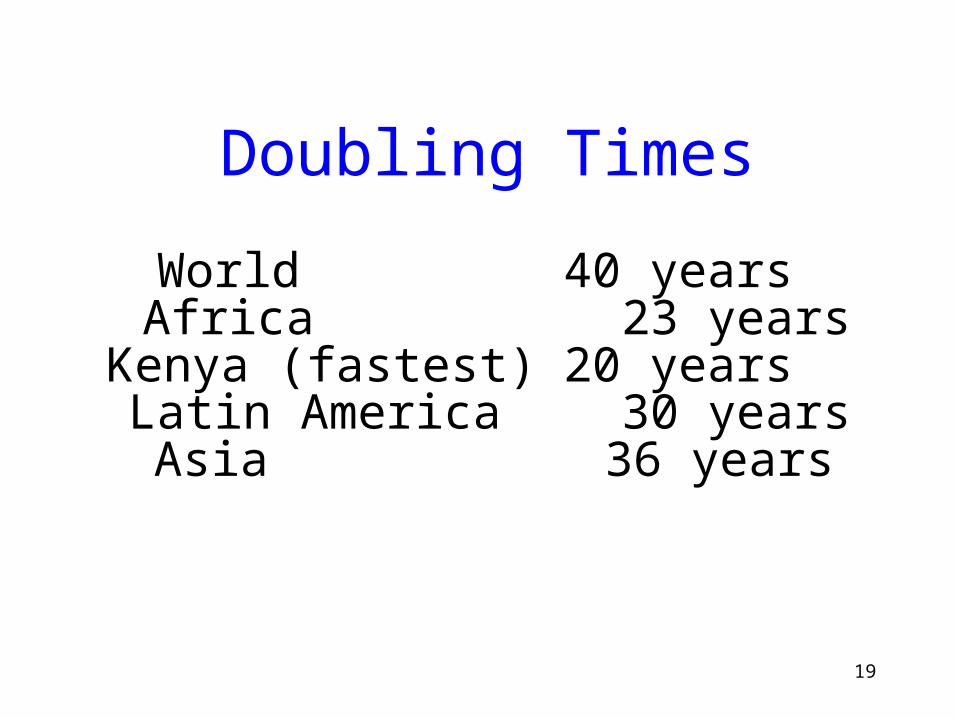
Doubling Times
World 40 yearsAfrica 23 yearsKenya (fastest) 20 yearsLatin America 30 yearsAsia 36 years
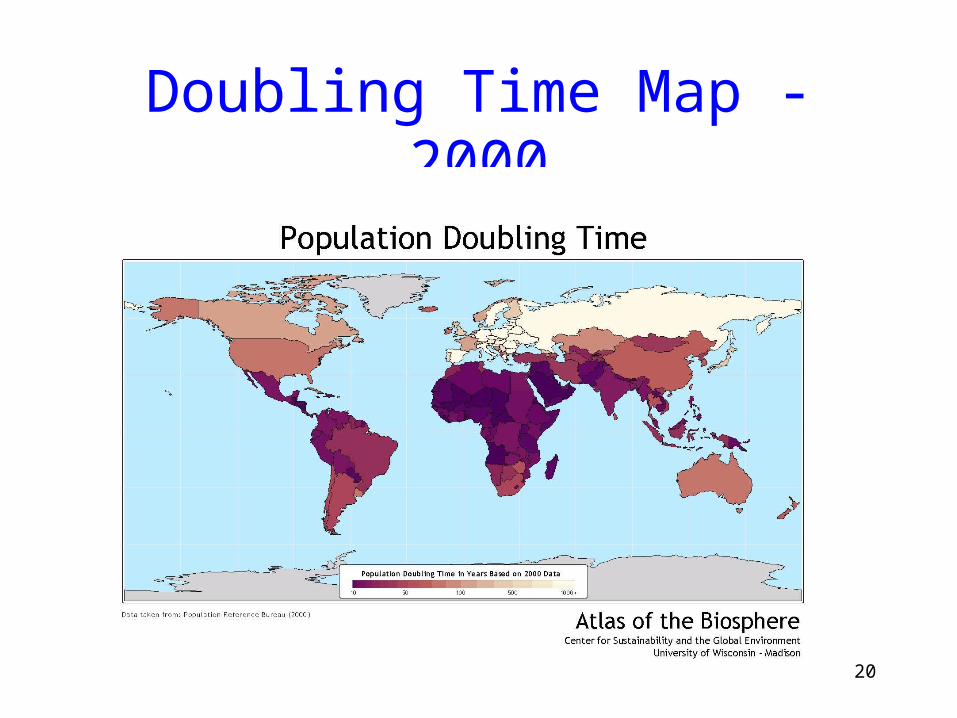
Doubling Time Map - 2000
20
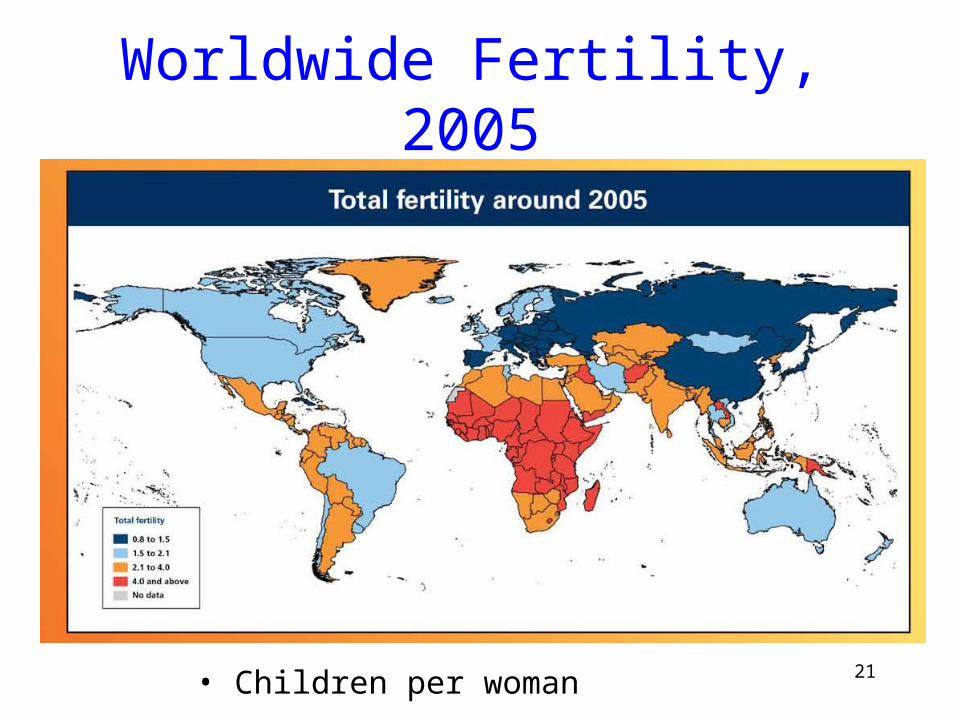
Worldwide Fertility, 2005
21• Children per woman
22
Reduction in Childhood Death Rates
• DDT used against mosquitoes that transmit malaria
• Childhood immunization used against cholera, diphtheria, etc.
• Antibiotics used against bacterial infections
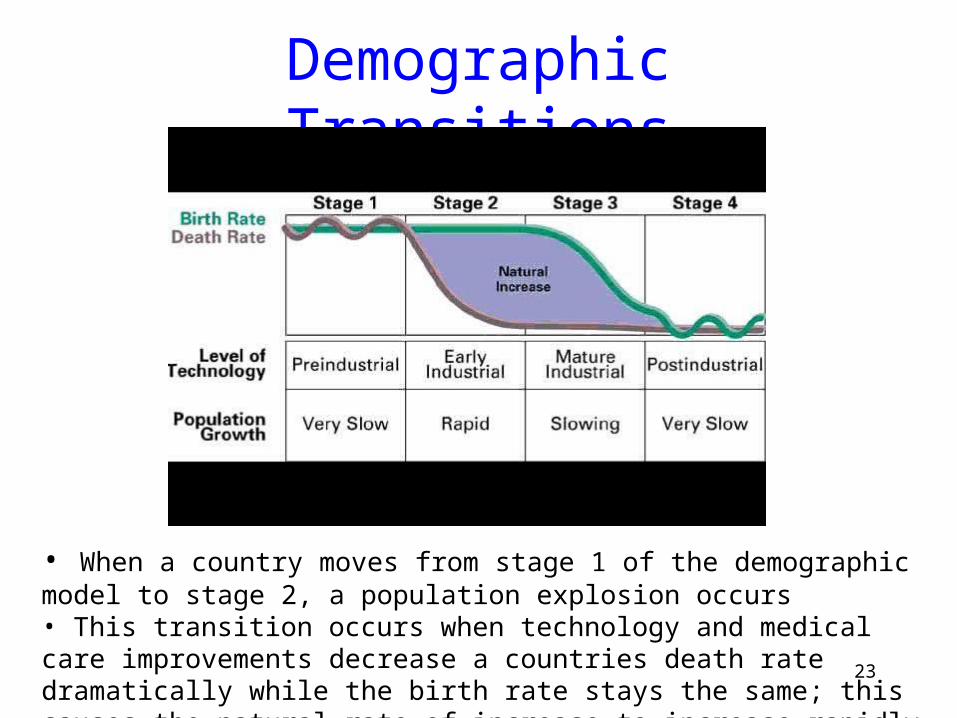
Demographic Transitions
23
• When a country moves from stage 1 of the demographic model to stage 2, a population explosion occurs• This transition occurs when technology and medical care improvements decrease a countries death rate dramatically while the birth rate stays the same; this causes the natural rate of increase to increase rapidly
24
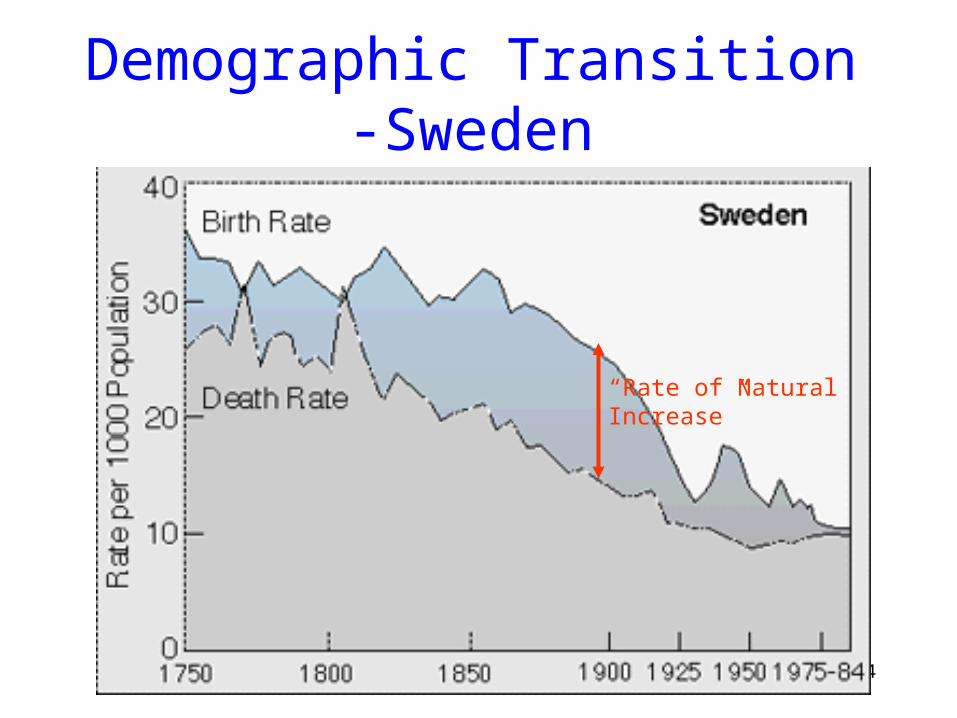
Demographic Transition -Sweden
“Rate of Natural Increase”
25
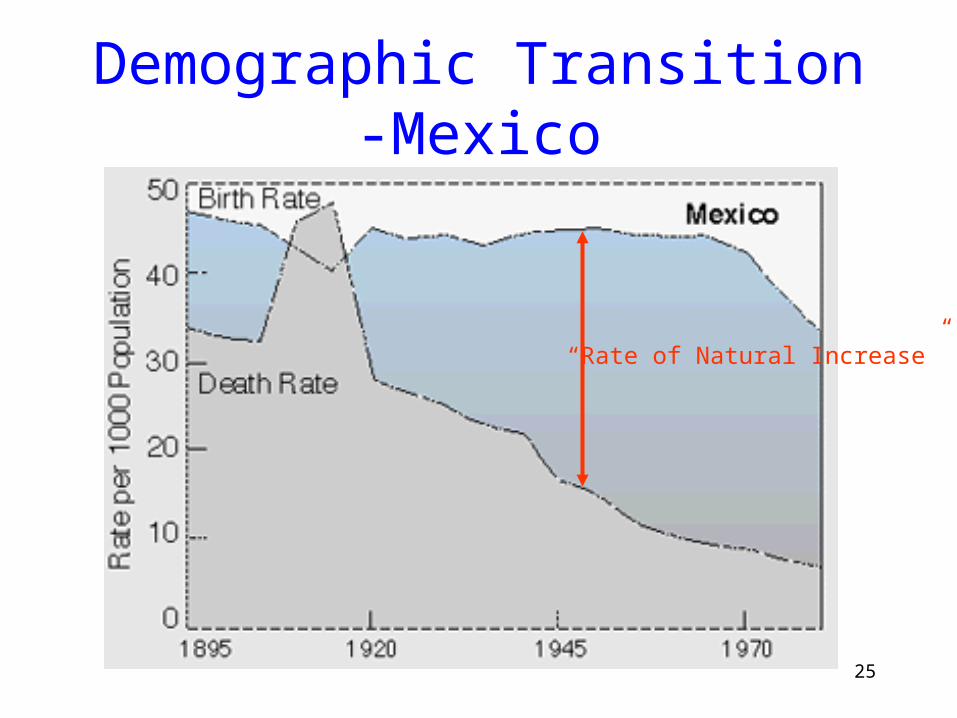
Demographic Transition -Mexico
“Rate of Natural Increase”
26
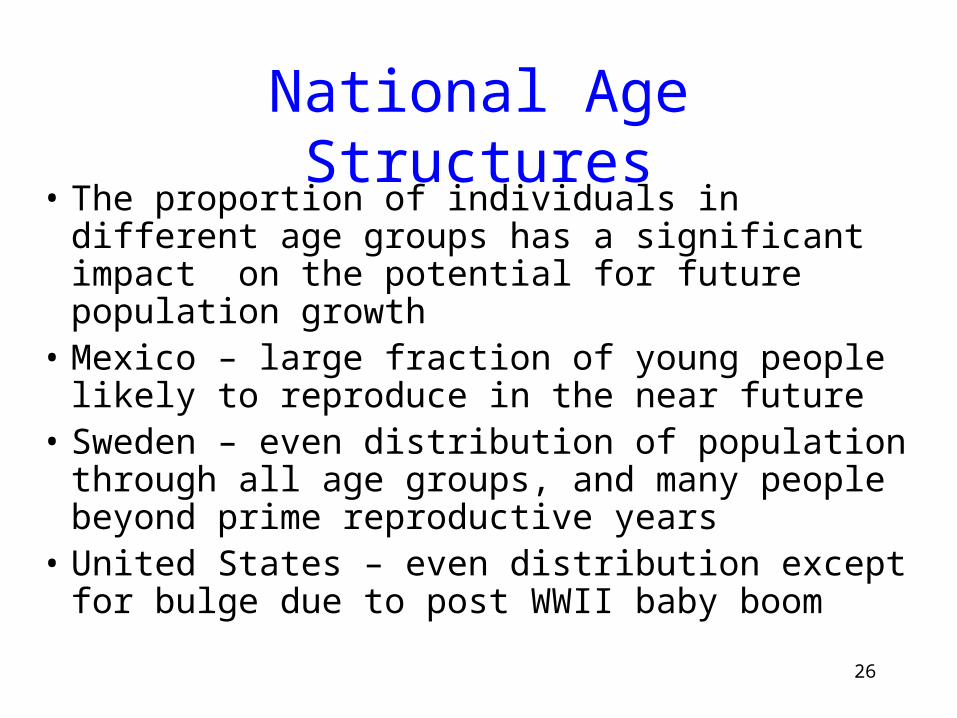
National Age Structures• The proportion of individuals in different age
groups has a significant impact on the potential for future population growth
• Mexico – large fraction of young people likely to reproduce in the near future
• Sweden – even distribution of population through all age groups, and many people beyond prime reproductive years
• United States – even distribution except for bulge due to post WWII baby boom
27
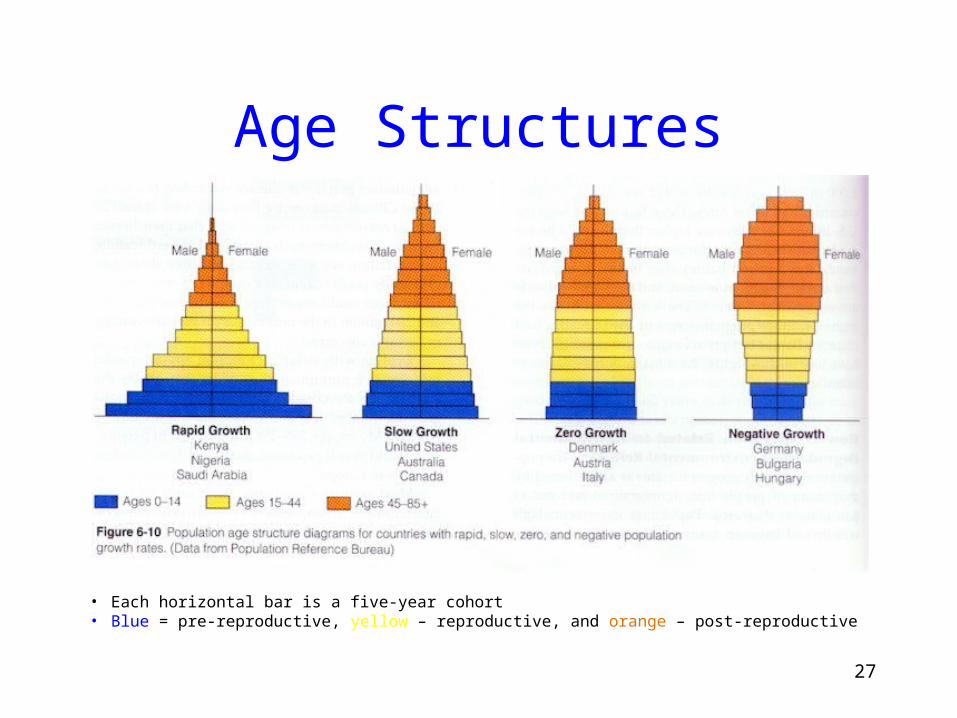
Age Structures
• Each horizontal bar is a five-year cohort• Blue = pre-reproductive, yellow – reproductive, and orange – post-reproductive
28
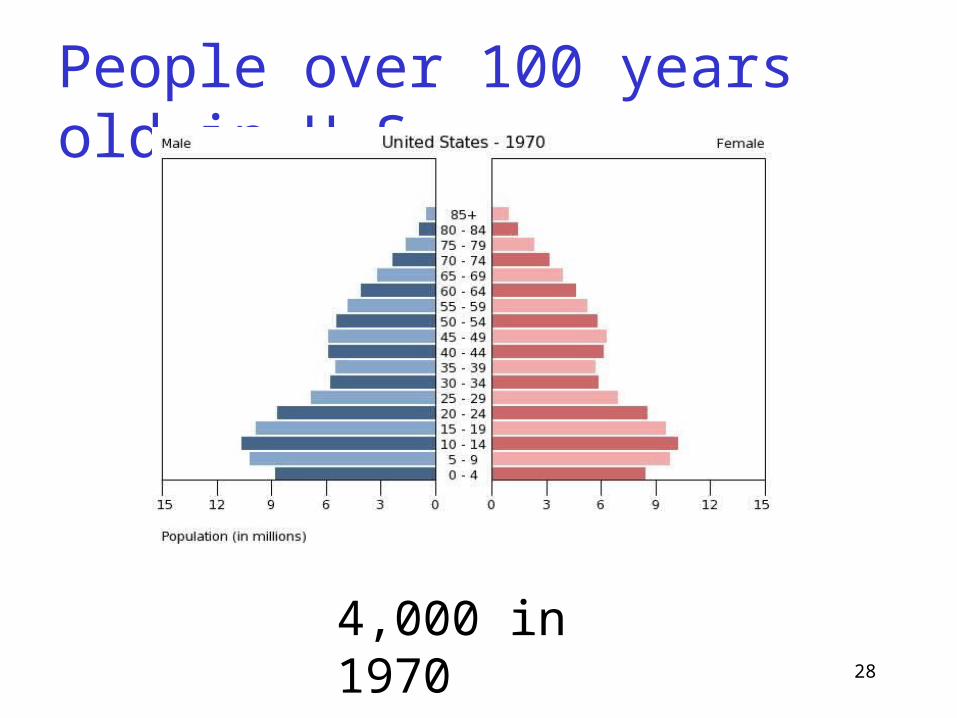
People over 100 years old in U.S.
4,000 in 1970
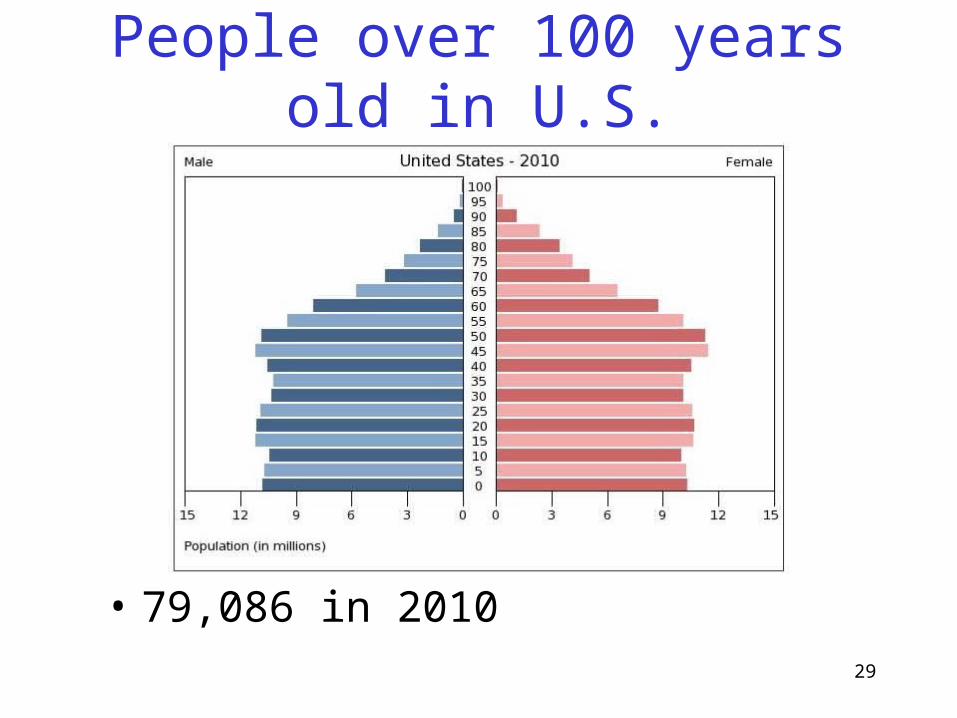
People over 100 years old in U.S.
• 79,086 in 201029
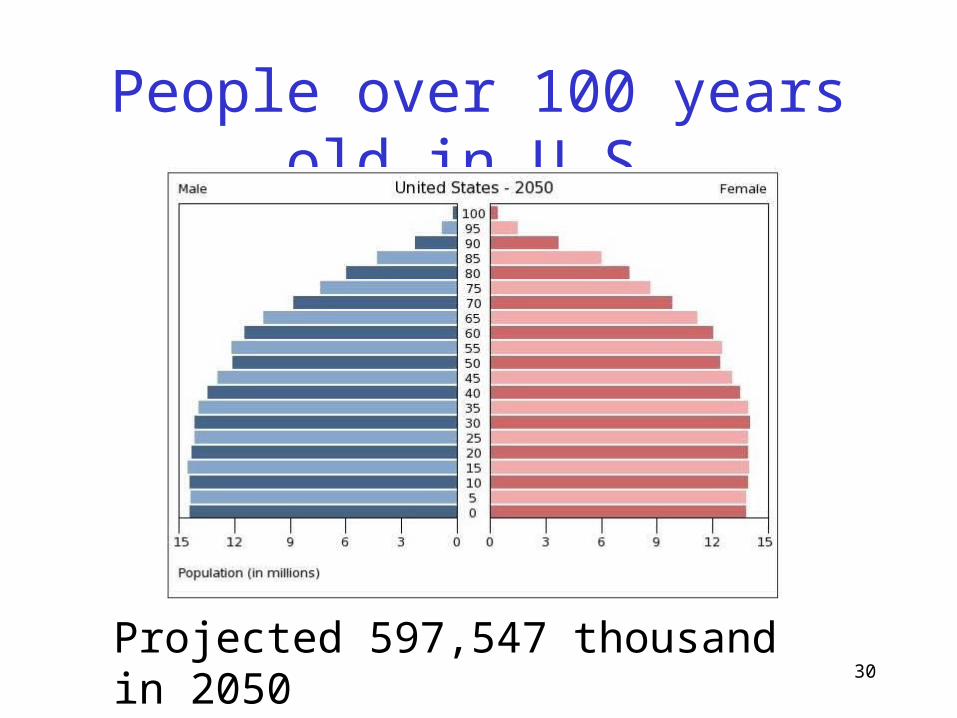
People over 100 years old in U.S.
30Projected 597,547 thousand in 2050
31
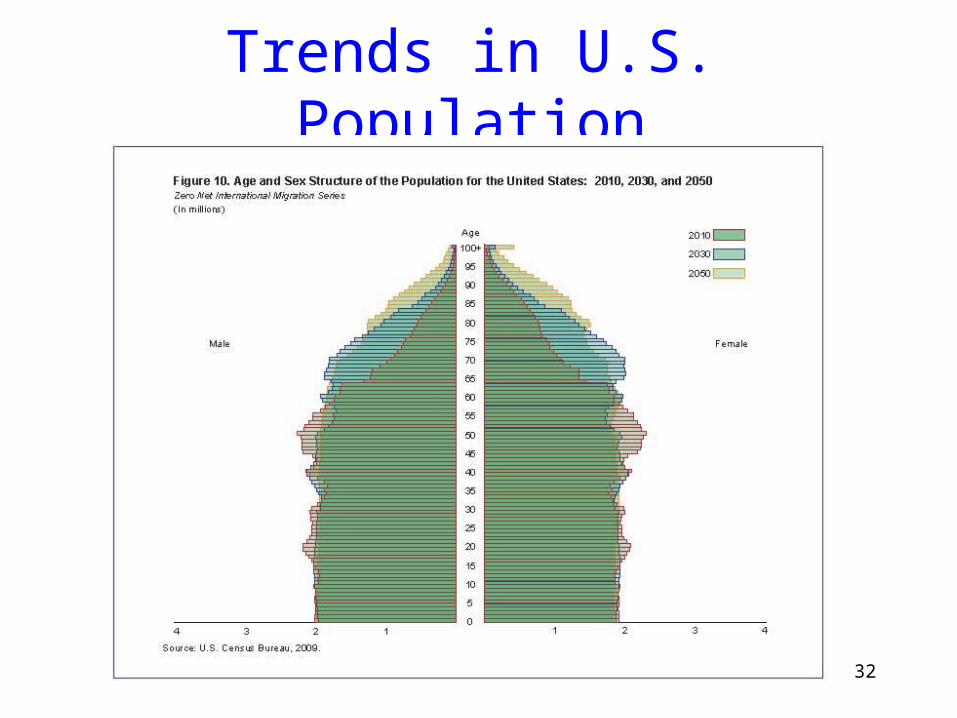
Trends in U.S. Population
32
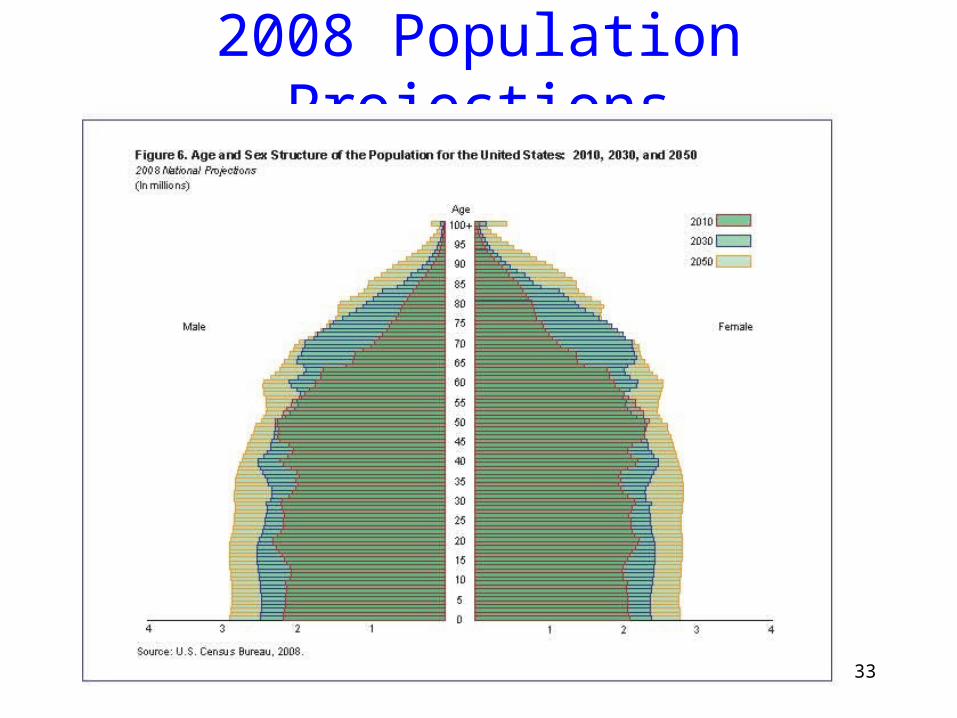
2008 Population Projections
33
34
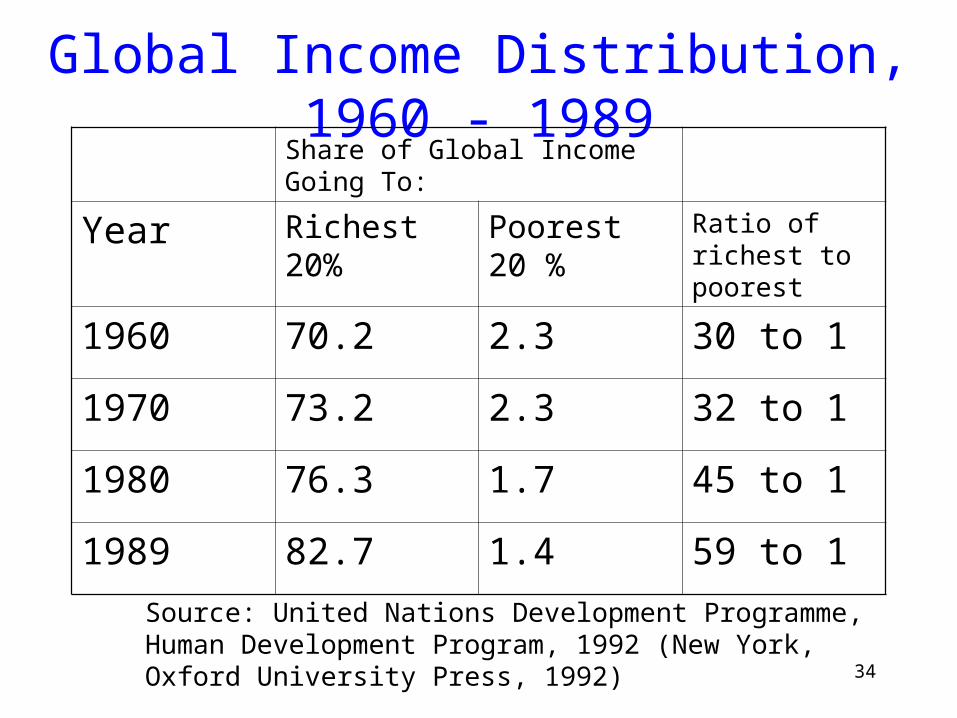
Global Income Distribution, 1960 - 1989Share of Global Income Going To:
Year Richest 20% Poorest 20 % Ratio of richest to poorest
1960 70.2 2.3 30 to 1
1970 73.2 2.3 32 to 1
1980 76.3 1.7 45 to 1
1989 82.7 1.4 59 to 1
Source: United Nations Development Programme, Human Development Program, 1992 (New York, Oxford University Press, 1992)
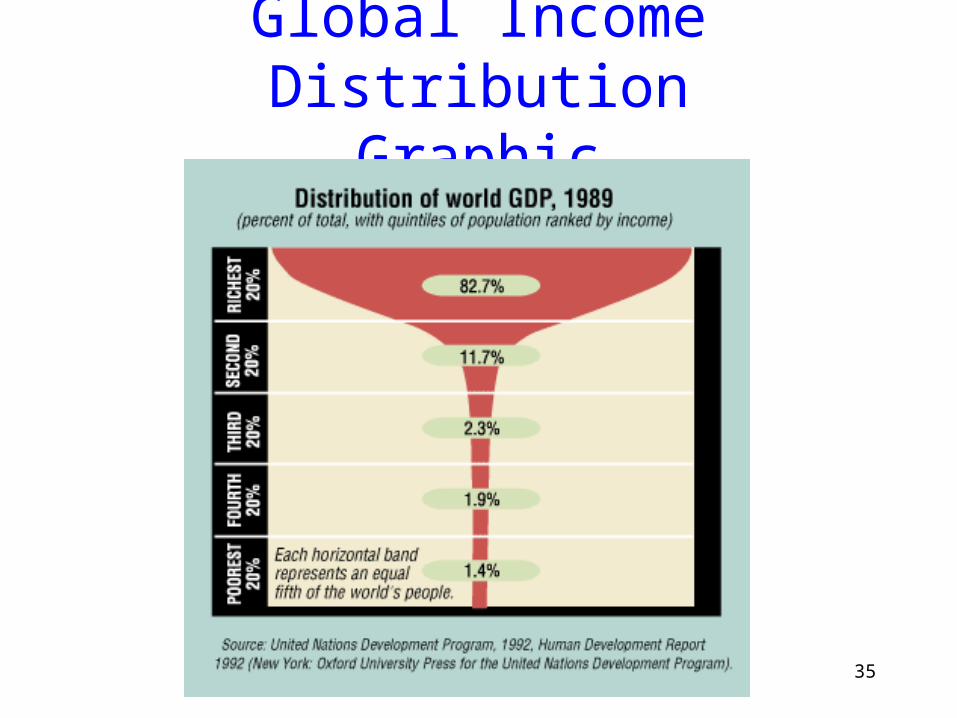
Global Income Distribution Graphic
35
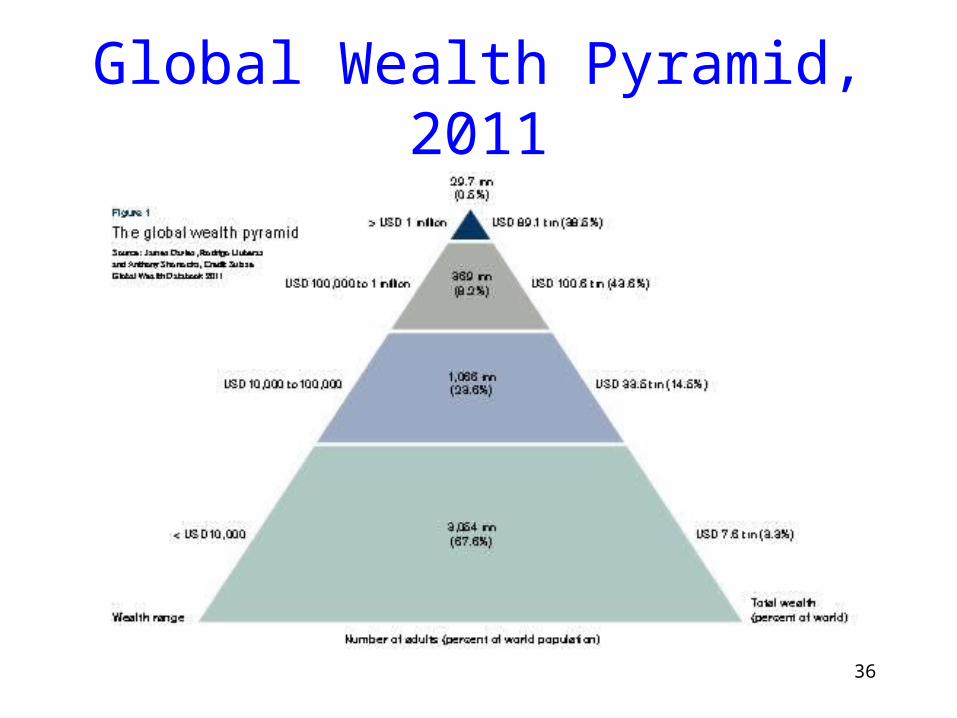
Global Wealth Pyramid, 2011
36

Food Distribution Animation
37
http://vimeo.com/moogaloop.swf?clip_id=8812686
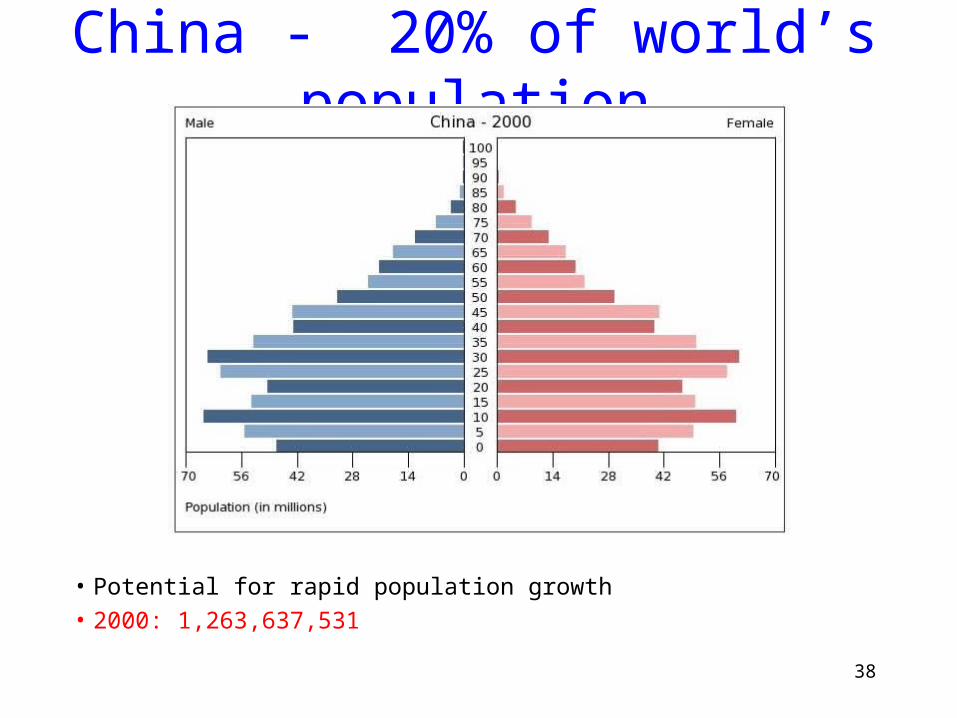
China - 20% of world’s population
• Potential for rapid population growth
• 2000: 1,263,637,531
38
39
China: "one-child-per-couple" policy since 1979
• Rewards for having only one child: grants, additional maternity leave, increased land allocations. Children get preferential treatment in education, housing, and employment.
• Couples punished for refusing to terminate unapproved pregnancies, for giving birth when under the legal marriage age, and having an approved second child too soon.
• Penalties include fines, loss of land grants, food, loans, farming supplies, benefits, jobs and discharge from the Communist Party.
• In many provinces sterilization is required after the couple has had two children.
40
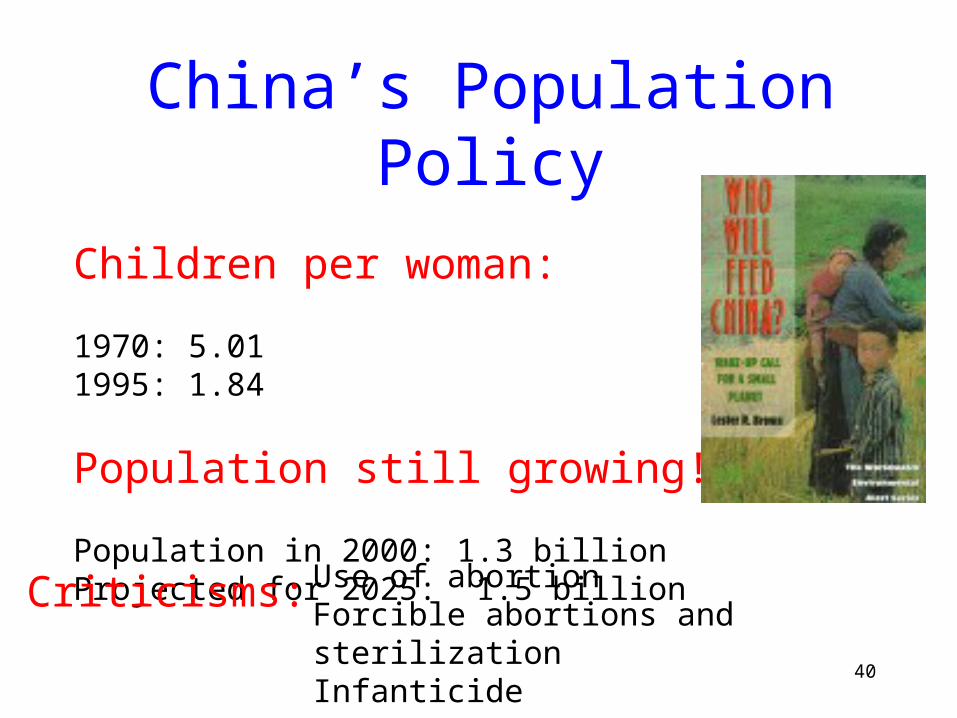
China’s Population Policy
Children per woman:
1970: 5.011995: 1.84
Population still growing!
Population in 2000: 1.3 billion Projected for 2025: 1.5 billion
Use of abortion Forcible abortions and sterilizationInfanticide
Criticisms:
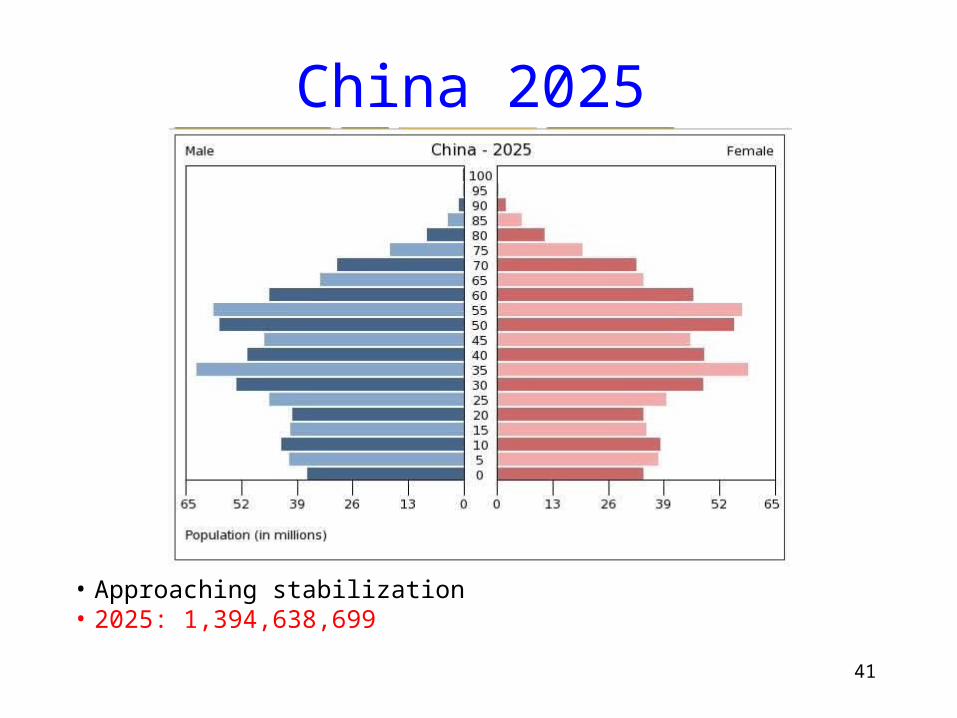
China 2025
• Approaching stabilization• 2025: 1,394,638,699
41
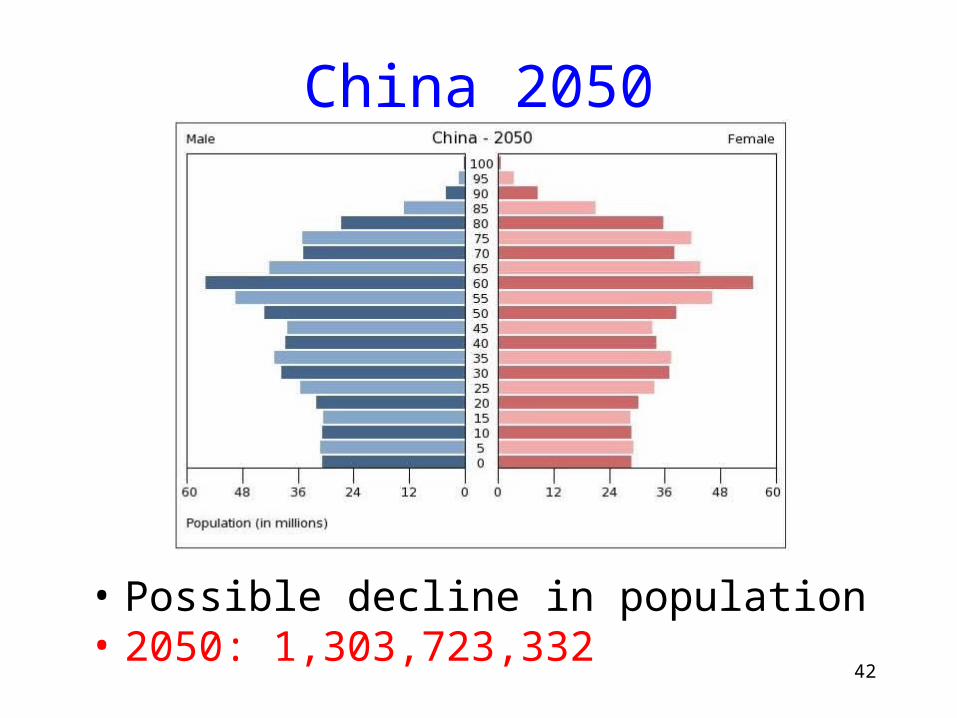
China 2050
• Possible decline in population• 2050: 1,303,723,332
42
43
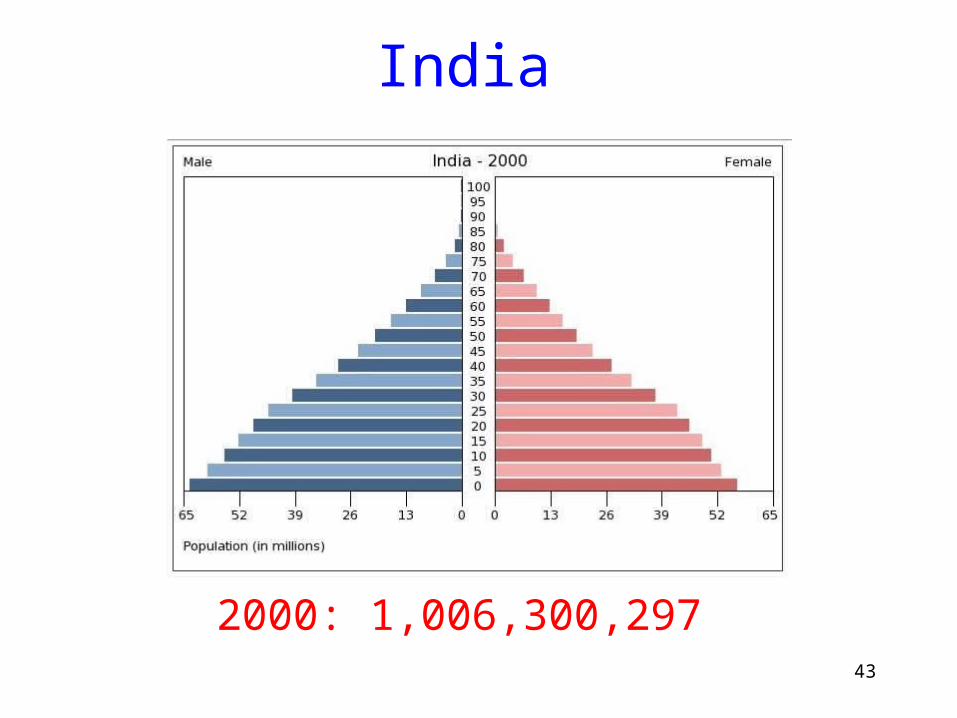
2000: 1,006,300,297
India
44
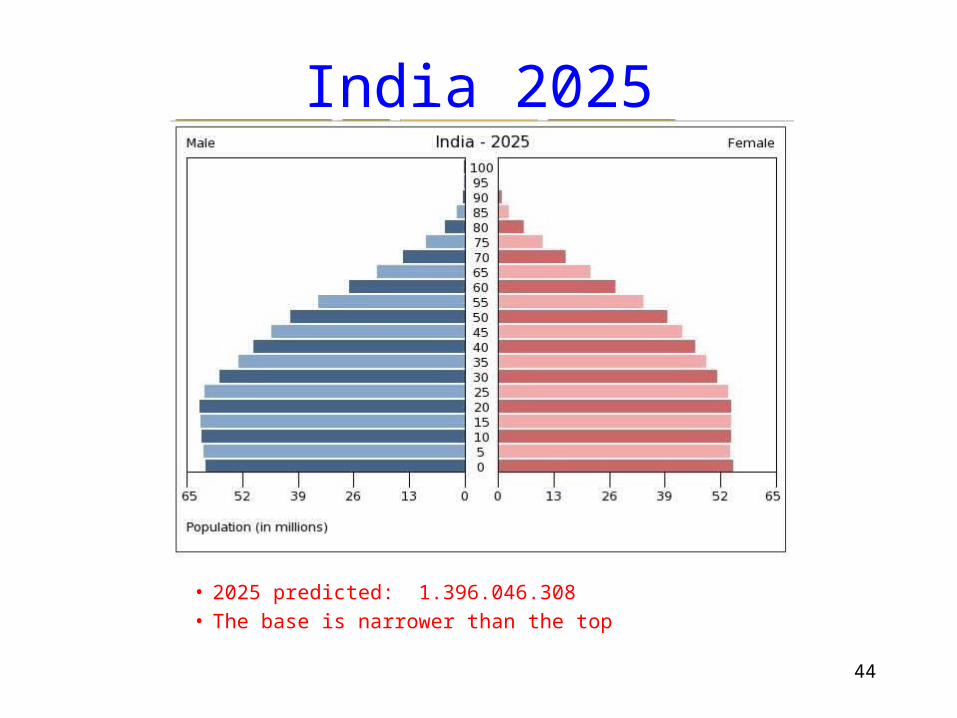
India 2025
• 2025 predicted: 1.396.046.308
• The base is narrower than the top
45
India 2050
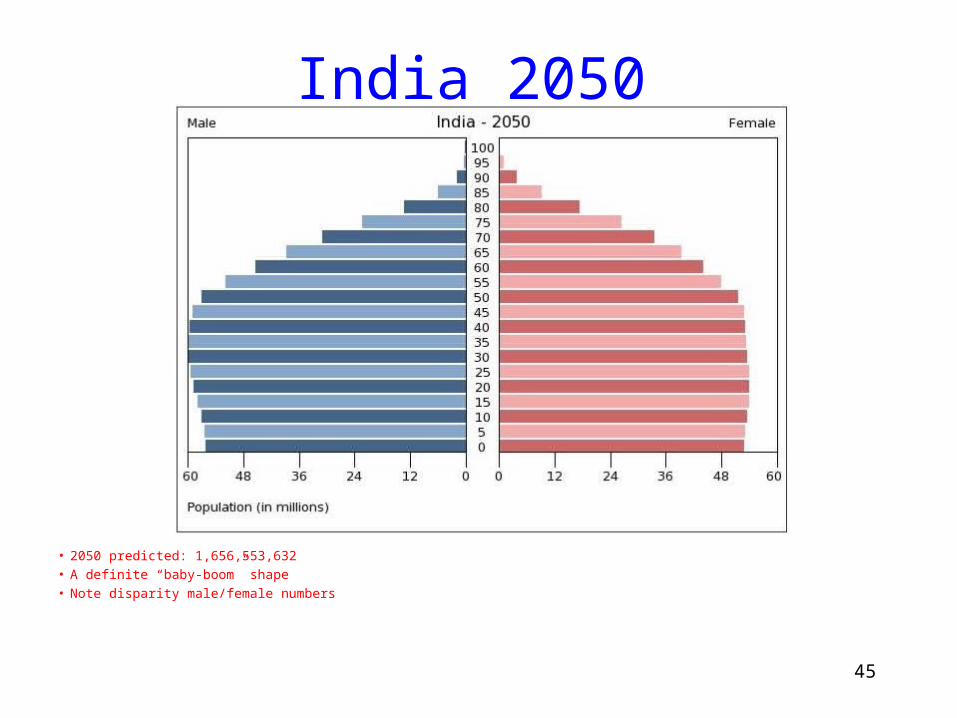
• 2050 predicted: 1,656,553,632 • A definite “baby-boom” shape• Note disparity male/female numbers
46
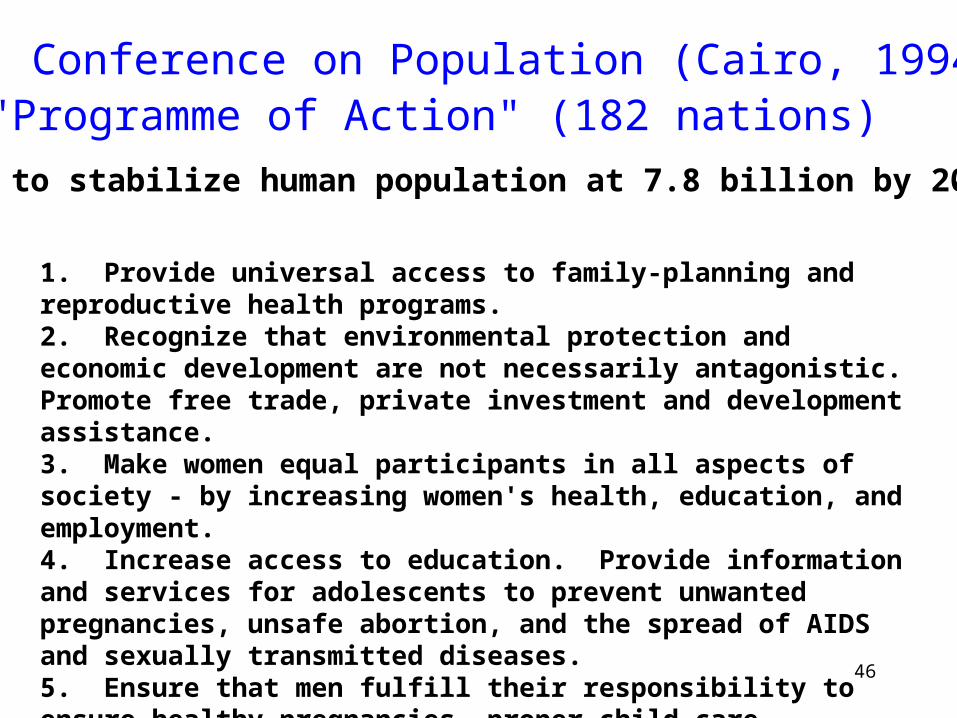
U.N. Conference on Population (Cairo, 1994)"Programme of Action" (182 nations)
Goal: to stabilize human population at 7.8 billion by 2050
1. Provide universal access to family-planning and reproductive health programs.2. Recognize that environmental protection and economic development are not necessarily antagonistic. Promote free trade, private investment and development assistance.3. Make women equal participants in all aspects of society - by increasing women's health, education, and employment.4. Increase access to education. Provide information and services for adolescents to prevent unwanted pregnancies, unsafe abortion, and the spread of AIDS and sexually transmitted diseases.5. Ensure that men fulfill their responsibility to ensure healthy pregnancies, proper child care, promotion of women's worth and dignity, prevention of unwanted pregnancies, and prevention of the spread of AIDS and sexually transmitted diseases.
47
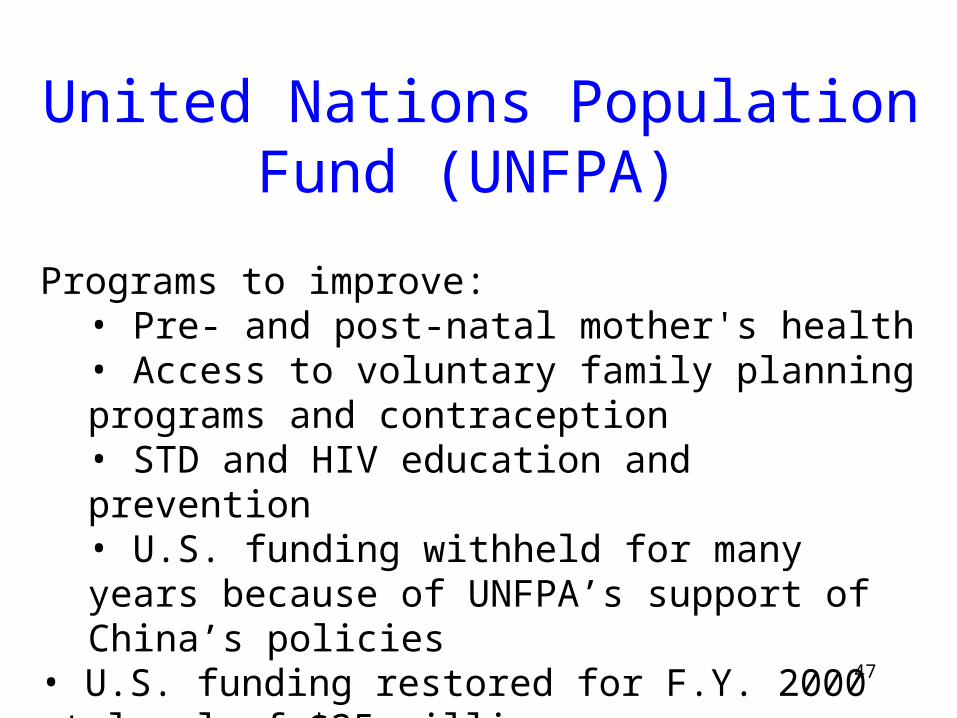
United Nations Population Fund (UNFPA)
Programs to improve: • Pre- and post-natal mother's health • Access to voluntary family planning programs and contraception• STD and HIV education and prevention• U.S. funding withheld for many years because of UNFPA’s support of China’s policies
• U.S. funding restored for F.Y. 2000 at level of $25 million
48
Slowing Population Growth
• The HIV epidemic is measurably slowing population growth
• Nowhere is this more evident than in sub-Saharan Africa, a region of 800 million people, where the epidemic is spiraling out of control
• If a low-cost cure is not found soon, countries with adult HIV infection rates over 20 percent, such as Botswana, South Africa, and Zimbabwe, will lose one fifth or more of their adult population to AIDS within the next decade
49
Slowing Population Growth
• When the United Nation's demographers did their biennial update of world population numbers and projections in October of 1998, they reduced the projected global population for 2050 from 9.4 billion to 8.9 billion – in 2009, it is 9.1 billion
• Of this 500 million drop, two thirds was because of falling fertility - that's the good news
• The bad news is that one third of the fall was the result of rising mortality from AIDS