Embed Size (px)
Citation preview

1
INFLATION

2
DefinitionsDefinitions
• Inflation: a sustained increase in all money prices
• Deflation: a sustained decrease in all money prices
• Anticipated inflation: inflation which is correctly foreseen
• Unanticipated inflation: inflation which is unforeseen or incorrectly foreseen as to its timing, rate or duration

3
Question for Discussion
1. Are the following examples of inflation?(a) There is a rise in the price of only single good.(b) There is a once-and-for-all rise in the price level.(c) There is a temporary rise in the price level, like the p
rice of vegetables rises after typhoon or flood.
All the 3 cases are not examples of inflation. Inflation is a general and continuous rise in the money prices of goods and services. The 3 cases do not fit in the definition of inflation.

4
Answer
(a) A rise in the price of only one good is not a general rise in the price level.
(b) A once-and-for-all increase in general price level is not a continuous rise in price level.
(c) A temporary increase in the price level(e.g., a rise in the price of fruit and vegetables after a typhoon) is not a persistent and continuous rise in price level.

5
Measurement of Inflation
1. Meaning of price indexes
A price index is a series of indexed numbers constructed according to the change in the prices of goods and services over a period of time.
Examples: Consumer price indexes (CPIs)
Implicit GNP or GDP deflator

6
How is the CPI computed?How is the CPI computed?
Current year prices are compared to prices of a similar basket of goods and services in a base year

7
What is a Base Year?What is a Base Year?
A year chosen as a reference point for comparison with some earlier or later year

8
Why is the CPI always 100 Why is the CPI always 100 in the Base Year?in the Base Year?
The numerator and the denominator of the CPI formula are the same in the base year

9
CPI = CYPBYP
*CYP = cost of the market basket of products at current-year prices
*BYP = cost of the market basket of products at base-year prices
X 100
10
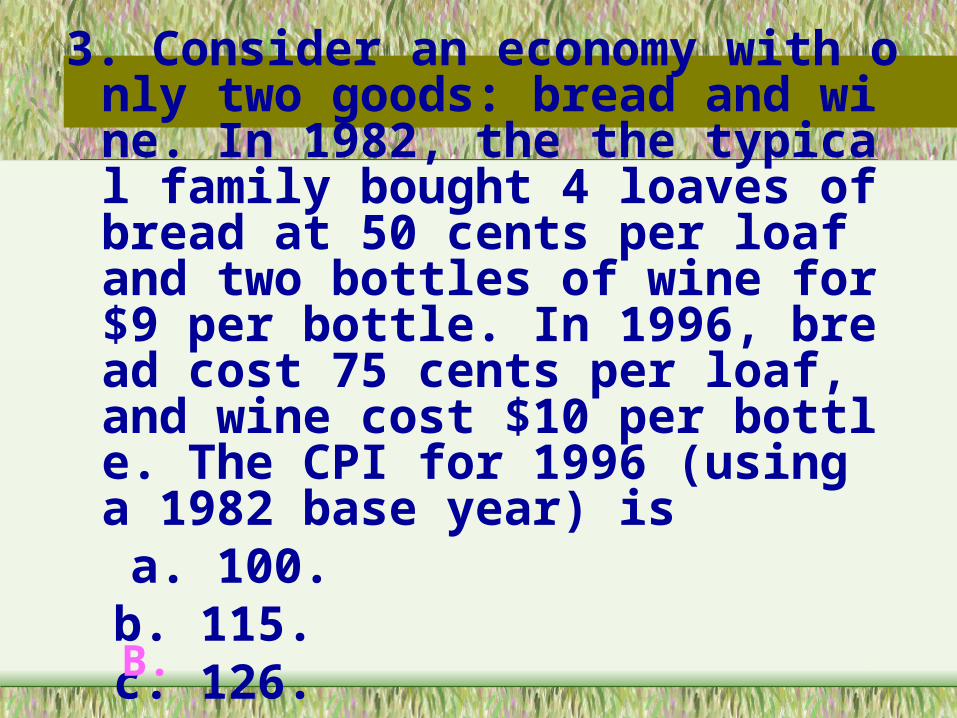
3. Consider an economy with only two goods: bread and wine. In 1982, the the typical family bought 4 loaves of bread at 50 cents per loaf and two bottles of wine for $9 per bottle. In 1996, bread cost 75 cents per loaf, and wine cost $10 per bottle. The CPI for 1996 (using a 1982 base year) is a. 100.b. 115.c. 126.d. 130.B.

11
CPI = CYPBYP
*CYP = cost of the market basket of products at current-year prices
*BYP = cost of the market basket of products at base-year prices
X 100
$23$20
X 100115 =
What about HKSAR CPI?

12
How is theHow is theInflation Rate computed?Inflation Rate computed?
The annual inflation rate is computed as the percentage change in the official CPI from one year to the next
13
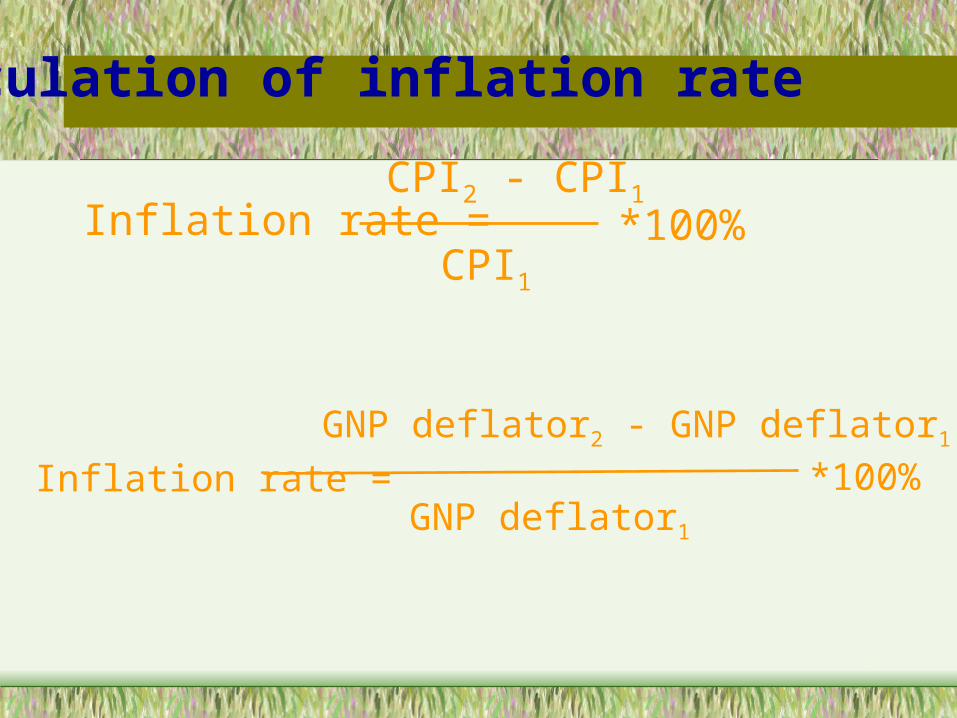
Calculation of inflation rate
Inflation rate = CPI2 - CPI1
*100% CPI1
*100% Inflation rate =
GNP deflator2 - GNP deflator1
GNP deflator1

14
Year
12345
CPI
100110115120125
Exhibit 5

15
4. As shown in Exhibit 5, the rate of inflation for Year 2 is a. 5 percent.b. 10 percent.c. 20 percent.d. 25 percent.
B. A percent increase or decrease between two numbers is the difference divided by the original number. In this case, it is 10 / 100 = 10%

16
5. As shown in Exhibit 5, the rate of inflation for Year 5 is a. 4.2 percent.b. 5 percent.c. 20 percent.d. 25 percent.
A. A percent increase or decrease between two numbers is the difference divided by the original number. In this case, it is 5 / 120 = 4.2%

17
Question for Discussion
2. Read the following table and answer the questions.
Annual Average of CPI(A)Base Year 1988 1989 1990 1991 1992 19931984-85 117.5 129.4 142.0 159.1 174 188.81989-90 84.6 93.1 102.2 114.5 125.2 135.9
(a) Compute the inflation rate in 1989 and 1993 respectively, taking 1989-90 as the base year.
18
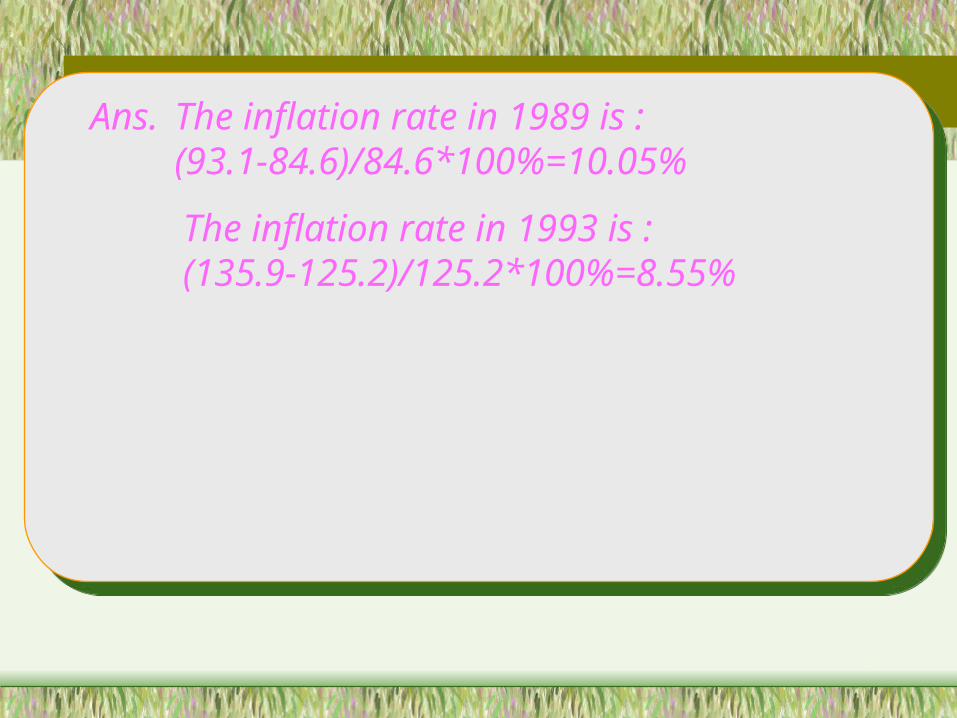
Ans. The inflation rate in 1989 is : (93.1-84.6)/84.6*100%=10.05%
The inflation rate in 1993 is : (135.9-125.2)/125.2*100%=8.55%

19
Refer to the following CPIs A & B of Hong Kong.
95C6
Year
1992
1993
Index A
125.2
135.9
Index B
125.1
136.1
(a) Calculate the inflation rates in 1993 as measured by the two CPIs respectively. Give TWO reasons to explain why the two inflation rates are different. (6 marks)

20
Implicit GNP deflator
Implicit GNP deflator = Nominal GNP
Real GNP *100
The GDP figures (in HK$ millions) for the last 3 years as follows:
93B1
At current market prices
At constant 1980 prices
1989
499,157
254,434
1990
555,856
262,189
1991
633,023
272,480
(a) What are the GDP implicit price deflators for all 3 years? (1980=100) Show your working.

21
The GDP figures (in HK$ millions) for the last 3 years as follows:
93B1
At current market prices
At constant 1980 prices
1989
499,157
254,434
1990
555,856
262,189
1991
633,023
272,480
(b) What are the inflation rates as measured by the GDP deflators for 1990 and 1991? Show your working.

22
Functions of Price Functions of Price IndexesIndexes
to measure the value or purchasing power of money
to show the cost of living
to reflect on the economic situation (the intensity ofinflation/deflation) and facilitate the formulation of policies
to estimate the state of a country in international trade

23
Problems of Using PIsProblems of Using PIsA. Sample bias: CPI covers only some selected consumer goods in the economy. Such consumption basket may not be a representative one. (Does GDP deflator have the same problem?)
B. Change in Quality: Since the price indexes do not consider changes in the quality of goods, they may overstate the inflation rate

24
8. Suppose a typical automobile tire cost $50 in 1982 and had a useful life of 40,000 miles. In 1995, the typical automobile tire cost $75 and had a useful life of 75,000 miles. If no adjustment is made for mileage, the CPI would a. underestimate inflation between the two
years.b. overestimate inflation between the two years
.c. accurately measure inflation between the tw
o years.d. not measure inflation in this case.
b. Quality changes are difficult to measure. When the quality of items improves, increases in the CPI overstate the change in prices.

25
Problems of Using PIsProblems of Using PIs
C. Substitution Effect: Price index does not consider people making substitutions from relatively higher priced goods to lower priced goodsD. Changing spending pattern: As fixed weights are used in constructing the indexes, changes in spending pattern may not be represented.
E. Omission of capital goods: CPI does not consider the changes in the prices of capital goods. ( Does GDP deflator have the same problem?)

26
Does the makeup of the Does the makeup of the CPI change?CPI change?
As people’s tastes and preferences change, some of the goods and services that go into the basket change

27
P
Q0(a)
Figure 1 The causes of inflation
AD
AS
AD’
P
Q0(b)
AD
ASAS’
Causes of InflationCauses of Inflation

Equation of ExchangeEquation of Exchange
• The nominal money supply (M) is the total dollar value of all paper money and coins in the economy.

Equation of ExchangeEquation of Exchange
• The equation of exchange says that the nominal quantity of money multiplied by the velocity of money equals nominal GDP, (PY).
MV=PY

Equation of ExchangeEquation of Exchange
• The price level equals the nominal money supplied multiplied by velocity divided by real GDP.
P=MV/Y

What Affects/Causes Inflation?What Affects/Causes Inflation?
• Any one of the following raises inflation: Increases in the growth rate of the money supply.
Increases in the growth rate of velocity.
Reductions in the growth rate of real GDP.

Equilibrium InflationEquilibrium Inflation
• The equilibrium rate of inflation is the growth rate of the equilibrium price level.
• Solving for the equilibrium rate of inflation:
% P = % M + % V - % y

33
The Ultimate Cause of The Ultimate Cause of InflationInflation
According to Q.T.M.: MV = PY
M/M+V/V=P/P+Y/Y
Since V/V = 0,
M/M - Y/Y = P/P

34
The Ultimate Cause of The Ultimate Cause of InflationInflationInflation (i.e. P/P > 0) occurs
when
a. the stock of money increases at a rate faster than the supply of real output (i.e. M / M > Y / Y) ORb. the quantity of goods is reduced (i.e. Y / Y < 0) without an equivalent reduction in the money supply (i.e. M / M =0)

Short- and Long-Run Inflation Short- and Long-Run Inflation and Money Supply Growthand Money Supply Growth
• Generally, inflation reflects the growth rate of the money supply. Because of changes in velocity (V) and real GDP (Y), they are not closely related in the short run.Over long periods of time, money growth and inflation move closely together.
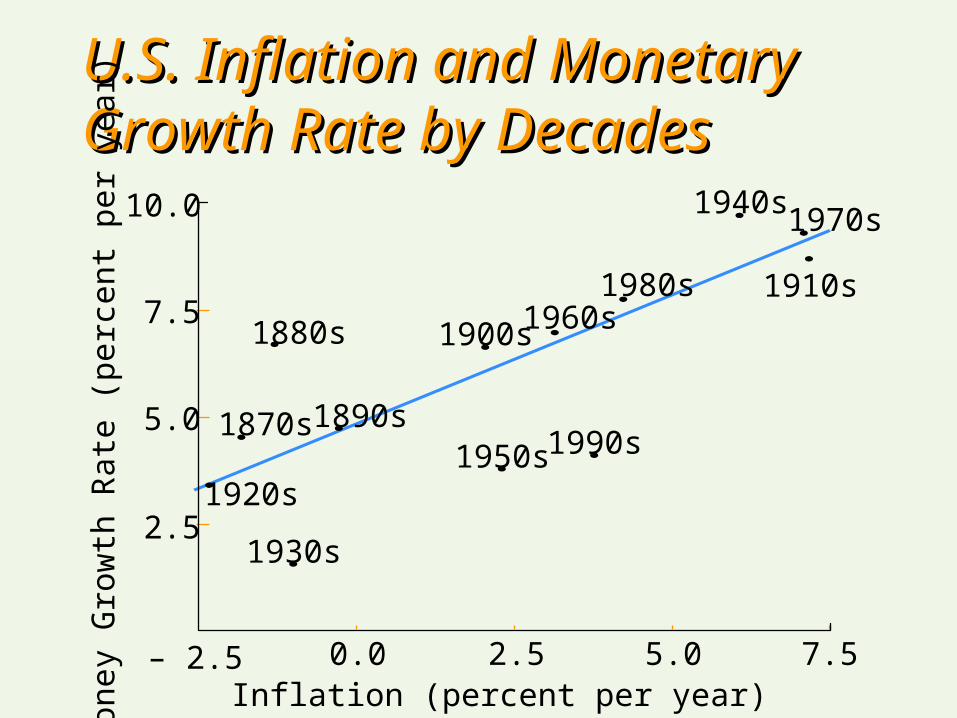
U.S. Inflation and Monetary U.S. Inflation and Monetary Growth Rate by DecadesGrowth Rate by Decades
7.5
10.0
Mon
ey G
rowt
h Ra
te (p
erce
nt p
er y
ear)
5.02.5– 2.5Inflation (percent per year)
7.5
5.0
1880s
2.5
0.0
1870s 1890s
1920s
1930s
1950s 1990s
1900s1960s1980s
1940s 1970s
1910s

Inflation and Money Supply Inflation and Money Supply Growth in the United StatesGrowth in the United States
1995 1998
16%
Inflation
Infla
tion
and
Mon
ey G
rowt
h Ra
tepe
rcen
t per
yea
r
199019851980197519701965Money Growth 2 Years Earlier
12
8
4
Annual Inflation Rate
Annual Money Growth Rate (2 years earlier)

Figure 7.2Figure 7.2 The relationship between The relationship between money growth and inflationmoney growth and inflation

40
The Ultimate Cause of The Ultimate Cause of InflationInflation
Therefore, inflation is only a monetary phenomenon. It will not last for a long time unless there is a sustained increase in the money stock relative (in %) to the real output.

41
Question for Discussion
3. Can inflation also exist in a barter economy?
Ans. Inflation can only exist in monetary economies but not in barter economies. This is because when the price of e.g. good X relative to the price of good Y increases, then the price of good Y relative to the price of good X will fall. It is impossible for a sustained increase in the prices of all goods.

42
• Monetary assets: claims to fixed amount of money in the future, e.g. money, bonds
• Monetary liabilities: obligations to pay those fixed amounts of money
• Real assets: claims to goods and services whose real values remain unchanged by inflation, e.g. cake coupons
• Real liabilities: obligations to deliver goods and services whose value remain unchanged by inflation.
Effects of Inflation: Effects of Inflation: RedistribuRedistributive effecttive effect

43
Redistributive effectRedistributive effect
• Net monetary creditors: monetary assets > monetary liabilities
• Net monetary debtors: monetary liabilities > monetary assets

Inflation causes wealth Inflation causes wealth redistributionredistribution
NV RV Effects
MA Constant Fall Hurt
ML Constant Fall Benefit
RA Rise Constant Gain if % rise > IR
RL Rise Constant Lose if % rise > IR

45
Real assets & liabilities: no redistributive effect
Monetary assets & liabilities
Anticipated inflation: no redistributive effect
Unanticipated inflation:
Redistributive effect: net monetary debtors gain
net monetary creditors lose
Redistributive effectRedistributive effect

46
Table 1 Balance sheets before and after unanticipated inflation for a net monetary debtor, showing real increase in equity
Before inflation
After inflation (Unanticipated doubling of price level)
Assets LiabilitiesCash $ 1,000 Debt $100,000House 200,000 Equity(Net Worth) 101,000
$201,000 $201,000
Assets LiabilitiesCash $ 1,000 Debt $100,000House 400,000 Equity(Net Worth) 301,000
$401,000 $401,000

47
Question for Discussion
4. Decide who are the gainers and losers during inflation.
Ans. If the monetary creditors do not foresee inflation correctly (i.e. underanticipated as the actual inflation rate is greater than the expected inflation rate), they may ask for an interest rate that cannot compensate the loss of the money’s purchasing power when the monetary debtors repay the money in the future. Thus, there is an income redistribution from the lenders to the borrowers: net monetary creditors lose and net monetary debtors gain during underanticipated inflation. Fixed money income earners lose and the government gains during underanticipated inflation.

48
Losers during Losers during underanticipatedunderanticipated inflainflationtion
• Underanticipated inflation: net monetary creditors e.g. lender
• Fixed income earners, e.g. bond holders, pensioners
• Public• Anyone whose growth rate of mon
ey income < inflation rate

49
-1%
Last year the Harrison family earned $50,000. This year their income is $52,000. In an economy with an inflation rate of 5 per cent, which of the following is correct?
a. The Harrison’s nominal income and real income have both risen.b. The Harrison’s nominal income and real
income have both fallen.c. The Harrison’s nominal income has fallen,
and their real income has risen. .d. The Harrison’s nominal income has risen,
and their real income has fallen. 52,000 - 50,000
50,000 - 5%,
4% - 5% =
d. % change real income =

50
Gainers during Gainers during underanticipatedunderanticipated infl inflationation
• Underanticipated inflation: Net monetary debtors e.g. borrower
• Government
• Anyone whose growth rate of money income > Inflation rate

51
Discuss how inflation affects the wealth of creditors and debtors when
98B5
(a) the inflation rate is correctly anticipated. (4 marks)
When inflation is correctly anticipated, both creditors and debtors will adjust the nominal interest rates by the inflation rate in the absence of excessive adjustment cost. The real interest rate creditors receive and debtors pay is the same as the expected amount. Wealth redistribution described above does not occur.
52
Discuss how inflation affects the wealth of creditors and debtors when
98B5
(b) the inflation rate is completely unanticipated. (4 marks)
When inflation is completely underanticipated, the nominal interest rate does not take into account sufficiently the inflation rate. As a result, the real interest rate creditors receive & debtors pay will be less than the expected amount. There is a redistribution of wealth from creditors to debtors.

53
Effects of InflationEffects of InflationInflation is a TAX: Inflation tends to redistribute income from the public to the government. It is a kind of tax without legislation.progressive income tax
Tax allowances
Government bonds
Tax on cash balances

54
Tax allowance : $100,000
Taxable income Tax rate
1st $100,000 10%
2nd $100,000 15%
3rd $100,000 20%
Person A: $90,000 $110,000
Person B: $200,000 $220,000
Inflation raises money income

Inflation tax: proportionately Inflation tax: proportionately more money income are taxablemore money income are taxable
Pre-tax income
Tax allowance Taxable income in %
$1000 $100 1000-100=900/1000=90%
$1100 $105 1100-105=905/1100=90.45%

56
Costs of InflationCosts of Inflation
• Misallocation of resources
– encourages speculation
– discouraged from carrying out long-term investment
– unwilling to accept money & insist on trading goods or services directly for other goods & services

57
Costs of InflationCosts of Inflation
Higher transaction costs in finding ways to hedge against inflation
Higher inflation rate => greater variability in relativeprice movements => greater uncertainties
Inflation encourages speculation rather than a productive use of saving, and discourages long-term investment projects

58
Costs of InflationCosts of Inflation
• Transaction costs:– Anticipated inflation: hedge against
inflation– Unanticipated inflation: obtain
information about future prices
• Higher & unanticipated inflation causes uncertainties – reduce the willingness to lend & borrow – reduce the willingness to invest
59
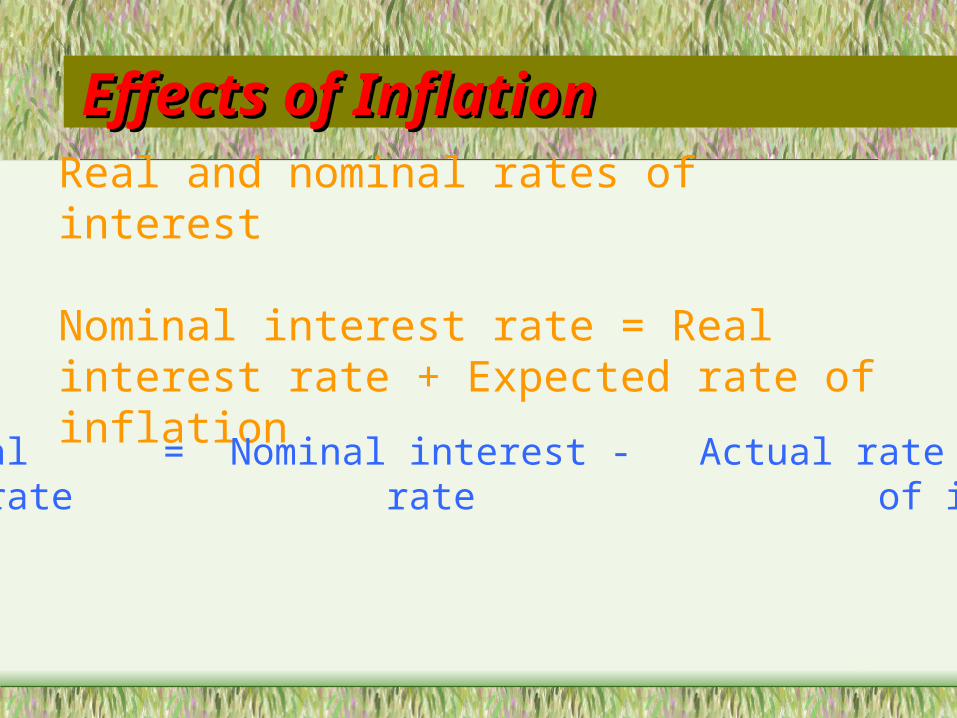
Effects of InflationEffects of Inflation
Real and nominal rates of interest
Nominal interest rate = Real interest rate + Expected rate of inflation
Actual real = Nominal interest - Actual rateinterest rate rate of inflation

60
If the nominal rate of interest is less than the inflation rate, a. lenders win.b. savers win.c. the real interest rate is negative.d. the economy is at full employment.
C. The real rate of interest is negative because the lender is receiving less money back, in real terms, than was lent out.

61
What is a Wage-price Spiral?What is a Wage-price Spiral?
A situation (vicious circle/+ve feedback) that occurs when increases in nominal wage rates are passed on in higher prices, which, in turn, result in even higher nominal wages and prices

62
Do people’s Expectations Do people’s Expectations affect Inflation?affect Inflation?Yes, expectations can
influence both demand-pull and cost-push inflation

63
• Inflation rates have declined worldwide
• Some countries such as Japan and China have deflation
• Some causes for concern– Lower commodity prices could devastate emerging
economies– Unions might not anticipate falling prices
• Don’t confuse deflation with falling relative prices
Issues and Applications:Issues and Applications:Is the World Facing the Danger of Deflation?Is the World Facing the Danger of Deflation?

9.3 Inflation and the Nominal 9.3 Inflation and the Nominal Interest RateInterest Rate
• The Fisher equation says that the nominal interest rate (R) equals the real interest rate (r) plus the expected rate of inflation (e).
R = r +e
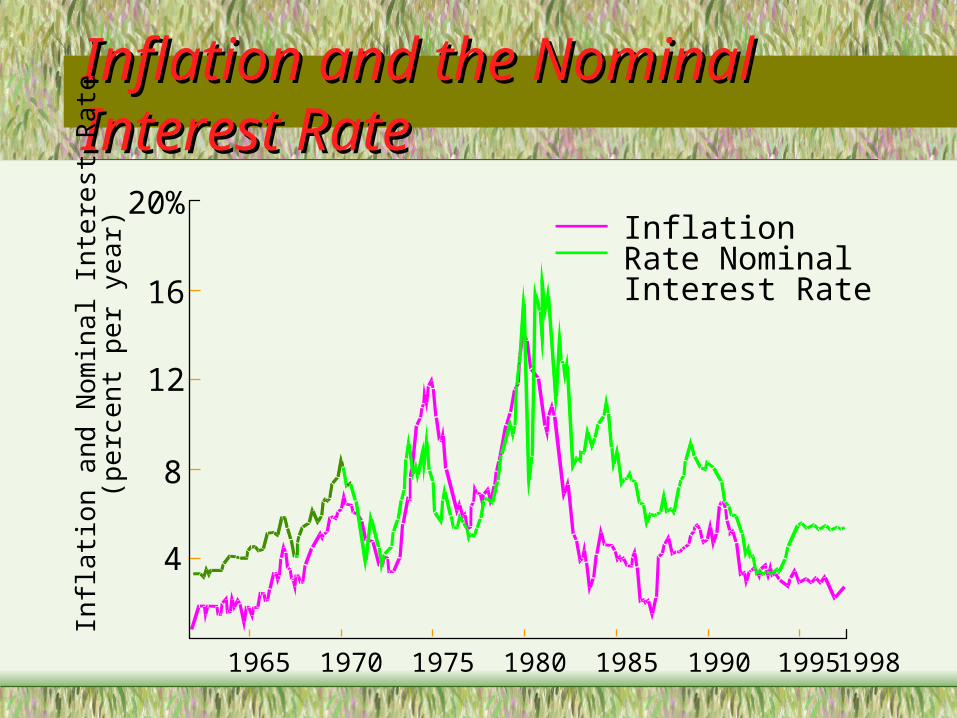
Inflation and the Nominal Inflation and the Nominal Interest RateInterest Rate
1995 1998
20%
Infla
tion
and
Nom
inal
Inte
rest
Rat
e(p
erce
nt p
er y
ear)
199019851980197519701965
Inflation Rate Nominal Interest Rate
12
8
4
16