Embed Size (px)
Citation preview
In-flight Performance and Calibration of the Chandra High Resolution Camera Imager (HRC-I)
A. Kenter, J.H. Chappell, R. Kraft, G. Meehan, S.S. Murray, M. Zombeck, K.T. Hole, M. Juda, RH. Donnelly,D. Patnaude, D. Pease, C. Wilton, P. Zhao, G. Austin
Smithsonian Astrophysical Observatory, 60 Garden St., Cambridge, MA 02138
G. Fraser, J. Pearson, J. Lees, A. BruntonUniversity of Leicester, Leicester, LE1 7RH, England
M. Barbera, A. Collura, S. SerioOsservatorio Astronomico G.S. Vaiana, 1-90134 Palermo, Italy
ABSTRACT
The High Resolution Camera (HRC) is one of the two focal plane instruments on the NASA Chandra X-rayObservatory (CXO) which was successfully launched on July 23, 1999. The CXO performs high resolutionspectroscopy and imaging in the X-ray band of 0.07 to 10 keV. The HRC instrument consists of two detectors,HRC-I for imaging and HRC-S for spectroscopy. The other focal plane instrument is the Chandra CCD ImagingSpectrometer (ACTS).
Each HRC detector consists of a thin aluminized polyimide window, a chevron pair of microchannel plates(MCPs) and a crossed grid charge readout. The HRC..I is an ' 100 x 100 mm detector optimized for highresolution imaging and timing, the HRC-S is an '- 20 x 300 mm detector optimized to function as the readoutfor the Low Energy Transmission Grating (LETG).
In this paper we present and compare flight results with the latest results of the ground calibration for theHRC-I detector. In particular we will compare ground and in flight data on detector background, effective area,quantum efficiency and point spread response function.
The development of the HRC is a collaborative effort between The Smithsonian Astrophysical Observatory,University of Leicester UK and the Osservatorio Astrcnomico, G.S. Vaiana, Palermo Italy.
Keywords: Chandra, AXAF, High Resolution Camera.
1 INTRODUCTION
The Chandra X-ray Observatory is a major space observatory designed to perform high resolution imaging andspectroscopic observations in the 0.07 to 10 keV X-ray energy band. The major observatory components are theHigh Resolution Mirror Assembly (HRMA) , two sets of objective transmission gratings and the two focal planeinstruments. The HRMA consists of four pairs of nested iridium coated Wolter type I optics. The HRMA has a,.. 10 meter focal length and a plate scale of 49gm per arcsec. The objective transmission gratings consist of theLow Energy Transmission Gratings (LETG) and the High Energy Transmission Gratings (HETG). The twofocal plane instruments are the AXAF CCD Imaging Spectrometer (ACTS) and the High Resolution Camera(HRC).
The HRC consists of two Microchannel Plate (MCP) based detectors; one for high resolution large field of viewimaging and a second detector which is optimized as the readout for the LETG. The HRC detectors havespatial resolutions of <0.5 arcsec and limited inherent non-dispersive energy resolution of 1.
More in depth discussions of the Chandra mission, spacecraft, other instruments and subsystems are presented
In X-Ray Optics, Instruments, and Missions III, Joachim E. Trumper, Bernd Aschenbach, Editors,Proceedings of SPIE Vol. 4012 (2000) • 0277-786X/OO/$1 5.00 467
Downloaded from SPIE Digital Library on 13 Sep 2010 to 128.103.149.52. Terms of Use: http://spiedl.org/terms
1234 Papers discussing the HRC-S detector in-flight calibration can be found elsewhere in theseproceedings .
2 THE HIGH RESOLUTION CAMERA (HRC)
The HRC detectors are technological descendants of the highly successful Einstein and ROSAT High ResolutionImagers (HRIs).7'8 The HRC detectors differ from their predecessors primarily in size, geometry and electronicimplementation. In addition, the HRC detectors use MCPs fabricated from low radioactive content glass andthe HRC instrument employs an active cosmic ray anti-coincidence shield.
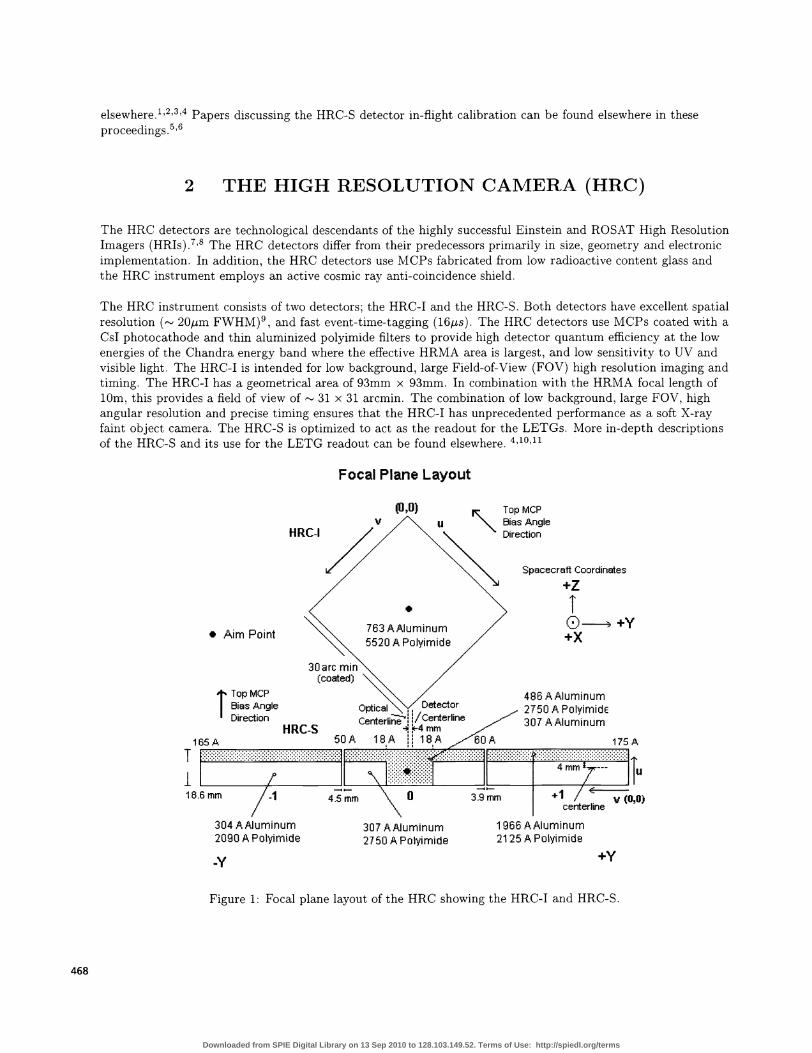
The HRC instrument consists of two detectors; the HRC-I and the HRC-S. Both detectors have excellent spatialresolution ('-' 2Oim FWHM)9, and fast event-time-tagging (16,.ts). The HRC detectors use MCPs coated with aCsI photocathode and thin aluminized polyimide filters to provide high detector quantum efficiency at the lowenergies of the Chandra energy band where the effective HRMA area is largest, and low sensitivity to UV andvisible light. The HRC-I is intended for low background, large Field-of-View (FOV) high resolution imaging andtiming. The HRC-I has a geometrical area of 93mm x 93mm. In combination with the HRMA focal length oflOm, this provides a field of view of 31 x 31 arcmin. The combination of low background, large FOV, highangular resolution and precise timing ensures that the HRC-I has unprecedented performance as a soft X-rayfaint object camera. The HRC-S is optimized to act as the readout for the LETGs. More in-depth descriptionsof the HRC-S and its use for the LETG readout can be found elsewhere. 4,10,11
Focal Plane Layout
307 A Aluminum2750 A Polyimide
1966 AAluminum21 25 A Polylmide
468
Figure 1: Focal plane layout of the HRC showing the HRC-I and HRC-S.
HRC-I
(0,0)V
.763 A Aluminum5520 A Polyimide
• Aim Point
' Top MCPBias AngleDirection
HRC-S
Top MCP
u Bias AngleDirection
Spacecraft Coordinates
I..'(
486 A Aluminum2750 A Polyimidc307 A Aluminum
175 A
II18.6mm -1 0
2090 A Polyimide
3.9 mm v (0,0)centerline
-Y +Y
Downloaded from SPIE Digital Library on 13 Sep 2010 to 128.103.149.52. Terms of Use: http://spiedl.org/terms

The HRC-I detector consists of an aluminized polyimide UV/Ion Shield (UVIS); a CsI photocathode chevronpair of MCPs and a Crossed Grid Charge Detector (CGCD) readout. The CsI photocathode is deposited on theinput face of front MCP. The HRC instrument also employs passive and active shielding to reduce itsbackground event rate. A schematic representation of the HRC-I components is presented in Figure 2. TheUVIS blocks out-of-band ultraviolet and visible photons and low energy ions and electrons. The CsI enhancesphotoelectric conversion of the X-ray photon. The two MCPs in the chevron arrangement provide electronmultiplication of 2 x iO while minimizing ion feedback. The CGCD collects the resulting electron cloud, fromwhich the electronics determine the pulse height amplitude, arrival time, and position of the X-ray photon.
Figure 2: Schematic representation of HRC type detectors showing UV ion shield, photocathode, chevron pair ofMCPs Crossed Grid Charge Detector (CGCD) readout and shielding.
2.1 The UV/Ion Shields
The UVIS for the HRC detectors consists of an aluminized thin plastic membrane. For the HRC-I detector, theUVIS consists of - 800)1 aluminum vacuum deposited on 5500A polyimide film. The UVIS was manufacturedby the Luxel Corporation of Friday Harbor Washington.
The function of the UV ion shield is multifold: it blocks the sensitive photocathode from seeing out-of-bandultra-violet and visible light; it shields the detector from low energy electrons and ions, and it provides a welldefined electric field above the input MCP. A more detailed description of the UVIS function, tests, and of theHRC UV ion shield calibration, have been presented elsewhere12'13"4.
469
,
X-rayliv Photon
UVilon Shield
High Enerijy
X-ray
Input MCP Photocathode
—
yyP Eu/IIi/1IjI/IIjiiI/1I/1//III//IIII/II/J//1/I !.(
OutputMCP :D. •0 ...•... O••
ov32011
1800
1150
300
—TnntalumShiekhng
: Conmic Ray
Downloaded from SPIE Digital Library on 13 Sep 2010 to 128.103.149.52. Terms of Use: http://spiedl.org/terms

470
2.2 Photocathode
To enhance the detector quantum efficiency a 14000)1 CsI photocathode was vacuum deposited on to theinput face of the top MCP. The resulting photocathode enhances quantum efficiency; however, it is susceptibleto damage from exposure to humid air. Before and during launch, the HRC MCPs were continually undervacuum or in a dry nitrogen atmosphere.
2.3 Microchannel Plates
The HRC-I MCPs are 1.2mm thick and are 100mm x 100mm square. They have 1Oim pores on 12im centers.Both the top and bottom MCPs were sliced to give the pores a nominal 6° bias angle. The pair are assembledwith their pore angles in a chevron configuration to minimize ion feedback. The bias angle introduces anazimuthal asymmetry in quantum efficiency for non-normal incidence illumination. However for a 6° bias, thisasymmetry maximize the overall detector efficiency when it is averaged over energy and the incident cone anglesfrom the HRMA. The HRC-I MCPs were manufactured by the Galileo Electro Optics Corporation (GEOC; nowBurle) in Sturbridge, MA. These MCPs are manufactured from a proprietary low internal radioactivity glass.
2.4 The Crossed Grid Charge Detector
The electron charge cloud exiting the rear of the output MCP is collected by two orthogonal grids of gold alloywires. These wires are separated and held in place by a laser-ruled alumina ceramic block. Beneath the twoplanes of wires is a deposited gold reflector plane which is biased to ensure 100% collection of the chargecloud. The grid wires are nominal 1OOtm diameter on 2OOm spacing. Each wire is connected to its nearestneighbor with a 10 k resistor. Every eighth wire is then connected to a charge sensitive amplifier. There are 64amplifiers or "taps" for each axis. The output face of the rear MCP is attached to a separate "MCP trigger"charge amplifier. This "MCP trigger"amplifier senses the exit of the charge cloud and initiates the the on-boardelectronics which then process an event.
2.5 Event Processing
2.5.1 "Three Tap" Algorithm
The X-ray position is determined by calculating the centroid of the charge cloud exiting the rear MCP via the"three tap" algorithm. In short, the three tap algorithm determines the charge cloud centroid using acombination of digital and analog electronics and off-line processing. Fast discriminators and logic circuits firstdetermine a "coarse" position, which is the amplifier with maximum detected charge. Analog switches thenselect the three amplifiers centered on that coarse position and steer them to analog to digital converters. Thecoarse position and three digitized values are telemetered and then used off-line on the ground to calculate theevent position. This process is performed for each axis. The reconstructed X-ray position can then be written asthe sum of a coarse position and a charge centroid term centered on the coarse position:
pOS = Cj + (— P
x (1)Q_1 + Q, + Q+1where cp is the coarse position,Q1 is the charge measured on the CPj+l tap, and L is the distance betweentaps. Since the charge cloud extends beyond the two outer taps, each of the outer amplifiers underestimates theamount charge needed to calculate the true centroid. For an event perfectly centered on the middle tap, the
Downloaded from SPIE Digital Library on 13 Sep 2010 to 128.103.149.52. Terms of Use: http://spiedl.org/terms

charge loss beyond the outer two taps is symmetric arid cancels. If however, the event position is not over thecenter of a tap, the fractional error due to the charge loss in the two surrounding taps is different and producesa small systematic error in the reconstructed position. The small systematic positional error combined with thecoarse position logic produce "gaps" in the HRC images. These gaps are perfectly aligned with the detectoraxes and correspond to positions exactly half-way between amplifier taps. Since the gaps are systematic, theycan and are removed.
2.6 Modified "Three Tap" Algorithm
The spatial distribution of the charge cloud leaving the rear of the 2nd MCP has a very specific shape for X-rayinduced events. This shape has often been modeled as the combination of a Gaussian and a Lorentziandistribution. 15 Due to this specific shape, it has been observed and simulated via Monte Carlo techniques thatthe fine position term:
( Qcpj Qcpi—i (9Q_1 +Q+1'
and the complementary term:
+ Q: + Q+, (3)
are highly correlated, in fact the shape of a scatter plot of the two quantities for X-ray induced events closelydescribes a hyperbola. A scatter plot of the two quantities is presented in Figure 3. Non X-ray events,primarily those due to the passage of charged particles, produce charge distributions that are often larger, andare spatially extended and complex. As such, it is possible to remove many non X-ray background events byscreening those events that do not fit the hyperbola. Furthermore, since the charge distribution is centrallypeaked, the complement Q term is larger and less susceptible to noise induced errors than the Q1 —Q_1difference term. It is therefore possible to use the complement term, and the best fit hyperbolic locus to correctthose events where instrumental noise has compromised the three-tap fine position. Results from this modifiedthree-tap algorithm, or "hyperbolic" filter for background reduction and imaging performance are presented inthe background and PSF sections of this paper. A much more detailed explanation of this technique will bepresented in a future publication.
3 HRC-I IN-FLIGHT PERFORMANCE
The following sections will present the flight performa:nce of the HRC-I detector in comparison with preflightexpectations and models. The three main sections to be addressed are: background rates, effective area andpoint spread function (PSF).
3.1 Background and Shielding
The intrinsic HRC-I background counting rate has been minimized by constructing the HRC detectors ofmaterials with low radioactive content. In particular, MCPs fabricated from glass without potassium orrubidium have resulted in background reductions > 10 over previous MCP glass formulations. The bestlaboratory measurements incorporating external shielding with HRC-I type MCPs have achieved counting ratesof as low as O.O4cts s1cm2 (Kenter et. al. 1995)16; this contribution would correspond to
1 x 10⁶s'arcsec2 in the HRMA/HRC-I focal plane.
In-flight background of the HRC detectors is due to charged particles, the diffuse X-ray background and out-of
471
Downloaded from SPIE Digital Library on 13 Sep 2010 to 128.103.149.52. Terms of Use: http://spiedl.org/terms

Figure 3: Distribution showing the correlation between the fine position term of the 3-tap algorithm and thecomplement to the fine position term. X-ray events are preferentially distributed along a hyperbola. Particleinduced events and misprocessed events are distributed off the hyperbolic locus. Larger spread for fine position< 0 is due to electronic noise (see text).
band high energy (> 20 keV ) photons. Potentially the largest component of the HRC background is due tominimum ionizing primary cosmic rays. These cosmic rays can register as events in the HRC detectors.
To eliminate the background component due to these minimally ionizing cosmic rays the HRC instrumentincorporates a plastic scintillator based anti-coincidence detector. Details of the anti-coincidence detector shieldhave been presented elsewhere9 . The anti-coincidence detector provides 4ir Steradian coverage and rejectsevents which register in the HRC and the shield within a narrow coincidence time window (1i sec) . In flightcounting rates for the anti-coincidence shield are typically 4500cts s1 . For this rate, the effective QE of theHRC-I detector is reduced by an absolute 0.45% due to accidental coincidences. The anti-coincidence shieldreduces the onboard HRC-I detector background counting rate from '- 25Octs s1 to ' 30 — 4Octs s1 . Of theremaining 's 3Octs s1 background it is estimated that 3cts s1 is due to the diffuse X-ray background,,— 5 — lOcts s1 is due to intrinsic detector background and the remaining 2Octs s1 is of indeterminateorigin. It is hypothesized that some of this residual ' 2Octs s1 could be inefficiencies in the anti-coincidenceshield, charged particles focused by the HRMA, or radio-activation of detector elements.
Since the MCPs have a non-negligible detection efficiency for high (> 2OkeV) energy photons 16, tantalumshielding has been placed around the HRC instrument. Detailed shielding models taking into account spallationand transport within the Chandra space craft have been presented elsewhere 17
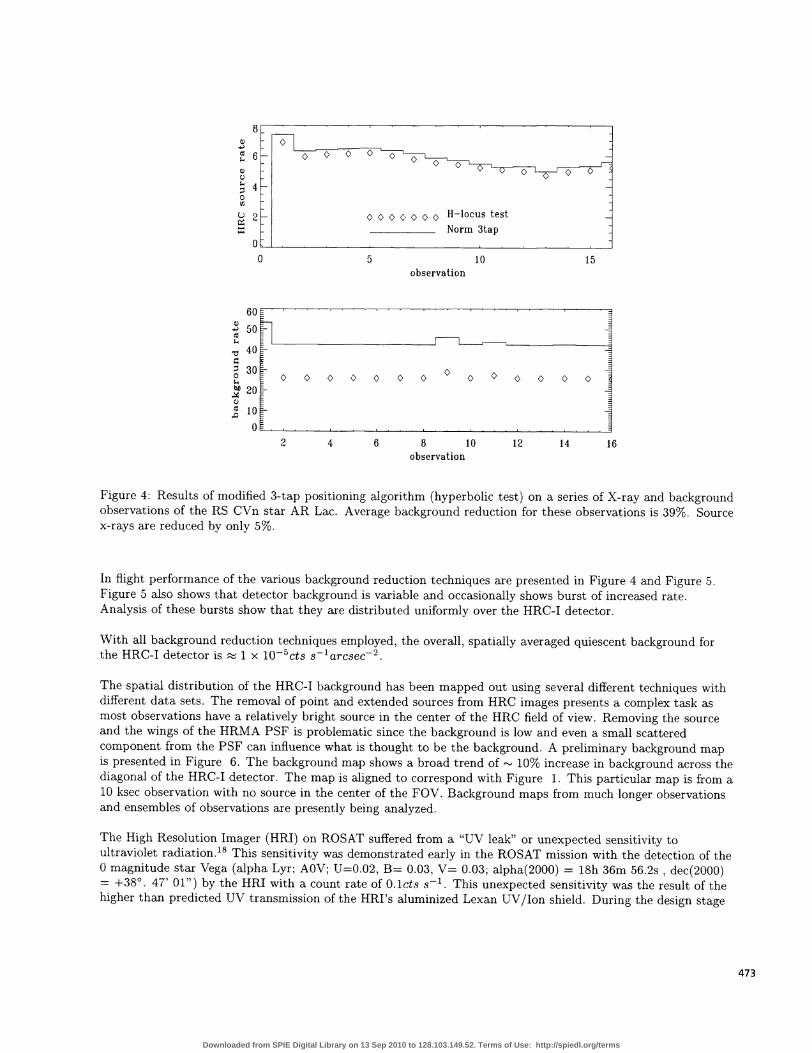
As has been previously discussed, the modified three-tap off-line software event processing further reduces thebackground counting rate to <30cts sl. The result of this HRC event processing on background and X-rays ispresented in Figure 4. The HRC hyperbolic locus test reduces background by approximately 40% while X-rayevents are reduced only approximately 5%.
I I
0.0
00
0C.)
0.8
0.6
0.4
-0.6
... . ..— ——
— .5.
-0.4 -0.2 0 0.2 0.4 0.6Fine position
472
Downloaded from SPIE Digital Library on 13 Sep 2010 to 128.103.149.52. Terms of Use: http://spiedl.org/terms
:j _U 2 K 0 (> K H—locus test____________ Norm 3tap
o_ . . .
0 5 10 15observation
6&
50___e 40
30 0 0 0 020
1002 4 6 8 10 12 14 16
observation
Figure 4: Results of modified 3-tap positioning algorithm (hyperbolic test) on a series of X-ray and backgroundobservations of the RS CVn star AR Lac. Average background reduction for these observations is 39%. Sourcex-rays are reduced by only 5%.
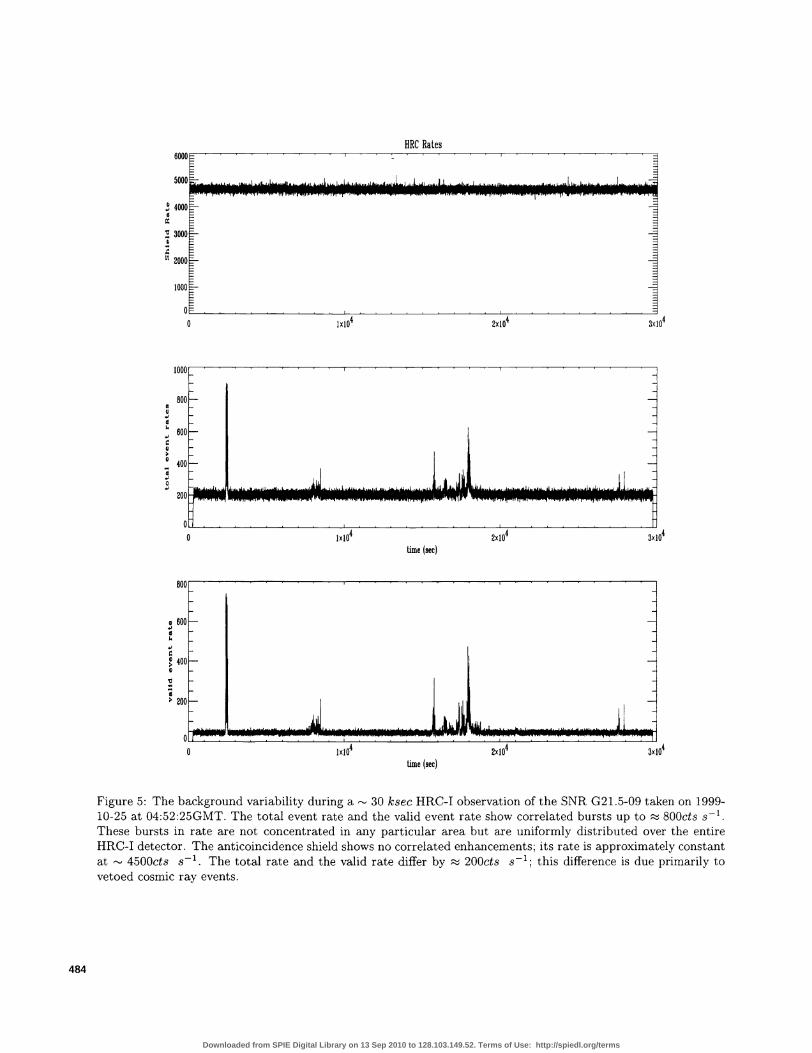
In flight performance of the various background reduction techniques are presented in Figure 4 and Figure 5.Figure 5 also shows that detector background is variable and occasionally shows burst of increased rate.Analysis of these bursts show that they are distributed uniformly over the HRC-I detector.
With all background reduction techniques employed, the overall, spatially averaged quiescent background forthe HRC-I detector is 1 x lO5cts sarcsec2.
The spatial distribution of the HRC-I background has been mapped out using several different techniques withdifferent data sets. The removal of point and extended sources from HRC images presents a complex task asmost observations have a relatively bright source in the center of the HRC field of view. Removing the sourceand the wings of the HRMA PSF is problematic since the background is low and even a small scatteredcomponent from the PSF can influence what is thought to be the background. A preliminary background mapis presented in Figure 6. The background map shows a broad trend of '10% increase in background across thediagonal of the HRC-I detector. The map is aligned to correspond with Figure 1 . This particular map is from a10 ksec observation with no source in the center of the FOV. Background maps from much longer observationsand ensembles of observations are presently being analyzed.
The High Resolution Imager (HRI) on ROSAT suffered from a "UV leak" or unexpected sensitivity toultraviolet radiation.'8 This sensitivity was demonstrated early in the ROSAT mission with the detection of the0 magnitude star Vega (alpha Lyr; AOV; U=0.02, B= 0.03, V= 0.03; alpha(2000) = 18h 36m 56.2s , dec(2000)= +38°. 47' 01") by the HRI with a count rate of 0.lcts s. This unexpected sensitivity was the result of thehigher than predicted UV transmission of the HRI's aluminized Lexan UV/Ion shield. During the design stage
473
Downloaded from SPIE Digital Library on 13 Sep 2010 to 128.103.149.52. Terms of Use: http://spiedl.org/terms

474
of the HRC-I, we developed a more UV opaque UV/Ion shield by replacing the Lexan substrate with polyimide;this was accomplished without compromising the X-ray transmission. An observation of Vega with the HRC-Ito verify the low UV response yielded an upper limit for the count rate of Vega of 1 x lO3cts s1. Thepredicted count rate calculated by multiplying Vega's spectrum by the HRC-I effective area in the UV andvisible spectral bands (see Figure 7) is 7x lO4cts s1. Since the collecting area of ROSAT and Chandramirrors are about the same in the UV, we have reduced the HRC-I sensitivity to Vega by a factor of about 100over that of the ROSAT HRI by using polyimide instead of Lexan. Based upon these observations, the UV/Ionshields are performing as designed. We will observe additional stars in future calibration activities in order tofurther verify the out-of-band response of the HRC.
3.2 Effective Area
The measured effective area (EA) of the HRC-I/HRMA is the ratio of the HRC-I count rate to the input X-rayflux density at the HRMA aperture as a function of energy. The EA can be modeled from sub assemblycalibrations as the product of the HRMA effective area, the UVIS transmission and the CsI coated MCPefficiency. The subassembly models are presented in Figure 8. Structure in the HRC-I/HRMA EA is thereforeevident at energies of the iridium, carbon, cesium and iodine edges. Both the UVIS and the HRMA have beenmeasured and modeled extensively and are known with little relative uncertainty. Details of the UVISmeasurements and modeling are presented elsewhere'3"4. Similarly, the HRMA calibration has been describedin detail and is presented in Van Speybrock et. al. 1997 ' and references contained there-in. Of the threesub-assembly components in the EA, the least well known is the quantum efficiency of the CsI coated MCPs.We will now specifically present the procedure that was used to determine the QE of the HRC-I MCPs.
To model the MCP QE over the entire Chandra energy band, the coated MCP quantum efficiency wasdetermined at a discrete number of energies. The efficiency was then interpolated to a finer energy scale using aphysical model that depends on the 1993 Henke mass absorption coefficients 20
3.2.1 Quantum Efficiency
The quantum efficiency of the HRC-I was determined as a function of energy and position by combining datafrom three distinct data sets: These data sets were: pre-flight on axis effective area measurements, SAO HRC-Ifiat field (FF) illumination tests and synchrotron data measurements of non-flight coated MCP detectors.
The effective area of the HRMA/HRC-I was measured on the ground at the X-Ray Calibration Facility (XRCF)at the Marshall Space Flight Center (MSFC). Details of these measurements and of the XRCF calibrationfacility are discussed in D.Patnaude et al.2' 1998 and in J.Kolodziejczak et al.,22 1995.
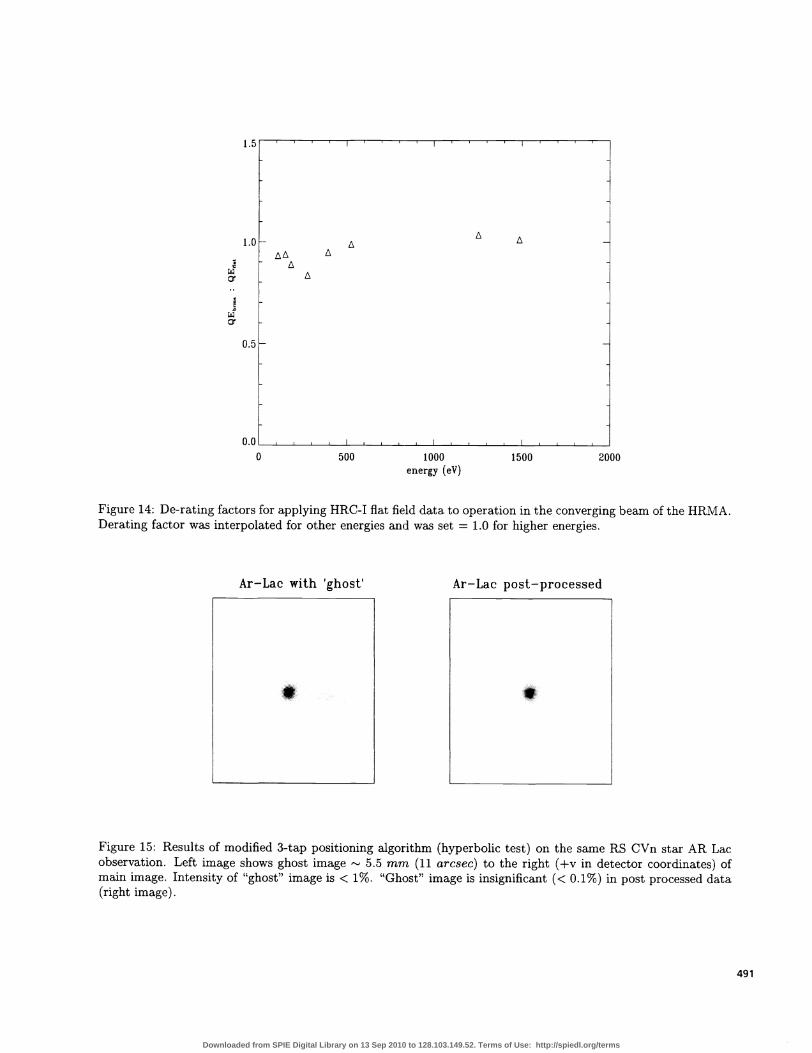
Using these XRCF determined EA measurements, MCP QE values were determined by dividing out the XRCFappropriate HRMA effective mirror area and the transmission of the UVIS. Only on-axis EA measurementswere used. In addition to the HRMA effective area, the effects of the HRMA cone angles on MCP QE valueshad to be taken into account. The HRMA cone angle correction for the HRC-I is presented in Figure 14; itdiffers significantly from 1.0 (normal incidence) only for energies < 500 eV for the HRC-I. These HRMA anglecorrections are the result of an elaborate experimental campaign to measure and model the dependence ofcoated MCP quantum efficiency on MCP pore angle, X-ray incidence angle, and X-ray energy. Details of thesemeasurements are presented in (Kenter et. al.,1997).23
The SAO flat field illumination tests were performed on the HRC-I detector in its final flight configuration.These fiat field tests measured the QE of the HRC-J detector with X-rays at approximately normal incidence tothe MCP surface. These measurements will be discussed in detail in the following section.
Downloaded from SPIE Digital Library on 13 Sep 2010 to 128.103.149.52. Terms of Use: http://spiedl.org/terms
The synchrotron data were obtained at the Daresbury Synchrotron using non-flight, HRC-S type MCPs innon-flight like detectors, with non-flight like electronics. These "representative" detectors were coated with CsIat the University of Leicester. In contrast the HRC-I flight MCPs were manufactured by the Galileo ElectroOptics Corporation (now Burle) and were coated with CsI at SAO. The synchrotron data measured the QE ofthe MCP detectors near the Cs and I M edges and between 277 and 350 eV. No cross calibration of theserepresentative MCPs were done with the HRC-I detector. Due to the different heritage and the lack ofcross-calibration, there may be large systematic errors introduced by incorporating these data into the HRC-Iinstrument calibration. The synchrotron data were also obtained at "normal incidence".
The method for determining the QE of the HRC-I detector is to first derive the QE of the CsI coated MCPswithout the UVIS at a set number of energies for normal incidence illumination; this entails dividing out thetransmission of the UVIS and dividing out the HRMA effective area, and HRMA cone angle dependence fromthe HRC-I/HRMA EA measurements. These discrete MCP QE values are combined with an interpolationscheme to determine the QE versus energy for the Csi coated MCPs on a finer energy scale. The synchrotronQE data near the Cs and I M edges is then scaled appropriately and spliced into MCP QE versus energy data.The QE of the overall HRC-I detector is then obtained by multiplying the MCP QE by the HRC-I UVIStransmission. The appropriate corrections for the HRMA cone angles are then applied. The net result is acontinuous model of HRC-I quantum efficiency over the Chandra energy band which is appropriate for theconverging beam of the HRMA. The following subsections will describe the individual data sets and theinterpolation technique. The final step combines the interpolated model with the HRMA effective area toproduce the HRC-I/HRMA effective area.
3.2.2 XRCF Measurements
The X-ray sources used at XRCF were an Electron Impact Source (EIPS) with various anodes and filters; aRotating Anode Source (RAS) with either a High Resolution Erect Field Spectrometer (HIREFS) (used as amonochromator) or a Double Crystal Monochromator (DCM).
The HIREFS source was intended to provide EA measurements for energies from 400 to 2000 eV. In practice,the HIREFS data suffered from large spatial non-uniformities over the input face of the HRMA. Furthermore,the HIREFS suffered from higher-order spectral contamination of the continuum source and from strongspectral contamination by tungsten M lines near 1.7 keV. The poor spectral quality of the HIREFS data andthe low energy resolution of the HRC-I detector necessitated a complex "boot-strapping" process to extractHRC-I/HRMA EA values. The ensuing large systematic errors made the HIREFS data useful only forqualitative comparison with other data. HIREFS determined EA data were not used to determine the here-inpresented HRC-I QE.
The DCM data comprises the largest and best XRCF data set; it had little higher order contamination and theX-ray beam was relatively uniform over the aperture of the HRMA. The DCM data, however, were limited toE > 2 keV. All DCM measurements through 7keV were incorporated into the QE model. The QE was thenextrapolated out to 10 keV from the 6.3 keV and 7keV DCM measurements based on trends in synchrotronmeasurements. DCM measurements for E > 7keV were inconsistent and were omitted.
Only one EIPS XRCF EA measurement at 277 eV was used for the HRC-I QE calibration. Other measurementsat 183 eV were not consistent and have been left out.
475
Downloaded from SPIE Digital Library on 13 Sep 2010 to 128.103.149.52. Terms of Use: http://spiedl.org/terms

3.2.3 SAO Flat Field QE Measurements
Following the XRCF calibration the HRC instrument returned to SAO for modification and fiat-fieldillumination tests. The purpose of the fiat field illuminations were to determine the average and spatiallydependent QE of the HRC-I detector.
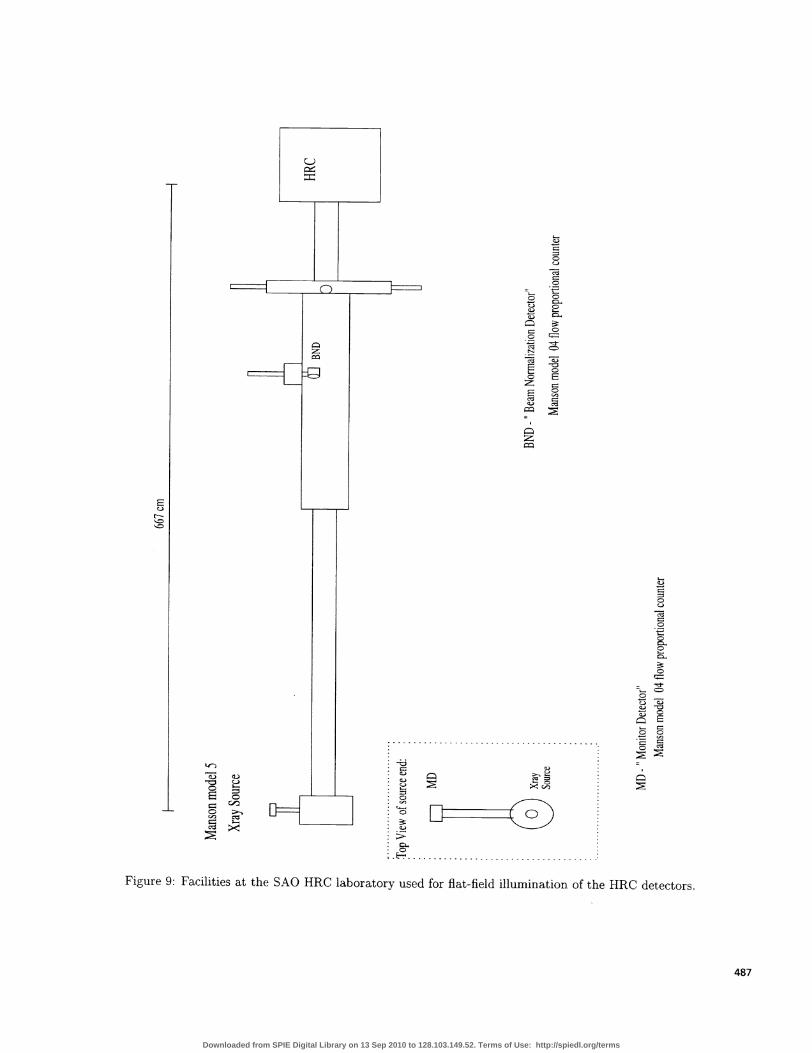
During fiat field testing, the HRC instrument was mounted to an 7 meter X-ray pipe to provide approximatelynormal incidence X-ray illumination. A series of adapter flanges were used to mount the instrument externaly tothe vacuum chamber and to illuminate the HRC-I and each of the HRC-S segments separately. This mountingscheme allowed access to the HRC electronics for testing and modification during operation. X-ray illuminationwas provided by a Manson Model 5 multi-anode electron impact source. The anodes and filter combinationslisted in Table 1 were used. The SAO Flat Field facility is depicted in Figure 9. The absolute beam intensity
Line Energy Filter MFPs VA L/CB Kc 183 eV 7 t parylene-C 5.87 600 V 48.4C Ka 277 eV 33 i polypropylene 5.94 1000 V 171
0 Ka 525 eV 2 i Cr 4.67 1000 V 29.3Ni La 851 eV 2 t Cu 3.80 2500 V 2.55Al Kc 1487 eV 50 p Al 5.40 4000 V 38.9Ag Ka 2984 eV 10 ,.t Ag 4.86 6000 V i6OTi Ka 4511 eV 150 z Ti 6.80 10000 V 6.73
Fe Ka 6404 eV 125 Fe 6.97 10000 V 1.78
Table 1 : Summary of line energies, filters, thicknesses, anode voltages, and predicted line-to-continuum ratio ofthe X-ray source for HRC-I flat fields.
at the input of the HRC was measured using a Manson Model 04 flow proportional counter which was mountedon a retractable arm. This Beam Normalization Detector (BND) was not operated concurrently with the HRCas it had a slow gas leak through its window which spoiled the vacuum too close to the input face of the MCPs.Absolute flux measurements and temporal monitoring were performed by first cross calibrating a secondManson model 04 Monitor Detector (MD) flow proportional to the BND. This MD was close to the actual X-raysource and operated concurrently with the HRC detectors. By using the MD rates and the MD to BNDcross-calibration the QE of the HRC detector was measured. The QE of the HRC was calculated as:
Where:
RhrcQEh'hrc1hrc
— RMD BND'hrc ,- x((J2BNDBND lvii-.,
(4)
(5)
and is the BND to MD cross calibration ratio. The QE of the proportional counters were calculatedfrom their window properties and mechanical dimensions; no cross calibration to any standards were performed.The window transmission of the BND and MD proportional counters were measured extensively using aMcPherson Monochromator and subsequently modeled at SAO. The effective counter depth provided by themanufacturer was used. Gas pressure, composition (CH4 or PlO) and temperature were controlled and/ormeasured throughout the tests. The HRC-I was illuminated for a set time to insure that at least iO events werecollected for all the anodes excepting boron, where only ' 3 x 10⁶ events were collected.
During the Flat Field illumination tests of the HRC detectors, the electronics were modified so as to allow adata rate 10 x the telemetry limit of 184 events s . In practice, data rates were intentionally limited to
476
Downloaded from SPIE Digital Library on 13 Sep 2010 to 128.103.149.52. Terms of Use: http://spiedl.org/terms
1200 — 1400 events s1 for the HRC-I for all energies except for boron; the boron data were flux limited. The10 x operation of the HRC necessitated that dead-time corrections be applied to the flat field QE values. Thedead time for the HRC detectors has been independently measured to be r = 68.5is; the majority of this is dueto an ADC conversion time. Dead time corrections can be applied to the flat field HRC QE values byconsidering the instrument as a non-paralyzable (non-extendible dead time) detector with a characteristic deadtime of y = 68.5s. Using just the measured rates of Rmeas ' l200cts s1 , without correction would cause anunderestimate of the true QE, by 9%. It can be easily shown under the above assumptions that:
QEtrue = (6)QEmeas Rineas 1 — RmeasT
Where the true QE values are the "zero-rate" limits.
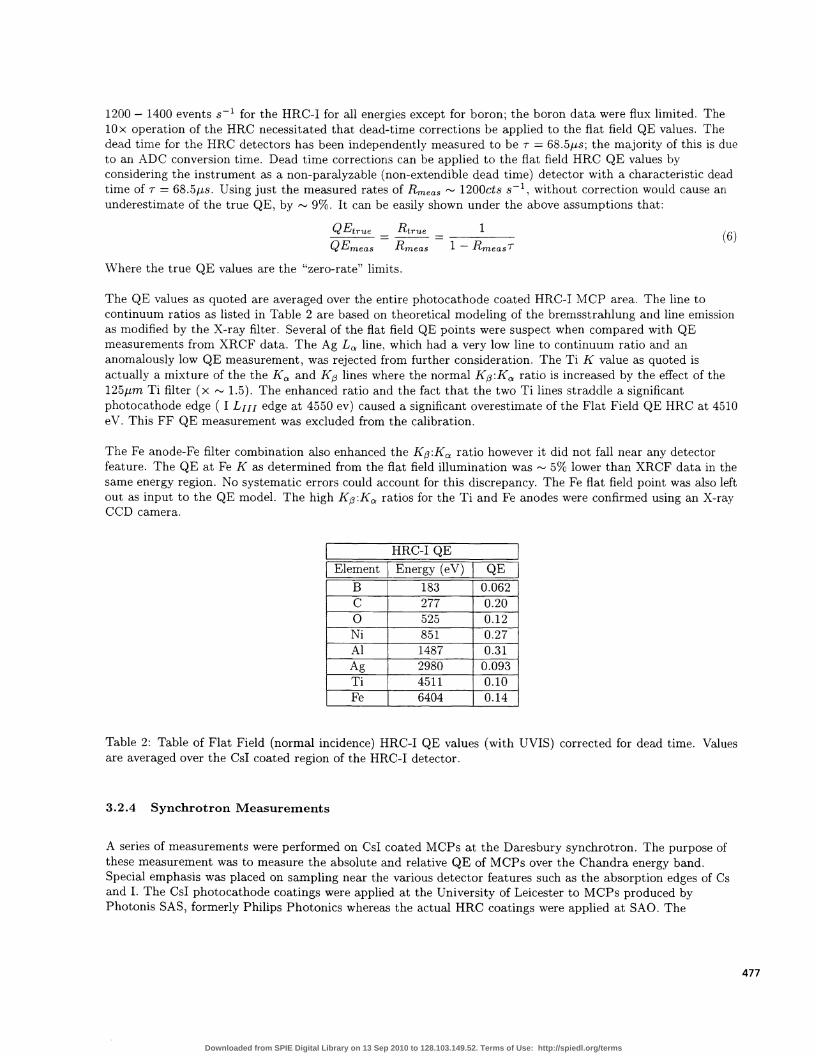
The QE values as quoted are averaged over the entire photocathode coated HRC-I MCP area. The line tocontinuum ratios as listed in Table 2 are based on theoretical modeling of the bremsstrahlung and line emissionas modified by the X-ray filter. Several of the flat field QE points were suspect when compared with QEmeasurements from XRCF data. The Ag L. line, which had a very low line to continuum ratio and ananomalously low QE measurement, was rejected from further consideration. The Ti K value as quoted isactually a mixture of the the K and K lines where the normal K:Ka ratio is increased by the effect of the125,um Ti filter (x 1.5). The enhanced ratio and the fact that the two Ti lines straddle a significantphotocathode edge ( I L111 edge at 4550 ev) caused a significant overestimate of the Flat Field QE HRC at 4510eV. This FF QE measurement was excluded from the calibration.
The Fe anode-Fe filter combination also enhanced the K :Ka ratio however it did not fall near any detectorfeature. The QE at Fe K as determined from the flat field illumination was ' 5% lower than XRCF data in thesame energy region. No systematic errors could account for this discrepancy. The Fe flat field point was also leftout as input to the QE model. The high K:Kc, ratic)s for the Ti and Fe anodes were confirmed using an X-rayCCD camera.
HRC-I QE
Element] Energy (eV) QEB 183 0.062C
—277— 0.20
0 525 0.12Ni 851— 0.27Al 1487 0.31Ag 2980— 0.093Ti 4511 0.10Fe 6404 0.14
Table 2: Table of Flat Field (normal incidence) HRC-I QE values (with UVIS) corrected for dead time. Valuesare averaged over the CsI coated region of the HRC-I detector.
3.2.4 Synchrotron Measurements
A series of measurements were performed on CsI coated MCPs at the Daresbury synchrotron. The purpose ofthese measurement was to measure the absolute and relative QE of MCPs over the Chandra energy band.Special emphasis was placed on sampling near the various detector features such as the absorption edges of Csand I. The CsI photocathode coatings were applied at the University of Leicester to MCPs produced byPhotonis SAS, formerly Philips Photonics whereas the actual HRC coatings were applied at SAO. The
477
Downloaded from SPIE Digital Library on 13 Sep 2010 to 128.103.149.52. Terms of Use: http://spiedl.org/terms

478
representative MCPs were then incorporated into detectors and tested at the Daresbury synchrotron which wasoperated in low current mode to allow operation of the detectors in single photon counting mode. The variousDaresbury calibration campaign are discussed in detail elsewhere24'2.
Two subsets of the synchrotron data were incorporated as input to the HRC QE calibration. The first set ofdata was collected in January 1995 at beam line 6.1 of the Daresbury Synchrotron. These data spanned theenergy band of 250-350eV in 1eV steps using a 1200 line-per-mm Miyake plane grating monochromator. Thespectrum of the monochromator and associated optics had been measured previously using a tungsten gridreference detector. High rates in the MCP detector necessitated that the data be corrected for dead time andgain suppression. Following the synchrotron measurements, the relative QE versus energy data were normalizedto a laboratory measurement of QE at carbon K (277eV) at the University of Leicester. This data was thenagain normalized to the Flat Field QE value at 277eV.
The second set of Daresbury Synchrotron data was collected in October 1997 on beam-line 1.1. This dataspanned the energy band of '-. 450 to 800eV in 0.5 eV steps using a Ni(3) grating and used a flow proportionalcounter for absolute normalization of the beam. Unfortunately, the input flux was spoiled by carboncontamination of the beam-line optics and higher order carbon and oxygen spectral contamination. Details ofthis second data set are discussed in detail by Rideout et. al., 1998 25
3.2.5 MCP QE Model—Interpolation to a Finer Energy Scale
The QE of the CsI coated HRC-I MCPs was interpolated to a finer energy grid using: three sets of input points.These input points were: the flat field QE measurements, QE values obtained from XRCF EA measurementsand the synchrotron data from 277 through 350 eV.
The interpolation scheme is outlined in Juda, M. 1997 26 and is based on earlier photocathode work of Henke,Knauer and Premaratne (1981) 27 The model will now be presented in brief.
The QE of CsI coated MCPs can be written as
QEMCP = 1(1 — eY) (7)
Where I = 0.58 is the open area ratio of the MCPs and represents the maximum possible QE. y(E) is the meanphoto-electron yield of the photocathode as a function of energy. The QE is then the Poisson probability ofproducing a photo electron yield of one or greater given a mean yield of y(E).
The yield, y(E), written asy(E) = A(E)pc8jp(E)c8j (8)
is just the photo absorption within an electron range of the photocathode surface, where A(E) is the electronrange, .i(E)sj is the mass absorption coefficient of CsI and PCsI 5 the mass density of CsI. The function A(E)contains all the complex physics of electron transport of the photocathode. Furthermore, A(E) is reported tovary only weakly as a function of energy (Henke, Knauer and Premaratne 1981).
From the above two equations one can solve explicitly for A(E) as a function of the discretely measured MCPQE values QE2.
ln(1 —A(E) = (9)
A piece-wise spline interpolation was performed between the well behaved regions of the A(E) points. Theresulting MCP QE model was then determined by incorporating the A(E) interpolation into Equations 8 and
Downloaded from SPIE Digital Library on 13 Sep 2010 to 128.103.149.52. Terms of Use: http://spiedl.org/terms
7. The resulting MCP QE "model" depends on the Cs and I mass absorption coefficients (Henke 1993) 20todetermine jump ratios and photocathode edge locations. Comparing the interpolated MCP QE with synchrotrondata showed that the interpolated jump ratios are too high and true edge locations are displaced to higherenergies. This displacement of M edges of high Z materials has been observed elsewhere (Owens et al., 1996) 28•
The second set of synchrotron data that spanned the Cs and I M edges was rescaled to match the flat field QEvalue at 525 eV by the use of an additive constant. This synchrotron data was then used to "replace" theinterpolated data between 600 and 800 eV. The use of an additive constant was justified on account of higherorder contamination in the synchrotron beam.
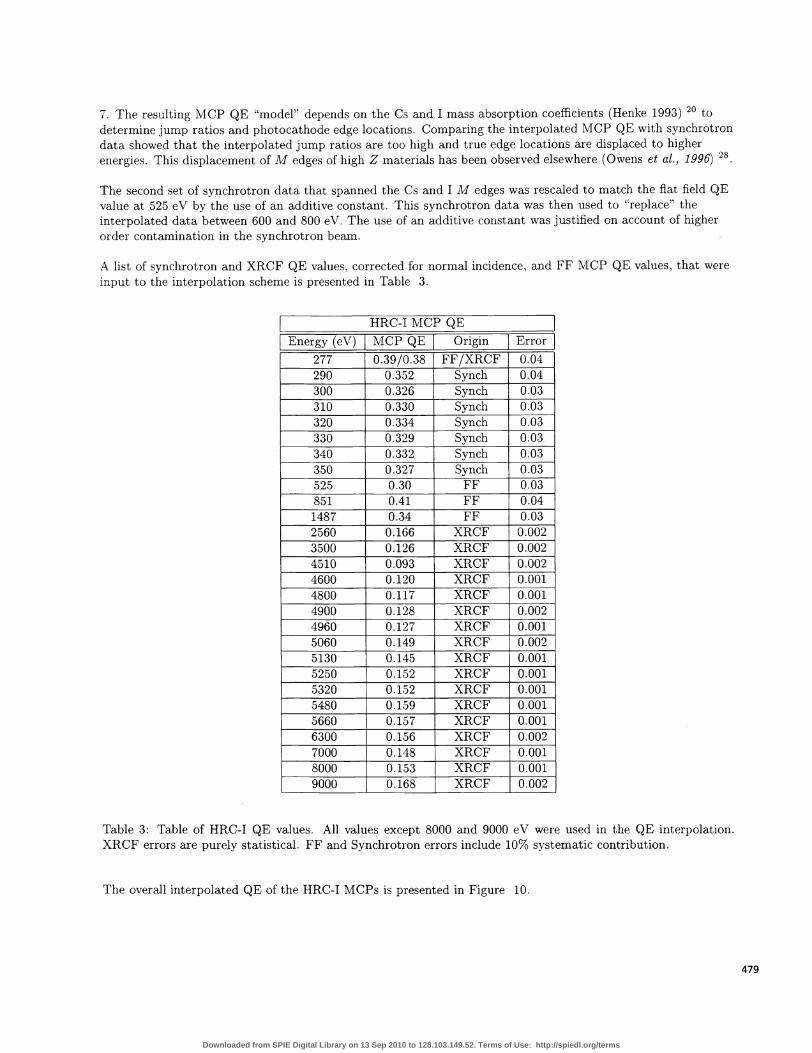
A list of synchrotron and XRCF QE values, corrected for normal incidence, and FF MCP QE values, that wereinput to the interpolation scheme is presented in Table 3.
HRC-IMCP QEEnergy (eV) MCP QE Origin Error
277 0.39/0.38 FF/XRCF 0.04290 0.352 Synch 0.04300 0.326 Synch 0.03310 0.330 Synch 0.03320 0.334 Synch 0.03330 0.329 Synch 0.03340 0.332 Synch 0.03350 0.327 Synch 0.03525 0.30 FF 0.03851 0.41 FF 0.041487 0.34 FF 0.032560 0.166 XRCF 0.0023500 0.126 XRCF 0.0024510 0.093 XRCF 0.0024600 0.120 XRCF 0.0014800 0.117 XRCF 0.0014900 0.128 XRCF 0.0024960 0.127 XRCF 0.0015060 0.149 XRCF 0.0025130 0.145 XRCF 0.0015250 0.152 XRCF 0.0015320 0.152 XRCF 0.0015480 0.159 XRCF 0.0015660 0.157 XRCF 0.0016300 0.156 XRCF 0.0027000 0.148 XRCF 0.0018000 0.153 XRCF 0.0019000 0.168 XRCF 0.002
Table 3: Table of HRC-I QE values. All values except 8000 and 9000 eV were used in the QE interpolation.XRCF errors are purely statistical. FF and Synchrotron errors include 10% systematic contribution.
The overall interpolated QE of the HRC-I MCPs is presented in Figure 10.
479
Downloaded from SPIE Digital Library on 13 Sep 2010 to 128.103.149.52. Terms of Use: http://spiedl.org/terms
3.2.6 In-Flight QE/EA Verification
The on axis EA of the HRC-I/HRMA is presented in Figure 11. It is the product of the above discussedsubassembly calibration models.
The inflight verification of HRC-I Quantum Efficieny (QE) and Effective Area (EA) presents a challengingproblem. Celestial X-ray sources have complex spectra and many of these sources are temporally variable.Furthermore, the HRC detectors have very limited ( 'S-' 1) energy resolution and can not independentlydetermine the nature of the input spectrum.
Two techniques for inflight QE and EA verification will now be discussed. At present only one of thesetechniques has been implemented for the HRC-I. The two techniques are a broad band verification over anentire input spectrum and narrow band verification using either the LETG or HETG.
Narrow band verification has been performed successfully with the HRC-S detector and the results arepresented elsewhere in these proceedings5'6. In this narrow band technique, a well known source such as thewhite dwarf HZ43 is observed with the transmission gratings. The dispersed spectrum in conjunction with themirror, grating, and source spectrum models allows one to make an in-flight measurement of QE. Thismeasurement can then be used to verify the preflight model. Since the HRC-I is only considered as a backupgrating readout, no such appropriate grating observations have yet been made.
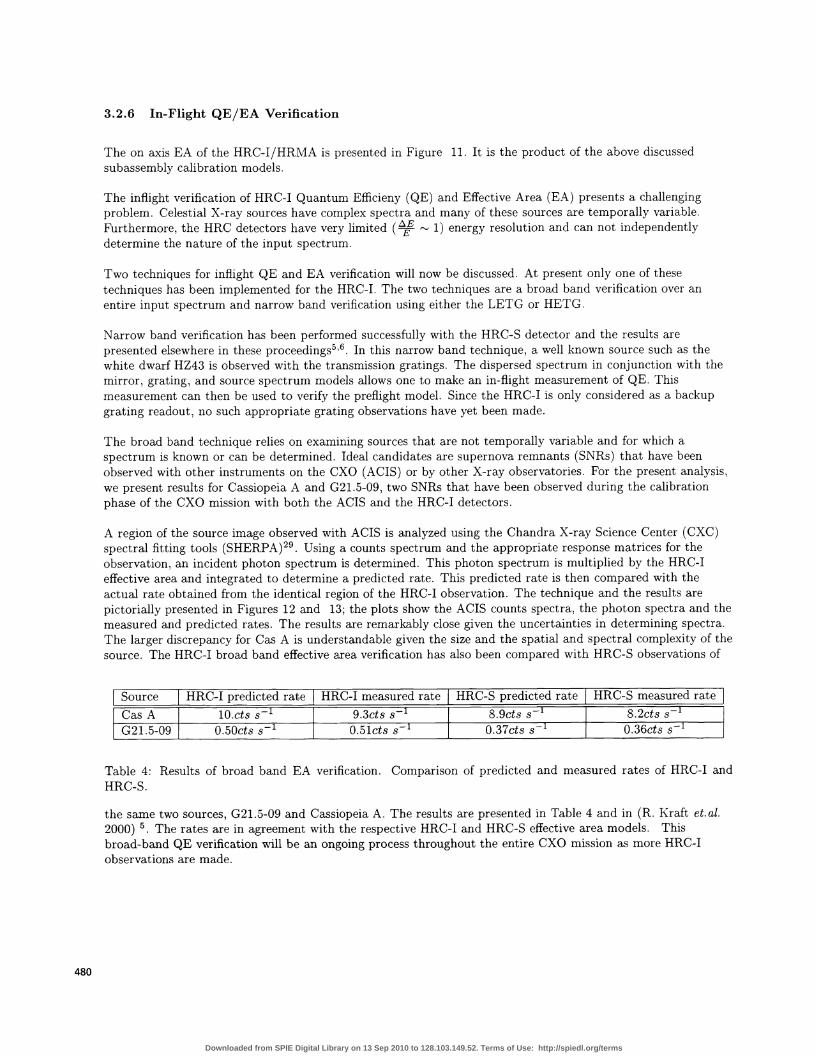
The broad band technique relies on examining sources that are not temporally variable and for which aspectrum is known or can be determined. Ideal candidates are supernova remnants (SNRs) that have beenobserved with other instruments on the CXO (ACTS) or by other X-ray observatories. For the present analysis,we present results for Cassiopeia A and G21.5-09, two SNRs that have been observed during the calibrationphase of the CXO mission with both the ACTS and the HRC-T detectors.
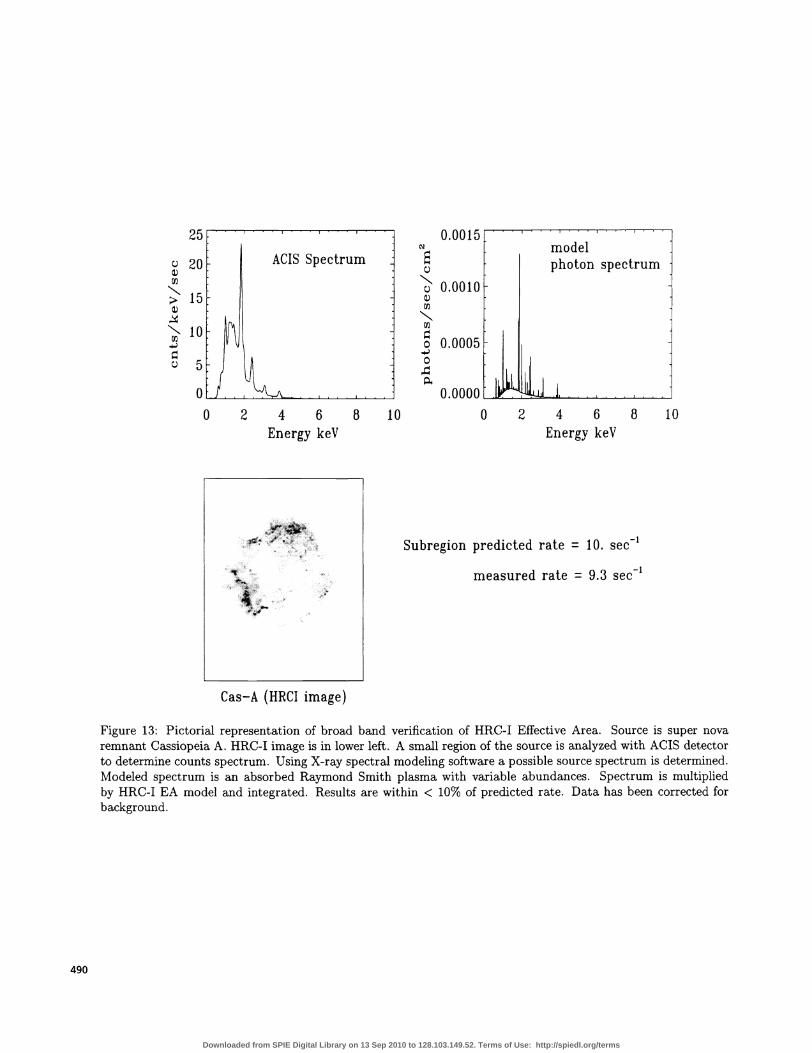
A region of the source image observed with ACTS is analyzed using the Chandra X-ray Science Center (CXC)spectral fitting tools (SHERPA)29. Using a counts spectrum and the appropriate response matrices for theobservation, an incident photon spectrum is determined. This photon spectrum is multiplied by the HRC-Teffective area and integrated to determine a predicted rate. This predicted rate is then compared with theactual rate obtained from the identical region of the HRC-T observation. The technique and the results arepictorially presented in Figures 12 and 13; the plots show the ACTS counts spectra, the photon spectra and themeasured and predicted rates. The results are remarkably close given the uncertainties in determining spectra.The larger discrepancy for Cas A is understandable given the size and the spatial and spectral complexity of thesource. The HRC-T broad band effective area verification has also been compared with HRC-S observations of
Source j HRC-T predicted rate HRC-T measured rate HRC-S predicted rate HRC-S measured rateCas A L 1O.cts s 9.3cts s 8.9cts s 8.2cts sG21.5-09 { O.5Octs s O.5lcts s1 O.37cts s1 O.36cts s1
Table 4: Results of broad band EA verification. Comparison of predicted and measured rates of HRC-T andHRC-S.
the same two sources, G21.5-09 and Cassiopeia A. The results are presented in Table 4 and in (R. Kraft et.al.2000) 5. The rates are in agreement with the respective HRC-T and HRC-S effective area models. Thisbroad-band QE verification will be an ongoing process throughout the entire CXO mission as more HRC-Iobservations are made.
480
Downloaded from SPIE Digital Library on 13 Sep 2010 to 128.103.149.52. Terms of Use: http://spiedl.org/terms
3.3 Point Spread Function (PSF)
Flight and preflight performance of the HRC-I detectors have indicated several minor imaging problems. Thecauses and cures for these problems will now be discussed. The present best HRC-I/HRMA PSF will then bepresented and compared to preflight predictions.
The gain of the HRC-I MCPs has a high modal value and a large variance. Furthermore, the spatial dependenceof detector gain varies over the HRC-I; it is centrally peaked. Due to the large gain of some events, primarilythose in the center of the detector, there is evidence of amplifier saturation in the fine position charge values.This saturation occurs for '- 1% of events and manifests itself as a secondary "ghost" image displaced 5.5 mm( 1 1 arcsec) from the main image. These saturated events if not removed greatly complicate the instrumentPSF. These saturated events are easily filtered without significantly affecting the detector efficiency.
An other imaging artifact is evident for events with a negative fine position, fp. This second feature is due toelectronic ringing in the fine position circuitry induced by switching in the coarse position logic. The modifiedthree-tap algorithm ( "hyperbolic locus test" ) as discussed in the section on event processing successfullyremoves this feature and the "ghost" with little loss of valid signal.
Two images of the the RS CVn star AR Lac are presented in Figure 15. The figures show the result ofperforming the hyperbolic locus test on the HRC-I events. It is clear that the secondary "ghost" image has beengreatly reduced in the processed data. Analysis shows that the ghost is reduced from 1% to < 0.1%.
Figure 16 presents a comparison of the in flight HRC-I/HRMA PSF with HRMA ray-trace simulations at twoenergies. The ray trace simulations incorporate a 0.17"(rms) simulated aspect blur and an HRC instrumentalblur of 0. 15"(rms). The instrumental blur is from laboratory measurements. The combined HRC-I HRMA PSFshows that approximately 90% of the photons are contained within a 1 .8" diameter circle and approximately50% are contained within a 0.75" diameter circle.
4 CONCLUSIONS AND DISCUSSION
We have presented the most recent on axis effective area model for the HRC-I detector. This model has beentested and verified using in-flight observations. Results of these tests have shown that the HRC-I EA isconsistent with preflight predictions. These techniques will form the basis of an on going program of HRC-Icalibration verification and refinement which will continue throughout the Chandra mission. There is stilluncertainty in the EA of the HRC-I detector for energies below 277 eV; Laboratory and in flight calibrations arebeing planned to remedy this.
Several methods of background reduction for the HRC-I detector have been presented. Using the on-boardanti-coincidence shield and off-line event processing, the spatially averaged background for the HRC-I detectorhas been found to be 1 x lO5cts s1arcsec2. This background varies by ' 10% across the HRC-I detector.These and other background reduction techniques will continue to be pursued. Background maps with muchbetter statistics will be made in the near future.
Two minor imaging problems associated with the HRC-I instrument have been eliminated using off lineprocessing with little change in detector efficiency. The resulting imaging performance of the HRC-I detector incombination with the HRMA has been shown to be have a PSF with approximately 90% of the photonscontained in a 1.8" diameter circle and approximately 50% contained in a 0.75" diameter circle.
More detailed information and WWW links can be found at:
481
Downloaded from SPIE Digital Library on 13 Sep 2010 to 128.103.149.52. Terms of Use: http://spiedl.org/terms
482
http : //hea-www .harvard . edu/HRC/HomePage .html
5 ACKNOWLEDGEMENTS
We are grateful for the support of Jack Gomes, John Polizotti, Everett Johnston, Richard Goddard, DesiHamvas Frank Rivera and Peter Warren. This work has been supported by NASA contract NAS8-38248 andNAS8-39073
6 REFERENCES
[1] Weiskopf, MC., O'Dell, S.L. and Elsner, R.F., "Advanced X-Ray Astrophysics Facility - AXAF anOverview" , X-Ray and Extreme Ultraviolet Optics,R.B.Hoover and A.B.C Walker Jr.,eds., Proc. SPIE2515,1995.
[2] Zombeck, MV, "Advanced X-Ray Astrophysics Facility (AXAF)" , Proceedings of the International Schoolof Space Science Course on "X-Ray Astronomy" , Aquila,Italy.,1996 CfA preprint 4003. Available at:
http: //hea-www .harvard . edu/hrc_art/axaf_art/axaf_art1 . html
[3] Markert, T.H., Canizares, CR., Dewey, D., McGuirk, M., Pak, CS., Schattenburg, ML., "High EnergyTransmission Grating Spectrometer (HETGS) for AXAF" , in EUV, X-Ray, and Gamma-RayInstrumentation for Astronomy V, SPIE 2280,(1994).
[4] Brinkman, AC., van Rooijen, J.J., Bleeker, JAM., Dijkstra, J.H., Heise, J., de Korte, P.A.J., Mewe, R.,and Paerels, F., Astro. Lett. and Commun., 26, 87 (1987).
[5] Pease, DO, et. al. SPIE4O12,20000.
[6] Kraft, R.P., Chappell, J.H., Kenter, AT., Meehan, G.R., Murray, 5.5., Zombeck, MV., Donnelly, RH.,Drake, J.J., Johnson, GO, Juda, M., Patnaude, D., Pease, DO., Ratzlaff, P.W., Wargelin, B.J. Zhao,P.,Austin, G.K., Fraser, G.W., Pearson,J.F., Lees, J.E., Brunton,A.N., Barbera, M., Collura, A., Serio, S.In-flight Performance and Calibration of the Chandra HRC-S Readout" ,SPIE 4012,2000.
{7] Giaconni, R. et al, Astrophysical Journal,230,1979.
[8] Zombeck, MV., David, L.P., Harnden, FR. Jr. and Kearns, K., "Orbital Performance of the HighResolution Imager (HRI) on ROSAT", SPIE 2518,(1995).
[9] Kenter, AT., Chappell, J.H, Kraft, R.P., Meehan, G.R., Murray, S.S., Zombeck, MV., Fraser, G.W., "TheHigh Resolution Camera on AXAF" , Imaging Detector" , SPIE 2808, (1996).
[10] Kraft, R.P., Chappell, J.H, Kenter, AT., Kobayashi, K., Meehan, G.R., Murray, 5.5., Zombeck, MV.,Smithsonian Astrophysical Observatory; Fraser, G.W., Pearson, J.F., Lees, J.E., Brunton, AN., Pearce, SE.,University of Leicester (UK); Barbera, M., Collura, A., Serio, S., Instituto e Osservatorio Astronomico G.S.Vaiana (Italy) "Performance and Calibration of the AXAF High Resolution Camera II: SpectroscopicDetector", SPIE 3114, (1997).
[11] Kenter, A., Goddard, R., Gomes, J., Lessing, J., Murray, S., Moore, R., Roll, R., Valenza, M., Zombeck,M., "The MCP readout for the AXAF-I grating spectrometer", in X-Ray Detector Physics and ApplicationsII, SPIE 2009, 84, (1993).
Downloaded from SPIE Digital Library on 13 Sep 2010 to 128.103.149.52. Terms of Use: http://spiedl.org/terms

[12] Meehan, G.R., Chappell, J.H, Kenter, AT., Kraft, R.P., Kobayashi, K., Murray, S.S., Zombeck, MV.,Barbera, M, Collura, A. "Measurement of the Transmission of the UV ion Shields of the AXAF HighResolution Camera", SPIE 2808, (1996).
[13] Meehan, G.R., Murray, S.S., Zombeck, MV., Kraft, R.P., Kobayashi, K., Chappell, J.H., Kenter, AT.,Barbera, M., Collura, A., Serio, S., Instituto e Osservatorio Astronomico G.S. Vaiana (Italy) "Calibration ofthe UV/ion shields for the AXAF High Resolution Camera", SPIE 3114, (1997).
[14] Chappell, J.H., Martin, R.K., Murray, 5.5. and Zombeck, MV. "Background Reduction in MicrochannelPlates", SPIE 1344, 176, (1990).
[15] Chappell, J.H. and Murray, 5.5., "Position Modeling for the AXAF High Resolution Camera", SPIE 1159,460, (1989).
[16] Kenter, AT., Flanagan, K.A., Meehan, G.R., Murray, 5.5., Zombeck, MV., Fraser, G.W., Pearson, J.F.,Lees, J.E., Brunton, AN. and Pearce, SE. " MCP selection for the HRC on AXAF" SPIE 2518,1995.
[17] Dietz, K.L., Elsner, R.F., Joy, M.K., O'dell, S.L., Ramsey, B.D., Weisskopf, MC., Armstrong, A.W.,Colborn, B.L., Kanvec, N. "Shielding Simulations for the Advanced X-Ray Astrophysics Facility" SPIE 25181995
[18] (Zombeck, MV., Barbera, M., Collura, A. , and Murray, 5.5., Ap. J. Lett., 487, L69, 1997).
[19] Van Speybroeck, L.P "Performance Expectations versus Reality" , SPIE 3113,(1997).
[20] Henke, B. L., Gullikson, E. M., and Davis, J. C., Atom. Data and Nuci. Data Tables, 54(2), 181, JUL93.
[21] Kolodziejczak, J.J., Austin, R.A., Eisner, R.F., Joy, M.K., Suikanen, M., Kellogg, EM. and Wargelin, B.J.,"X-ray Source System at the MSFC X-ray Calibration Facility" Proc.,SPIE 2515, (1995).
[22J Patnaude, D. et al., "Effective Area of the AXAF High Resolution Camera (HRC)" , EUV, X-Ray, andGamma-Ray Instrumentation for Astronomy VIII, 0. H. W. Siegmund and M. A. Gummin, eds., Proc. SPIE3445, 1998.
{23] Kenter, A.T.,Meehan, G.R., "HRC QE versus Angle of Incidence", Internal SAO memorandum. September24,1998. Available at
http : I/hea-www .harvard.edu/HRC/calib/pore_a.ng .ps
[24] Rideout, R. A. et al., "Synchrotron Measurements of the Absolute X-ray Quantum Efficiency of CsI-coatedMicrochannel Plates" , EUV, X-Ray, and Gamma-Ray Instrumentation for Astronomy VIII, 0. H. W.Siegmund and M. A. Gummin, eds., Proc. SPIE 3445, 1998.
{25] Pearce, SE., Lees, J.E., Pearson, J.F., Fraser, G.W., Brunton, AN., Flanagan, K.A., Kenter, AT.,Barbera,M.,Dhanak, V.,Robinson, A., Teehan,D. "Synchrotron calibration of Alkali Halide CoatedMicrochannel Plate Detectors in the 50-350 and 2000-6000 eV Bands" ,SPIE 25 18,1995.
[26] Juda, M., "A Simple Model for the QE of CsI coated MCPs", SAO Internal Memo, 1997. Available at:
http: //hea—www .harvard.edu/juda/memos/
[27] Henke, B. L.,Knauer, J.P.,Premaratne, K, "The characterization of X-ray photocathodes in the 0.1-10-keVphoton energy region". Journal of Applied Physics, vol. 52, Mar. 1981, p. 1509-1520.
[28] (Owens,A., Bayliss, S.C., Durham, P.J., Gurman, S.J. and Fraser, G.W., Ap.J.468,1996
[29] 'CIAO Data Analysis'
http: Ilasc .harvard. edu/ciao/
and
http: /Iasc .harvard.edu/udocs/docs/docs .html
483
Downloaded from SPIE Digital Library on 13 Sep 2010 to 128.103.149.52. Terms of Use: http://spiedl.org/terms
600
5000
4000 -
2000 -
1000 -
1x10⁴ 2x10⁴ 3x10⁴
HRC Rates
300C
U)
line (see)
310
lime (see)
310
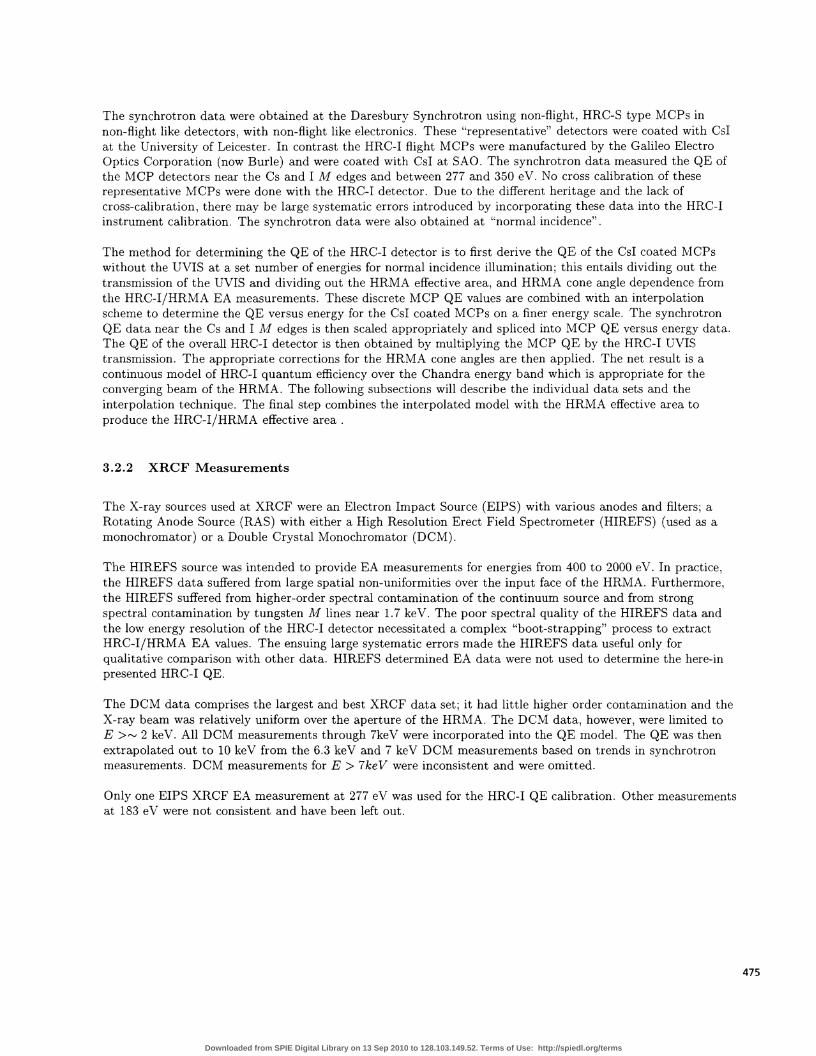
Figure 5: The background variability during a 30 ksec HRC-I observation of the SNR G21.5-09 taken on 1999-10-25 at 04:52:25GMT. The total event rate and the valid event rate show correlated bursts up to 800cts s1 -These bursts in rate are not concentrated in any particular area but are uniformly distributed over the entireHRC-I detector. The anticoincidence shield shows no correlated enhancements; its rate is approximately constantat 4500cts . The total rate and the valid rate differ by 200cts ; this difference is due primarily tovetoed cosmic ray events.
484
Downloaded from SPIE Digital Library on 13 Sep 2010 to 128.103.149.52. Terms of Use: http://spiedl.org/terms

Figure 6: HRC-I Background Map. Average background is 1 x lO5cts s1arcsec2. with a 10% gradientfrom top to bottom. The detector is oriented as in Figure 1. Smoothing is via wavelet decomposition. Contoursare from 8.3 to 9.7 x lO6cts s1arcsec2.
6000
Figure 7: The HRC-I/HRMA Effective Area for out-of-band ultra-violet light.
485
//////
io
E—10
a0
0>U0
T
0 2000 4000Wavelength (Angstrom)
Downloaded from SPIE Digital Library on 13 Sep 2010 to 128.103.149.52. Terms of Use: http://spiedl.org/terms

486
HRMA Effective Area
1200
10
100 1000 10000
UVIS Transmission1.2
100 1000 10000
CsI MCP QE
100 1000 10000
Energy (eV)
Figure 8: HRMA on axis Effective Area, HRC-I UVIS transmission and CsI coated MCP Quantum Efficiency.The MCP QE is not presented below 277eV due to inconsistencies in calibration data.
Downloaded from SPIE Digital Library on 13 Sep 2010 to 128.103.149.52. Terms of Use: http://spiedl.org/terms
I1
CD
CD
C
l)
CD
w
0 C-
C
C
C')
CD
CD
c+.
C
C
C-
CD
C-)
CD
CD
C
91)
Man
son
mod
el 5
667
cm
Xra
y So
urce
Top
Vie
w o
f sou
rce e
nd:
MD
o X
ray
Sou
rce
MD
- "M
onito
r Det
ecto
r"
Man
son m
odel
04 f
low
pro
port
iona
l co
unte
r
BN
D - ' B
eam
Nor
mal
izat
ion
Det
ecto
r'
Man
son m
odel
04
flow
prop
ortio
nal c
ount
er
00
Downloaded from SPIE Digital Library on 13 Sep 2010 to 128.103.149.52. Terms of Use: http://spiedl.org/terms

1000eV
Figure 10: QE of CsI coated HRC-I MCPs. Data from XRCF, Flat field and synchrotron data were incorporated.No values below 277 eV are given due to inconsistencies in data.
HRC-I/HRMA EA
Figure 11: HRC-J/HRMA flight Effective Area.
MCP QE model1.0
p0.8
0.6 -
0.4
0.2 -
0.0L100 10000
100 1000
Energy (eV)10000
488
Downloaded from SPIE Digital Library on 13 Sep 2010 to 128.103.149.52. Terms of Use: http://spiedl.org/terms

C.)
a)Cl)
Na)
NU)
C)
Figure 12: Pictorial representation of broad band verification of HRC-I Effective Area. Source is super novaremnant G21.5-09. HRC-I image is in lower left. A region of the source is analyzed with ACTS detector todetermine counts spectrum. Using X-ray spectral modeling software a possible source spectrum is determined.Modeled spectrum is an absorbed power law. Spectrum is multiplied by HRC-I EA model and integrated. Resultsare within <2% of predicted rate. Data has been corrected for background.
489
0 2 4 6 8 10
Energy keY0 2 4 6 8 10
Energy keY
Subregion predicted rate = 0.50 sec1
measured rate = 0.51 sec
G21.5—09 (HRCI image)
Downloaded from SPIE Digital Library on 13 Sep 2010 to 128.103.149.52. Terms of Use: http://spiedl.org/terms
C.)
a)Cl)
Na)
410
Cas—A (HRCI image)
Subregion predicted rate = 10. sec'
measured rate = 9.3 sec
490
Figure 13: Pictorial representation of broad band verification of HRC-I Effective Area. Source is super novaremnant Cassiopeia A. HRC-I image is in lower left. A small region of the source is analyzed with ACTS detectorto determine counts spectrum. Using X-ray spectral modeling software a possible source spectrum is determined.Modeled spectrum is an absorbed Raymond Smith plasma with variable abundances. Spectrum is multipliedby HRC-I EA model and integrated. Results are within < 10% of predicted rate. Data has been corrected forbackground.
25
20
15
5
0.0015
iii
0.0010
:1
0.0005
0.000000 2 4 6 8 10 0 2 4 6 8 10
Energy keV Energy keV
—..
Downloaded from SPIE Digital Library on 13 Sep 2010 to 128.103.149.52. Terms of Use: http://spiedl.org/terms
1.5 I
1.0 -
A
0.5 -
0.0 I . I
0 500 1000 1500 2000
energy (eV)
Figure 14: De-rating factors for applying HRC-I flat field data to operation in the converging beam of the HRMA.Derating factor was interpolated for other energies and was set = 1.0 for higher energies.
Ar—Lac with 'ghost' Ar—Lac post—processed
Figure 15: Results of modified 3-tap positioning algorithm (hyperbolic test) on the same RS CVn star AR Lacobservation. Left image shows ghost image 5.5 mm (11 arcsec) to the right (+v in detector coordinates) ofmain image. Intensity of "ghost" image is < 1%. "Ghost" image is insignificant (< 0.1%) in post processed data(right image).
491
Downloaded from SPIE Digital Library on 13 Sep 2010 to 128.103.149.52. Terms of Use: http://spiedl.org/terms
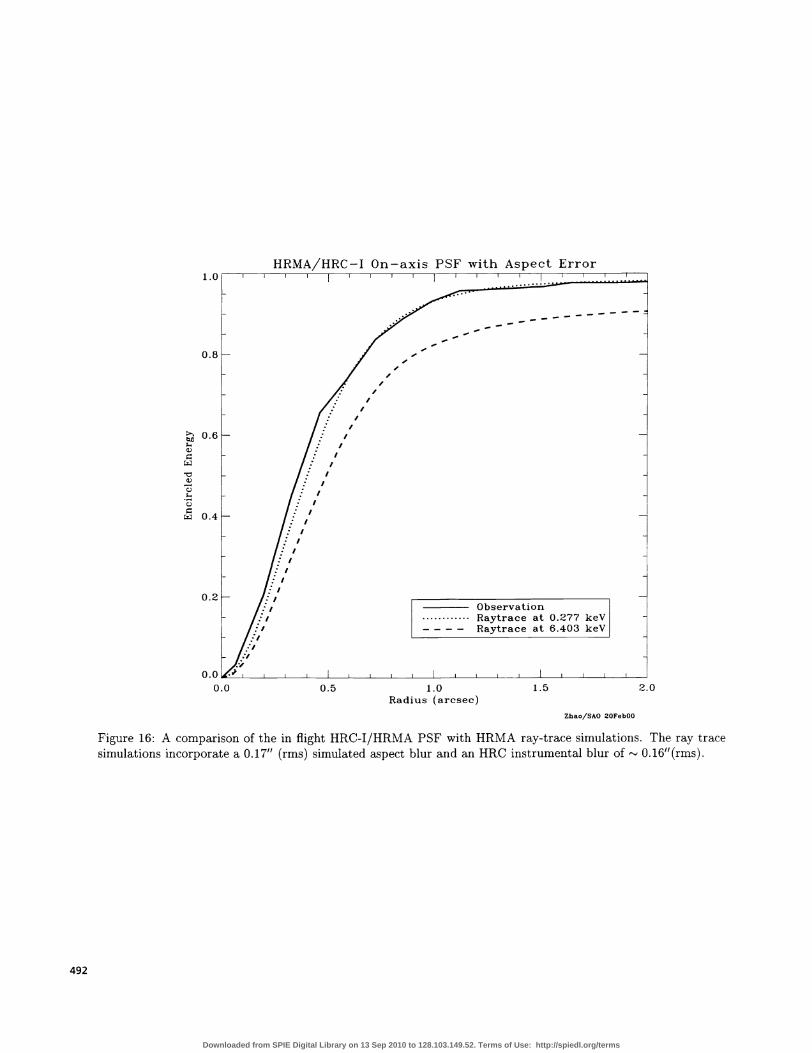
Figure 16: A comparison of the in flight HRC-I/HRMA PSF with HRMA ray-trace simulations. The ray tracesimulations incorporate a 0.17" (rms) simulated aspect blur and an HRC instrumental blur of 0.16"(rms).
—I On—axis PSF with
0.8
0.6a)
a)
C)
C)
c 0.4
0.2
0.00.0 0.5 1.0 1.5
Radius (arcsec)Zhao/SAO 2OFebOO
2.0
492
Downloaded from SPIE Digital Library on 13 Sep 2010 to 128.103.149.52. Terms of Use: http://spiedl.org/terms