Embed Size (px)
Citation preview
Media appearance of firms and earnings management strategy during financial crises
Paul K Chaney1
Owen Graduate School of Management 4483 Heath Road
Vanderbilt University, Nashville, TN 37203
Email: [email protected]: +01 (615)322-2685
Suman LodhMiddlesex University
Middlesex University Business SchoolThe Burroughs, HendonLondon, NW4 4BT, UK
Email: [email protected]: +44(0) 2084115584
Monomita NandyBrunel University
Brunel Business SchoolKingston Lane, Uxbridge
MiddlesexUB8 3PH
UKEmail: [email protected]
Phone: +44(0) 1895268300
1 Corresponding Author
Abstract:
This study examines the influence of media appearance of firms on earnings management
strategies of 632 firms listed on the London Stock Exchange during the financial crisis
period. We find that firms that appear frequently on media are more likely to engage in
earnings management activities. In addition, during the financial crisis firms with higher
media attention do more real earnings management. The findings of the study contribute to
the academic literature related to earnings management, firms’ media attention and financial
crisis. Moreover, the findings are advantageous to investors, regulatory authorities and
corporate managers, who are concerned about firms’ earnings management strategies that
affect firms’ financial performance negatively.
Keyword: Media; Earnings management; Real earnings management; Financial crisis
2
1 Introduction
Media2 coverage is often held responsible for creating pressure on managers when they
report firm’s earnings (Chaney et al., 2011). Many firms’ bear reputational cost as media
highlight the managers’ misbehavior related to reporting of earrings (Dyck et al., 2008). As
media act as a sensitive external monitor, so, the managers try to manage the reporting of
media news in some important corporate events (Dyck and Zingales, 2002; Ahern and
Sosyura, 2014). Managers try to avoid negative news to publish in media. When a firm is
under media attention the managers of the firm resort to alternative ways to meet or exceed
earning target and to do that, in many occasions, they do earning management (Braam et al.,
2015).Thus, it is evident in the literature that media reports firm’s value generating operating,
investing and financing information to the stakeholders of the firm (Schrand and Verrecchia,
2005) and managers prefer to report a better earnings picture in the media. But there is no
clear understanding about the influence of media appearance on the earnings management
strategy of firms.
Earnings predict that to what extent a firm engages in value adding activities. Because
of a direct relationship between a firm’s value and future earnings, the stakeholders of the
firm always want to know the actual earnings of the firm and make sure that the firm follows
a fair practice of reporting of earnings (Dechow and Skinner 2000; Gore et al. 2007).
Management and executives of a firm also need to be assured that earnings of the firm is not
deviated from forecasted figure and if so then it should be managed appropriately for the
firm’s financial benefits which in turn helps them to maintain their own perks and
compensations. Previous studies show that in some situations firms engage either in real
earning management (Gunny, 2005; Roychowdhury, 2006; Zang, 2006) or in accrual-based
earning management (Rangan, 1998; Teoh et al 1998; Shivkumar, 2000; DuCharme et al, 2 We use Factiva database to identify the media appearance of the firms. Factiva database collect information from more than 32,000 sources including newspapers, journals, live newswires etc. around the world.
3
2004) or trade-off among these methods after considering the cost of each (Badertscher2011;
Zhang, 2012). The real earnings management is expensive and largely affects the long-run
performance of firms (Graham et al., 2005; Gunny, 2010). Moreover, compared to accrual
method, real earnings management is not easily detectable by auditors (Cohen and Zarowin,
2010) and it hardly gets attention from the outside stakeholders of the firms. From the above-
mentioned studies, it is clear that to get a complete understanding of earnings management
we need to consider the two strategies of earnings management. But most of these studies
consider an event or change in corporate governance policies which can affect the earnings
reporting (e.g. Cohen et al., 2008). We know that managers use media to give credible
signals to the stakeholders and establish them as good firm (firms do not manage earnings)
against the bad firms (firms manage earnings) (Chahine et al., 2015).So, in this study we are
motivated to test the impact of media appearance of firms on the types of earnings
management behavior of firms.
Existing literature finds evidence of weaknesses of exiting accounting policies and its
impact on earnings management (Cohen et al., 2008). In addition, a number of studies focus
on application of accounting policies by financially instable firms (e.g. Burgstahler and
Dichev, 1997; Charitou et al. 2007a; Charitou et al. 2007b; Charitou et al.,2011; Elliott and
Shaw,1984; Lillien et al., 1988). But these studies fail to capture the earnings management
during financial crisis. The recent financial crisis raises many questions on the earnings
manipulation behavior of these poorly performed firms over years and point out a number of
flaws in the existing policies. There exists doubts about the financial performance of well
performed firms during the crisis. To clarify some of these doubts we need to identify the
major factors that affect the firms’ earnings reporting during the crisis. The sign of the
earnings news (good or bad news) determine the credibility of the managers’ earnings
forecast (Hutton et al., 2003). Based on this reported earnings it is possible to distinguish the
4
well performed firms from the others. But during the time of financial crisis when the
economy declines, all firms usually struggle financially and their capital structure goes
through severe changes. So, the financial crisis create a difficult situation to differentiate
between the good (firms do not practice earnings management) and bad firms. Moreover,
during the financial crisis the media attention towards business environment increases both
for good and bad firms. We know that extensive media coverage of bad news increases the
volatility of stock price, affects investors’ trading behavior (Barber and Odean 2007; Joe et
al. 2009) and it increases the pressure on managers to manipulate earnings. On the other
hand, non-negative media news or good news can also increase the market’s expectation.
Such volatile stock price can also make the managers feel pressurize to manage earnings to
maintain the reputation of the firm (Fombrun and Shanley, 1990). Thus, we believe that the
change in media attention towards the good and bad firms during financial crisis affect
managers’ choice of types of earnings management.
The agency theory is widely used in the earnings management literature. But the
under contextualized nature of the agency theory fails to explain different attitudes of
principal and agents associated with the same risks. . The risk-neutral principals can diversify
their risk (Wiseman and Gomez-Mejia 1998), whereas the risk-averse managers find it
difficult to diversify their risk and are more concerned about their employment security as
their income is tied with a single firm (Donaldson 1961; Williamson 1963). Especially,
during the financial crisis the risk preference of the stakeholders of the firm is different.
Moreover, the pressure created by media can also affect the managers to change the reference
point (meeting or beating earnings target), which has a big impact on the choice of types of
earnings management. Thus, to address the loss aversion concept of managers, we
complement the agency theory by the prospect theory (Kahneman and Tversky, 1979). This
5
theoretical model provides a better understanding of managers’ risk preference at a certain
reference point (meeting or beating earning target) during the time of financial crises.
To examine the relation between firms’ media appearance and earnings management
strategies during the financial crisis we focus on 632 firms listed in the London Stock
Exchange (LSE) for the year 2000 to 2015. The globalized nature of the firms in the UK
expose them to the global financial crisis badly. The media frame the financial crisis as an
international event and extensively report about the UK firms. We find that firms’ media
attention and financial crisis (2008-2012) is significantly related to earnings management
especially with real earnings management. The finding is consistent with the literature
(Braam et al., 2015). The risk preference and loss avoidance features of the Prospect theory
also support our findings. Media attention is associated with reputation cost so managers
make a proper balance between risk preference (doing or not doing earnings management)
and loss avoidance (personal and firm loss if not doing earnings management). In addition,
we find that the firms in the AIM3 (Alternative Investment Market) have more media
attention at the time of the financial crisis. There are 299 firms in the AIM in our sample and
160 FTSE 350 firms (The Financial Times Stock Exchange) and both do more real earnings
management during financial crisis compared to stable economic condition. This finding
from subsample is consistent with ‘impediments-to-trade’ (Fang and Peress, 2009) and
‘investor recognition’ (Merton, 1987) hypothesis. During financial crisis the profit driven
traders are interested to eliminate the mispricing in the market. So, media attention for the
FTSE 350 firms and AIMs firms create pressure on the managers to meet or beat the earnings
expectation. During financial crisis investors always look for alternative market with growth
potential and in our sample the AIM registered firms give immense opportunity for growth
3 “AIM is the most successful growth market in the world. Since its launch in 1995, over 3,600 companies from across the globe have chosen to join AIM. Powering the companies of tomorrow, AIM continues to help smaller and growing companies raise the capital they need for expansion”(Source: London Stock exchange).
6
and grab more media attention as an alternative investment source. More media coverage
means more investor recognition (Fang and Peress, 2009). Thus, the managers of the AIM
firms are under pressure to compensate the investors for their less diversified stock even
during the crisis. So, the total earnings management during the financial crisis is statistically
significant in our study. Higher earnings management is attributed by real earnings
management, which can be theoretically, explain by the Prospect theory along with the
Agency theory.
The rationale for this study is three-fold. Firstly, we highlight one of the main reasons
that drives managers to manipulate earnings. A number of accounting scandals bring about
more attention towards the earnings management practices of mangers. However, the
findings of existing studies are inconclusive as there is a lack of general understanding on the
factors, which encourage managers to manupulate earnings. It has been widely claimed that
firms’ characteristics like return on asset (ROA), firm size, and leverage have significant
impact on earning management (e.g. Cohen and Zarowin, 2010). But our study highlights the
impact of media appearance of firms on earnings management. Secondly, prior studies (e.g.
Chahine et al. 2015; Qi et al, 2014) establish a relationship between the media appearance
and earning management but these studies do not consider the time of financial crisis.
However in literature, we find evidence of media coverage and the ‘quality’ of accounting
information (e.g. Chaney et al., 2011). When media highlight a poor performance of any
firm, the mangers are threatened of their personal benefits (Faccio, 2010). In such situation,
managers switch between accrual and real earnings management strategies either to hide their
wrongdoing or to report a better performance (Braam et al., 2015). These studies motivate us
to assume that the media play a very influential role on firms earning management,
particularly during the financial crisis as excessive pressure from media might change firms
earning management behavior. Thirdly, the composite theoretical model, based on the agency
7
theory and the prospect theory, helps explaining the risk preference and loss avoidance of the
managers and in turn explains their intention behind the use of accrual and real earnings
management. The theoretical model is useful in establishing the above-mentioned
relationship to find impacts of media coverage on earnings management behavior of
managers during the financial crisis.
The findings from this study, thus, not only enrich the academic literature of earnings
management during financial crisis but also beneficial to investors as well as the regularity
authorities dealing with the corporate governance in general and mitigation of earnings
management in particular for decades.
The rest of the paper is organized as follows. Section 2 reviews the relevant existing
literature. The theoretical model and the hypotheses development are discussed in Section 3.
Section 4 explains the methodology and Section 5 empirical findings of this study. Section 6,
concludes with scope for future research.
2 Related literature
There is no universally accepted definition of earnings management (refer, Schippers, 1989,
92; Healy and Wahlen, 1999) because managers follow several strategies to do earnings
management to meet or beat their earnings target. In the UK, firms mainly shift the core
expenses to nonrecurring items (Athanasakou et al 2009; Degeorge et al., 1999) or shift the
income between periods through timing of reported or actual events and restructuring (Bens
and Johnston, 2009). The other commonly used earnings management methods available to
managers are to accelerate sales alteration in shipment schedules and delay in research and
development (R&D) and maintenance expenditures. There are a number of motives for
managers to engage in earnings management, but the ultimate reason is to improve the
financial performance of the firm. Prior literature finds few other motives which include
8
stock market incentives, signaling, concealing information, political cost, debt covenant
constraints, compensation plan provisions, the need to issue equity capital, insider trading,
managers own salary and bonus (see e.g. Watts and Zimmerman, 1986; Jones 1991; Woody
1997; Louis 2004; Burgstahler and Eames, 1998; Roman, 2009 etc.). When firms cannot
meet or beat their analysts’ forecasts, in normal business practice they experience negative
stock return, which badly affects mangers compensation (Matsunaga and Park 2001).
Moreover, better firm reputation also create pressure on the manager to achieve firm’s
earnings target (Fombrun and Shanley, 1990). In such situations, managers try to look for
some alternative ways for meeting their earning targets, one of which is earnings
management. But in doing so, they face constraints such as price rise of raw materials,
pressure from the competing firms, decrease in sales, loss of money and downward trend in
the industry to mention few, which brings them in the attention of media. Managers are
motivated to overcome these bad situations for the sake of their own benefits, for instance
salary increase and compensation contracts and also to maintain the reputation of the firm.
They manipulate the earnings downwards or upwards (for details refer to Healy, 1985;
Holthausen et al.1995). The consequence of the earnings management is that a firm’s
financial report may not accurately communicate its underlying economic position. This is
due to deliberate choice by manager’s financial reporting methods, estimations, and
disclosures (Healy & Wahlen, 1999). However, managerial decisions to engage in earnings
management are normally based on opportunistic reactions in response to incentives created
by specific economic and financial conditions (e.g., economic downturn, or an unexpected
fall in earnings/unexpected loss) (Bernard and Skinner, 1996). But the opportunistic reaction
of managers in response to media appearance during financial crisis is required further
investigation.
9
The accrual earnings management is the most popular method followed by the
managers under adverse situations (Chaney et al., 1998; Luez et al, 2003; Cohen et al., 2008).
It provides the flexibility within the accounting rules to report earnings (Matsumoto 2002,
Phillips et al. 2003, and Krull 2004; Cohen et al. 2008; Braam et al. 2015). The less
expensive (compared to real earnings management) accrual method is extensively used to
beat analysts' forecasts (Moehrle, 2002; Kaznik and McNichols, 2002; and Bartov, 2002).
The popular accrual models are also known as stationary discretionary accrual model (e.g.
Healy model, 1985), DeAngelo model, (1986), Industry model (Dechow and Sloan, 1991); or
the Components model (Thomas & Zhang, 2000). However accrual earnings management
has higher chance to be detected than real earnings management (Cohen et al, 2010). For this
reason the existing studies show that managers prefer real methods over accrual to
manipulate earnings (Bruns and Marchant 1990; Graham et al. 2005; Gunny 2010;
Roychowdhury 2006; Zang 2006; Braam et al. 2015). The choice of real over accrual
earnings management is mainly because of its less detectability and its timing feature (Zang,
2006; Fudenberg and Tirole, 1995). Thus, at the cost of long term performance managers opt
for various methods of real earnings management4 (Gunny, 2010; Bartov,Givoly, and Hayn
2002; Burgstahler and Dichev 1997). Managers also prefer to use these two methods
simultaneously, especially when there is an impact of change in the governance policy on the
economy (Cohen et al., 2008; Cohen and Zarowin, 2010). As we find evidence of impact of
media on accounting quality and selection of types of earnings management (Chaney et al.,
2011; Braam et al., 2015). In literature we also find contradictory findings related to media
attention and earnings management (Qi et al., 2014) We believe that media attention during
the crisis is different for various types of firms and so managers follow different types of
earnings management strategy.
4 see Roychowdhury (2006) for measures of real earnings management use to enhance firm’s credibility and reputation with stakeholders.
10
Government and investors are always concerned about the financial performance of
firms during financial crisis and still try to find out the reason responsible for declining
financial performance of firms and its impact on financial losses to its investors, public and
creditors. Financial distress or crisis can also involve firms in manipulation of earnings,
which may be against the interest of their stakeholders. Also, financial distress can be costly
for a firm if its weak financial condition brings about aggressive response from its
competitors and therefore results loss in market share (Opler and Titamn 1994). So,
investors, analysts, and board members of a firm are particularly interested in financial
reports and earnings figures which provide critical information when investment decisions
are made (Degeorge et al., 1999). Performance indicators such as dividend, cash flows and
capital investments can be used for manipulating earnings as they contain firm’s financial
performance information in more details.
During the financial crisis, volatility of stock price can affect investors’ trading
behavior (Chan 2003; Vega 2006) which put an additional pressure on the managers to
perform well. Firms may lose the equity investment opportunity and may also struggle to pay
back loans borrowed from banks or other financial institutions. Less debt portion leads to
less expansion and low growth. Therefore, the capital structure of a firm undergoes a severe
change within that time period. Thus, to mitigate the adverse financial situation, managers try
to manipulate earnings to maintain their annual bonus and reputation (Liberty and
Zimmerman 1986; Gilson 1989). Evidence suggests that during an economic boom managers
are more likely to manipulate earnings than recession (Strobl 2008), but others studies
indicate that during a crisis period managers actually deploy more income-decreasing
earnings management techniques (Saleh and Ahmed 2005; Ahmed et al. 2008). A survey
carried out recently in Europe, Asia and North America reveals that CFOs (Chief Financial
Officers) cut back investments during financial crisis to avoid business risks (Campello et al.
11
2010). We also find evidence of either income increasing (Rosner, 2003) or decreasing
(DeAngelo et al., 1994) earnings management in financially instable firms (Burgstahler and
Dichev,1997; Charitou et al.,2007a; Charitou et al.,2007b; Charitou et al.,2011; Elliott and
Shaw, 1984; and Lillien et al.,1988). During the financial crisis, all the firms in the economy
are affected to some extent and the existing inconclusive findings fails to capture the
preference on types of earnings management strategies by managers.
During 1970s and 80s a number of studies related to the UK finds that accounting
choice of firms depend on managers' incentives to choose beneficial ways of reporting
earnings (Holthausen and Leftwich, 1983; Watts and Zimmerman, 1986). Since the middle of
1980s accrual earnings management remains a vital practice in the UK. However, a change
was observed with the regulatory changes in the early 1990s. The introduction of Financial
Reporting Standard (FRS3) and other standards issued by the Accounting Standards Board
(ASB) induced a general shift among the UK based firms towards increased transparency and
at the same time strict governance, restrained managerial attempts to manipulate earnings.
Because of the tougher measures introduced, it is now even criticized that whether the UK
firms still use income-increasing abnormal working capital accruals to achieve earnings
targets in the post-FRS3 period (Peasnell et al., 2000). Vasiliki et al. (2006) argue that the
UK firms are more likely to engage in earnings forecast guidance. However, there exists no
association between income increasing abnormal working capital accruals and probability of
meeting analyst forecast. Interestingly, Bens and Johnston (2009) establish an association
between restructuring charges and earnings management while an investigation carried out
by Somnath et al. (2009) discover that for a random sample, it is more likely to find a
reversal of earnings change in the fourth quarter that is expected otherwise. On the other
hand, Iatridis and Kadorinis (2009) find that the UK based firms with earnings reversals are
12
more likely to manipulate earnings and also firms with low profitability and high leverage
measures are more prone to earnings management. These changes in the earnings
management behavior in the UK, especially during the financial crisis provide us a suitable
platform to test our research question.
In recent times, the impact of media, both conventional and electronic has become a
global phenomenon. It collects, selects, rectify and repackage necessary information to the
stakeholders of the firms (Dyck et al., 2008). Media news allows investors to reduce the
information collection cost and also affects the investor sentiment (Barber and Odean, 2008).
Because of this immense importance of media appearance, managers are interested to manage
the reporting of firm news in media in major events (Ahern and Sosyura, 2014). Good and
bad earnings forecast are done in different ways for different reasons and it affects the stock
price differently (Hutton et al., 2003). These earnings forecast are available on media and the
users of these information try to use them to identify the good and bad firms before taking
any financial decision (Chahine et al., 2015). But during the financial crisis when almost all
the firms are affected by economic downtown it is very hard to distinguish between good and
bad firms. Increased media attention about poor performance during crisis can increase the
stock volatility which can in turn pressurize the firms’ manager to manage earnings. Less
media attention during crisis give an impression of better financial performance by the firms
even at crisis time and which also increase the market expectation from this firm
(Humberman and Regev 2001; Chan 2003). This can generate excessive pressure on
managers to maintain the reputation of the firm and they rely on earnings management. But
media also acts as an external monitor (Dyck and Zingales, 2002) which always create an
additional pressure on the managers when they do earnings management. Managers want to
avoid any future loss when they take the risk of doing earnings management. The reference
13
point (meeting or beating earnings target) assist the managers to determine the risk preference
and also identify the associated loss to avoid. Both of these decisions of the managers are
strongly influenced by the expectation and sentiment generated by the media coverage.
Here comes the question of using the type of earnings management (accrual or real). Thus,
we bridge the gap in the literature and establish the link between media attention and types of
earnings management during the financial crisis in the UK.
3 Theoretical framework and hypotheses development
Earnings management has been attributed to a number of different factors and managers
undertake it under several different situations. One of the reasons for earnings management is
the principal (shareholders) and agent (management) conflict, which is explained by the
agency theory in the prior literature. The theory explains that the shareholders and firms’
managers have different goals and their attitude towards managing risk is also different. The
principals are risk-neutral and so they manage to diversify their risks (Wiseman et al. 1998).
As managers’ income is tied up with one firm, their perception of risk is different than the
principal (Willaimson 1963). Most of the time it is impossible and very expensive for the
principal to verify the actual behavior of managers. The managers have more access to their
firms’ operating information as they control the day-to-day financial operations. So, it gives
managers the opportunity to manipulate earnings for their own benefits and in this way they
conceal the true financial information from shareholders. The earnings management also
allows the mangers to maintain their reputation in the financial market by constantly meeting
or beating earnings targets. But the risks associated with meeting or beating earnings target
vary depending upon the managers preference for the reference points. Graham et al., (2005)
suggest that managers feel less (or high) pressure when they have to meet (or beat) earnings
14
target. The loss avoidance choice also varies depending on the extent of better and positive
earnings signals that managers can reveal to the market. So, the reference point (meeting or
beating earnings target) affects the manager’s selection of the types of earnings management,
which allow them to control the risk aversion and loss avoidance according to the need of the
situation. For example, when firms are exposed to media for their bad performance during
the financial crisis, mangers may want to just meet their earnings target, to avoid high risk of
losing job in future. But they may also want to beat the earnings target to avoid the cut in
their future compensation pack, for instance. So, the managers’ earnings management
decision are driven by the intensity of loss avoidance. In many cases, managers may not
prefer to wait till the end of financial year to do earnings management mainly by accrual
methods (Cohen and Zarowin 2010) as it allows them to avoid their expected risks to some
extent. They may choose a regular and continuous year-wide real earnings management for
risk aversion and loss avoidance. This strategy is also hard to be detected by auditors (Cohen
and Zarowin 2010). Because of the under contextualized nature of agency theory, it is
difficult to explain the varying risk taking attitudes of managers and shareholders and the
distinct risk preference of managers. In addition, the agency theory highlights the normative
view of choice behavior of managers and it ignores the motivation behind the problem
framing (Kahneman and Tversky,1979). So, from a behavioral point of view, we bring in the
prospect theory (developed by Kahneman and Tversky, 1979) to explain the reason for
earnings management by managers under media attention. Prospect theory is used by a
number of studies including Wasiuzzaman et al. (2015) in the context of earnings
management.
The prospect theory states that people often take decisions based on perceived gains
rather than perceived losses without considering the final or ultimate outcome (Kahneman
15
and Tversky, 1979). In other words, gain in short time is seen as more preferable than the
predicted final outcome in the long run. Therefore, in order to satisfy their stakeholders
whose preferences are consistent with the prospect theory, managers often try to report
earnings that meet or exceed the earnings targets to attain more rewards. Although the
prospect theory explains the choice of manipulation of earnings management under
uncertainty, it allows the auditors in detecting the earnings management in a competitive
environment because it takes the problem framing into consideration (Burton, 2011). As
media attention creates a pressure on managers, they complement or supplement two types of
earnings management for a better combination of loss aversion and loss avoidance at
different reference point. So by complementing the risk aversion feature of agency theory
with the loss aversion feature of prospect theory, we provide a robust theoretical framework
to explain the earnings management behavior of managers when they have a possibility to be
exposed to media.
Firms have always relied on media to exhibit their financial performance to the
broader audience (prospective investors) and shareholders. Investors and shareholders do not
have access to inside information and often rely on the published information in media.
Chaney and Faccio (2011) document in one of their studies related to politically connected
firms that media have incremental scrutiny beyond country, regularity and firm specific
ownership characteristics. Baarm et al. (2015) show that how the media attention of the
politically connected firms pressurizes their managers to choose the type of earnings
management. Media often highlight two types of earnings news, good news and bad news.
Good news are almost always associated with increased stock price, employees’ better
performance, increased bonuses etc. But as the traders try to exploit the mispricing it
generate more pressure on the managers to keep on maintaining high returns in future to
16
avoid any personal loss. On the other hand, negative earnings news are mostly associated
with the uncertainty of firms’ operation, motivating managers to delay the disclosure of bad
news (Li 2006; 2008; Bloomfield 2008; Brown et al. 2009; Ertimur et al. 2011). Graham et
al. (2005) also document similar results from his survey, which proves that top-level
executives acknowledge that they prefer to delay bad-news disclosures. Despite the negative
news appearance in the media, if a firm still performs well and yields high earnings at the end
of stipulated period, media often speculate the firm’s success and raise question about its
profitable business. Therefore, managers are under pressure to give proper explanation to
these questions raised and circulated. Moreover, managers prefer to pay extra premium for
their non-diversified stock to attract more investors which force them to generate more short
term earnings and in this way they can avoid the job loss. In such situation managers decide
the reference point (to meet or beat earnings target) and accordingly take a decision about the
extent of loss avoidance and risk aversion activities they prefer to take. Without attracting
further media attention, managers do earnings management to achieve their reference point.
To summarize, media play a very important role for firms when it comes to earnings
management. Based on the above discussion, our first hypothesis is as follows:
Hypothesis 1: All else equal, firms which appear more in media do more earnings
management
As media coverage affects the volatility in the stock market and also the trading behavior
(Barber and Odean 2007; Joe et al. 2009), so, any sensitive news in media during crisis can
generate immense pressure on the mangers. A negative financial review in media can greatly
damage the reputation of a firm and result in irreversible damage (Dyck et al., 2008). A
positive earnings news during the time of financial crisis demonstrate excellent performance
17
by the firm and is highly related with the reputation of the managers and the firm. Such
strong reputation bring in new challenge for the managers to maintain the earnings even at
the time of financial crisis and keep on meeting the expectation of the stakeholders of the
firm. Managers prefer to frame the problem either negatively (meeting earnings target) or
positively (beating earnings target) and accordingly develop the matrix of risk preference and
loss avoidance to address the problem. This problem framing is consistent with the prospect
theory. Firms, which appear frequently in media, are particularly prone to media even during
a financial crisis period. By earnings management, managers response to the market
sentiment created by media especially during crisis. An increase in earnings management can
slow, delay or soften large write-offs on assets or write-ups on liabilities for a balance sheet
and can also minimize the impact on income statements in short run. Such activities could
also affect the liquidity position of the firms during crisis which in other way would affect
the earnings and reputation of the firm and the manager. Therefore, we predict the
following:
Hypothesis 2: All else equal, firms, which appear more in media during a financial crisis, do
more earnings management.
Prior studies document that in well-developed capital markets, media play the role of
external monitor (see Miller 2006; Dyck et al. 2008; Joe et al. 2009). By distributing
information from intermediaries and undertaking the original investigation, media carry out
the role of a watchdog against accounting fraud (Miller, 2006). Joe et al. (2009) argue that
media exposure forces target agents to take corrective actions and increases shareholders
wealth. Thus, media can create excessive pressure on managers, which force them to think
18
how to deal with loss avoidance and risk aversion at various reference points and in most of
the time they resort to manage earnings (Braam et al. 2015). Instead of relying completely on
the year-end accrual earnings management, managers prefer to complement it with real
earnings management for meeting or beating (reference points) the earnings target. In accrual
earnings management, the chance of being detected is quite high (Cohen and Zarowin 2010)
which is also associated with high risk of future job security (Zhang 2006). During the
financial crisis, most managers are concerned about the short-term performance of the firms
at the cost of long-term performance to maintain their personal benefits. In most situations,
managers swap between accrual and real to securely avoid the risks and minimize the
associated loss (Zhang, 2012). So, we assume that at the time of financial turmoil managers
prefer to do real earnings management as it help them to get a short-term gain and avoid the
risk of being detected of their wrong doings, mainly when they are highly exposed to the
media. Based on the above discussion, our next hypothesis is as follows:
Hypothesis 3: All else equal, firms, which appear more in media do more real earnings
management than accrual-based earnings management during a financial crisis.
4 Methodology
4.1 Sample Selection
We collect all the active listed firms on the London Stock Exchange from Datastream.
We exclude the firms that belong to banking and financial industry because their
financial valuation ratios are not comparable with those of non-financial firms. In
addition after calculating all the measures of earnings management, we find many firms
have missing information of earnings management variables. So, the sample size reduce
to 771 firms after deleting financial and other firms without earnings management
19
measures.. Our study focuses on financial crisis period, which starts from 2008. To
capture the impact of the financial crisis we need to have firms incorporated at least 3
years before the financial crisis and so we drop firms with an incorporation date
sometime on or after 2005. The final sample consists of 632 firms for the year 2000 to
2015.
Media News
For each of these 632 firms we manually search the media information (news articles
that documents news about the firm) from Dow Jones Factiva database, which includes
news release that reveal firms good and bad news. We recorded number of articles
with the sample firm in their headlines. The full text news content in Factiva is collected
from The Wall Street Journal, The New York Times, Business Wire and Public Relation
Newswire, Magazines, Blogs, Podcasts, and Websites, Other Sources, Reports around the
world. So, we manage to capture all media appearance of all the firms in our sample. In
addition, we also manually extract the number of articles where negative sentiment
regarding the earnings is published about the sample firms
4.2 Earning management measures and Variable description
4.2.1 Accrual Measures
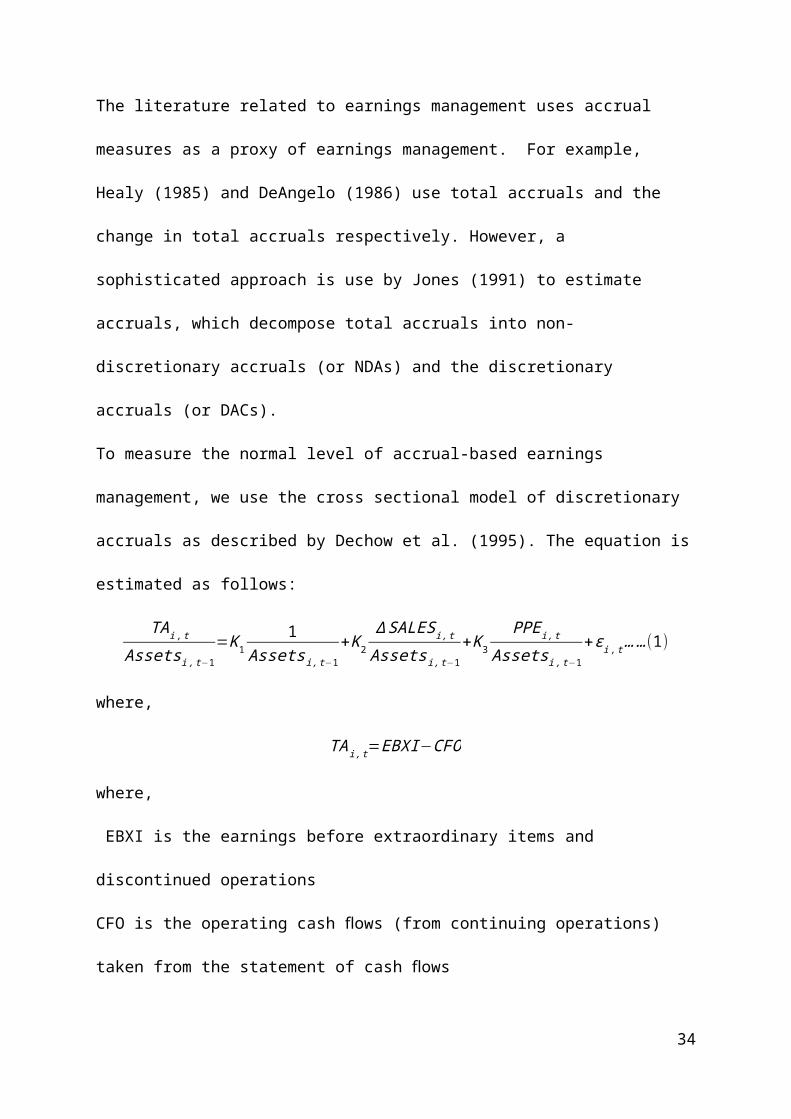
The literature related to earnings management uses accrual measures as a proxy of earnings
management. For example, Healy (1985) and DeAngelo (1986) use total accruals and the
change in total accruals respectively. However, a sophisticated approach is use by Jones
(1991) to estimate accruals, which decompose total accruals into non-discretionary accruals
(or NDAs) and the discretionary accruals (or DACs).
20
To measure the normal level of accrual-based earnings management, we use the cross
sectional model of discretionary accruals as described by Dechow et al. (1995). The equation
is estimated as follows:
TAi ,t
Assetsi , t−1=Κ1
1Assetsi ,t−1
+Κ2
∆ SALESi ,t
Assets i ,t−1+Κ3
PPE i ,t
Assetsi , t−1+εi ,t … …(1)
where,
TAi , t=EBXI−CFO
where,
EBXI is the earnings before extraordinary items and discontinued operations
CFO is the operating cash flows (from continuing operations) taken from the statement of
cash flows
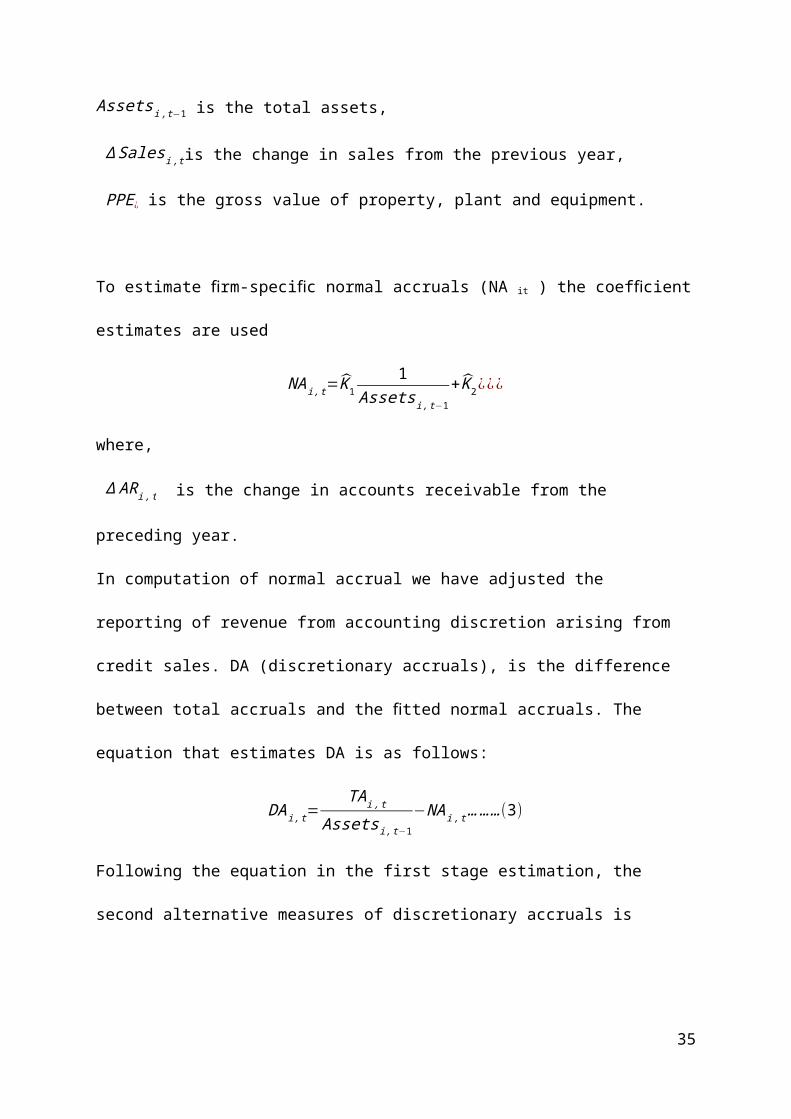
Assetsi ,t−1 is the total assets,
∆ Salesi ,tis the change in sales from the previous year,
PPE¿ is the gross value of property, plant and equipment.
To estimate firm-specific normal accruals (NA it ) the coefficient estimates are used
NAi , t=Κ̂11
Assetsi , t−1+ Κ̂ 2¿¿¿
where,
∆ ARi ,t is the change in accounts receivable from the preceding year.
In computation of normal accrual we have adjusted the reporting of revenue from accounting
discretion arising from credit sales. DA (discretionary accruals), is the difference between
total accruals and the fitted normal accruals. The equation that estimates DA is as follows:
DAi ,t=TAi , t
Assets i ,t−1−NAi , t ………(3)
21
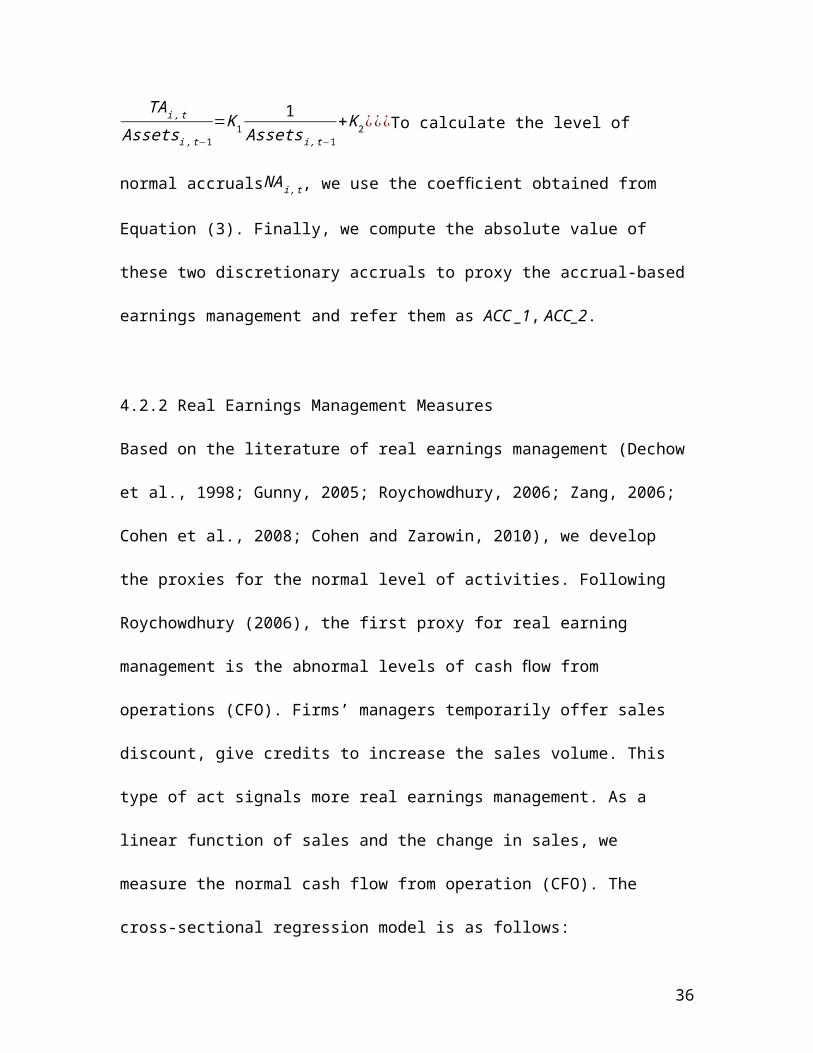
Following the equation in the first stage estimation, the second alternative measures of
discretionary accruals is
22
TAi ,t
Assetsi , t−1=Κ 1
1Assetsi ,t−1
+Κ2 ¿¿¿To calculate the level of normal accrualsNAi , t, we use
the coefficient obtained from Equation (3). Finally, we compute the absolute value of
these two discretionary accruals to proxy the accrual-based earnings management and
refer them as ACC _1, ACC_2.
4.2.2 Real Earnings Management Measures
Based on the literature of real earnings management (Dechow et al., 1998; Gunny, 2005;
Roychowdhury, 2006; Zang, 2006; Cohen et al., 2008; Cohen and Zarowin, 2010), we
develop the proxies for the normal level of activities. Following Roychowdhury (2006),
the first proxy for real earning management is the abnormal levels of cash flow from
operations (CFO). Firms’ managers temporarily offer sales discount, give credits to
increase the sales volume. This type of act signals more real earnings management. As a
linear function of sales and the change in sales, we measure the normal cash flow from
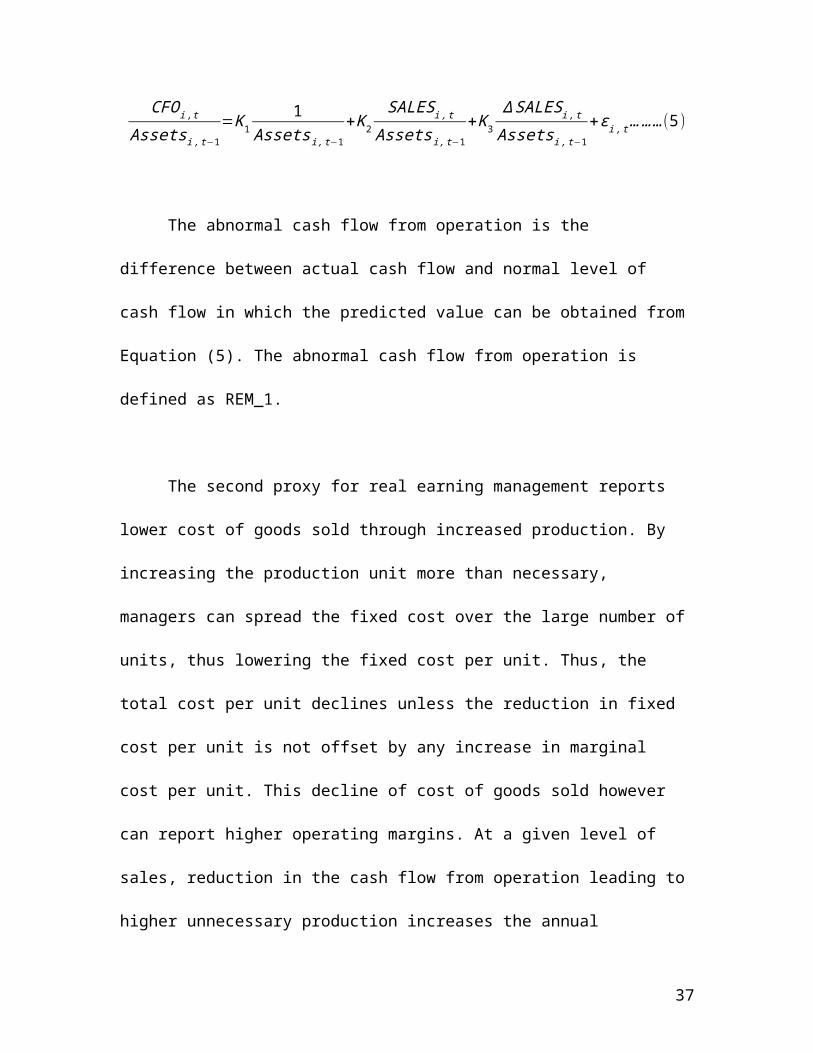
operation (CFO). The cross-sectional regression model is as follows:
CFOi ,t
Assetsi , t−1=Κ1
1Assetsi ,t−1
+Κ 2
SALES i , t
Assetsi ,t−1+Κ3
∆ SALES i ,t
Assetsi ,t−1+εi ,t … ……(5)
The abnormal cash flow from operation is the difference between actual cash
flow and normal level of cash flow in which the predicted value can be obtained from
Equation (5). The abnormal cash flow from operation is defined as REM_1.
The second proxy for real earning management reports lower cost of goods sold
through increased production. By increasing the production unit more than necessary,
23
managers can spread the fixed cost over the large number of units, thus lowering the
fixed cost per unit. Thus, the total cost per unit declines unless the reduction in fixed cost
per unit is not offset by any increase in marginal cost per unit. This decline of cost of
goods sold however can report higher operating margins. At a given level of sales,
reduction in the cash flow from operation leading to higher unnecessary production
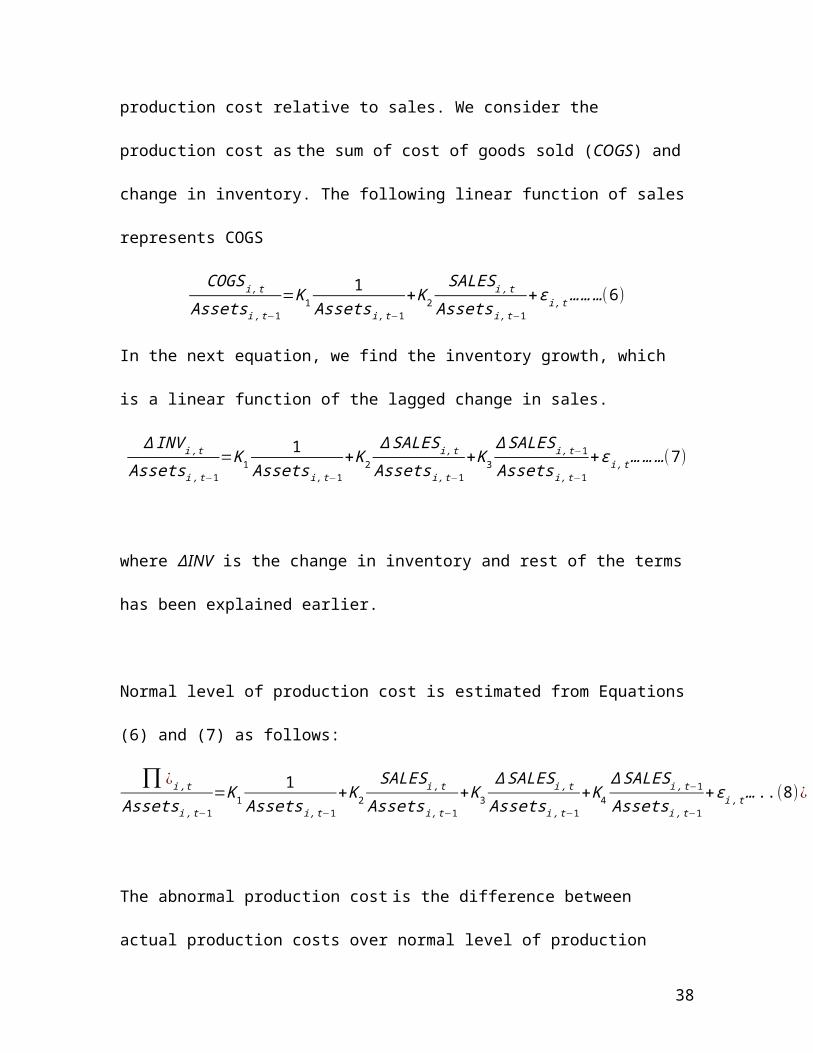
increases the annual production cost relative to sales. We consider the production cost as
the sum of cost of goods sold (COGS) and change in inventory. The following linear
function of sales represents COGS
COGSi ,t
Assetsi , t−1=Κ1
1Assetsi ,t−1
+Κ2
SALES i , t
Assetsi ,t−1+εi ,t ………(6)
In the next equation, we find the inventory growth, which is a linear function of the
lagged change in sales.
∆ INV i, t
Assetsi , t−1=Κ1
1Assetsi ,t−1
+Κ2
∆ SALESi ,t
Assets i ,t−1+Κ3
∆ SALESi , t−1
Assetsi , t−1+εi ,t ……… (7)
where ∆INV is the change in inventory and rest of the terms has been explained earlier.
Normal level of production cost is estimated from Equations (6) and (7) as follows:
∏ ¿i , t
Assetsi , t−1=Κ 1
1Assetsi ,t−1
+Κ2SALES i , t
Assetsi ,t−1+Κ3
∆ SALES i ,t
Assetsi ,t−1+Κ 4
∆ SALES i ,t−1
Assetsi ,t−1+ε i, t … ..(8)¿
The abnormal production cost is the difference between actual production costs over
normal level of production cost, which is estimated from Equation (9). We define
REM_2 to represent the abnormal production cost. The higher or positive value of
24

REM_2 indicates more real earnings management. Higher value of production cost
indicates overproduction that reduces COGS.
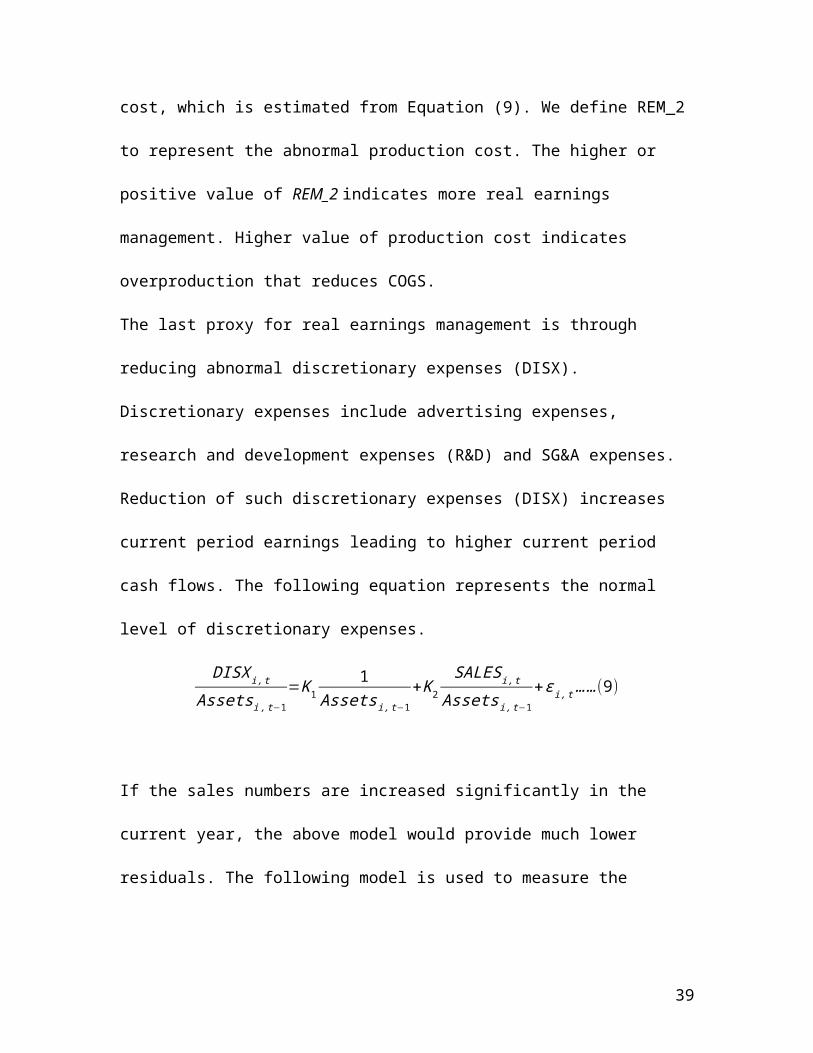
The last proxy for real earnings management is through reducing abnormal discretionary
expenses (DISX). Discretionary expenses include advertising expenses, research and
development expenses (R&D) and SG&A expenses. Reduction of such discretionary
expenses (DISX) increases current period earnings leading to higher current period cash
flows. The following equation represents the normal level of discretionary expenses.
DISX i , t
Assetsi , t−1=Κ1
1Assetsi ,t−1
+Κ 2
SALES i , t
Assetsi ,t−1+εi ,t …… (9)
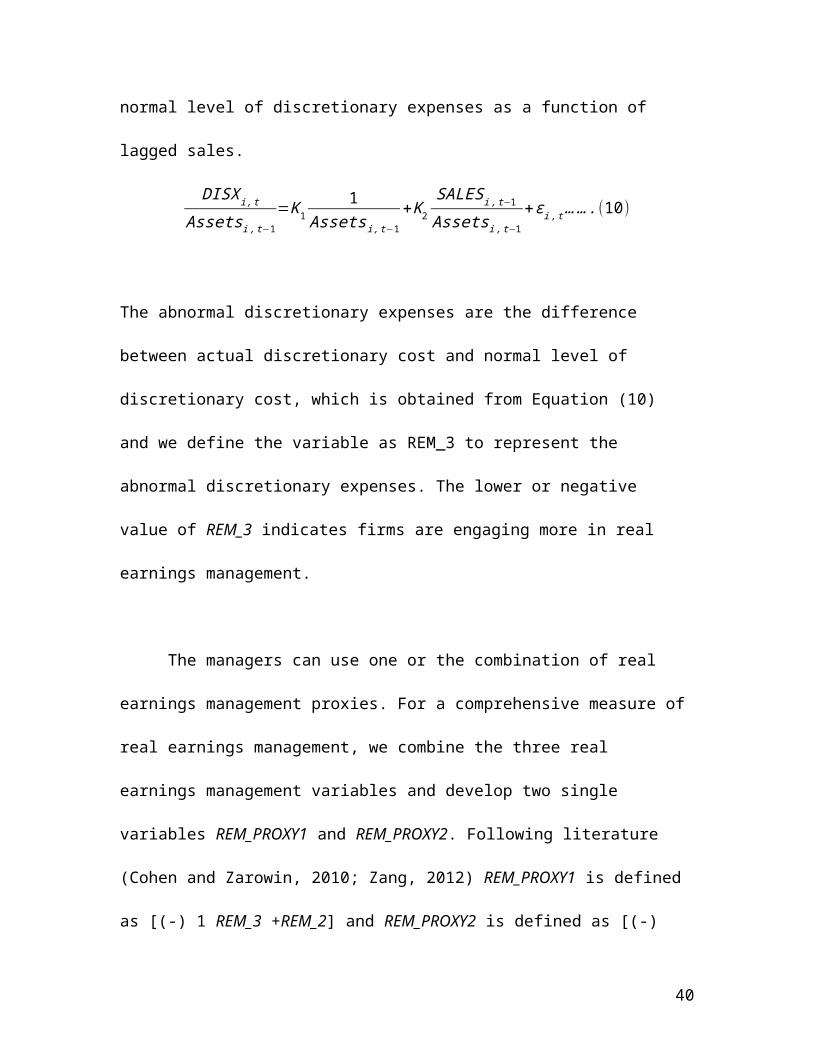
If the sales numbers are increased significantly in the current year, the above model
would provide much lower residuals. The following model is used to measure the normal
level of discretionary expenses as a function of lagged sales.
DISX i , t
Assetsi , t−1=Κ1
1Assetsi ,t−1
+Κ2
SALESi , t−1
Assets i ,t−1+εi ,t ……. (10)
The abnormal discretionary expenses are the difference between actual discretionary cost
and normal level of discretionary cost, which is obtained from Equation (10) and we
define the variable as REM_3 to represent the abnormal discretionary expenses. The
lower or negative value of REM_3 indicates firms are engaging more in real earnings
management.
The managers can use one or the combination of real earnings management
proxies. For a comprehensive measure of real earnings management, we combine the
25
three real earnings management variables and develop two single variables
REM_PROXY1 and REM_PROXY2. Following literature (Cohen and Zarowin, 2010;
Zang, 2012) REM_PROXY1 is defined as [(-) 1 REM_3 +REM_2] and REM_PROXY2 is
defined as [(-) 1REM_3+ (-) 1REM_1]. The higher value of REM_PROXY1 or
REM_PROXY2 indicates more real earnings management. We report the results
corresponding to REM_PROXY1 and REM_PROXY2 as well as REM_1, REM_2 and
REM_ 3 as the individual variables. However, in the robustness test we use AEM
Dummy and REM dummy. Here, AEM dummy is equal to one if a firm's accrual-based
earnings management measure, i.e., DA1 or DA2 is above industry-year median, and
zero otherwise (Cohen & Zarowin, 2010). REM dummy is an aggregated dummy
variable of real earnings management that is equal to one if one of the individual real
earnings management measures is above the industry-year median, and 0 otherwise
(Cohen & Zarowin, 2010).
4.2.3 Independent and other key control variables
To test the impact of media the independent variable is Log of Media. We count the
number of articles of each firms for each of the year to define the variable. The other
independent variable is crisis. Crisis is 1 during the year 2008-2012 and 0 otherwise. The
interaction variable Log (Media)* Crisis is the main independent variable to test the
impact of media appearance during crisis on earnings management.
Firm’s characteristics play an important role in earnings management. In all the
equations, to control for the firm’s relative size we include industry-adjusted log value of
26
total assets (Asset). There is a less chance of being default by large firms and they can
increase their future cash flows and enjoy lower yield and debt. Firm size can have
positive association with earnings management because the larger firms have more
pressure to meet or beat the expectation (Barton and Simko 2002). For more
sophisticated internal control systems, audited by high quality auditors, and high risk of
being detected for manipulating accounting information, size may have negative
association with earning management. Leverage is calculated as total debt divided by
total assets. It is expected to be positively related to earnings management measures
because managers manipulate earnings before applying for the debt. Prior literature
establishes that high leveraged firms have paid most of the higher spread. Tangibility is
calculated by dividing PP&E by total asset. ROA is the return on assets. It informs
investors or other outsiders that how firm is using its asset for generating profit. Higher
ROA is better for the firms as they earn more money with less investment. To maintain a
steady ROA managers can do earnings management in time of crisis. The variable
SHARES can be defined as the natural logarithm of the number of shares outstanding
(Barton and Simko 2002; Zang 2006). In order to achieve the required per share earnings
target, a firm requires to engage in more earnings management activity. This higher
target can either encourage firms to increase their earnings management activities (Zang,
2006) or discourage any earnings management practice altogether because higher target
is considerably more difficult to achieve (Barton and Simko, 2002). We also control for
the book-to-market ratio denoted as M_B. This variable give an indication of firm’s
position in the market. Reputation is an important economic asset which generate future
rent for the firm, especially when there exist asymmetric information among the actors of
27
the firm (Hsu, 2004). So, we control for reputation and the variable is the difference
between the incorporation date (establish date) and the base date (the date the firm is
listed on London Stock Exchange). We also control for industry and year effect.
4.3 Empirical model
The following model is used to empirically test our research question:
Earnings Management ¿=β0+β1 log(Media)i(t−1)+β2 X¿' +δt+γi+ε¿………… ..(1)
where, the main dependent variables are earnings management measures (as described
before). We use one year lagged value of the media variable to control any endogeneity
effect of the variable. X is vector of control variables. δ t and γi are the year and firm
specific fixed effects.
β1 provides us the information about the effect of media on earnings management during
financial crisis. To control for the variations in profitability, earning target, growth,
capital structure, information asymmetry, size and reputation, we have included ROA,
Shares, M_B, Leverage, Tangibility, and Reputation respectively in the model. Note that
it is impossible to capture the impact of all the variables that can have an impact on
earnings management in one study. But following the literature (e.g. Healy and Wahlen,
1999; Fields et al., 2001) we have considered most the variables in our model.
28
5 Empirical Findings
5.1 Descriptive Statistics
Figure 1 reports the media exposure of the UK firms during the period of 2000-2015.
Compared with FTSE 250 and AIM market FTSE 100 firms and the firms in the Main
market get more media attention throughout the period. In addition, in this figure we find
that the media attention is higher during the time of financial crisis (2008-2012) against
the other years in the sample for all firms in the sample.
Insert Figures 1 and 2 about here
Figure 2 reports the trend of negative sentiment in media. By negative sentiment we
mean negative news about the firm reported in media. We count the negative word in all
the text document reported in Factiva. In continuation of the first figure we find that
media report more negative news during the financial crisis and they were more for firms
in Main market and for firms in FTSE 100 compared with others in the sample. This
could be another reason for the media attention towards the AIM’s firms during crisis.
Less negative news were reported in media about firms in AIM.
Insert Table 1 about here
Table 1 reports the percentage of media attention in different industry included in our
sample. Though consumer services is getting highest media attention but the negative
29
sentiment is highest in the oil and gas industry and is also quite considerable in the health
care industry.
Insert Table 2 about here
In Table 2 we report the detail descriptive statistics for the full sample and also for the
subsample in AIM and FTSE350. The mean, median and standard deviation of the final
sample is 4.69, 4.37 and 1.74 respectively. The statistics are quite higher for FTSE350
when compared with AIM firms. Table 3 describe the correlation among all the variables
used in this study. We find that the accrual earnings management and the real earnings
management measures are negatively and significantly correlated with each other. This
indicate that the managers are using any of the accrual or real measures to do earnings
management. The findings are consistent with the literature (Braam et al., 2015). We
have also checked the multicollinearity of all the variables and found that VIF is around
5 and no variable has VIF more than 10. So, the variables in our data do not suffer from
multicollinearity.
Insert Table 3 about here
5.2 Multivariate Analyses
Table 4 test the validity of our first hypothesis which examine the impact of media
appearance on total earnings management behavior of the sample firms. We have used
Equation (1) without crisis and the interaction variable of media and crisis. From the
Pooled OLS with firm fixed effect, we find that the total earnings management (Total
30
EM) is positively and significantly (β1=0.0372, at 5% significance level) related to media
appearance (proxy by Log of Media). In addition, the negative coefficient of the two
accrual measures give an indication that the firms prefer to do less accrual earnings
management when the media attention is extensive.
Insert Table 4 about here
As discussed before, the correlation table shows that managers choose to use any types of
earnings management whenever they need to do so to meet or beat their target. So, very
often it is really hard to identify the type of earnings management preferred by the
managers. We try to capture this in Table 5 and use the Equation 2 to estimate the model.
Earnings Management ¿=β0+β1 log(Media)i(t−1)+β2 Crisis¿+β3 X¿' +δt+γ i+ε¿ ……………… ..(2)
Insert Table 5 about here
We can observe that the total earnings management is positive and significant (β1
=0.0264 at 5% significance level) at the time of crisis but we cannot identify the
preference of the type of earnings management from this table. It seems from the Table 5
that during the financial crisis, managers are doing both accrual-based (Dependent
variable DA1 and DA2) and real (Dependent variable RM1 and RM2) earnings
management. As positive coefficient of RM1 (or RM3) means less real earnings
management and negative RM2 means more real earnings, the results contradict our
Hypothesis 2 based on theory. But as the total earnings management is increasing, it is
31
not clear from the table whether managers are doing more real than accrual-based
earnings management or vice-versa.
We suspect that when we include the crisis variable in the model (Equation 1), the model
suffers from endogeneity due to the reverse causality of Media variable. Thus, we use
advance econometric modelling to identify the preference of earnings management and
the result is reported in Table 6. We run 2SLS regression model with firm fixed effect
and use the negative sentiment as an instrument for Media variable in the first stage. The
fitted value [ l̂og(Media)¿¿from the first stage is then used in the second stage as an
independent variable with other variables. The First stage F-state is 16.38 which provides
evidence that the model does not suffer from weak instrumentation.. We have also
included the interaction term between Media and Crisis as show in Equation 3.
Earnings Management ¿=β0+β1 l̂og(Media)¿+β2Crisis¿+β3 ¿
Insert Table 6 about here
In addition to the other variables, we have also used real and accrual-based earnings
management dummy (see variable definition in Appendix) as shown in Table 6.
From the estimates in Table 6, we see that RM2 is positive and statistically significance
(β2=0.1327 and significance at 5% level) which is greater than the coefficient of DA1 (β2
=0.5531 and significance at 10% level). This supports our Hypothesis 2. We can also see
that during the financial crisis when the media attention increases mangers prefer not to
32

do accrual earnings management which is indicated by the negative co-efficient of
Media*Crisis (β3=-0.0791 and -0.0813 respectively for DA1 and DA2, significance at
10% level) in Table 6. We argue that during crisis more media attention created a high
chance of detection of wrong earnings reporting by the firms and it is also hard for the
managers to wait till end of the financial year to do earnings management. So, the
managers prefer to adjust the reference point (meet or beat earnings target) and
accordingly work out a better risk preference and loss avoidance strategy and prefer real
earnings management as indicated by the negative co-efficient of RM1 in Table 6 (β3
=0.1266 and significance at 10% level)..This supports our Hypothesis 3.
As the endogeneity affects both dependent and independent variable due to reverse
causality, the 2SLS estimator may suffer from weak instruments. Moreover, although
news articles may publish on daily basis, we aggregate the number of media articles at
the yearly level as our earnings management variables are calculated on yearly basis. In
fact firms publish their financial reports at least quarterly, but not daily. So, we think that
there is problem of simultaneity where both earnings management and media attention
occurs in the same year (as we do not have information about the date of news
publication and earnings management). In such situation problem, following Wintoki
et al. (2012) we employ system GMM estimator that combines a
regression in differences with one in level (Arellano and Bover 1995;
Arellano and Bond 1995; Blundell and Bond 1998). For comparable results
with our previous results, we use two-step system GMM.
33
In the first step, a first difference of the model is estimated to address
the problem of time invariant unobserved heterogeneity. The equation
in first difference form is;
Δ Earnings Management¿=β0+β1 Δ̂ log(Media)i (t−k)+β2 ΔCrisis¿+ β3 Δ¿, k >0
In the second step, we use a GMM framework in which the lagged
values of the explanatory variables are used as instruments for the
exogenous regressors.
Insert Table 7 about here
In Table 7, we report the findings from the two step dynamic system GMM estimation.
Earnings Management variables, Media and Crisis are treated as endogenous, all other
firm-level variables are treated as predetermined and treated as strictly exogenous in this
model. Hansen J test is done for the exogeneity of the subset of instruments. The positive
and significant co-efficient of Media*Crisis (2.15%) with respect to total earnings
management establish that during the financial crisis when media attention is more,
overall the firms are doing more earnings management. The results from Table 6 and
Table 7 support our second and third hypotheses explained before.
5.3 Robustness Test
34
In this section we analyze the data from a different perspective. Figure 1 and 2 show that
during 2008-2012, the media attention was at its peak except AIM registered firms. In
fact the media attention increases around 2010. From our previous discussion, we see
that the financial crisis triggers the real earnings management in the presence of high
media exposure of the UK firms. When we plot a contour graph (Figure 3) of All Media
and Negative Media documents against Year in the 3rd Axis for the full sample (632
firms), we find that in general for all the firms the news with negative sentiment is very
prominent and positively correlated with the overall media attention during 2008-2012.
Previous studies identifies that industry peers suffer a negative shock when a target firm
restates its accounting information (Gleason et al. 2008). So we want to look at our
previous results (shown in Table 6) in details by considering industry in the construction
of earnings management measures of our model.
Insert Figure 3 about here
Following the literature we generate accrual and real earnings management proxy
(explained in the variable description section) and also accrual and real industry year
dummy (Cohean and Zarowin, 2010; Braam et al., 2015). Positive value of real earnings
proxy means higher real earnings management. In Table 8 we observe higher media
attention leads to higher real earnings management as the coefficient of the media
variable is positive and significant and is higher than the accrual measures. The crisis is
also positive and significant and possess a higher value for real earnings management
measures. The main independent variable Media*Crisis is statistically significant for
35
both accrual and real measures but the accrual measures are negative and real measures
are positive. The findings from the Probit regression in Table 8 are consistent with our
main findings stated in the previous section.
Insert Table 8 about here
In figure 1 we observe that all the listed firms in the UK market are under more media
attention during the time of financial crisis compare with the other times. This is
prominent in case of firms in FTSE250 and in AIM. So, we believe that higher media
attention during financial crisis generate pressure on managers for all firms to maintain
the reputation of the firm and to avoid the auditors, media and other watchdogs they
prefer to do real earnings management during crisis. We find the evidence in Table 9.
Insert Table 9 about here
This table reports that firms in AIM and FTSE 350 prefer more real earnings
management than accrual earnings management at the time of crisis. The findings are
consistent with the findings related to the full sample.
6 Conclusion
This study examine the influence of media appearance on the earnings management
behavior of the managers. The study extend the existing study by critically discussing the
above relation at the time of financial crisis. The findings from our study conclude that
36
media appearance of firms has a significant impact on earnings management, particularly
during the financial crisis. In this study, we consider a sample of 632 firms listed in the
London Stock Exchange over a period of 2000-2015. Firms in the sample are spread over
both in Main market and AIM. We also examine the preference of the type of earnings
management for the overall sample and also for the firms in FTSE 350 and AIM. We
find that managers of firms with more media attention are under more pressure to meet or
beat the earnings target and so they do more earnings management. During the time of
financial crisis the media attention increase substantially and that generate additional
pressure on the managers to maintain reputation by achieving the financial target and so
they do earnings management. But as media act as an external monitor and more media
attention is associated with high chance of being caught by the auditor for any wrong
doing, so, managers make a proper combination between risk preference and loss
avoidance and do more real earnings management compared to accrual. FTSE 350 and
AIM firms are more in media attention during crisis compared to other time. Thus, they
do more real earnings management at the time of crisis. Our findings enrich the earnings
management literature as it highlights the importance of media attention during crisis.
The outcome of the study will assist the corporate governance policy makers to assess the
depth of firms’ earnings management behavior. In future we plan to extend the study by
incorporating media tone to a cross country set-up.
37
References
Arya, A., J. Glover and S. Sunder (1998) 'Earnings Management and the Revelation Principle', Review of Accounting Studies 3(1): 7-34.
Athanasakou, V. E., Strong, N. C., & Walker, M. 2009, "Earnings management or forecast guidance to meet analyst expectations? ", Accounting & Business Research, vol. 39, no. 1, pp. 3-35.
Ayers, Benjamin C., John Jiang, and P. Eric Yeung. "Discretionary accruals and earnings management: An analysis of pseudo earnings targets." The Accounting Review 81.3 (2006): 617-652.
Baber, W.R., Fairfield, P.M., Haggard, J.A., 1991. The effect of concern about reported income on discretionary spending decisions: the case of research and development. Accounting Review 66, 818–829.
Badertscher, B. 2011. Overvaluation and the choice of alternative earnings management mechanisms. The Accounting Review 86 (September): 1491–151.
Barth, M. E., J. A. Elliot, and M. W. Finn. 1999. Market rewards associated with patterns of increasing earnings. Journal of Accounting Research 37 (2): 387–413.
Barton, J., Simko, P.J., 2002. The balance sheet as an earnings management constraint. The Accounting Review 77, 1–27.
Bartov, E., 1993. The timing of asset sales and earnings manipulation. The Accounting Review 68, 840–855.
Bartov, E., D. Givoly and C. Hayn. 2002. The rewards to meeting or beating earnings expectations. Journal of Accounting and Economics 33 (2): 173-204.
Bartov, E., Givoly, D., & Hayn, C. (2002). The rewards to meeting or beating earnings expectations.Journal of Accounting and Economics, 33, 173–204.
Bell J, Loane S (2010). "New Wave" Global Firms: Web 2.0 and SME Internationalisation. J of Marketing Management, 26(3-4), 213-229.
38
Bens, D., Nagar, V., Franco Wong, M.H., 2002. Real investment implications of employee stock option exercises.Journal of Accounting Research 40, 359–393.
Benston, G. J. & Hartgraves, A. L. 2002, "Enron: what happened and what we can learn from it", Journal ofAccounting and Public Policy, vol. 21, no. 2, pp. 105- 127.
Bernard, V. L. and D. J Skinner 1996. "What motivates managers' choice of discretionary earnings management?" Journal of Accounting and Economics 22(1-3):313-325.
Bloomfield, R. 2008. Discussion of: Annual report readability, current earnings, and earnings persistence.Journal of Accounting and Economics 45: 248–252.
Braam,G.J.M.,Nandy, M., Weitzel, U., and Lodh, S.(2015) "Accrual-based and Real Earnings Management and Political Connections", The International Journal of Accounting (forthcoming)
Brown, S., S. A. Hillegeist, and K. Lo. 2009. The effect of earnings surprises on information asymmetry.Journal of Accounting and Economics 47: 208–225.
Bruns, W.J. & Merchant, K.A. 1990. The dangerous morality of managing earnings. Management Accounting, 72(2):22-25
Burgstahler, D., and I. Dichev. 1997. Earnings Management to Avoid Earnings Decreases and Losses. Journal of Accounting and Economics 24 (1): 99–126.
Burgstahler, D., Dichev, I., 1997. Earnings management to avoid decreases and losses. Journal of Accounting and Economics 24, 99-126.
Bushee, B., 1998. The influence of institutional investors on myopic R&D investment behavior. Accounting Review 73, 305–333.
Campelo, M., Graham, J.R. and Harvey, C.R. (2011), “The real effects of financial constraints: evidence from a financial crisis”, Journal of Financial Economics, forthcoming.
Chaney, Paul K., Debra Coleman Jeter, and Craig M. Lewis. "The use of accruals in income smoothing: a permanent earnings hypothesis." Advances in quantitative analysis of finance and accounting 6 (1998): 103-135.
39
Chaney, Paul K., Debra Coleman Jeter, and Craig M. Lewis. "The use of accruals in income smoothing: a permanent earnings hypothesis." Advances in quantitative analysis of finance and accounting 6 (1998): 103-135.
Chaney, Paul K., Mara Faccio, and David Parsley. "The quality of accounting information in politically connected firms." Journal of Accounting and Economics 51.1 (2011): 58-76.
Charitou, A., Lambertides, N. and Trigeorgis, L. (2007a), “Earnings behaviour of financially distressed firms: the role of institutional ownership”, Abacus, Vol. 43 No. 3, pp. 271-296.
Charitou, A., Lambertides, N. and Trigeorgis, L. (2007b), “Managerial discretion in distressed firms”, The British Accounting Review, Vol. 39 No. 4, pp. 323-346.
Charitou, A., Lambertides, N. and Trigeorgis, L. (2011), “Distress risk, growth, and earnings quality”, Abacus, Vol. 47 No. 2, pp. 158-181.
Cohen, Daniel A., Aiyesha Dey, and Thomas Z. Lys. "Real and accrual-based earnings management in the pre-and post-Sarbanes-Oxley periods." The Accounting Review 83.3 (2008): 757-787.
Cohen, Daniel A., and Paul Zarowin. "Accrual-based and real earnings management activities around seasoned equity offerings." Journal of Accounting and Economics 50.1 (2010): 2-19.
Daniel A. B. & R. Johnston 2009, "Accounting Discretion: Use or Abuse? An Analysis of Restructuring Charges Surrounding Regulator Action", Contemporary Accounting Research, vol. 26, no. 3, pp. 673-699.
DeAngelo, L.E. (1986) 'Accounting Numbers as Market Valuation Substitutes: A Study of Management Buyouts of Public Stockholders', The Accounting Review 61(3): 400-420.
DeAngelo, L.E. (1986) 'Accounting Numbers as Market Valuation Substitutes: A Study of Management Buyouts of Public Stockholders', The Accounting Review 61(3): 400-420.
40

Dechow, P., S. Kothari, and R. Watts. 1998. The relation between earnings and cash flows. Journal of Accounting and Economics 25 (2): 133–69.
Dechow, P.M. and R.G. Sloan (1991) 'Executive Incentives and the Horizon Problem', Journal of Accounting and Economics 14(1): 51-89.
Dechow, Patricia M., and Douglas J. Skinner. "Earnings management: Reconciling the views of accounting academics, practitioners, and regulators."Accounting Horizons 14.2 (2000): 235-250.
Dechow, Patricia M., Richard G. Sloan, and Amy P. Sweeney. "Detecting earnings management." Accounting Review (1995): 193-225.
DeFond, M. and Jiambalvo, J. (1994), “Debt covenant violation and manipulation of accruals”, Journal of Accounting and Economics, Vol. 17, pp. 145-76.
Degeorge, F., Patel, J., & Zeckhauser, R. 1999, "Earnings Management to Exceed Thresholds", Journal of Business, vol. 72, no. 1, pp. 1-33.
DuCharme, L.L., Malatesta, P.H., Sefcik, S.E., 2004. Earnings management, stock issues, and shareholder lawsuits. Journal of Financial Economics 71, 27–49.
Elliott, J. and Shaw. W. (1988), “Write-offs as accounting procedures to manage perceptions”, Journal of Accounting Research, Vol. 26 (Supplement), pp. 91-126.
Elliott, John A., and Wayne H. Shaw. "Write-offs as accounting procedures to manage perceptions." Journal of Accounting Research (1988): 91-119.
Faccio, Mara, and Rajdeep Sengupta. "Corporate response to distress: evidence from the Asian financial crisis." Federal Reserve Bank of St. Louis Working Paper Series 2006-044 (2006).
Fudenberg, Drew, and Jean Tirole. 1995. A theory of income and dividend smoothing based on incumbency rents. Journal of Political Economy 103, no. 1: 75-93.
Gilson, S. (1989), “Management turnover and financial distress”, Journal of Financial Economics, Vol. 25 No. 2, pp. 241-262.
41
Gong, Guojin, Henock Louis, and Amy X. Sun. "Earnings Management and Firm Performance Following Open‐Market Repurchases." The Journal of Finance 63.2 (2008): 947-986.
Graham, J., Harvey, R. and Rajgopal, S. (2004) The economic implications of corporate financial reporting. (working paper: Duke, NBER and University of Washington, Seattle).
Gray, R., Kouhy, R. & Lavers, S. (1995), “Corporate social and environmental reporting: a review of the literature and a longitudinal study of UK disclosure”, Accounting Auditing and Accountability Journal, Vol.8, N 2, 47-77.
Gunny, Katherine A. "The Relation Between Earnings Management Using Real Activities Manipulation and Future Performance: Evidence from Meeting Earnings Benchmarks*." Contemporary Accounting Research 27.3 (2010): 855-888.
Healy, P. M. 1985. "The effect of bonus schemes on accounting decisions." Journal of accounting and economics 7(1-3): 85-107.
Healy, Paul M., and James M. Wahlen. "A review of the earnings management literature and its implications for standard setting." Accounting horizons 13.4 (1999): 365-383.
Holthausen, R. W., D. Larker, and R. Sloan (1995), ‘Annual bonus schemes and the manipulation of earnings’, Journal of Accounting and Economics, Vol. 19, pp. 29-74.
Jiraporn, Pornsit, et al. "Is earnings management opportunistic or beneficial? An agency theory perspective." International Review of Financial Analysis 17.3 (2008): 622-634.
Jones, J. J. 1991. "Earnings management during import relief investigations." Journal of Accounting Research 29(2): 193-228.
Kahneman, D., Tversky, A., 1979. Prospect theory: An analysis of decision under risk. Econometrica 47 (March), 263–291.
Kaplan Andreas M., Haenlein Michael (2010). "Users of the world, unite! The challenges and opportunities of social media". Business Horizons 53 (1). p. 61. doi:10.1016/j.bushor.2009.09.003
Kasznik, R. and M. McNichols. 2002. Does meeting expectations matter? Evidence from analyst forecast revisions and share price. Journal of Accounting Research 40: 727-759.
42
Kothari, S. P., Natalie Mizik, and Sugata Roychowdhury. Managing for the moment: The role of real activity versus accruals earnings management in SEO valuation. Working paper, 2012.
Krull, L. 2004. Permanently reinvested foreign earnings, taxes and earnings management. The Accounting Review 79(3): 745-767.
latridis, G. & Kadorinis, G. 2009, "Earnings management and firm financial motives: A financial investigation of UK listed firms", International Review of Financial Analysis, vol. 18, no. 4, pp. 164-173.
Lee SH, DeWester D, Park SR (2008): Web2 opportunities for small businesses. Service Business, 2(4) 335-345
Leuz, C., D. Nanda and P. D. Wysocki. 2003. Earnings management and investor protection: An international comparison. Journal of Financial Economics 69: 505-527.
Li, F. 2008. Annual report readability, current earnings, and earnings persistence. Journal of Accounting and Economics 45: 221–247.
Liberty, S. and Zimmerman, J. (1986), “Labor union contract negotiations and accounting choice”, The Accounting Review, Vol. 61 No. 4, pp. 692-712.
Lilien, S., Mellman, M. and Pastena, V. (1988), “Accounting changes: successful versus unsuccessful firms”, The Accounting Review, Vol. 63, pp. 642-656.
Louis, H. 2004. "Earnings management and the market performance of acquiring firms." Journal of Financial Economics 74(1): 121-148.
Matsumoto, D. 2002. Management's incentives to avoid negative earnings surprises. The Accounting Review 77 (3): 483-514.
McGuire, J., Sundgren, A. & Schneeweiss, T. (1988), “Corporate social responsibility and firm financial performance”, Academy of Management Journal, Vol.31, pp.854-872.
McKee, T.E. 2005, Earnings Management: an executive perspective, South-Western, Division of Thomson Learning, Stamford, Connecticut, United States of America.
43
McNichols, M. F. (2002) ‘Discussion of the Quality of Accruals and Earnings: The Role of Accrual Estimation Errors’, The Accounting Review 77: 61–69.
Moehrle, S. 2002. Do firms use restructuring charge reversals to meet earnings targets? The Accounting Review 77 (2): 397-414.
Mohamed, T. O. U. K. A. B. R. I., J. I. L. A. N. I. Faouzi, and B. E. N. Olfa. "The Interaction between Environmental Accounting Practices and Earnings Management." Journal of Business Studies Quarterly 5.3 (2014).
Mollik, Abu Taher, et al. "Earnings Management during the Global Financial Crisis: Evidence from Australia."
Opler, T., & Titman, S. (1994). Financial distress and corporate performance. Journal of Finance, 49 (3), 1015-1040.
Osimo D (2008): Web 2.0 in government. EC Research Centre Scientific & Technical Reports.
Peasnell, K.V., Pope, P.F. and Young, S. (2000). ‘Accrual management to meet earnings targets: UK evidence pre- and post-Cadbury’. British Accounting Review, 32: 415–445.
Phillips, J., M. Pincus and S. Rego. 2003. Earnings management: New evidence based on deferred tax expense. The Accounting Review 78: 491-521.
Prior, D., Surroca, J. & Tribó, J. A. (2008), “Are Socially Responsible Managers Really Ethical? Exploring the Relationship between Earnings Management and Corporate Social Responsibility”, Corporate Governance: An international Review, Vol.16, N°. 3, pp.160-177.
Rahman, Md Musfiqur, Mohammad Moniruzzaman, and Md Jamil Sharif. "Techniques, Motives and Controls of Earnings Management." Journal of Advanced Social Research 3.2 (2013).
Rangan, S., 1998. Earnings management and the performance of seasoned equity offerings. Journal of Financial Economics 50, 101–122.(Crs)
44
Robb, S. 1998. The effect of analysts’ forecasts on earnings management in financial institutions. The Journal of Financial Research (21): 315-331.
Roman, L. W. 2009. Quality of Earnings and Earnings Management. Journal of AICPA.
Ronen, J. and V. Yaari (2008) ‘Earnings Management: Emerging Insights in Theory, Practice, and Research’.
Rosner, R.L. (2003) ‘Earnings manipulation in failing firms’, Contemporary Accounting Research 20: 361-408
Roychowdhury, Sugata, and Ewa Sletten. "Voluntary disclosure incentives and earnings informativeness." The Accounting Review 87.5 (2012): 1679-1708.
Salama, A. (2005), “A note on the impact of environmental performance on financial performance”, Structural Change and Economic Dynamics, Vol.16, pp.413-421
Saleh, N.M. and Ahmed, K. (2005), “Earnings management of distressed firms during debt renegotiations”, Accounting and Business Research, Vol. 35 No. 1, pp. 69-86.
Schipper, K. (1989) 'Earnings Management', Accounting Horizons 3(4): 91.
share measures by UK quoted companies’. Accounting and Business Research, 33: 295–309.
Shen, Chung-Hua, and Hsiang-Lin Chih. "Investor protection, prospect theory, and earnings management: An international comparison of the banking industry." Journal of Banking & Finance 29.10 (2005): 2675-2697.
Shivakumar, L., 2000. Do firms mislead investors by overstating earnings before seasoned equity offerings? Journal of Accounting and Economics 29, 339–371.
Shivakumar, Lakshmanan. "Do firms mislead investors by overstating earnings before seasoned equity offerings?." Journal of Accounting and Economics 29.3 (2000): 339-371.
Skinner, D., and R. Sloan. 2002. Earnings surprises, growth expectations, and stock returns or don’t let an earnings torpedo sink your portfolio. Review of Accounting Studies 7 (2–3): 289–312.
45
Somnath D., Shroff K, & H. Zhang 2009, "Quarterly Earnings Patterns and Earnings Management", Contemporary Accounting Research, vol. 26, no. 3, pp. 797-831.
Sweeney, A. (1994), “Debt-covenant violations and managers’ accounting responses”, Journal of Accounting and Economics, Vol. 17 No. 3, pp. 281-308.Swlearning.com(techniques)
Tan Li Im, Phang Wai San, Chin Kim On, Rayner Alfred, and Patricia Anthony, "Impact of Financial News Headline and Content to Market Sentiment," International Journal of Machine Learning and Computing vol.4, no. 3, pp. 237-242, 2014.
Teoh, S.H., Welch, I., Wong, T.J., 1998. Earnings management and the long-run performance of seasoned equity offerings. Journal of Financial Economics 50, 63–100.
Teoh, Siew Hong, Ivo Welch, and Tak Jun Wong. "Earnings management and the underperformance of seasoned equity offerings." Journal of Financial economics 50.1 (1998): 63-99.
Thomas Berndt a Dipl-Kfm., M.A. Christian Offenhammer, Earnings Management in the Financial Crisis 2007/2008
Thomas, J. and X. Zhang (2000) 'Identifying Unexpected Accruals: A Comparison of Current Approaches', Journal of Accounting and Public Policy 19(4): 347-376.
Thomas, J.K., Zhang, H., 2002. Inventory changes and future returns. Review of Accounting Studies 7, 163–187.
Watts, R. L. and J. L. Zimmerman 1978. "Towards a positive theory of the determination of accounting standards." Accounting review: 112-134.
Williams, A., Siegel, D.S. & Wright, P.M. (2006), “Corporate social responsibility: strategic implications. Journal of Management Studies, Vol. 43, pp.1-18.
Woody, W. 1997. "Management buyouts and earnings management."Yu, Fang Frank. "Analyst coverage and earnings management." Journal of Financial Economics 88.2 (2008): 245-271.
Zahra, S. A., Priem, R. L. & Rasheed, A. A. (2005), “The antecedents and consequences of top management fraud”, Journal of Management, Vol.31, pp.803–828.
46
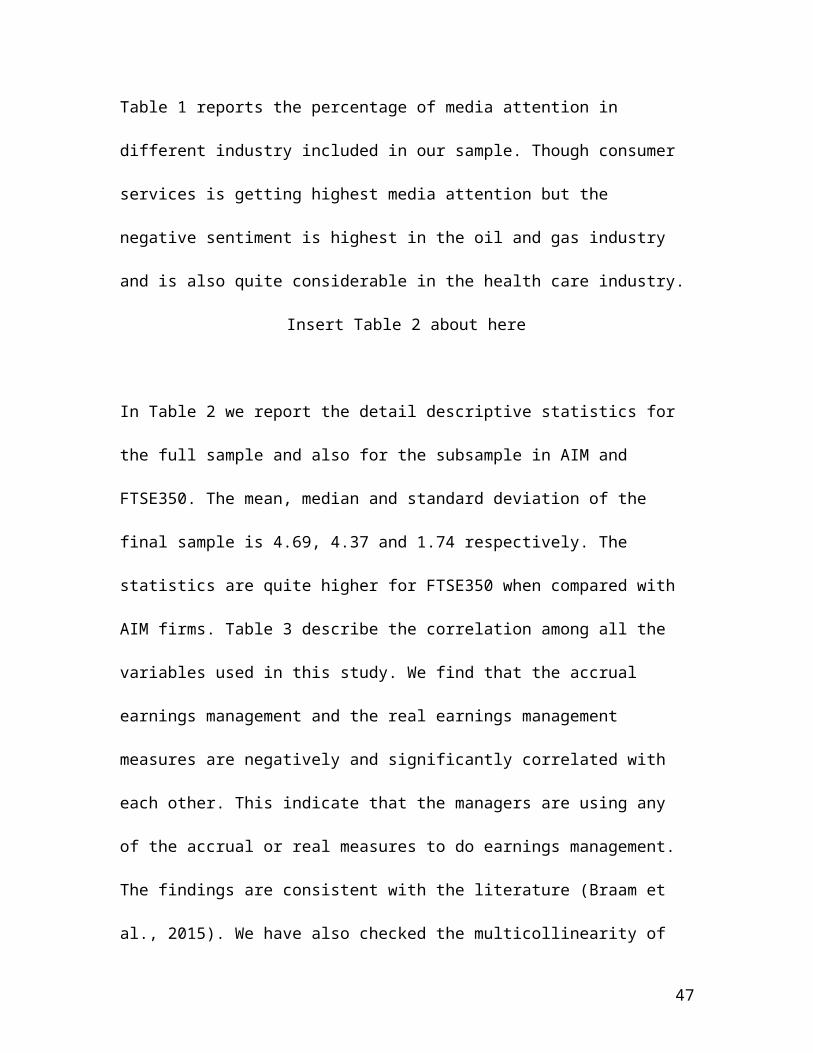
Zang, Amy Y. "Evidence on the trade-off between real activities manipulation and accrual-based earnings management." The Accounting Review 87.2 (2011): 675-703.
Pohlman, John T., and Dennis W. Leitner. "A comparison of ordinary least squares and logistic regression." (2003).
Figure 1
Notes:
Figure 2
47
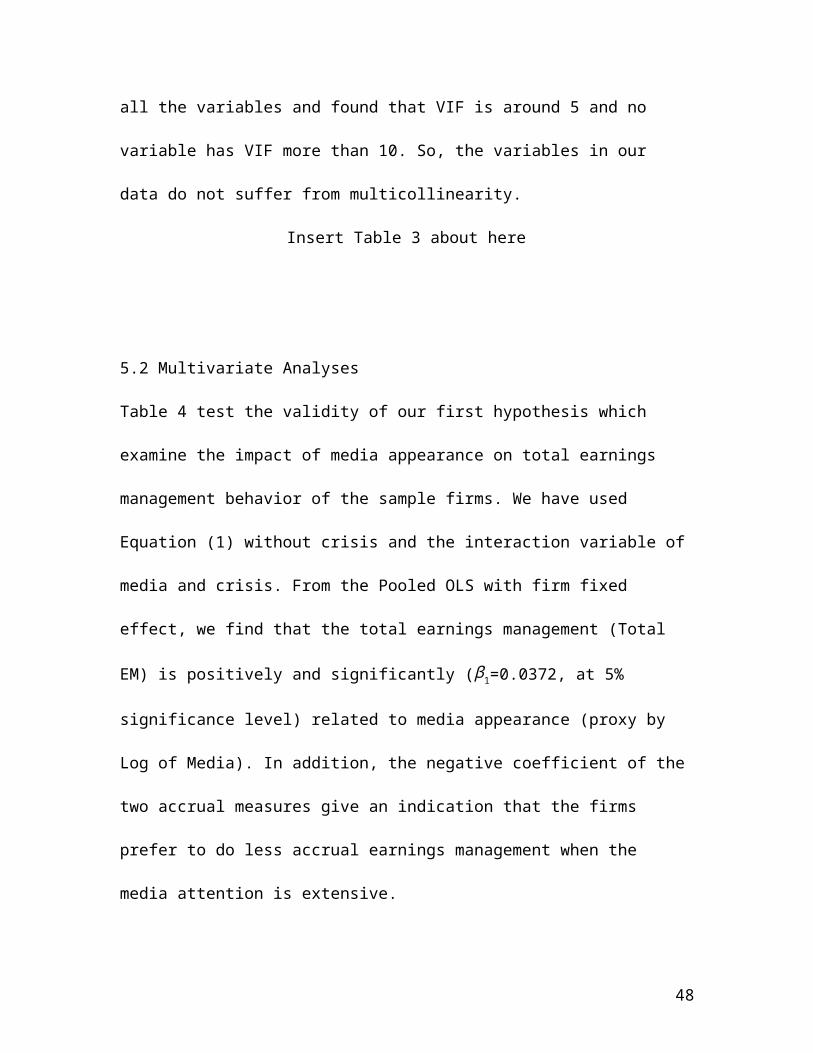
Notes:
Figure 3
48
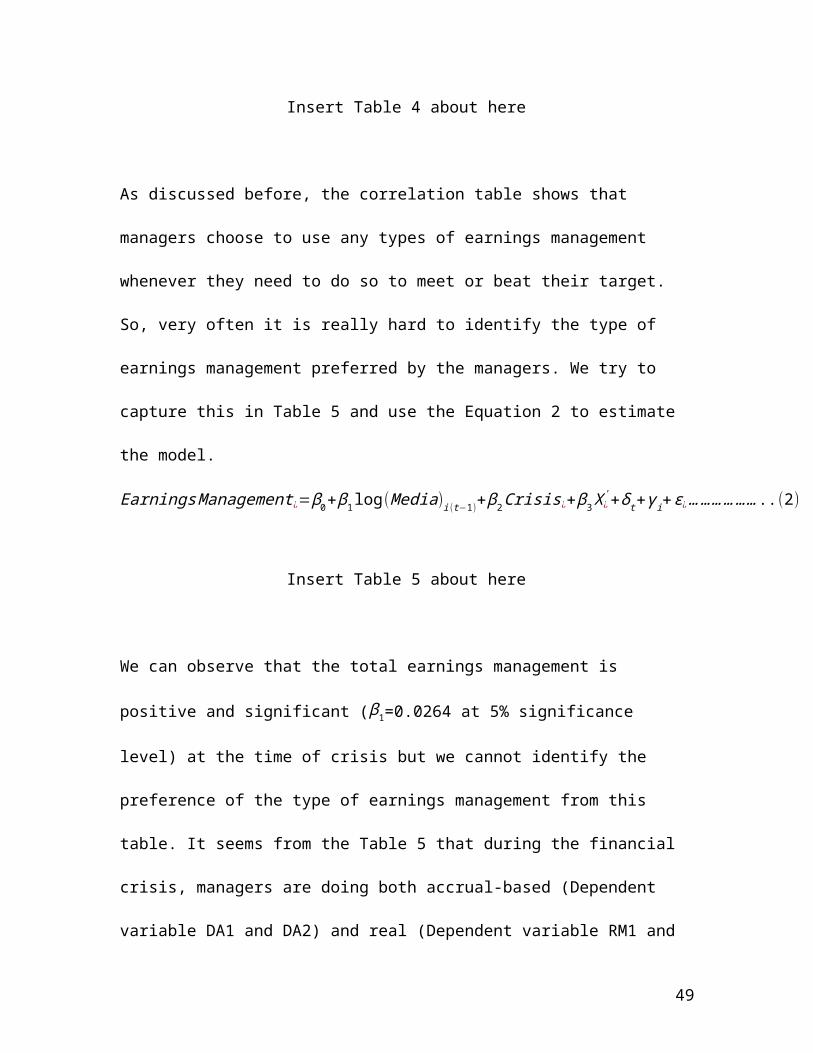
Notes: Contour plot of All media and Negative Media documents against Year in the 3rd Axis. Number of firms included is 632. In the X-axis “negative sentiment” means number of documents about the sample
firm report negative words or statements (according to Dow Jones News Analyses, Factiva). The number of all media documents for sample firms is plotted on Y-axis. To accommodate all the observation we
divided ‘All Media’ by 1000 and Negative Sentiment by 10.
Table 1
Industry All Media Percentage Negative PercentageBasic Materials 755820 14.41 1769 9.71Consumer Goods 600929 11.46 1994 10.95Consumer Services 1301398 24.81 2702 14.83Health Care 368166 7.02 2611 14.34Industrials 620860 11.84 2020 11.09Oil & Gas 890673 16.98 5448 29.91Technology 165514 3.16 61 0.33Telecommunications 379156 7.23 1383 7.59Utilities 162173 3.09 226 1.24
49
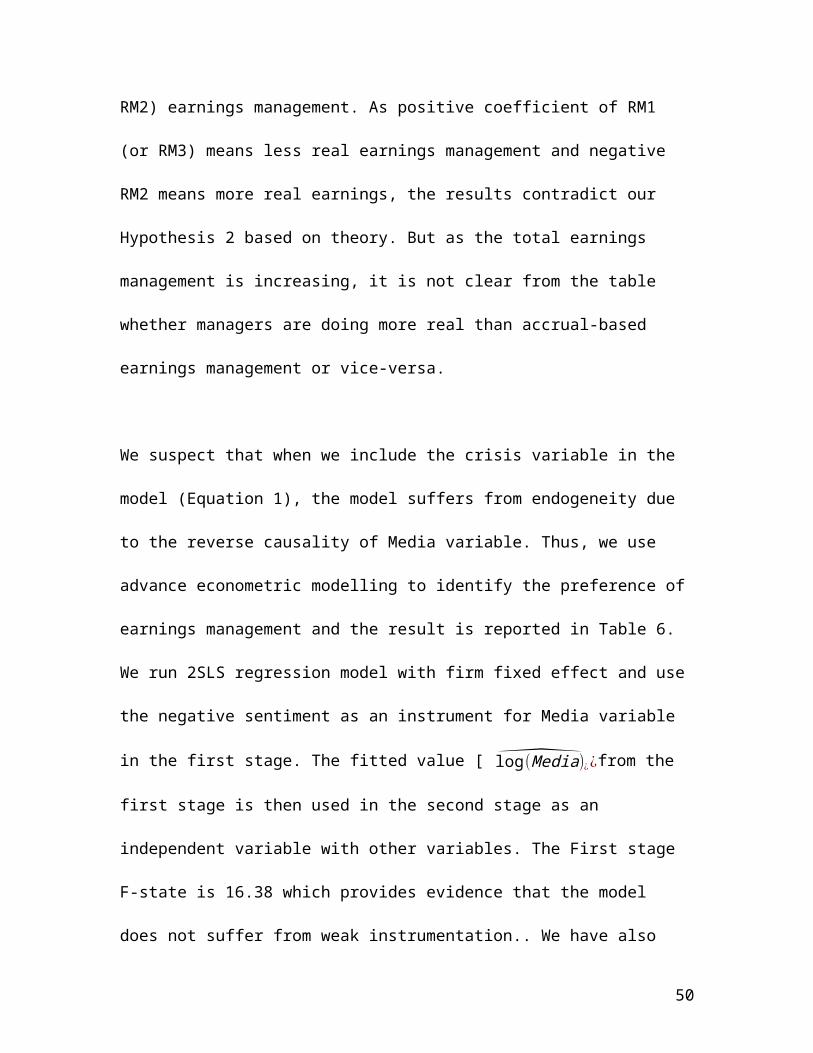
Table 2: Descriptive Statistics
Full Sample (Number of firms=632) AIM (Number of firms=299) FTSE 350 (Number of firms=160) Diff in means test
Mean p50 SD Min Max Mean p50 SD Min Max Mean p50 SD Min Max Diff t-stat
Log (Media) 4.69 4.37 1.74 0.00 11.24 3.75 3.81 1.03 0.00 7.46 6.28 6.14 1.55 0.00 11.24 -253 (-80.35)Negative 18.11 4.00 53.04 1.00 702.00 2.43 1.00 2.59 1.00 14.00 19.67 4.00 55.38 1.00 702.00 -17.24 (-2.92)DA1 -0.01 -0.02 0.39 -6.61 13.96 0.01 -0.01 0.49 -6.61 13.96 -0.03 -0.02 0.11 -1.23 0.76 0.04 (3.49)DA2 -0.01 0.00 0.32 -6.53 8.36 -0.01 0.00 0.40 -6.53 8.36 -0.01 -0.01 0.10 -1.25 0.75 0.001 (0.16)RM1 0.01 0.03 0.64 -17.65 8.33 -0.04 0.02 0.79 -17.65 8.04 0.09 0.04 0.27 -0.48 8.33 -0.13 (-7.45)RM2 -0.02 0.02 0.29 -3.56 1.77 -0.02 0.03 0.35 -3.56 1.77 -0.01 0.01 0.19 -1.11 0.68 -0.13 (-1.42)RM3 -0.01 -0.04 0.52 -3.89 6.36 0.01 -0.06 0.62 -3.89 6.36 -0.07 -0.02 0.26 -1.33 2.56 0.08 (3.31)Reputation 9.98 3.00 21.77 -40.00 111.00 9.01 3.00 17.59 -21.00 111.00 11.79 3.00 27.87 -40.00 80.00 -2.78 (-3.83)
Size 11.46 10.93 2.71 4.14 19.26 9.73 9.72 1.52 4.14 19.11 14.2814.0
3 1.65 9.76 19.26 -4.55 (-110.23)Leverage 0.39 0.07 6.58 -86.56 278.10 0.29 0.00 7.22 -86.56 278.10 0.57 0.40 5.32 -82.71 87.08 -0.29 (-1.69)
Shares 10.68 10.34 2.63 1.39 18.79 9.10 9.22 1.68 1.39 17.92 13.2613.0
6 1.71 6.74 18.79 -4.16 (-94.21)M_B 1.90 0.96 5.10 0.01 217.69 2.13 0.95 6.02 0.01 217.69 1.52 0.98 3.03 0.02 57.12 0.62 (4.64)Tangibility 0.22 0.13 0.24 0.00 2.55 0.17 0.08 0.21 0.00 2.55 0.31 0.25 0.25 0.00 0.96 -0.14 (23.10)
ROE -4.17 9.99 362.36 -11519.79 17560 -26.18 3.23 442.34 -11519.79 17560 30.1617.4
5 170.27 -395.82 7206.45 -56.35 (-5.86)
Notes:
50
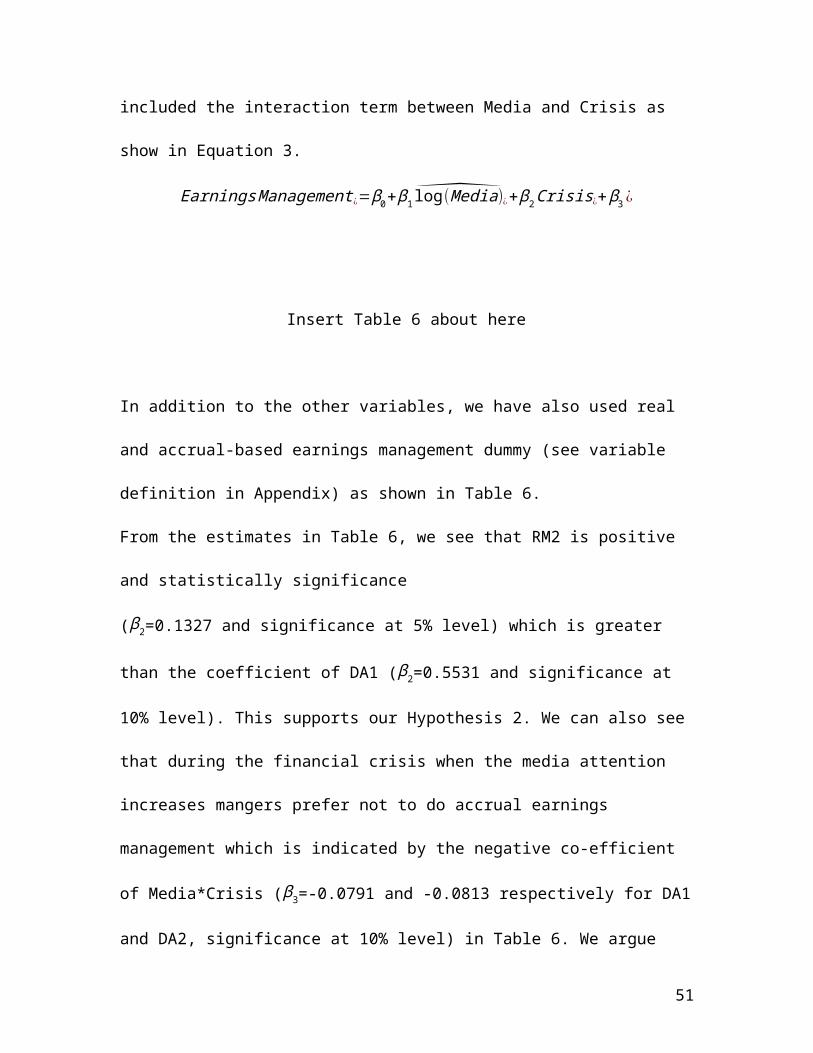
Table 3Correlation Matrix
1 2 3 4 5 6 7 8 9 10 11 12 13 14DA1 1.00DA2 0.83*** 1.00RM1 -0.09*** -0.04*** 1.00RM2 -0.06*** -0.04** -0.29*** 1.00RM3 -0.06*** -0.14*** -0.23*** -0.53*** 1.00Proxy RM -0.11*** -0.10*** -0.12*** 0.13*** 0.66*** 1.00Log (Media) -0.03** 0.01 0.06*** 0.02 -0.03 0.03 1.00Reputation -0.01 -0.00 0.01 0.06*** -0.04* 0.02 -0.06*** 1.00Size -0.04*** 0.04*** 0.17*** -0.01 -0.04 0.02 0.81*** -0.00 1.00Leverage -0.01 0.00 -0.01 0.00 -0.01 -0.01 0.03** 0.00 0.03** 1.00Shares -0.04*** 0.03** 0.06*** 0.09*** -0.10*** 0.00 0.78*** 0.05*** 0.91*** -0.04*** 1.00M_B 0.03** -0.05*** -0.04*** -0.11*** -0.00 0.16*** -0.00 -0.01 0.00 -0.00 -0.16*** 1.00Tangibility -0.10*** 0.03* -0.03* 0.04** -0.05** 0.04 0.18*** 0.10*** 0.27*** 0.04*** 0.32*** -0.01 1.00ROE 0.04** 0.05*** 0.02 -0.05*** -0.07*** -0.13*** 0.01 0.00 0.02 0.01 0.06*** 0.00 -0.00 1.00
Notes:
51
Table 4: Multivariate Regression
DA1 DA2 RM1 RM2 RM3Total EM
Accrual-based EM Real EMLog (Media) (t-1) -0.0187*** -0.0268*** -0.0197** 0.0155** 0.000 0.0372*
(-0.004) (-0.004) (-0.007) (-0.006) (-0.015) (0.014)Reputation 0.0013*** 0.0003 -0.0093*** 0.0064*** 0.0054*** -0.0031***
(0.000) (0.000) (0.000) (0.000) (-0.001) (-0.001)Size 0.011 0.0220*** 0.0431*** -0.0662*** 0.0513** 0.0415
(-0.006) (-0.006) (-0.009) (-0.008) (-0.018) (-0.028)Leverage -0.0014 -0.0004 -0.0016 0.0040* -0.0075 -0.0066
(-0.001) (-0.001) (-0.001) (-0.002) (-0.005) (-0.006)Shares 0.0072 0.0166* -0.0300* 0.0464*** -0.0548** 0.0071
(-0.008) (-0.007) (-0.013) (-0.012) (-0.017) (-0.028)M_B 0.0018 -0.0033 -0.0042 -0.0023 -0.0066 -0.0205
(-0.002) (-0.004) (-0.005) (-0.003) (-0.009) (-0.022)Tangibility -0.1516* 0.018 0.1083 -0.1467* 0.2484* 0.010
(-0.061) (-0.080) (-0.068) (-0.069) (-0.098) (-0.114)Log (ROE) 0.0288*** 0.0292*** 0.0368*** -0.0307*** -0.0005 0.0326*
(0.006) (0.006) (0.004) (0.004) (0.005) (0.013)Industry effect Yes Yes Yes Yes Yes YesYear effect Yes Yes Yes Yes Yes YesIntercept -0.2287*** -0.3594*** 0.8846*** -0.3728*** -0.2412 -0.9974***
(-0.060) (-0.068) (-0.063) (-0.094) (-0.154) (-0.209)Observations 7188 7177 7201 5586 2468 1969R-squared 0.4537 0.352 0.6285 0.6057 0.5715 0.7735
Notes: Robust Standard Errors are in parentheses. Pooled OLS with firm fixed effect. *, **, *** indicate significance at 5%, 10% and 0.1% respectively.
52
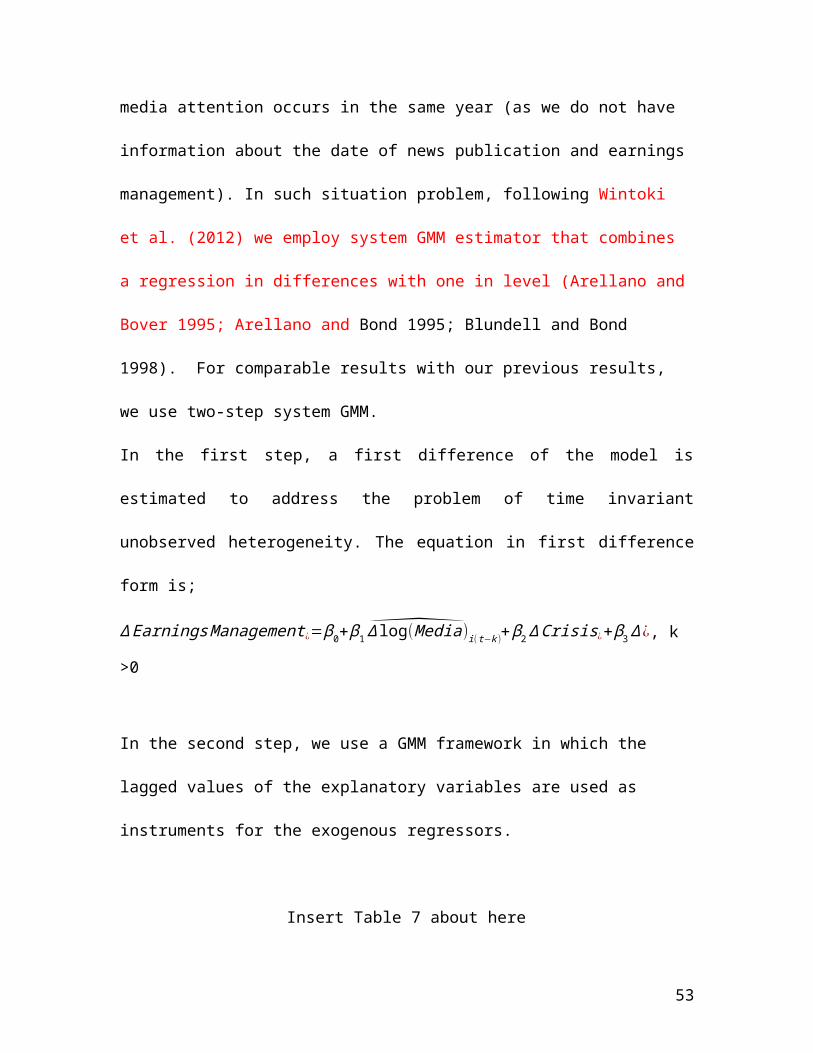
Table 5: Multivariate Regression
DA1 DA2 RM1 RM2 RM3 Total EM Accrual-based EM Real EM Log (Media)(t-1) -0.0187*** -0.0268*** -0.0197** 0.0155** -0.0000 0.0372*
(0.004) (0.004) (0.007) (0.006) (0.015) (0.014)Crisis 0.0238* 0.0196* 0.0244* -0.0306* 0.0136 0.0264*
(0.012) (0.008) (0.006) (0.015) (0.039) (0.011)Reputation 0.0013*** 0.0003 -0.0093*** 0.0064*** 0.0054*** -0.0031***
(0.000) (0.000) (0.000) (0.000) (0.001) (0.001)Size 0.0110 0.0220*** 0.0431*** -0.0662*** 0.0513** 0.0415
(0.006) (0.006) (0.009) (0.008) (0.018) (0.028)Leverage -0.0014 -0.0004 -0.0016 0.0040* -0.0075 -0.0066
(0.001) (0.001) (0.001) (0.002) (0.005) (0.006)Shares 0.0072 0.0166* -0.0300* 0.0464*** -0.0548** 0.0071
(0.008) (0.007) (0.013) (0.012) (0.017) (0.028)M_B 0.0018 -0.0033 -0.0042 -0.0023 -0.0066 -0.0205
(0.002) (0.004) (0.005) (0.003) (0.009) (0.022)Tangibility -0.1516* 0.0180 0.1083 -0.1467* 0.2484* 0.0100
(0.061) (0.080) (0.068) (0.069) (0.098) (0.114)Log (ROE) 0.0310*** 0.0308*** 0.0295*** -0.0217*** 0.0016 0.0393*
(0.006) (0.007) (0.003) (0.004) (0.006) (0.015)Industry Effect Yes Yes Yes Yes Yes YesYear Effect Yes Yes Yes Yes Yes YesIntercept -0.2287*** -0.3594*** 0.8846*** -0.3728*** -0.2412 -0.9974***
-0.06 -0.068 -0.063 -0.094 -0.154 -0.209Observations 7188 7177 7201 5586 2468 1969R-Squared 0.4537 0.3520 0.6285 0.6057 0.5715 0.7735
Notes: Robust Standard Errors are in parentheses. Pooled OLS with firm fixed effect. *, **, *** indicate significance at 5%, 10% and 0.1% respectively
53
54
Table 6: Multivariate Regression DA1 DA2 RM1 RM2 RM3
Total EM Accrual-based EM Real EMLog (Media) 0.2236* 0.2346** 0.3838* -0.0596 -0.1799 0.2252
(0.115) (0.119) (0.206) (0.124) (0.185) (0.192)Crisis 0.5531* 0.5664 0.8288 0.1327** -0.1797 0.3916
(0.282) (0.391) (0.507) (0.053) (0.302) (0.323)Media*Crisis -0.0791* -0.0813* -0.1266* 0.0014 0.0223 0.0611
(0.042) (0.044) (0.075) (0.046) (0.045) (0.048)DA_dummy -0.0654* -0.0292 0.0303 0.0025
(0.034) (0.022) (0.043) (0.043)RM_dummy -0.0012 0.0136 0.0483
(0.017) (0.017) (0.037)Reputation 0.0007 0.0008 0.0013 0.0002 0.0016*** 0.0016***
(0.001) (0.001) (0.001) (0.000) (0.000) (0.000)Size -0.0874* -0.1053** -0.1674* 0.1294** 0.1293 -0.2288
(0.050) (0.051) (0.089) (0.057) (0.148) (0.161)Leverage -0.0086** -0.0073* -0.0137** -0.0030 -0.0834* 0.0016
(0.004) (0.004) (0.007) (0.004) (0.046) (0.051)Shares -0.0264 -0.0175 -0.0374 -0.0818*** -0.0289 0.0979
(0.022) (0.023) (0.039) (0.021) (0.061) (0.072)M_B 0.0027 0.0044 0.0159*** 0.0026 0.0491 -0.0996*
(0.004) (0.004) (0.006) (0.004) (0.047) (0.052)Tangibility -0.1047*** 0.0138 -0.0307 0.0060 0.3307*** 0.0614
(0.033) (0.034) (0.064) (0.033) (0.103) (0.123)Log (ROE) 0.0034 0.0044 0.0248 -0.0503*** -0.0302* 0.0754***
(0.010) (0.011) (0.018) (0.013) (0.016) (0.019)Industry Yes Yes Yes Yes Yes YesYear Yes Yes Yes Yes Yes YesIntercept 0.1153 0.1519 0.3576 -0.3907** -0.3644 0.3909
(0.145) (0.150) (0.286) (0.198) (0.533) (0.573)Observations 801 800 801 705 273 252First stage F-Stat 16.38 16.38 16.38 16.38 16.38 16.38
Notes: 2SLS with firm fixed effect. Negative sentiment is used as an instrument for Media variable. Robust Standard Errors are in parentheses. *, **, *** indicate significance at 10%, 5% and 1% respectively.
55
Table 7: Dynamic System GMM models two step (SE corrected following Windmeijer, 2005) DA1 DA2 RM1 RM2 RM3 Total EM Accrual-based EM Real EMDA1 (t-1) 0.3391***
(0.027)DA2 (t-1) -0.1138***
(0.022)RM1 (t-1) -0.0554***
(0.015)RM2 (t-2) 0.6406***
(0.021)RM3 (t-1) 0.2860***
(0.004)TEM (t-1) 0.0434***
(0.006)Log (Media) -0.0042*** -0.0023*** 0.0093*** 0.0007 0.0079*** 0.0066***
(0.000) (0.001) (0.001) (0.000) (0.001) (0.000)Crisis -0.0325*** -0.0688*** -0.0032 0.0210** 0.0233*** -0.1204***
(0.007) (0.009) (0.008) (0.007) (0.006) (0.011)Log (Media) * Crisis 0.0068*** -0.0130*** 0.0009 -0.0022 -0.0050*** 0.0215***
(0.001) (0.002) (0.001) (0.001) (0.001) (0.002)Firm Level Control Variables Yes Yes Yes Yes Yes YesIndustry Effect Yes Yes Yes Yes Yes YesYear Effect Yes Yes Yes Yes Yes YesObservations 6805 6788 6816 5084 2213 1712Number of firms 622 622 623 532 268 227Arellano-Bond AR(1) p-value 0.000 0.000 0.000 0.038 0.000 0.000Arellano-Bond AR(2) p-value 0.221 0.169 0.621 0.212 0.709 0.648Hansen overid. (p-value) 0.409 0.804 0.199 0.087 0.359 0.107Diff- in-Hansen (p-value) 0.209 0.035 0.52 0.222 0.604 0.127
Notes: All control variables are used as before but not shown; Earnings Management variables, Media and Crisis are treated as endogenous, all other firm-level variables are treated as predetermined and treated as strictly exogenous. AR1 and AR2 are the Arellano–Bond testswith an auto-regressive model of order one
and AR2 is the Arellano–Bond test with an AR(2) error process, Hansen J is the test of over-identification and Diff-in-Hansen J is the test for the exogeneity of a subset of instruments. Two-step robust standard errors are used to compute the Student-t. *, **, *** indicate significance at 10%, 5% and 1% respectively.
56
Table 8: Robustness Checks
Industry-Year Median (Dummy) DA1 DA2 Proxy 1 Proxy 2 Proxy 1 Proxy 2
Accrual-Based EM(Absolute) Real EM Proxy Real EM1 2 3 4 5 6
RM Proxy 1 (t-1) 0.1958***(0.004)
RM Proxy 2 (t-1) 0.2188***(0.007)
DA1 Absolute-Industry median (t-1) 0.9096***(0.009)
DA2 Absolute-Industry median (t-1) 0.9161***(0.009)
RM Proxy 1-Industry median (t-1) 0.4787***(0.018)
RM Proxy 2-Industry median (t-1) 0.2002***(0.009)
Log (Media) 0.0015*** 0.0016*** 0.0054*** 0.0034*** 0.0038** -0.0007(0.000) (0.000) (0.000) (0.000) (0.001) (0.001)
Crisis 0.0098*** 0.0052** 0.0801*** 0.0579*** 0.1051*** 0.0335***(0.002) (0.002) (0.009) (0.011) (0.011) (0.009)
Log (Media)* Crisis -0.0027*** -0.0022*** 0.0124*** 0.0046* 0.0190*** 0.0059***(0.000) (0.000) (0.002) (0.002) (0.002) (0.002)
Firm Level Control Variables Yes Yes Yes Yes Yes YesIndustry Effect Yes Yes Yes Yes Yes YesYear Effect Yes Yes Yes Yes Yes YesObservations 6967 6967 5272 5801 1713 2212Number of firms 625 625 548 571 227 268Arellano-Bond AR(1) p-value 0.000 0.022Arellano-Bond AR(2) p-value 0.217 0.723Hansen overid. (p-value) 0.201 0.179Diff- in-Hansen (p-value) 0.467 0.421
Notes: Same as Table. Probit Regression for Column 1- 4. Dynamic System GMM models two-step (SE corrected following Windmeijer, 2005) for Column 5-6. All the firm level control variables are included as Table 6.
57
Table 9: Robustness Checks- Dynamic System GMM models two step (SE corrected following Windmeijer, 2005) FTSE 350 (Number of firms=160) AIM (Number of firms=299)
DA1 DA2 RM1 RM2 RM3 DA1 DA2 RM1 RM2 RM3 Accrual-based EM Real EM Accrual-based EM Real EMDA1 (t-1) 0.4476*** 0.0563***
(0.004) (0.010)DA2 (t-1) 0.2540*** -0.0617***
(0.004) (0.006)RM1 (t-1) 0.8508*** -0.0383***
(0.004) (0.008)RM2 (t-2) 0.8942*** 0.6343***
(0.004) (0.012)RM3 (t-1) 0.9490*** 0.2671***
(0.003) (0.000)Log (Media) -0.0015*** 0.0000 0.0018*** -0.0009*** 0.0004*** -0.0054*** -0.0028*** 0.0050** -0.0003 0.0023***
(0.000) (0.000) (0.000) (0.000) (0.000) (0.001) (0.001) (0.002) (0.001) (0.000)Crisis -0.0883*** -0.1141*** 0.0028 0.0079*** 0.0021 0.0148 -0.0951*** 0.1009*** 0.1221*** -0.1181***
(0.002) (0.002) (0.002) (0.002) (0.003) (0.018) (0.017) (0.021) (0.014) (0.002)Log (Media)* Crisis -0.0132*** -0.0162*** -0.0017*** 0.0005* 0.0013** -0.0033 -0.0224*** -0.0207*** 0.0271*** 0.0266***
(0.000) (0.000) (0.000) (0.000) (0.000) (0.004) (0.004) (0.005) (0.003) (0.000)Firm Level Control Variables Yes Yes Yes Yes Yes Yes Yes Yes Yes YesIndustry Effect Yes Yes Yes Yes Yes Yes Yes Yes Yes YesYear Effect Yes Yes Yes Yes Yes Yes Yes Yes Yes YesObservations 1977 1977 1977 1694 637 2869 2861 2877 1891 962Number of firms 160 160 160 151 61 291 291 292 230 137Arellano-Bond AR(1) p-value 0.000 0.000 0.000 0.000 0.004 0.000 0.000 0.000 0.000 0.008Arellano-Bond AR(2) p-value 0.651 0.416 0.921 0.611 0.201 0.184 0.764 0.38 0.397 0.885Hansen overid. (p-value) 0.352 0.388 0.307 0.339 0.698 0.037 0.071 0.140 0.182 0.565Diff- in-Hansen (p-value) 0.470 0.985 0.535 0.495 0.991 0.218 0.296 0.114 0.608 0.917
Notes: All control variables are used as before but not shown; Earnings Management variables, Media and Crisis are treated as endogenous, all other firm-level variables are treated as predetermined and treated as strictly exogenous. AR1 and AR2 are the Arellano–Bond testswith an auto-regressive model of order one
and AR2 is the Arellano–Bond test with an AR(2) error process, Hansen J is the test of over-identification and Diff-in-Hansen J is the test for the exogeneity of a subset of instruments. Two-step robust standard errors are used to compute the Student-t. *, **, *** indicate significance at 10%, 5% and 1% respectively.
58
AppendixVariable definition
59