Embed Size (px)
Citation preview
1
Lecture 1 Signals in the Time and
Frequency Domains
1. Introduction
2. Periodic Signals
3. Fourier Series Expansion of Periodic Signals
4. Spectral Representation of Periodic Signals
5. Duty Cycle of a Rectangular Wave
6. RMS Voltage and Power Spectrum of Aperiodic Signals
7. Discrete Fourier Transform (DFT)
8. Signal Strength
9. Signal Bandwidth
10. Conclusion
2
Introduction
• The tasks of communication is to encode information as a signal level, transmit this signal, then decode the signal at the receiving end.
• An analog signal varies continuously with time, and has an infinite number of possible signal levels.
• A discrete signal changes only once during a certain time interval. The signal value during this time interval is one sample, and the interval length is called the sampling period. Each sample has a infinite number of possible signal levels.
• A digital signal is discrete, but each sample has a finite number of possible signal levels. The limited number of levels means that each sample transmits a single information. It also means that each sample can be represented as digital data, a string of ones and zeroes.
• A digital signal is preferred in computer communications because computers already store and process information digitally.
3
S(t)
t
S(t)
tSampling Period
S(t)
tSampling Period
00000001001000110100010101100111100010011010101111001101
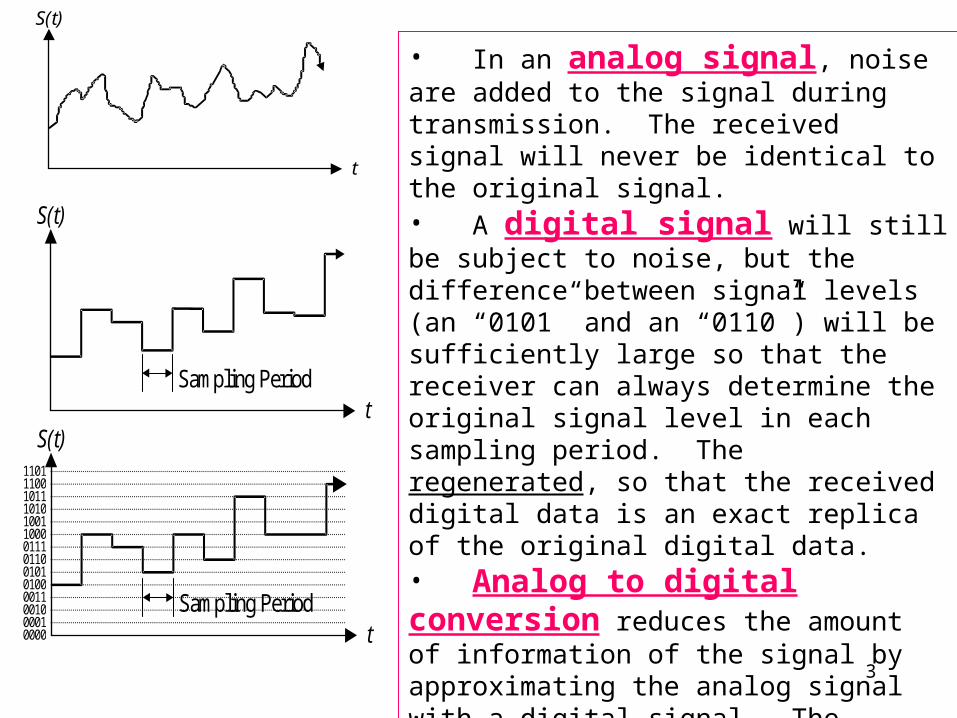
• In an analog signal, noise are added to the signal during transmission. The received signal will never be identical to the original signal. • A digital signal will still be subject to noise, but the difference between signal levels (an “0101” and an “0110”) will be sufficiently large so that the receiver can always determine the original signal level in each sampling period. The regenerated, so that the received digital data is an exact replica of the original digital data. • Analog to digital conversion reduces the amount of information of the signal by approximating the analog signal with a digital signal. The sampling period and number of levels of the digital signal should be selected in order to capture as much information of the original signal as possible
4
S(t)
A
T
t
A · cos( 2 · f · t )
A · cos( 2 · f · t - )
S(t)
A
T
t
signal with phase = 0
signal with phase =
f
A
1/T
A
f
A
1/T
Θ=0
1/T f
A
Θ
5
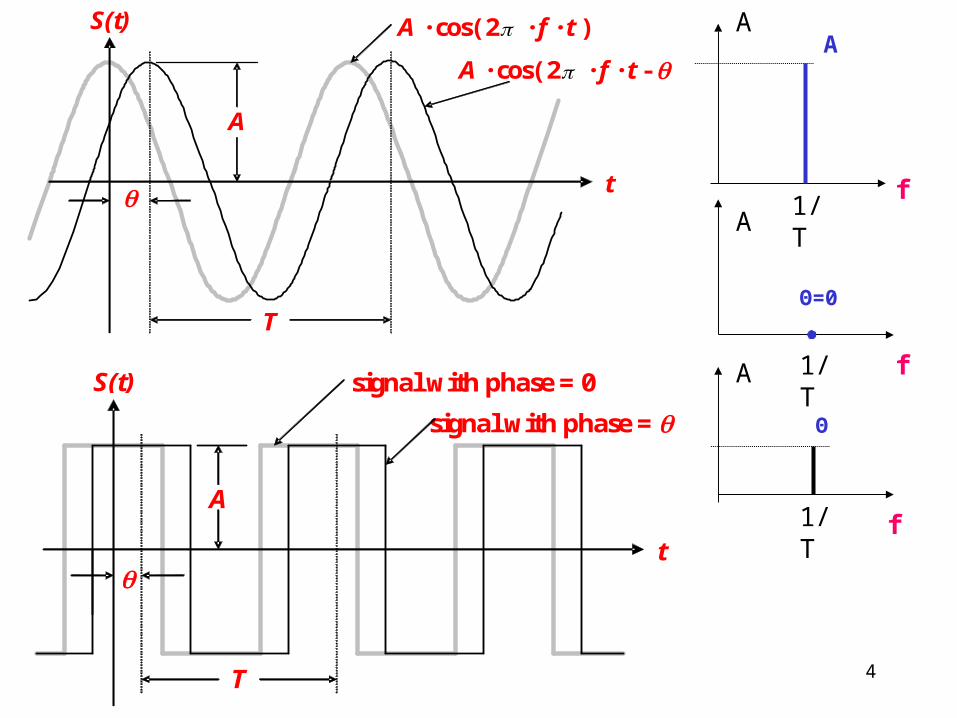
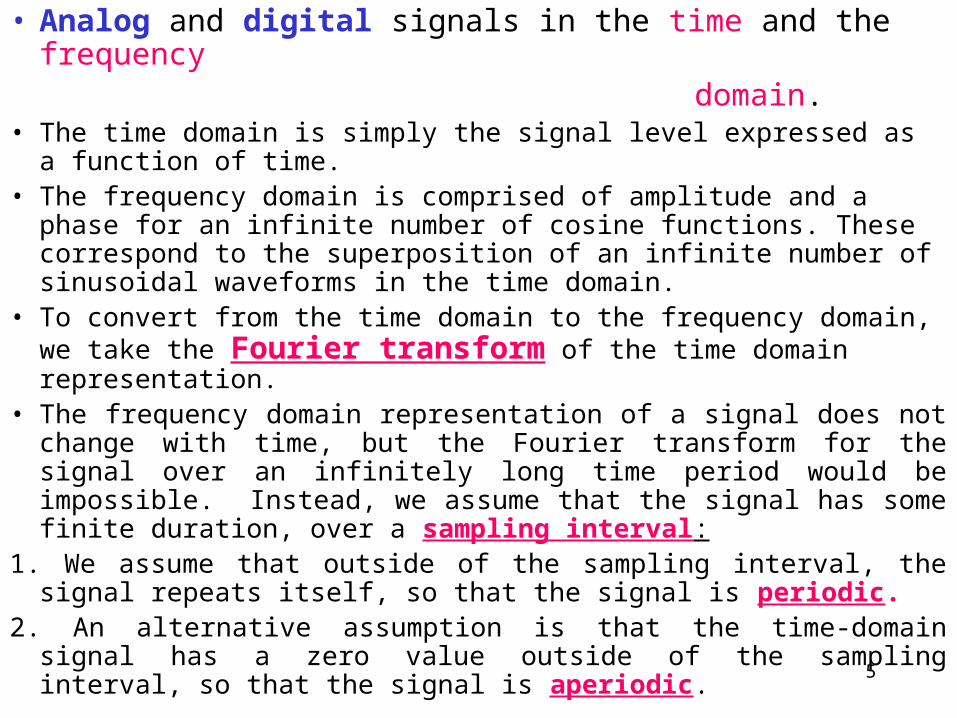
• Analog and digital signals in the time and the frequency domain.• The time domain is simply the signal level expressed as a function of
time. • The frequency domain is comprised of amplitude and a phase for an
infinite number of cosine functions. These correspond to the superposition of an infinite number of sinusoidal waveforms in the time domain.
• To convert from the time domain to the frequency domain, we take the Fourier transform of the time domain representation.
• The frequency domain representation of a signal does not change with time, but the Fourier transform for the signal over an infinitely long time period would be impossible. Instead, we assume that the signal has some finite duration, over a sampling interval:
1. We assume that outside of the sampling interval, the signal repeats itself, so that the signal is periodic.
2. An alternative assumption is that the time-domain signal has a zero value outside of the sampling interval, so that the signal is aperiodic.
6
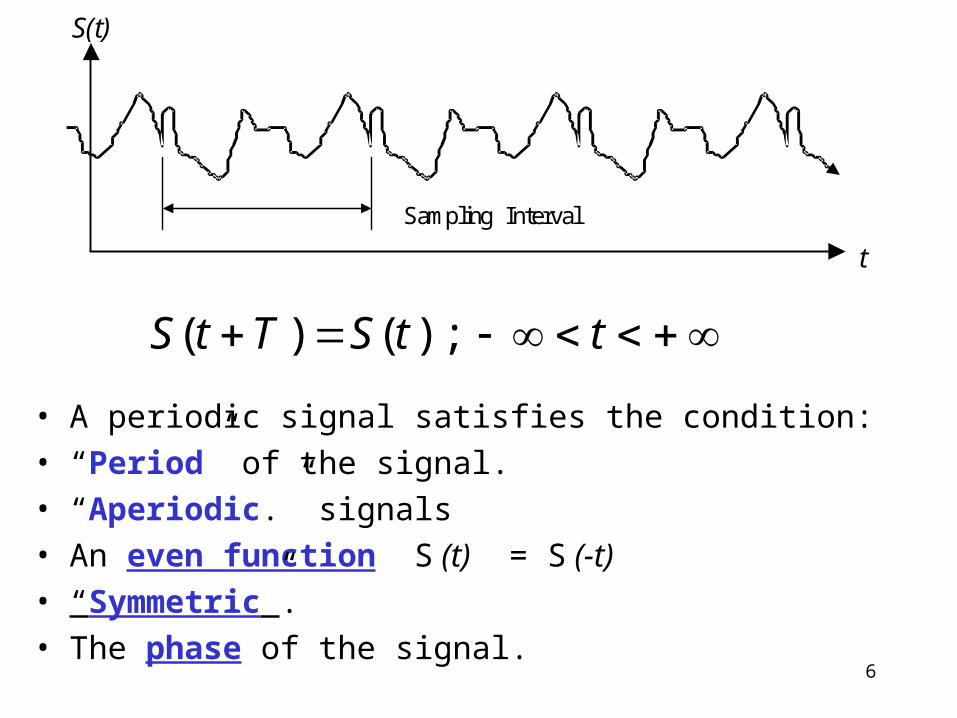
S(t)
t
Sampling Interval
• A periodic signal satisfies the condition:
• “Period” of the signal.
• “Aperiodic.” signals
• An even function S (t) = S (-t)
• “Symmetric”.
• The phase of the signal.
ttSTtS );()(
7
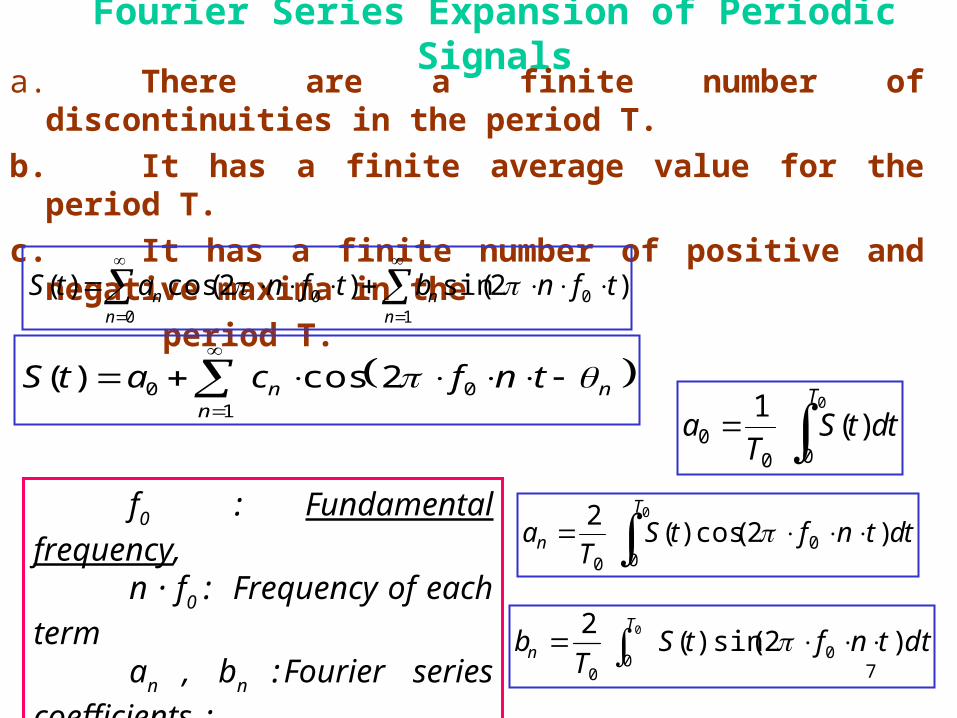
Fourier Series Expansion of Periodic Signals
a. There are a finite number of discontinuities in the period T.
b. It has a finite average value for the period T.
c. It has a finite number of positive and negative maxima in the
period T.
1
00
0 )2(sin)2(cos)(n
nn
n tfnbtfnatS
f0 : Fundamental
frequency, n · f0 : Frequency of each
terman , bn : Fourier series
coefficients :
tdtST
aT
0
000 )(
1
tdtnftST
aT
n 0
00
0
)2(cos)(2
dttnftST
bT
n 0
0 00
)2(sin)(2
1
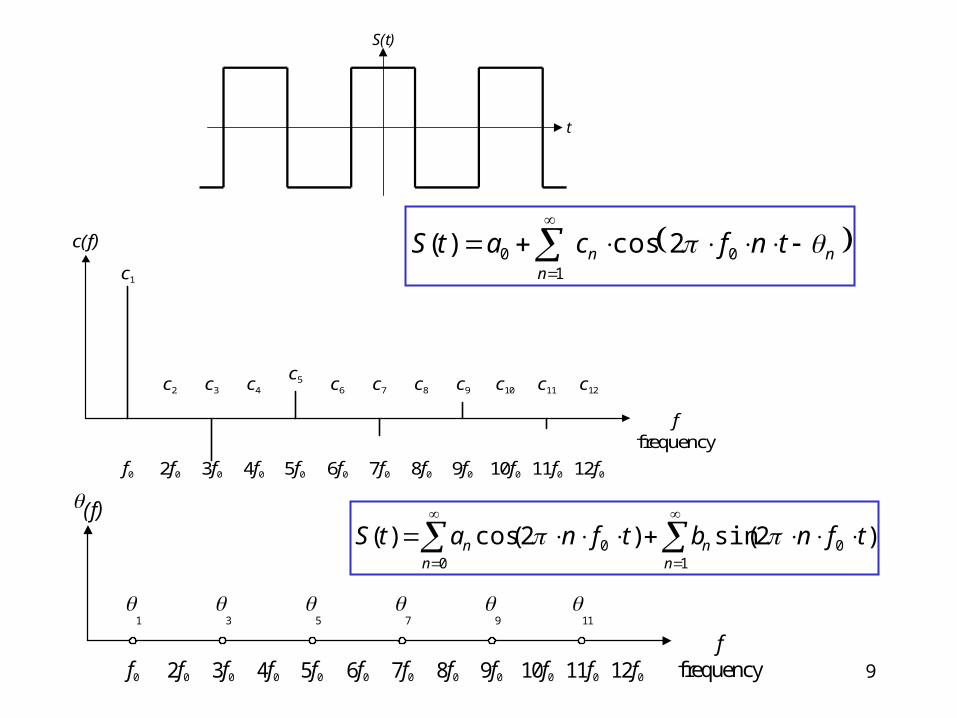
00 2cos)(n
nn tnfcatS
8
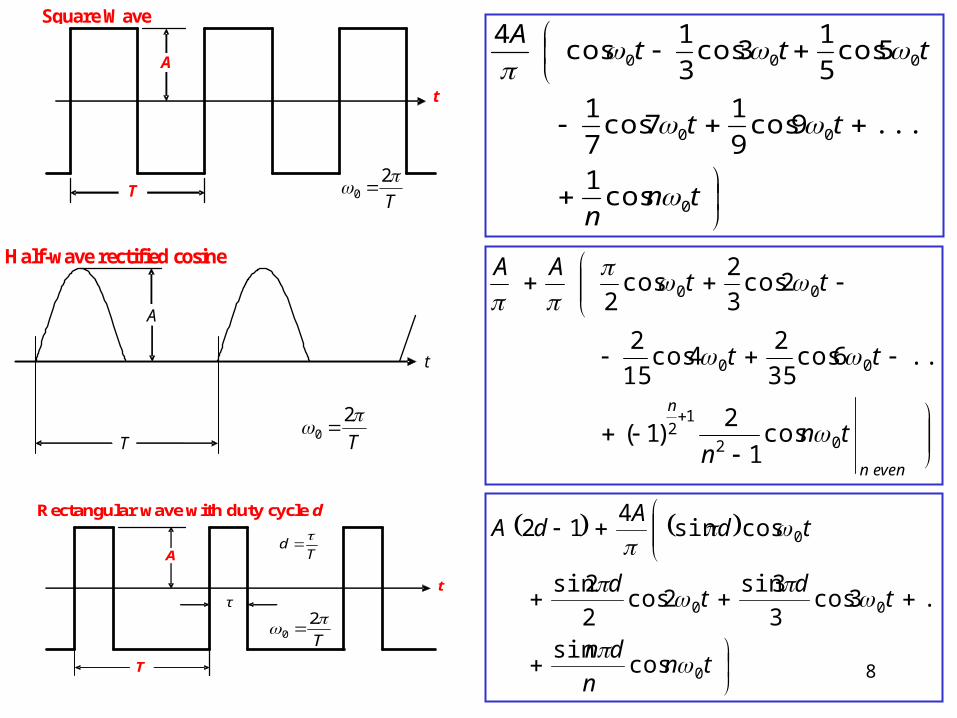
Rectangular wave with duty cycle d
A
T
t
T
20
τ
Td
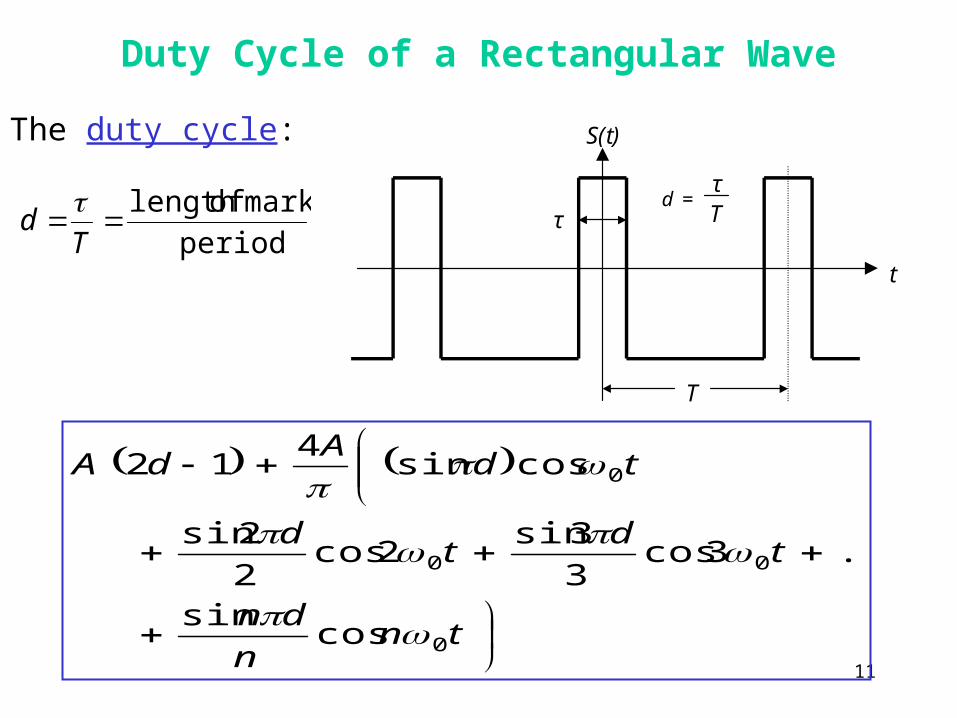
tnn
dn
td
td
tdA
dA
0
00
0
cossin
...3cos3
3sin2cos
2
2sin
cossin4
12
A
T
t
T
20
Square Wave
tnn
tt
tttA
0
00
000
cos1
...9cos9
17cos
7
1
5cos5
13cos
3
1cos
4
A
T
t
T
20
Half-wave rectified cosine
evenn
n
tnn
tt
ttAA
02
12
00
00
cos1
2)1(
...6cos35
24cos
15
2
2cos3
2cos
2
9
t
S(t)
1
00 2cos)(n
nn tnfcatS c(f)
ffrequency
c1
c2
c3
c4
c5 c
6c
7c
8c
9c
10c
11c
12
f0 2f
0 3f0 4f
0 5f0 6f
0 7f0 8f
0 9f0 10f
0 11f0 12f
0
(f)
ffrequency
1
3
5
7
9
11
f0 2f
0 3f0 4f
0 5f0 6f
0 7f0 8f
0 9f0 10f
0 11f0 12f
0
1
00
0 )2(sin)2(cos)(n
nn
n tfnbtfnatS
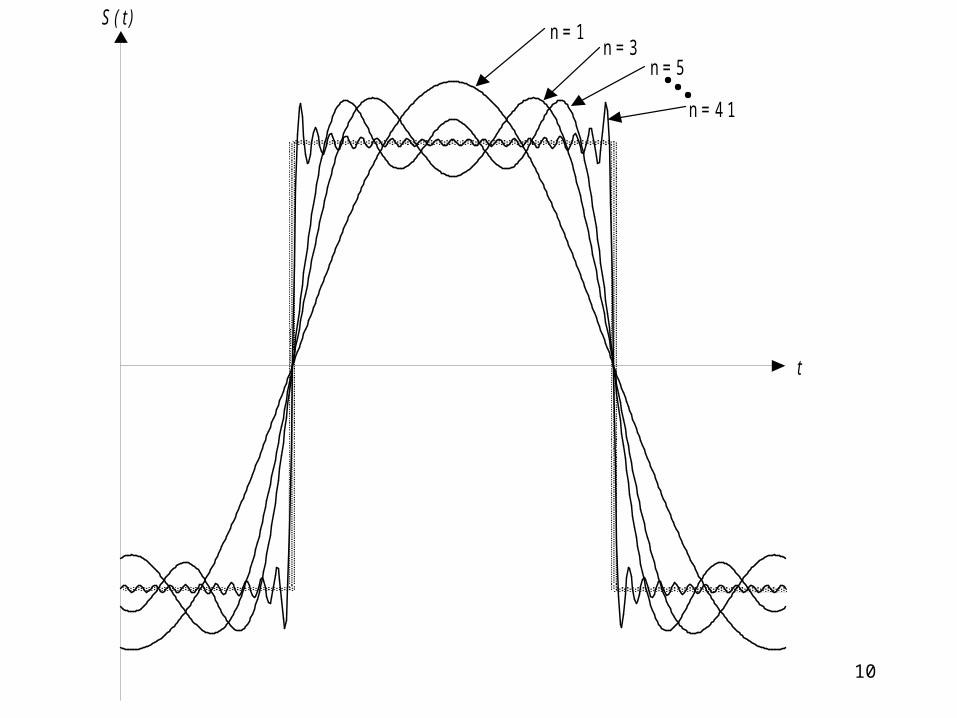
10
n = 1n = 3
n = 1 n = 5
n = 4 1
S ( t )
t
11
Duty Cycle of a Rectangular Wave
period
mark oflength T
d
The duty cycle:
t
S(t)
T
τTτ
d =
tnn
dn
td
td
tdA
dA
0
00
0
cossin
...3cos3
3sin2cos
2
2sin
cossin4
12
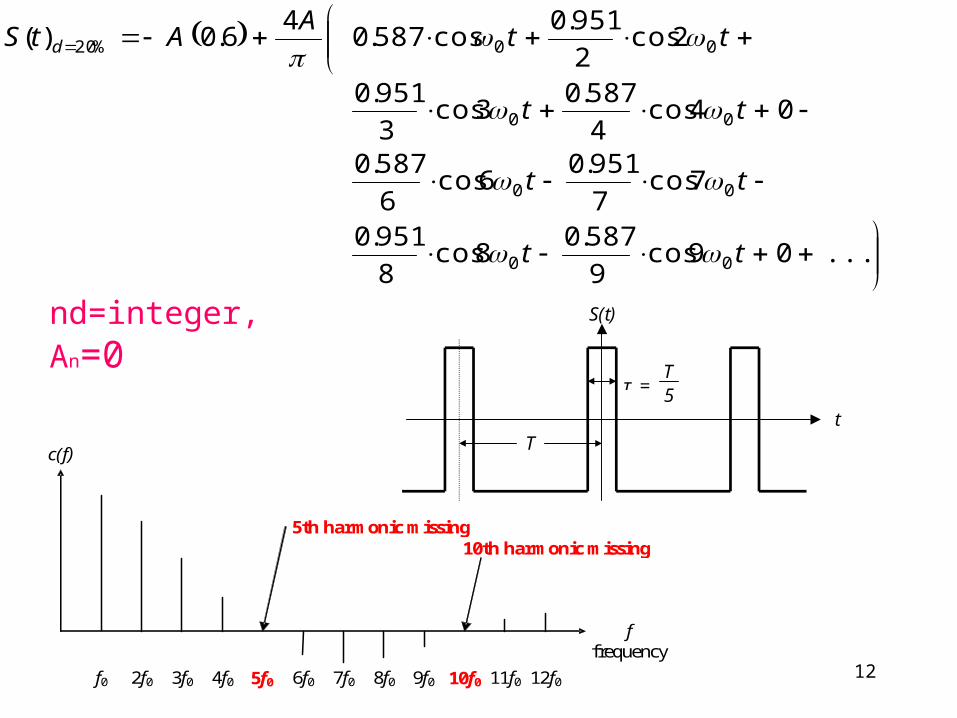
12
...09cos9
587.08cos
8
951.0
7cos7
951.06cos
6
587.0
04cos4
587.03cos
3
951.0
2cos2
951.0cos587.0
46.0)(
00
00
00
00%20
tt
tt
tt
ttA
AtS d
t
S(t)
T
T5τ =
c(f)
f frequency
5th harmonic missing 10th harmonic missing
f0 2f0 3f0 4f0 5f0 6f0 7f0 8f0 9f0 10f0 11f0 12f0
nd=integer, An=0
13
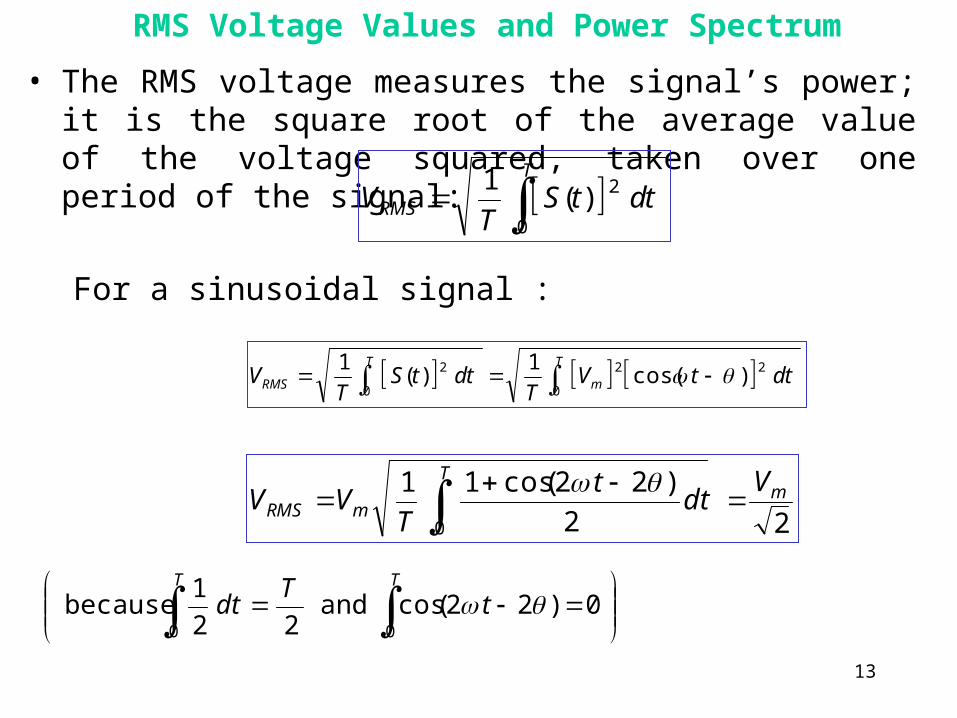
RMS Voltage Values and Power Spectrum
• The RMS voltage measures the signal’s power; it is the square root of the average value of the voltage squared, taken over one period of the signal:
tdtST
VT
RMS 0
2)(1
For a sinusoidal signal :
tdtVT
tdtST
VT
m
T
RMS 0
22
0
2 )cos(1
)(1
22
)22(cos11
0
mT
mRMS
Vdt
t
TVV
0)22(cosand
22
1 because
00
TT
tT
dt
14
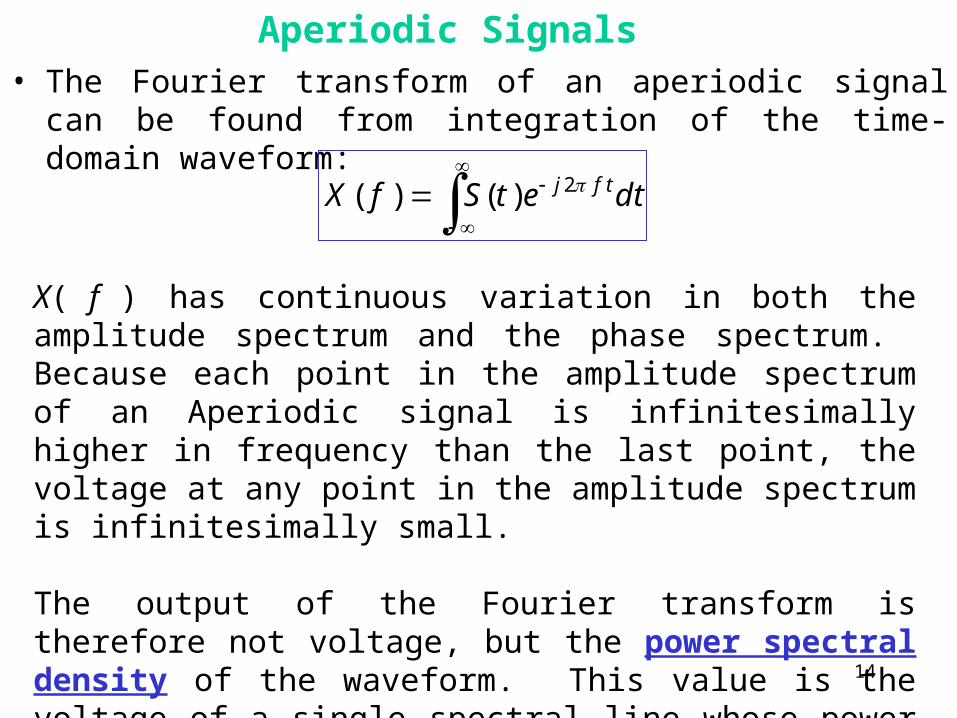
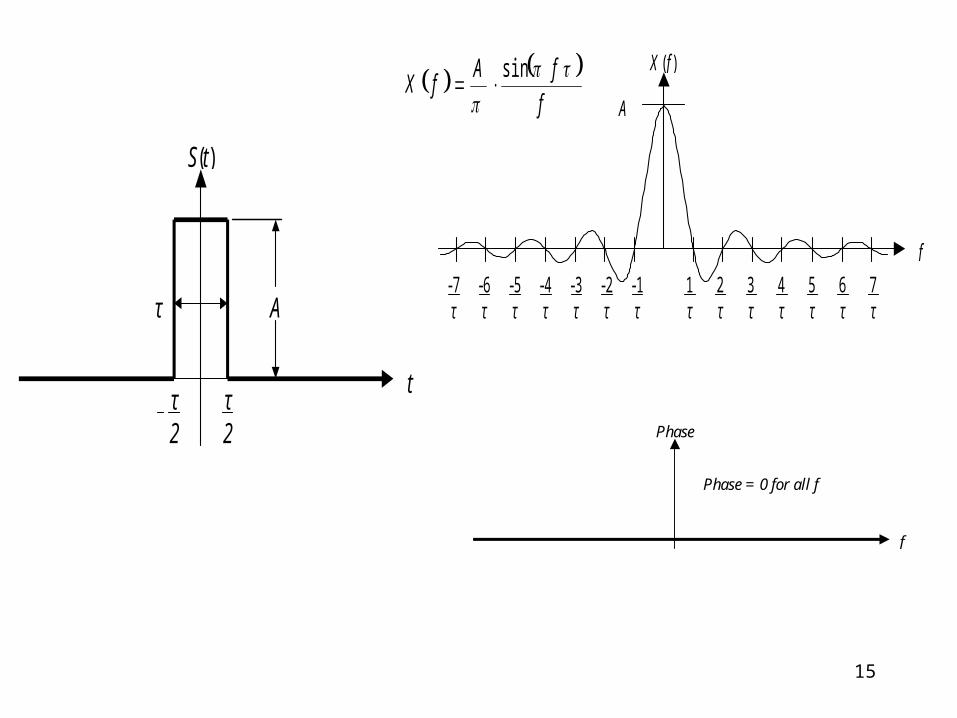
Aperiodic Signals • The Fourier transform of an aperiodic signal can be found from
integration of the time-domain waveform:
dtetSfX tfj 2)()(
X( f ) has continuous variation in both the amplitude spectrum and the phase spectrum. Because each point in the amplitude spectrum of an Aperiodic signal is infinitesimally higher in frequency than the last point, the voltage at any point in the amplitude spectrum is infinitesimally small.
The output of the Fourier transform is therefore not voltage, but the power spectral density of the waveform. This value is the voltage of a single spectral line whose power equals the amount of power contained an a 1 Hz wide frequency band with constant spectral density.
15
t
A
τ2
τ
S(t)
τ2
A
f
fAfX
sin
f
X ( f )
1τ
2τ
3τ
4τ
6τ
5τ
7τ
-1τ
-2τ
-3τ
-4τ
-6τ
-5τ
-7τ
f
Phase
Phase = 0 for all f
16
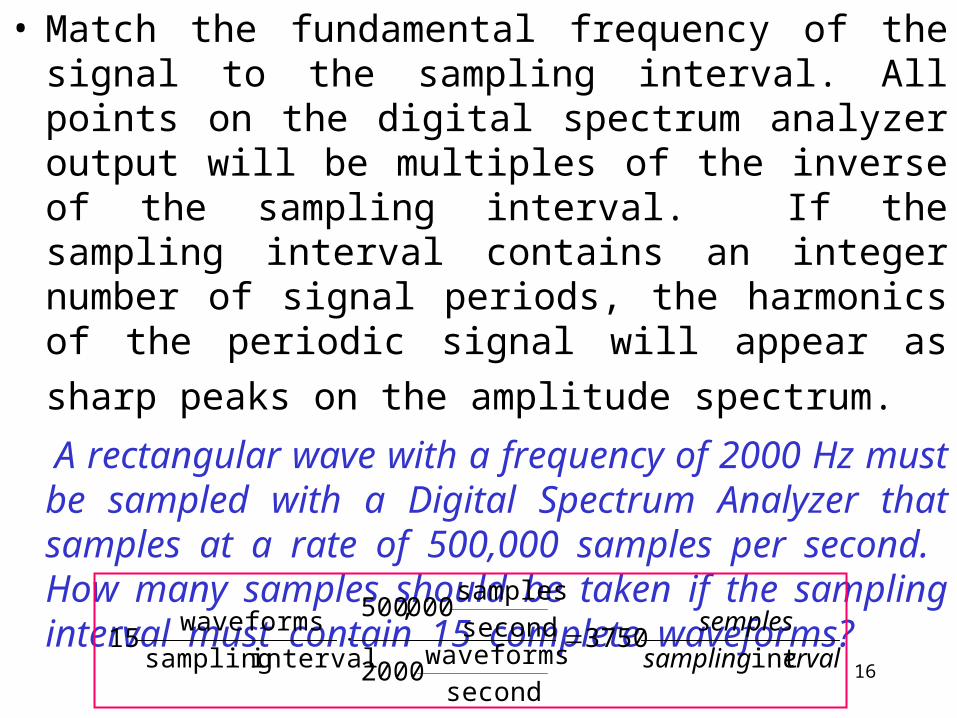
• Match the fundamental frequency of the signal to the sampling interval. All points on the digital spectrum analyzer output will be multiples of the inverse of the sampling interval. If the sampling interval contains an integer number of signal periods, the harmonics of the periodic signal will appear as sharp peaks on the amplitude
spectrum. A rectangular wave with a frequency of 2000 Hz must be
sampled with a Digital Spectrum Analyzer that samples at a rate of 500,000 samples per second. How many samples should be taken if the sampling interval must contain 15
complete waveforms?
ervalsampling
semples
int3750
second
waveforms2000
second
samples000,500
intervalsampling
waveforms15
17
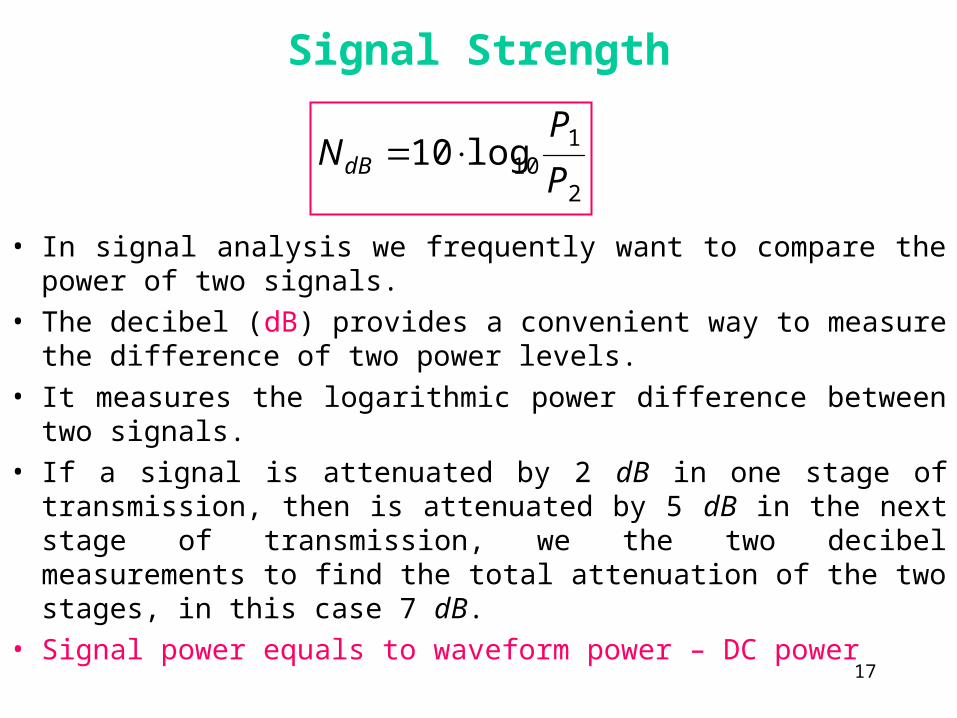
Signal Strength
• In signal analysis we frequently want to compare the power of two signals.
• The decibel (dB) provides a convenient way to measure the difference of two power levels.
• It measures the logarithmic power difference between two signals.
• If a signal is attenuated by 2 dB in one stage of transmission, then is attenuated by 5 dB in the next stage of transmission, we the two decibel measurements to find the total attenuation of the two stages, in this case 7 dB.
• Signal power equals to waveform power – DC power
2
110log10
P
PNdB
18
Signal Bandwidth
• A baseband signal is any signal which transmits data in the form of the amplitude of the signal voltage. The bandwidth of a baseband signal is measured from zero frequency upwards to fmax .
• A modulated signal transmits data by modifying the amplitude, frequency, or phase of a carrier signal. The bandwidth of a modulated signal is measured from the minimum frequency fmin (below the carrier frequency) upwards to fmax (above the carrier frequency).
• The full bandwidth of a signal is the frequency range that includes all spectrum lines of the signal.
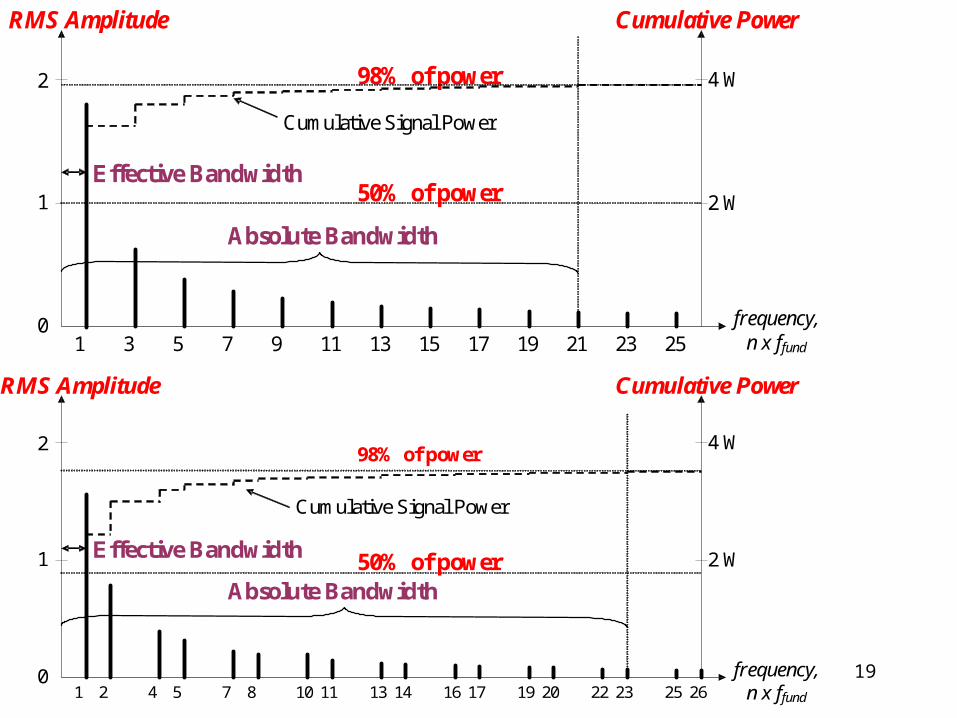
• The absolute bandwidth (ABW) of a signal is the width of the spectrum that contains 98% of the signal’s total power.
• The effective bandwidth (EBW) (bandwidth) of a signal is the width of the spectrum that contains at least 50% of the signal’s total power. This is the part of the signal whose power is within 3 dB of the complete signal.
19
0
1
1 3 5 7 9 11 13 15 17 19 21 23 25 frequency,
n x ffund
RMS Amplitude
Absolute Bandwidth
Effective Bandwidth
2 98% of power
Cumulative Signal Power
50% of power
Cumulative Power
4 W
2 W
0
1
1 2 5 7 10 11 13 16 17 19 22 23 25 frequency,
n x ffund
RMS Amplitude
Absolute Bandwidth
Effective Bandwidth
2 98% of power
Cumulative Signal Power
50% of power
Cumulative Power
4 W
2 W
4 8 14 20 26
20
Conclusion A. one-to-one correspondence exists between the representation of a given signal in
the time domain and in the frequency domain.
• B. The character of the power spectrum allows us to determine if a signal is aperiodic or periodic in the time domain. A periodic signal has a discrete frequency spectrum while an aperiodic signal has a continuous spectrum.
• C. The amplitude spectrum and phase spectrum together allow us to reconstruct the signal in the time domain. If only the amplitude spectrum or power spectrum is available, it is possible to make some conclusions about features of the signal in the time domain.
D. The presence of a DC offset means that the signal has a constant component, and the entire signal is shifted along the voltage axis in the time domain.
I. If all harmonics divisible by a number n are missing for a rectangular periodic signal, the rectangular signal in the time domain has a duty cycle d equal to 1/n .
• F. The power spectrum allows us to determine the full bandwidth and the effective bandwidth of the signal.
• G. Bandwidth refers to the range of frequencies represented in an analog signal. The bandwidth of an analog signal determines the maximum sampling rate for a digital signal that is accurately transmitted via this analog signal.
21
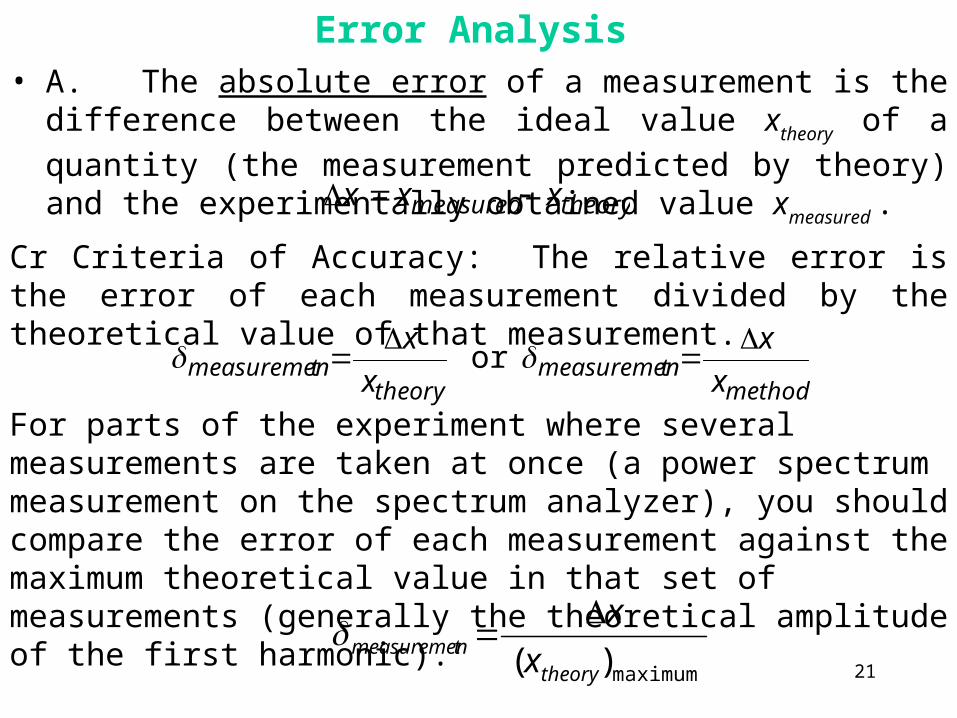
Error Analysis• A. The absolute error of a measurement is the difference between
the ideal value xtheory of a quantity (the measurement predicted by
theory) and the experimentally obtained value xmeasured .theorymeasured xxx
Cr Criteria of Accuracy: The relative error is the error of each measurement divided by the theoretical value of that measurement.
methodtmeasuremen
theorytmeasuremen x
x
x
x or
For parts of the experiment where several measurements are taken at once (a power spectrum measurement on the spectrum analyzer), you should compare the error of each measurement against the maximum theoretical value in that set of measurements (generally the theoretical amplitude of the first harmonic).
maximum)( theorytmeasuremen x
x