Embed Size (px)
Citation preview

1
Macroeconomics for small and developing countries
René A. Hernández
DDPE/ECLAC
July 2007

2
Figure 1.1 : In 1997 developing countries accounted for 32% of world output.
132 of the 183 countries are developing countries. Although most of production takes place in the industrial
countries, country-specific macroeconomic policy formulation is carried out in a developing-country context.
Developing countries behave similarly to industrial countries, but operate in a different environment.
Standard analytical tools of modern macroeconomics are relevant to developing countries.
But different models are needed to analyze. Purposes to which the models have been applied also
distinguish macroeconomics in developing countries.
Introduction

3
Industrial countries51.9%
Developing countries31.7%
Countries in transition4.8%
China11.6%
Figure 1.1Distribution of World Output, 1997
(In percent of world GDP)
Source: International Monetary Fund.Notes: GDP shares are based on the purchasing power parity (PPP) valuation of country GDPs. The category "countries in transition" includes Mongolia and countries of the former Soviet Union and central Europe.

4
Monetarism, Structuralism, Neostructuralism and Developing Nations.
Economic Structure and Macroeconomics. Some Special Topics.
Introduction

5
Monetarism, Structuralism, Neostructuralism and Developing
Nations

6
The debate Debate on relevance of industrial-country
macroeconomic analysis to developing nations.
“Monetarist” or “orthodox” versus “structuralist”.

7
Long-run growth in developing countries is hampered by dirigiste policies that distort the allocation of resources.
Prescription: giving full scope to market mechanisms via free trade and noninterventionist domestic policies.
In the short run, high inflation and balance-of-payments deficits reflect excessive money growth fueled by large fiscal deficits.
Cure: tight fiscal policy and “getting prices right”, by devaluing and raising domestic interest rates.
Policies based on the orthodox view have been promoted by international financial institutions.
Orthodox view

8
Primary-exporting countries would face deteriorating terms of trade relative to the manufactured goods-exporting industrial-nation.
Reason: Lower income elasticities of demand for raw materials than for industrial goods.
Policy intervention was required to change the structure of production in the periphery.
Industrialization should be promoted by protecting “infant industry” against competition through:
use of trade barriers and foreign exchange controls; providing special advantages to the industrial sector.
This “import substitution” strategy was adopted in the immediate postwar period.
Early Structuralist School

9
Turned their attention to short-run macroeconomic stabilization.
The analytical framework is influenced by the keynesian and postkeynesian schools and focuses on the design and implementation of strategies and economic policies.
Best-known proponent: Lance Taylor. Taylor (1990) identifies “new structuralist” view.
many agents possess significant market power; macroeconomic causality in developing countries tends to
run from “injections” to “leakages”; money is often endogenous; structure of the financial system can affect macroeconomic
outcomes; imported intermediate and capital goods, complementarity
between public and private investment are empirically important.
“New structuralist” view (NSV)

10
New structuralists question orthodox short-run prescriptions.
Source of inflation: slow relative productivity growth in agriculture; administered prices in industry, together with wage
indexation. Monetary policy is passive in the face of these inflationary
forces. Combining devaluation with tight fiscal and monetary
policies will result in stagflation in the short run. Reason: Roles of working capital and imported inputs, and
substitution possibilities are more limited than assumed.
“New structuralist” view

11
Alternative new structuralist policy prescription: greater element of gradualism; direct intervention; emphasis on the medium-term resolution of
structural problems. Macroeconomic reality in the developing world
combines features of both. ECLAC’s “productive transformation and equity” is
an expression of the NSV
“New structuralist” view

12
Economic Structure and Macroeconomics

13
Openness to Trade in Commodities and Assets. Exchange Rate Management. Domestic Financial Markets. The Government Budget. Aggregate Supply and the Labor Market. Stability of Policy Regimes. Macroeconomic Volatility.
14
Openness to Trade in Commodities and Assets

15
Developing economies tend to be more open to trade in goods and services
than are the major industrial countries
Openness: trade share (sum of the shares of exports and imports) in GDP.
First panel of Figure 1.2: developing nations tend to be more open than the major industrial countries.
Mean value of the trade share is 45%, compared with about 25% in the G-7 countries.
Openness limits at the applicability of the closed-economy textbook industrial-country model to the developing-country context.

16
Figure 1.2Trade Indicators
(In percent)
Algeria
BangladeshBarbados
Bolivia
BrazilChile
ColombiaCosta Rica
Côte d'IvoireEcuador
EgyptGabon
GhanaHaitiIndia
Indonesia
Israel
Jamaica
Kenya
KoreaMalaysia
Mauritania
MexicoMorocco
NigeriaPakistan
PhilippinesSenegal
Singapore
Sri Lanka
Syria
ThailandTunisia
Venezuela
Zaire
0 50 100 150 200
Trade (% of GDP)
1995
Algeria
BangladeshBarbados
Bolivia
BrazilChile
ColombiaCosta Rica
Côte d'IvoireEcuador
EgyptGabon
GhanaHaitiIndia
Indonesia
Israel
Jamaica
Kenya
KoreaMalaysia
Mauritania
MexicoMorocco
NigeriaPakistan
PhilippinesSenegal
Singapore
Sri Lanka
Syria
ThailandTunisia
Venezuela
Zaire
0 20 40 60 80 100
Export Share ofPrimary Commodities
(in percent), 1991
Algeria
BangladeshBarbados
Bolivia
BrazilChile
ColombiaCosta Rica
Côte d'IvoireEcuador
EgyptGabon
GhanaHaitiIndia
Indonesia
Israel
Jamaica
Kenya
KoreaMalaysia
Mauritania
MexicoMorocco
NigeriaPakistan
PhilippinesSenegal
Singapore
Sri Lanka
Syria
ThailandTunisia
Venezuela
Zaire
0 20 40 60 80 100
Share of Exports toIndustrial Countries(in percent), 1991
Source: Montiel (1993), World Bank, and International Monetary Fund.

17
Exogeneity of the terms of trade is suggested both by their small share in the world economy; by the composition of their exports.
In 1990 developing nations accounted for about one quarter of world exports and imports.
In 1991 over half of the exports of low- and middle-income countries consisted of primary commodities.
Second panel of Figure 1.2: share of primary commodities in the exports of a selected group of developing countries.
Third panel: two-thirds of the exports of the countries went to industrial countries.
Developing countries typically have little control over the prices of the goods they
export and import

18
Very few developing countries account for a significant portion of the world market.
Only sixteen developing countries account for as much as 10% of the world market.
These countries have little individual influence over the prices at which they buy and sell (Goldstein, 1986).
Exogenous terms of trade questions the usefulness of the open-economy model for developing nations.
Suitable models are Salter-Swan “dependent economy” model or three-good model consisting of exportables,
importables, and nontraded goods.

19
Such production structure permits a distinction between the exogenous terms of trade and an endogenous real exchange rate.
Importance of primary-commodity exports with exogenously determined prices: important source of macroeconomic instability.
Figure 1.3: prices of primary commodities tend to fluctuate sharply.
Top panel of Figure 1.4: several episodes of drastic changes in the terms of trade for developing countries.
Episodes are dominated by changes in oil prices. Bottom panel in Figure 1.4: nonfuel commodities have
undergone sharp fluctuations in price during the 1970s and 1980s.

20
Source: International Monetary Fund.
Figure 1.3aWorld Commodity Prices
(In U.S. cents per pound. Quotation in New York, unless otherwise indicated)
1970q1 1976q1 1982q1 1988q1 1994q10
50
100
150
200
250
300
350 Cocoa beans
1970q1 1976q1 1982q1 1988q1 1994q10
50
100
150
200
250
300
350 Coffee

21
Source: International Monetary Fund.
Figure 1.3bWorld Commodity Prices
(In U.S. cents per pound. Quotation in New York, unless otherwise indicated)
1970q1 1976q1 1982q1 1988q1 1994q130
50
70
90
110
130 Copper (London)
1970q1 1976q1 1982q1 1988q1 1994q120
40
60
80
100
120
140
160 Cotton (U.S. average price)

22
Source: International Monetary Fund.
Figure 1.3cWorld Commodity Prices
(In U.S. cents per pound. Quotation in New York, unless otherwise indicated)
1970q1 1976q1 1982q1 1988q1 1994q10
50
100
150
200 Rubber
1970q1 1976q1 1982q1 1988q1 1994q10
50
100
150
200
250 Sugar (U.S. import price)

23
Source: International Monetary Fund.
Figure 1.4aDeveloping Countries: Terms of Trade and Nonfuel Commodity Prices
(Annual change, in percent)
1971 1976 1981 1986 1991 1996
-10
0
10
20
30
40
50
0
-10
Terms of trade

24
Source: International Monetary Fund.
Figure 1.4bDeveloping Countries: Terms of Trade and Nonfuel Commodity Prices
(Annual change, in percent)
1971 1976 1981 1986 1991 1996
-20
-10
0
10
20
30
40
50
60
0
-20
Nonfuel commodity prices
25
Extent of external trade in assets has been more limited in developing countries, though this situation has recently begun to change
Developing countries have undergone an increase in their degree of integration with the world capital market.
Integration occurred in the context of immature domestic financial systems, limited policy flexibility, and fragile credibility.
This situation has caused to the capital inflow problem.

26
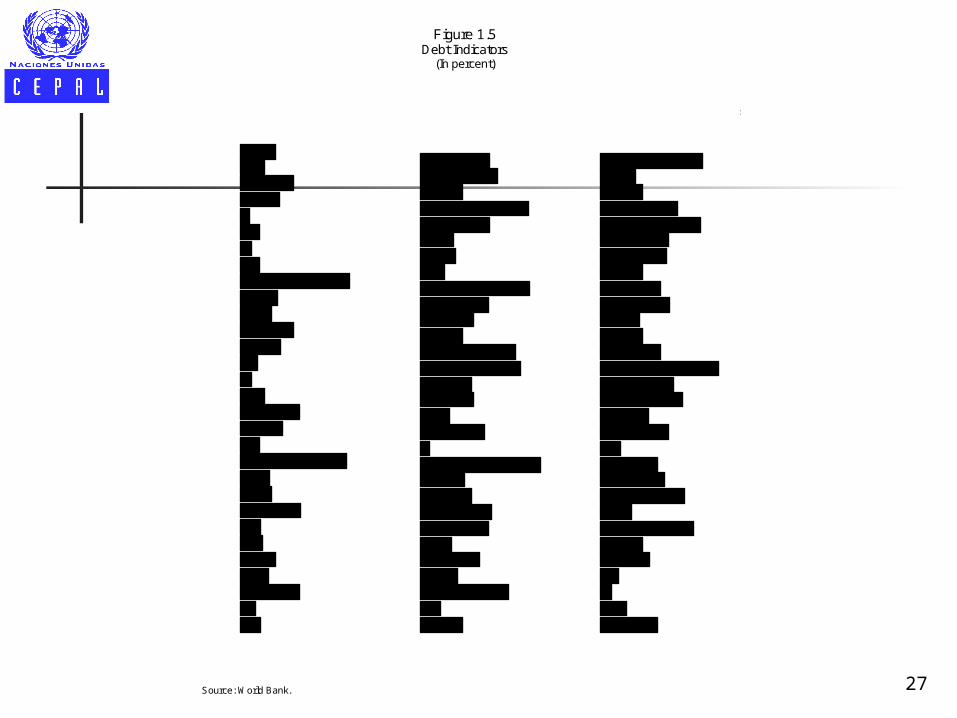
Figure 1.5: set of external-debt indicators. Debt crisis problem emerged because the domestic sector
that held the external assets was not the same as the sector that holds the external liabilities.
In countries that have recently become integrated with international capital markets, external debt has tended to be incurred by the private sector.
Policy challenges involve coping with potential macroeconomic overheating associated with the
sudden arrival of large inflows, vulnerability to macroeconomic volatility induced by
sudden capital flow reversals.
Developing countries are capital importers, and the servicing of external debt is a
central policy issue
27
Figure 1.5Debt Indicators
(In percent)
Algeria
Bangladesh
Barbados
Bolivia
Brazil
Chile
Colombia
Costa Rica
Côte d'Ivoire
Ecuador
Egypt
Gabon
Ghana
Haiti
India
Indonesia
Jamaica
Kenya
Malaysia
Mauritania
Mexico
Morocco
Nigeria
Pakistan
Philippines
Senegal
Sri Lanka
Syria
Thailand
Venezuela
0 75 150 225 300
External Debt (% of GDP) 1995
Algeria
Bangladesh
Barbados
Bolivia
Brazil
Chile
Colombia
Costa Rica
Côte d'Ivoire
Ecuador
Egypt
Gabon
Ghana
Haiti
India
Indonesia
Jamaica
Kenya
Malaysia
Mauritania
Mexico
Morocco
Nigeria
Pakistan
Philippines
Senegal
Sri Lanka
Syria
Thailand
Venezuela
0 125 250 375 500
External Debt(% exports of goods and services)
1995
Algeria
Bangladesh
Barbados
Bolivia
Brazil
Chile
Colombia
Costa Rica
Côte d'Ivoire
Ecuador
Egypt
Gabon
Ghana
Haiti
India
Indonesia
Jamaica
Kenya
Malaysia
Mauritania
Mexico
Morocco
Nigeria
Pakistan
Philippines
Senegal
Sri Lanka
Syria
Thailand
Venezuela
0 10 20 30 40 50
Debt service(% exports of goods and services)
1995
Source: World Bank.

28
Exchange Rate Management

29
Majority of developing countries have neither adopted fully flexible exchange rates
nor joined monetary unions
In developing countries officially determined rates predominate.
Exchange regimes in developing countries have evolved toward greater flexibility since the collapse of the Bretton Woods system in 1973.
This has meant that more frequent adjustments of an officially determined parity rather than the adoption of market-determined exchange rates.

30
Prevalence of official parities implies that issues relating to the macroeconomic consequences of pegging, altering the peg (devaluation), rules for moving the peg
are important in developing countries.

31
Domestic Financial Markets

32
Financial markets in developing nations have been characterized by the prevalence of rudimentary financial institutions and by
“financial repression
Only some of the developing countries have developed large equity markets.
Financial markets are dominated by commercial banks.
So assets available to private savers are limited. Equity markets tend to be dominated by a few
firms and exhibit very low turnover ratios.

33
The commercial banking sector has been heavily regulated and subjected to
high reserve and liquidity ratios; legal ceilings on interest rates; sectoral credit allocation quotas.
Thus credit rationing is legally imposed. Policies toward the financial sector is known as “financial
repression.” Restrictions cause the size of the commercial banking
system to be curtailed. Figure 1.6: monetization ratios (banking sector liabilities
over GDP) are lower in developing countries.

34
Figure 1.6aMonetization Ratios
(Money as percent of GDP, average over 1985-96)
Belgium
Canada
France
Germany
Italy
Japan
United Kingdom
United States
0 20 40 60 80 100
Industrial Countries
Burundi
Cameroon
Gabon
Kenya
Lesotho
Madagascar
Morocco
Nigeria
Tunisia
Zambia
0 20 40 60 80 100
Africa
Source: International Monetary Fund.
1/ The narrow money data are for 1985-91 period.
Narrow money Broad money
1/

35
India
Indonesia
Korea
Malaysia
Pakistan
Philippines
Singapore
Sri Lanka
Thailand
0 20 40 60 80 100
Asia
Argentina
Bolivia
Barbados
Chile
Colombia
Haiti
Jamaica
Mexico
Peru
Venezuela
0 20 40 60 80 100
Latin America and Caribbean
Figure 1.6bMonetization Ratios
(Money as percent of GDP, average over 1985-96)
Source: International Monetary Fund.
Narrow money Broad money

36
Informal financial sector has often arisen. Thus, instruments of monetary policy and monetary transmission
mechanism tend to be different. Thus, modification of standard textbook macroeconomic behavioral
relationships may be needed. Incorporate the implications of credit and foreign exchange
rationing in private decision rules by including quantity constraints in consumption and investment equations employing prices in informal credit and foreign exchange
markets. Weakness of the institutional framework in developing countries
has made both the frequency and depth of such financial crises much more extensive.

37
The Government Budget

38
The composition of the government budget differs between industrial and developing
countries
In developing nations, the pervasive role of the state in the economy is exercised through the activities of
nonfinancial public sector and financial institutions owned by the government.
Government tends to play an active role in production. Performance of public-sector enterprises is central in
determining the fiscal stance.
Figure 1.7: Central government absorbs a smaller fraction of output in
developing countries.

39
Figure 1.7aComposition of Central Government Expenditure
(Percent of total expenditure)
18.5%
8.9%
21.5%
8.3%
7.1%
35.8%
Industrial countries Africa
8.1%
7.3%
18.1%
37.7%
5.1%
23.8%
Education and health
Defense
General services
Other
Transport and communications
Social security
Defense
General services
Other
Social security
Education and health
Transport and communications
Source: Burgess and Stern (1993, p. 766).

40
Figure 1.7bComposition of Central Government Expenditure
(Percent of total expenditure)
16.3%
7.6%22.5%
19.0%
6.9%27.8%
17.9%
13.0%
19.6%
7.1%
11.2% 31.2%
Western HemisphereAsia
General services
DefenseEducation and health
Social security
Transport and communicationsOther
General services
Defense
Education and health
Social security
Transport and communicationsOther
Source: Burgess and Stern (1993, p. 766).

41
Composition of spending differs. Developing nations spend more on general public
services, defense, education, and other economic services.
Industrial nations spend more on health and social security.
Figure 1.8: Main source of central government revenue is taxation. Share of nontax revenue in total revenue is higher in
developing countries. Reason: Limited administrative capacity and political
constraints hinder collection of tax in developing countries.

42
Figure 1.8aComposition of Tax Revenue
Industrial countries Africa
35.8%
29.3%
28.4%
2.8%
3.7%
Income taxes
Taxes on goods and services
Social security
Other
Trade taxes
32.3%
25.8%
2.3%
28.4%
7.2%
4.0%
Income taxes
Taxes on goods and services
Social security
Import duties
Export duties
Other
Source: Burgess and Stern (1993, p. 766).

43
Figure 1.8bComposition of Tax Revenue
Asia Western Hemisphere
24.2%36.5%
12.0% 15.8%
5.5%
6.0%
Income taxesTaxes on goods and services
Social securityImport duties
Export duties
Other
27.4%
34.8%
0.2%
30.9%
4.1%
2.6%
Income taxes
Taxes on goods and services
Import duties
Export duties
Other
Source: Burgess and Stern (1993, p. 766).
Social security

44
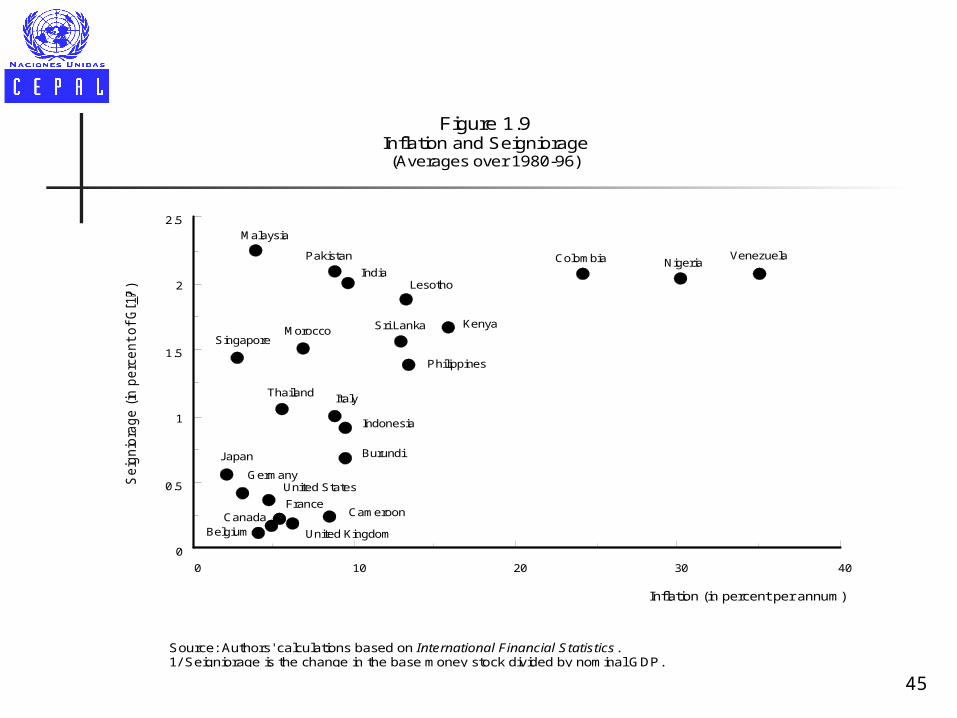
Direct taxes, taxes on domestic goods and services, and taxes on foreign trade have equal shares of total tax revenue in developing countries.
Industrial countries: income taxes have the largest share. Reliance on seigniorage, and therefore to higher levels of
inflation in developing countries due to lack of tax collection, limited issuance of domestic debt.
Figure 1.9: Industrial countries: seigniorage revenue is less than 0.8% of
GDP. Developing countries: more than 1% of GDP. Macroeconomic implications of budget institutions:
45
Figure 1.9Inflation and Seigniorage(Averages over 1980-96)
Source: Authors' calculations based on International Financial Statistics.1/ Seigniorage is the change in the base money stock divided by nominal GDP.
Inflation (in percent per annum)
Se
ign
iora
ge
(in
pe
rce
nt
of
GD
P)
1/
0 10 20 30 40
0
0.5
1
1.5
2
2.5
VenezuelaColombia Nigeria
Philippines
Lesotho
Sri Lanka Kenya
Italy
Cameroon
Indonesia
India
Pakistan
Morocco
Thailand
Singapore
United Kingdom
France
Burundi
BelgiumCanada
GermanyUnited States
Malaysia
Japan

46
Macroeconomic implications of budget institutions: nature of the constitutional rules used to impose
constraints on the size of the fiscal deficit; procedural rules that guide the elaboration of the
budget by the executive branch, its approval by the legislative branch, and its execution;
type of rules that may enhance the transparency of the budgetary process.

47
Aggregate Supply and the Labor Market

48
Due to large direct role of the state in production, size and efficiency of the public
capital stock figures prominently in the aggregate production
Figure 1.10: importance of the public sector in capital accumulation.
Glen and Sumlinski (1998): public sector accounted for 39% of total investment over 1980-1989 and 36% over 1990-1996.
In recent years, several developing countries have undertaken massive privatizations of nonfinancial public enterprises.

49
Figure 1.10 Share of Private Investment in Total Investment
(In percent)
Argentina
Bangladesh
Bolivia
Chile
Colombia
Costa Rica
Côte d'Ivoire
Ecuador
El Salvador
Ghana
Guatemala
India
Indonesia
Kenya
Korea
Malawi
0 30 60 90
Malaysia
Mauritius
Mexico
Morocco
Nepal
Nigeria
Pakistan
Paraguay
Peru
Philippines
Singapore
Sri Lanka
Thailand
Tunisia
Uruguay
Venezuela
0 30 60 90
Source: Pfeffermann and Madarassy (1993). For 1991-96 , Glen and Sumlinski (1998). 1991-96 data for the following countries are from World Bank, World Development Indicators: Ghana, Nepal, Nigeria, Singapore.
1981-85 1986-90 1991-96

50
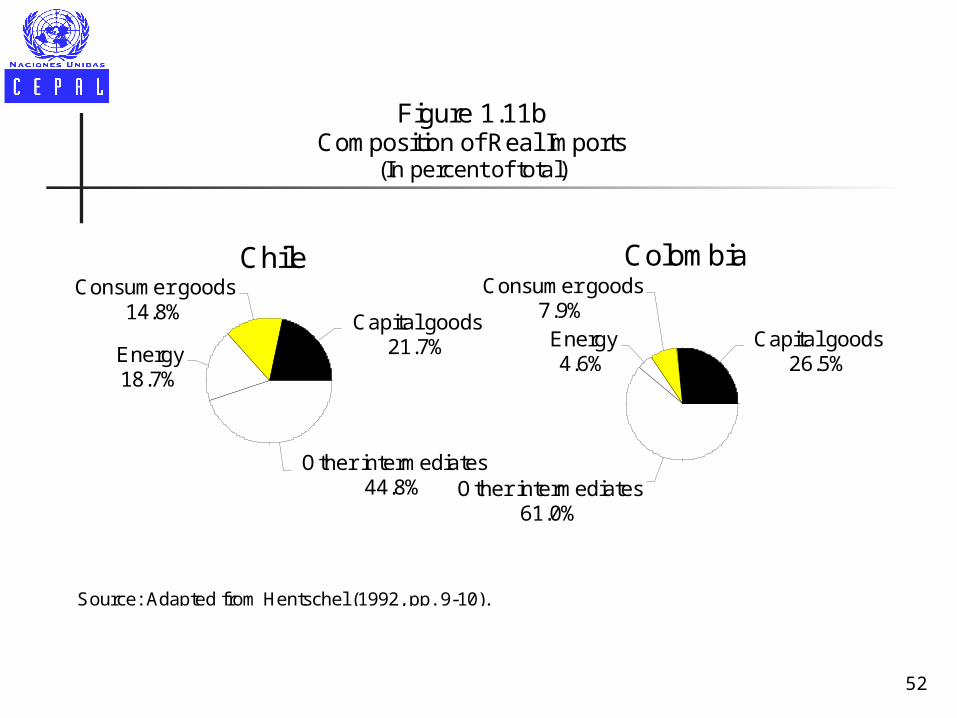
Mirakhor and Montiel (1987): Such goods account for half of all developing-country imports.
Figure 1.11: In some countries the share of energy and non-energy intermediate imports can even exceed 70%.
Results: Difference between the value of domestic production
and domestic value added is larger. Exchange rate has an important influence on the
position of the economy's short-run supply curve. Availability of foreign exchange may have a direct effect
on the position of the short-run supply curve.
Imported intermediate goods play an important role in the aggregate production
function

51
Capital goods22.2%
Consumer goods7.0%Energy
9.8%
Other intermediates61.0%
Argentina
Capital goods11.1%
Consumer goods5.9%Energy
46.6%
Other intermediates36.4%
Brazil
Figure 1.11aComposition of Real Imports
(In percent of total)
Source: Adapted from Hentschel (1992, pp. 9-10).
52
Figure 1.11bComposition of Real Imports
(In percent of total)
Capital goods21.7%
Consumer goods14.8%
Energy18.7%
Other intermediates44.8%
Chile
Capital goods26.5%
Consumer goods7.9%
Energy4.6%
Other intermediates61.0%
Colombia
Source: Adapted from Hentschel (1992, pp. 9-10).

53
Figure 1.11cComposition of Real Imports
(In percent of total)
Capital goods28.7%
Consumer goods9.4%
Energy1.1%
Other intermediates60.8%
Ecuador
Capital goods27.7%
Consumer goods5.8%Energy14.8%
Other intermediates51.7%
Indonesia
Source: Adapted from Hentschel (1992, pp. 9-10).

54
Capital Goods22.8%
Consumer Goods15.5%
Energy9.4%
Other intermediates52.3%
Malaysia
Capital goods27.7%
Consumer goods9.4%
Energy2.7%
Other intermediates60.2%
Mexico
Source: Adapted from Hentschel (1992, pp. 9-10).
Figure 1.11dComposition of Real Imports
(In percent of total)

55
Capital goods27.6%
Consumer goods16.7%
Energy2.1%
Other intermediates53.6%
Peru
Capital goods14.1%
Consumer goods6.9%Energy
28.7%
Other intermediates50.3%
Philippines
Source: Adapted from Hentschel (1992, pp. 9-10).
Figure 1.11eComposition of Real Imports
(In percent of total)

56
Capital goods15.9%
Consumer goods13.0%
Energy31.3%
Other intermediates39.8%
UruguayCapital goods
28.5%Consumer goods
18.8%Energy1.5%
Other intermediates51.2%
Venezuela
Source: Adapted from Hentschel (1992, pp. 9-10).
Figure 1.11fComposition of Real Imports
(In percent of total)

57
Costs of working capital tend to give interest rates and credit availability an important short-run supply-side role But empirical importance of this is mixed. If relevant, contractionary monetary policy may have short-run stagflationary consequences.
Informal sector plays an important role in the determination of wages and employment Informal urban sector accounts up to 60% of economic activity and total employment in developing countries. Result: segmentation of the urban labor market.
Short-run supply functions may be significantly affected by working-capital
considerations

58
Stability of Policy Regimes

59
Developing countries exhibit higher fiscal deficits, higher rates of inflation, higher average growth rates.
During 1979-88: Industrial countries: real GDP growth is 2.8% per
annum and inflation is 6.3%. Developing countries: real GDP growth is 4.3% per
annum and inflation is 31.8%.During 1989-1998: Industrial countries: real GDP growth is 2.2% per
annum and inflation is 3.1%.

60
Developing countries: real GDP growth is 5.8% per annum and inflation is 33.2%.
High inflation has been a symptom of policy instability and has been associated with policy uncertainty.
Policy uncertainty is important in: triggering currency substitution; capital flight; exchange-rate crises; collapse of private investment.
Uncertainty in policy environment must be included in developing-country macroeconomic models, design of macroeconomic reform programs.

61
Macroeconomic Volatility
62
Macroeconomic environment in developing countries is much more volatile
Roots of macroeconomic instability are both external and internal: Volatility in the terms of trade and international
financial conditions. Inflexibility of domestic macroeconomic
instruments and political instability.Figure 1.12: Latin America case. All components of the governments budget is
less stable.

63
Figure 1.12Macroeconomic Volatility
(Standard deviation of percentage change)
Source: Inter-American Development Bank, 1996 Annual Report.
Note: All data are population-weighted averages of the underlying country volatilities. Fiscal data are measured in percent of GDP.1/ All series refer to 1970-92, except for change in total surplus and change in primary surplus for which the period is 1970-94.
Industrial countries Latin America
Real GDP
Real private
consumption
Terms of trade
Real exchange rate
Change in
total surplus
Change in
primary surplus
0 5 10 15 20
1970-92 1/
Total revenue
Nontax revenue
Tax revenue
Total expenditure
Capital expenditure
Current expenditure
0 5 10 15 20 25
1970-94

64
Instability causes relative prices such as the terms of trade and real
exchange rate; unstable growth rates of real GDP and private
consumption. Gavin and Perotti (1997): volatility in some Latin American
countries have been compounded by a procyclical fiscal policy response:
increase in government expenditure and fiscal deficits during periods of expansion;
fall during recessions. Overall, boom and bust phenomena tend to be much more
common and more costly in developing countries.

65
Some Special Topics

66
Long-standing issues: desirability of alternative exchange-rate regimes; “new structuralist” critique of the role of the
exchange rate in orthodox stabilization. Recent issues:
macroeconomic consequences of alternative nominal exchange-rate rules;
role of the exchange rate as a nominal anchor in an open economy.
Exchange-Rate Management

67
Alternative approaches to price-level stabilization ranging from “orthodox” money-based programs relying
on tight fiscal and monetary policies and exchange-rate policy,
to “heterodox” programs based on tight aggregate demand policies, an exchange-rate freeze, and wage and price controls.
The evaluation of this experience and its lessons for future stabilization efforts have been important.
Stabilization of High Inflation

68
Since the early 1990s many Asian and Latin American countries have faced a surge in capital inflows.
The causes of such inflows, their welfare implications, and appropriate policy responses have been the subject of much recent attention.
Managing Capital Flows

69
Currency Crises
In recent years research have focused on roles of self-fulfilling expectations and
policymakers' preferences, links between banking and currency crises
and predictive content of various economic indicators.

70
Reforms are designed to enhance role of financial intermediaries in
channeling domestic saving give the real economy a more outward
orientation. But these reforms have been controversial. Their relationship with macroeconomic stabilization
has been a focus of attention.
Trade and Financial Reform

71
Political Aspects of the Macroeconomy
Political factors are important to understand many macroeconomic phenomena, such as inflation inertia, setting of policy instruments, sustainability of reform programs.

72
Important issues: incidence of labor market segmentation, role of government regulations, low degree of labor mobility across sectors in
the short run.
The Functioning of Labor Markets