Embed Size (px)
Citation preview
1
Mean Monthly and Low Flow Estimates in NHDPlus Version 2
Tim Bondelid- NHDPlus TeamConsulting Engineer
2014 AWRA Spring Conference on GIS and Water Resources VIII
May 12 to May 14, 2014Snowbird, Utah
This Presentation NHDPlus V1 and NHDPlus V2 include
mean annual (MA) flow and velocity estimates• All 2.7 M networked stream segments
We have now released mean monthly (MM) flow and velocity estimates
We have a first-round test of 7Q10 flows I will talk about how we did these
MM and 7Q10 flow estimates
2
3
NHDPlus V02 Enhanced Runoff Method (EROM)
Contributors:
• The NHDPlus Team
• EROM: Dave Wolock, USGS Kernell Ries, USGS Greg Schwarz, USGS
4
Importance of Stream Flow Estimates
Support the water element goals expressed in the EPA Strategic Plan
Support the water mission of the USGS• Water-quality modeling (SPARROW)• Regional and national stream flow assessments
goal of National Stream Flow Information Program• National Water Census
Watershed planning and management Response to emergencies (ICWATER)
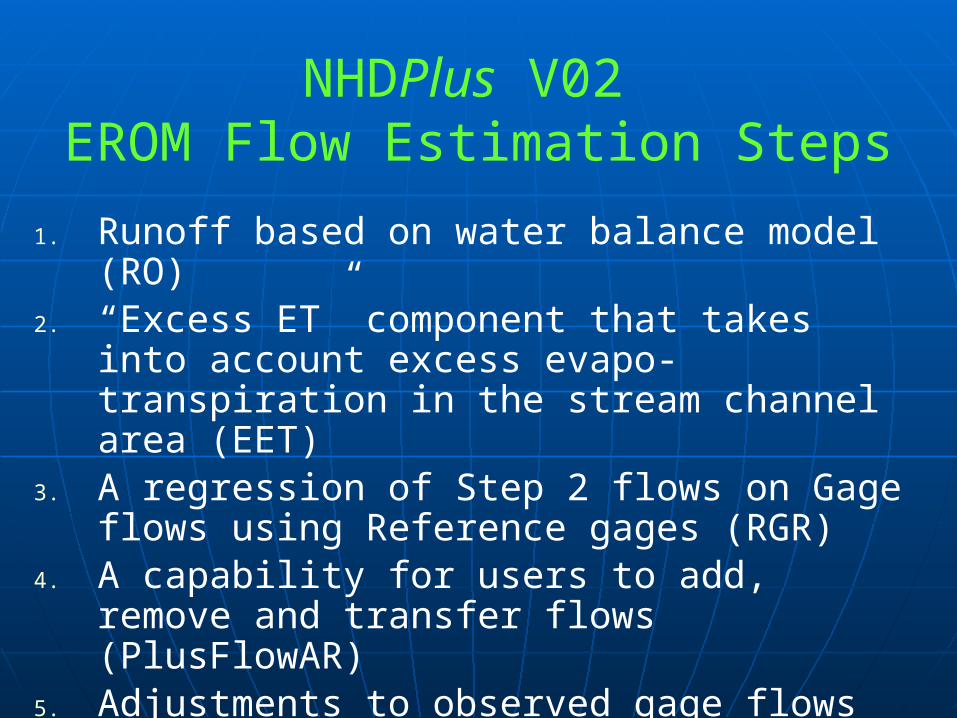
NHDPlus V02 EROM Flow Estimation Steps
1. Runoff based on water balance model (RO) 2. “Excess ET” component that takes into
account excess evapo-transpiration in the stream channel area (EET)
3. A regression of Step 2 flows on Gage flows using Reference gages (RGR)
4. A capability for users to add, remove and transfer flows (PlusFlowAR)
5. Adjustments to observed gage flows6. A flow QA module to evaluate accuracy of
the flow estimates
6
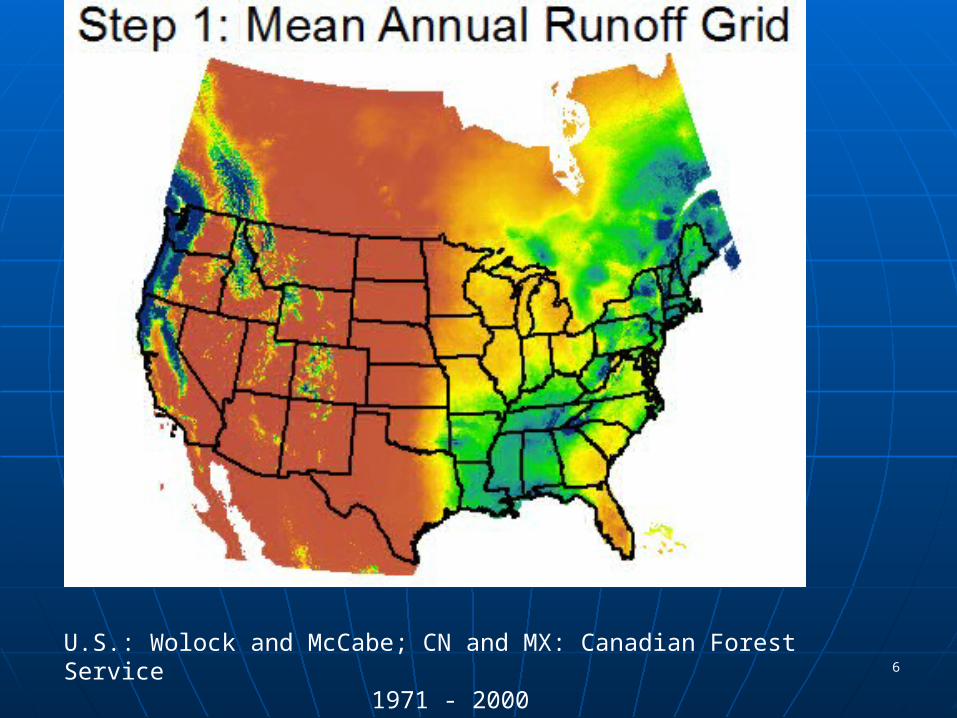
U.S.: Wolock and McCabe; CN and MX: Canadian Forest Service1971 - 2000
7
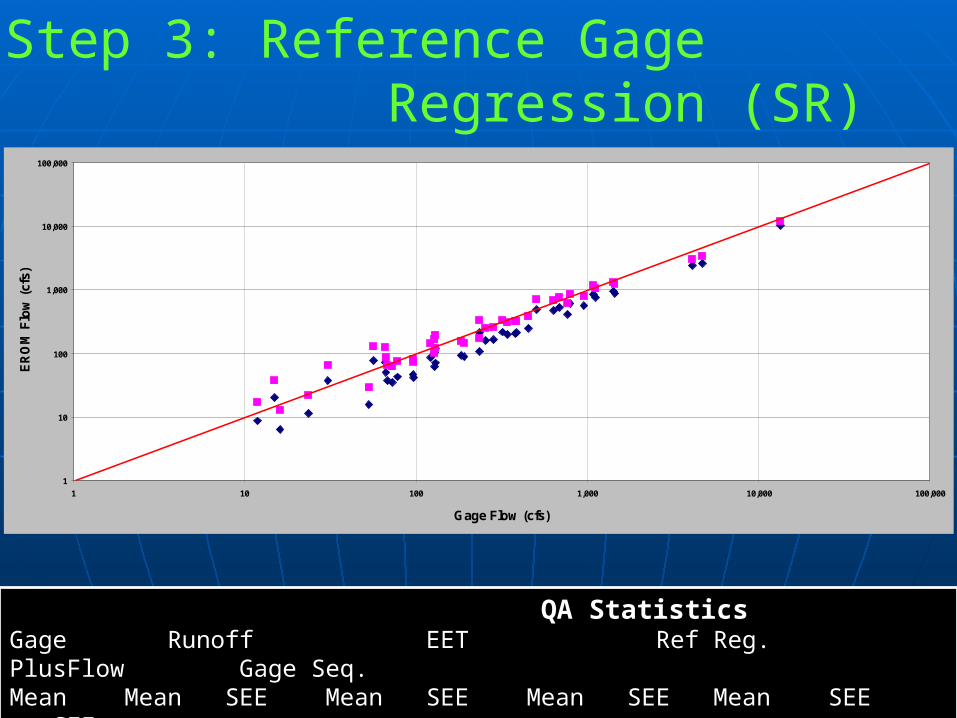
QA StatisticsGage Runoff EET Ref Reg. PlusFlow Gage Seq.Mean Mean SEE Mean SEE Mean SEE Mean SEE SEE2.36 2.17 58.8 2.17 58.8 2.37 32.6 2.37 32.6 23.0
1
10
100
1,000
10,000
100,000
1 10 100 1,000 10,000 100,000
Gage Flow (cfs)
ER
OM
Flo
w (
cfs)
Step 3: Reference Gage Regression (SR)
EROM MM Flows
EROM built for MA and MM flows QA issues with MM flows:
• RO results in winter months in some areas produced very poor results
• Sometimes EET helped, sometimes it hurt
• RGR helped most of the time, but sometimes made the QA worse
These QA issues led to the decision to not release MM flows 8
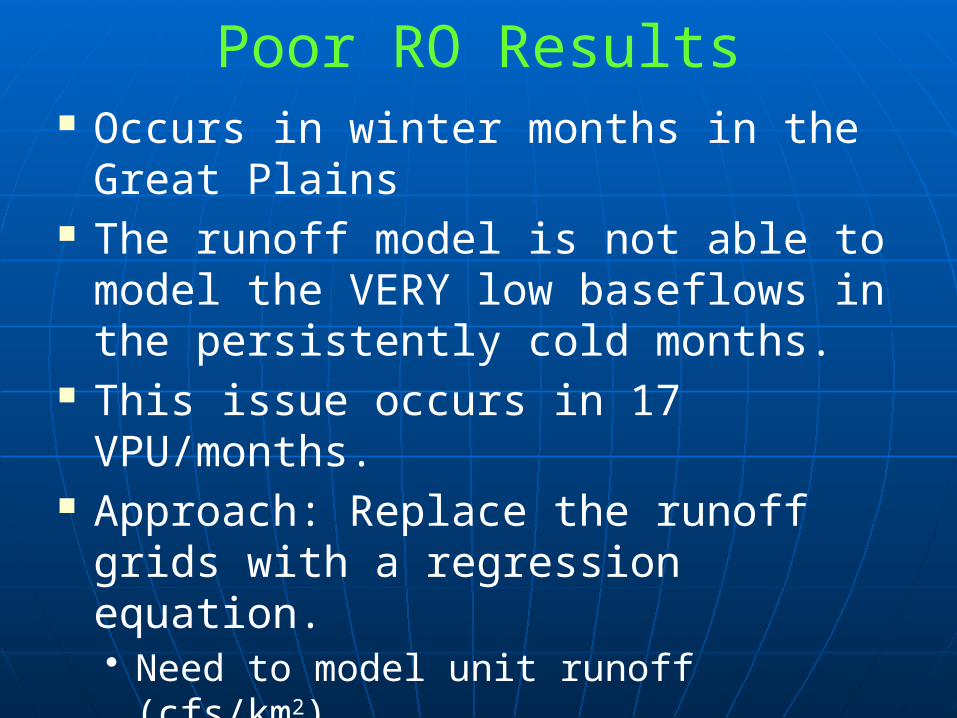
Poor RO Results Occurs in winter months in the Great
Plains The runoff model is not able to model
the VERY low baseflows in the persistently cold months.
This issue occurs in 17 VPU/months. Approach: Replace the runoff grids
with a regression equation.• Need to model unit runoff (cfs/km2)• EROM uses a flow accumulation
approach
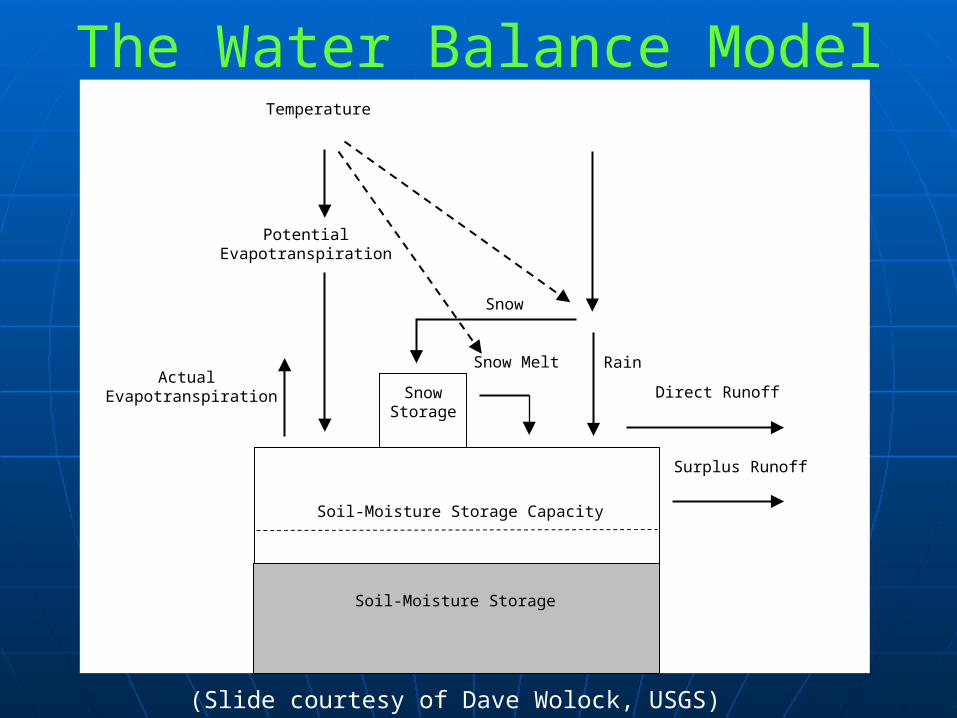
The Water Balance Model
Actual Evapotranspiration
Potential Evapotranspiration
Temperature
Soil-Moisture Storage
Soil-Moisture Storage Capacity
SnowStorage
Snow
Snow Melt Rain
Direct Runoff
Surplus Runoff
(Slide courtesy of Dave Wolock, USGS)
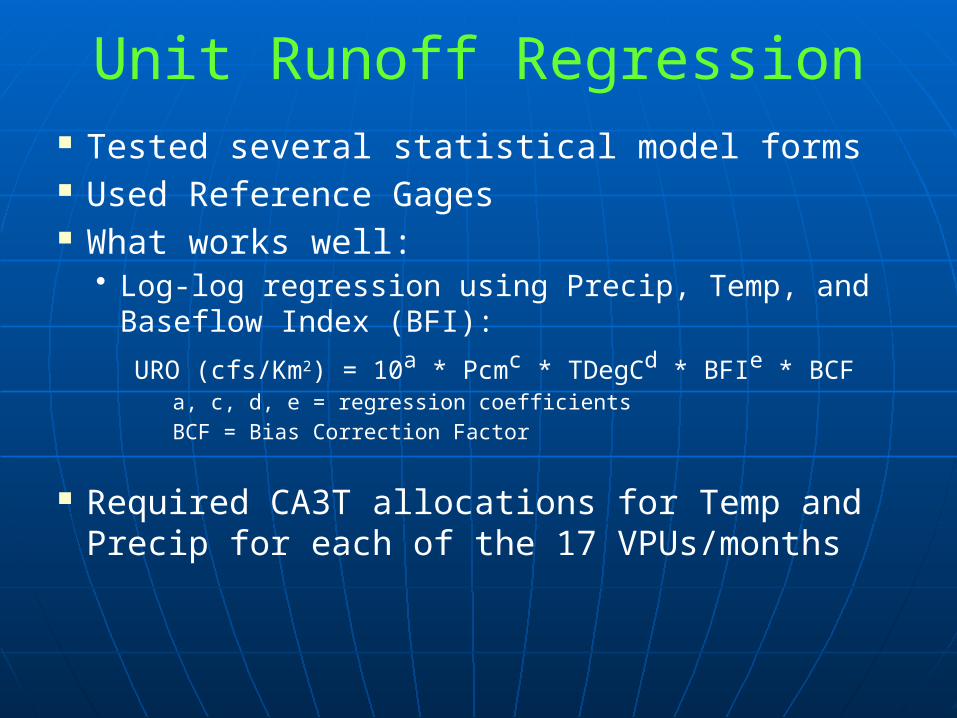
Unit Runoff Regression Tested several statistical model forms Used Reference Gages What works well:
• Log-log regression using Precip, Temp, and Baseflow Index (BFI):
URO (cfs/Km2) = 10a * Pcmc * TDegCd * BFIe * BCFa, c, d, e = regression coefficientsBCF = Bias Correction Factor
Required CA3T allocations for Temp and Precip for each of the 17 VPUs/months
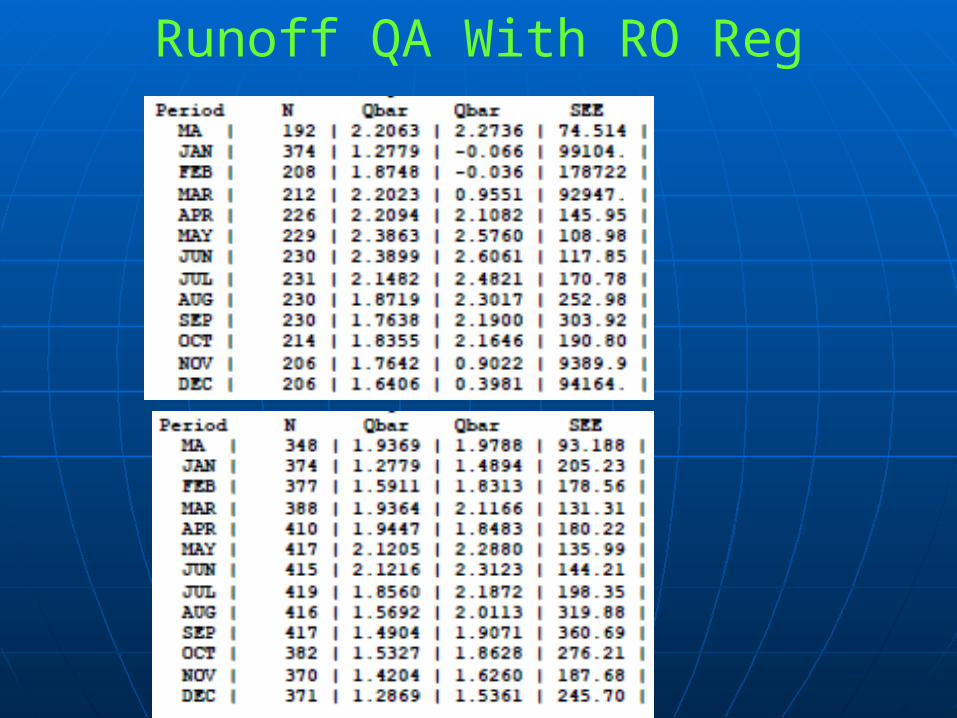
Runoff QA With RO Reg
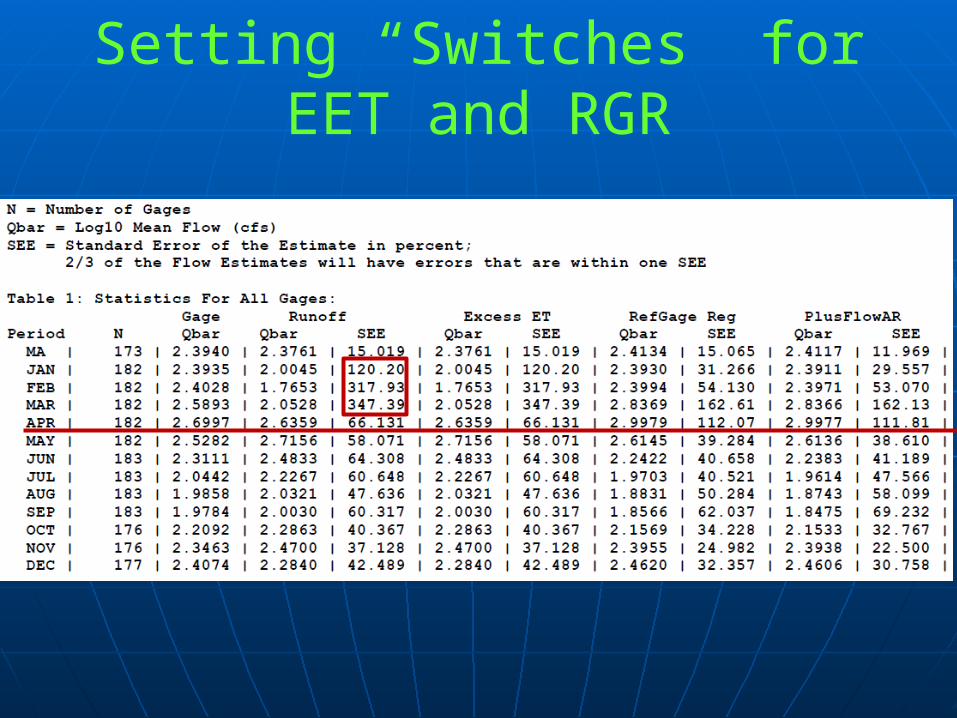
Setting “Switches” for EET and RGR

Implementing Mean Monthly Flows
Made a new production version of EROM (Version 10)
Limits the RGR to the regression bounds
Minimum of 10 years of gage record A new input file named
“EROMOPTS.DBF” is used:• One record for each VPU/Timeperiod
21 VPUs * 13 flows = 273 records• “Switches” for running/not running EET
and RGR and RO Regression coefficients
What Is Available
EROMExtension:• MA and MM flow and velocity estimates• MA and MM QA files• A QA spreadsheet; please use it
VPUAttributeExtension:• Catchment-level MA and MM Runoff,
Temperature and Precipitation• Cumulative MA Temperature and
Precipitation15
16
7Q10 Flow Estimates Estimate 7Q10 flows on ungaged
flowlines (stream segments) in NHDPlusV2• Use networked flowlines
Removes many canals and ditches• Note: less than 1% of the flowlines have
gages Leverage the advanced capabilities
in NHDPlusV2 and the Enhanced Runoff Method (EROM) to test a cost-effective method for estimating interpretive flow statistics
17
Approach Calculate 7Q10 at gages
• Use the DFLOW program in BASINS USE NHDPlusV2 watershed characteristics:
• drainage area (DA), mean precipitation (MP) and temperature (MT), mean watershed elevation (MWE), watershed slope (WS), Base Flow Index (BFI)
• EROM MA and MM Flows Develop regionalized regression equations
by “Vector Processing Units” (VPUs)• 7Q10 = Fn(EROM Flow, DA, MP, MT, MWE, WS,
BFI)• Use a log-log regression
18
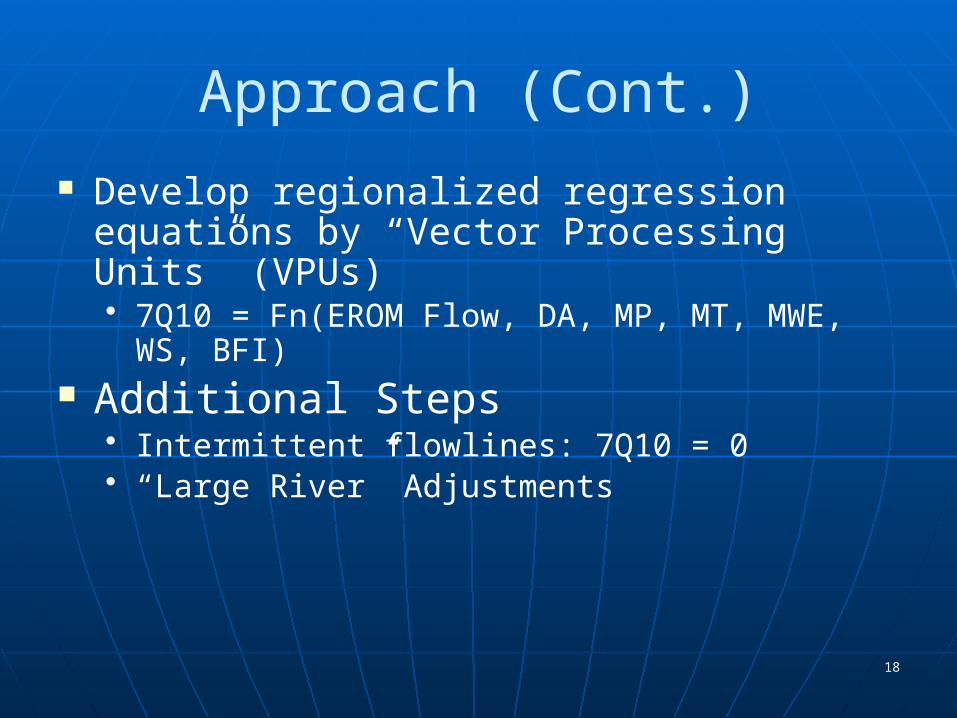
Approach (Cont.)
Develop regionalized regression equations by “Vector Processing Units” (VPUs)• 7Q10 = Fn(EROM Flow, DA, MP, MT, MWE, WS,
BFI) Additional Steps
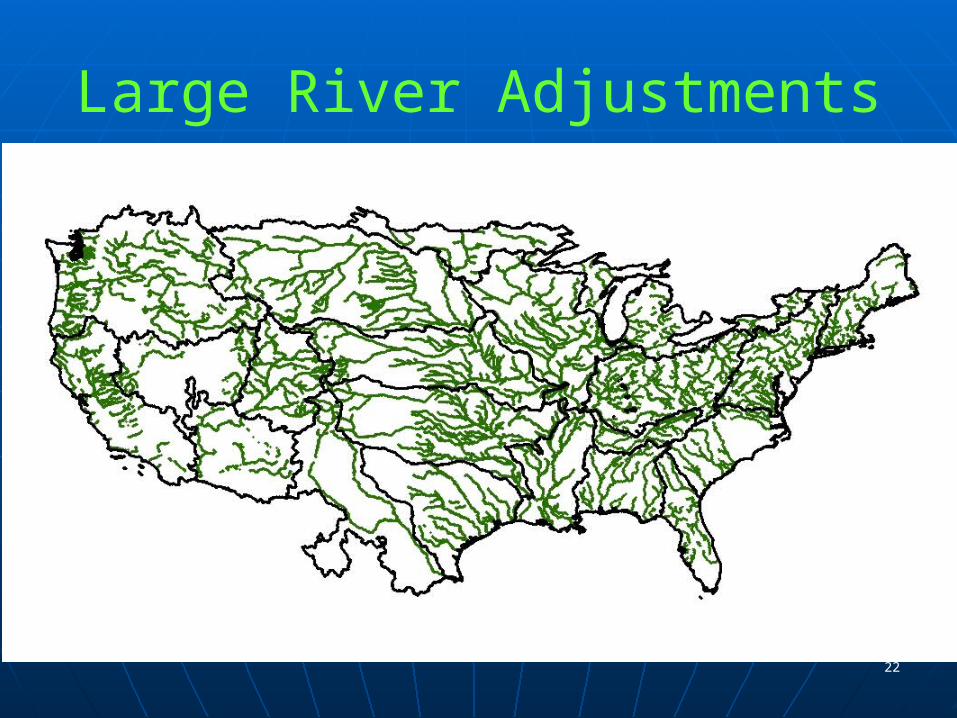
• Intermittent flowlines: 7Q10 = 0• “Large River” Adjustments
19
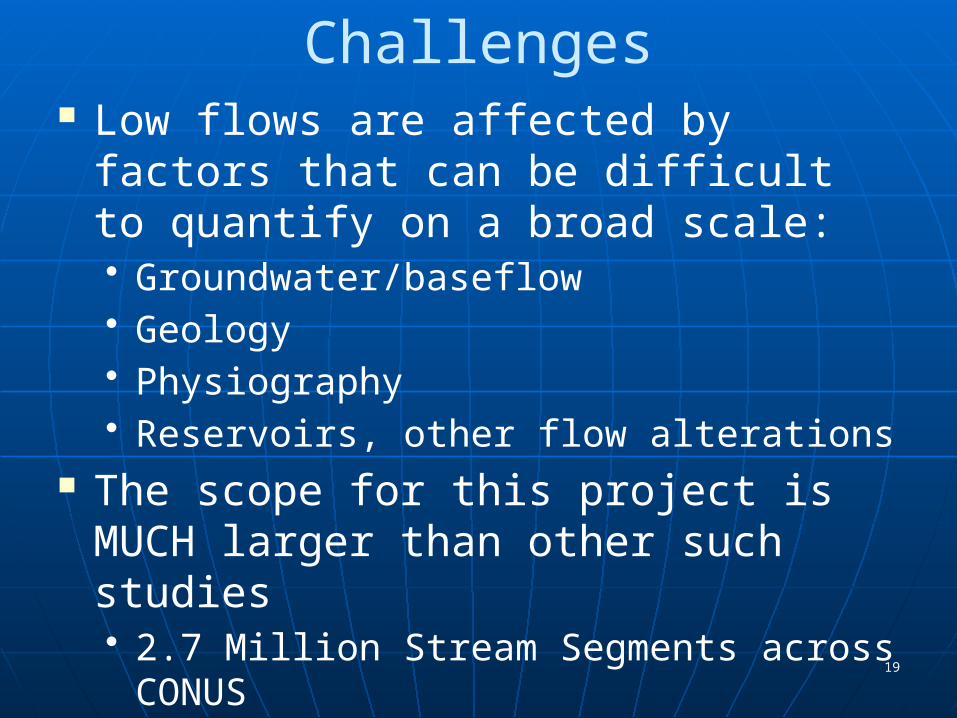
Challenges Low flows are affected by factors that
can be difficult to quantify on a broad scale:• Groundwater/baseflow• Geology• Physiography• Reservoirs, other flow alterations
The scope for this project is MUCH larger than other such studies• 2.7 Million Stream Segments across
CONUS The VPUs are MUCH larger than the
geographic areas normally used.
20
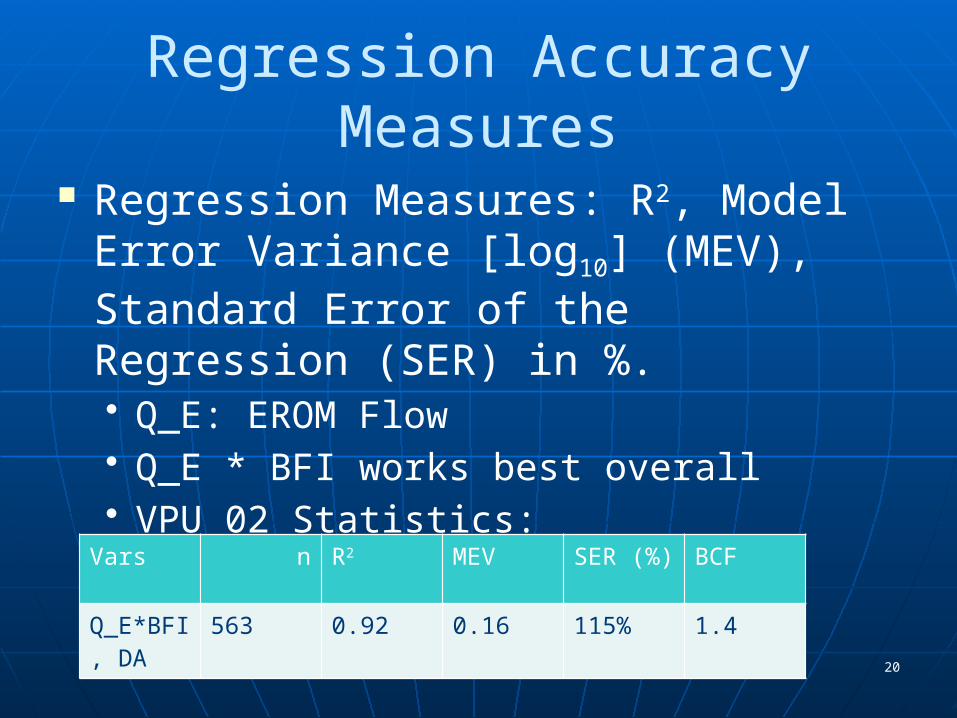
Regression Accuracy Measures
Regression Measures: R2, Model Error Variance [log10] (MEV), Standard Error of the Regression (SER) in %.• Q_E: EROM Flow• Q_E * BFI works best overall• VPU 02 Statistics:
Vars n R2 MEV SER (%) BCF
Q_E*BFI, DA
563 0.92 0.16 115% 1.4
21
22
Large River Adjustments
23
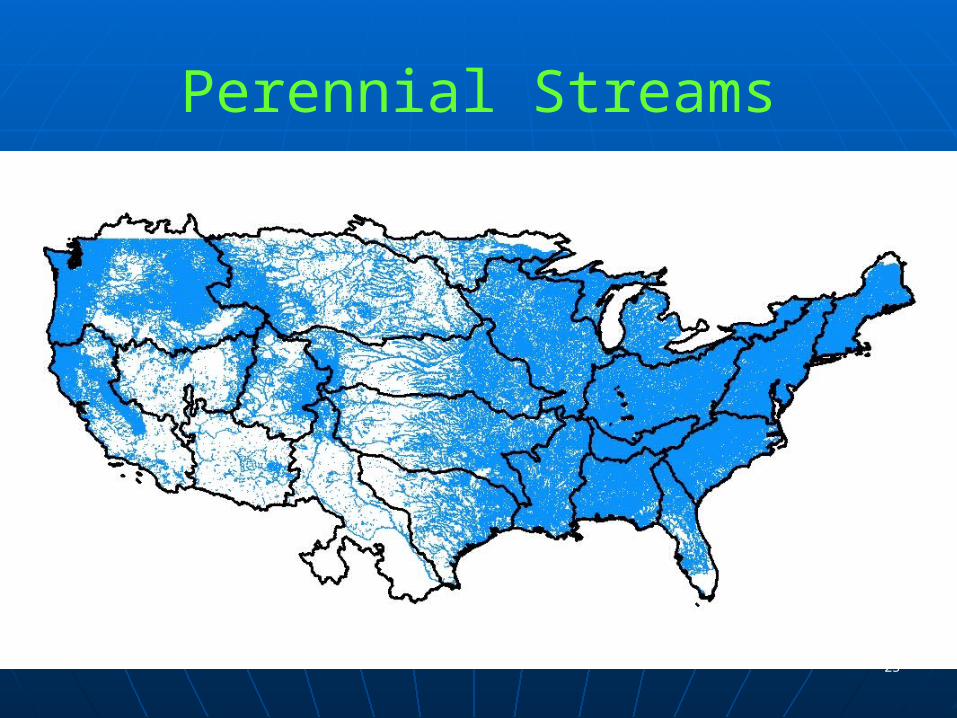
Perennial Streams
24
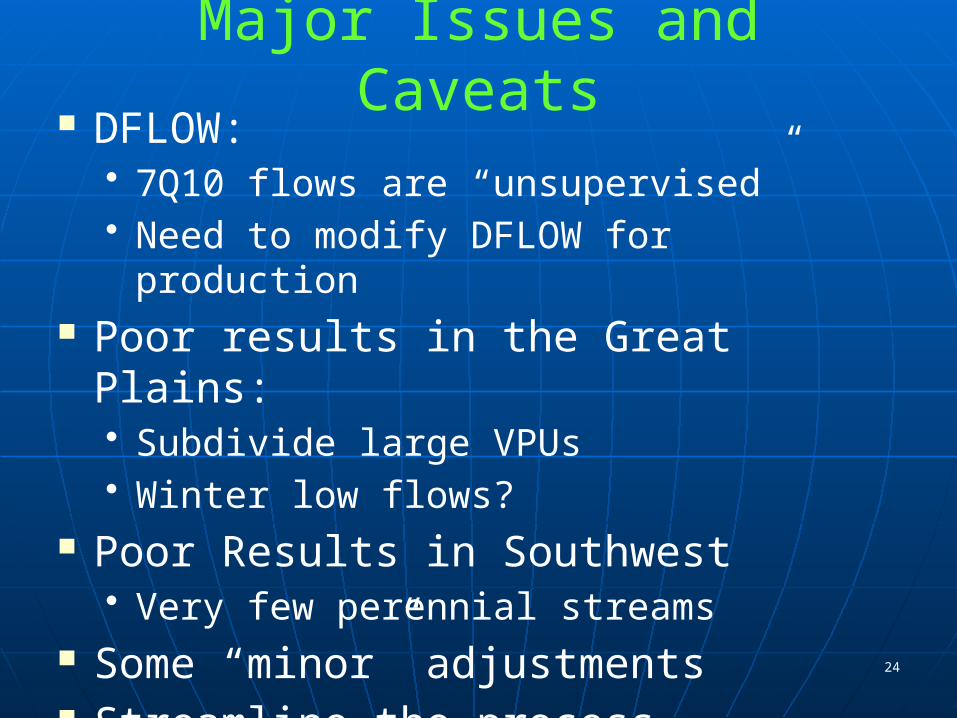
Major Issues and Caveats DFLOW:
• 7Q10 flows are “unsupervised”• Need to modify DFLOW for production
Poor results in the Great Plains:• Subdivide large VPUs• Winter low flows?
Poor Results in Southwest• Very few perennial streams
Some “minor” adjustments Streamline the process
25
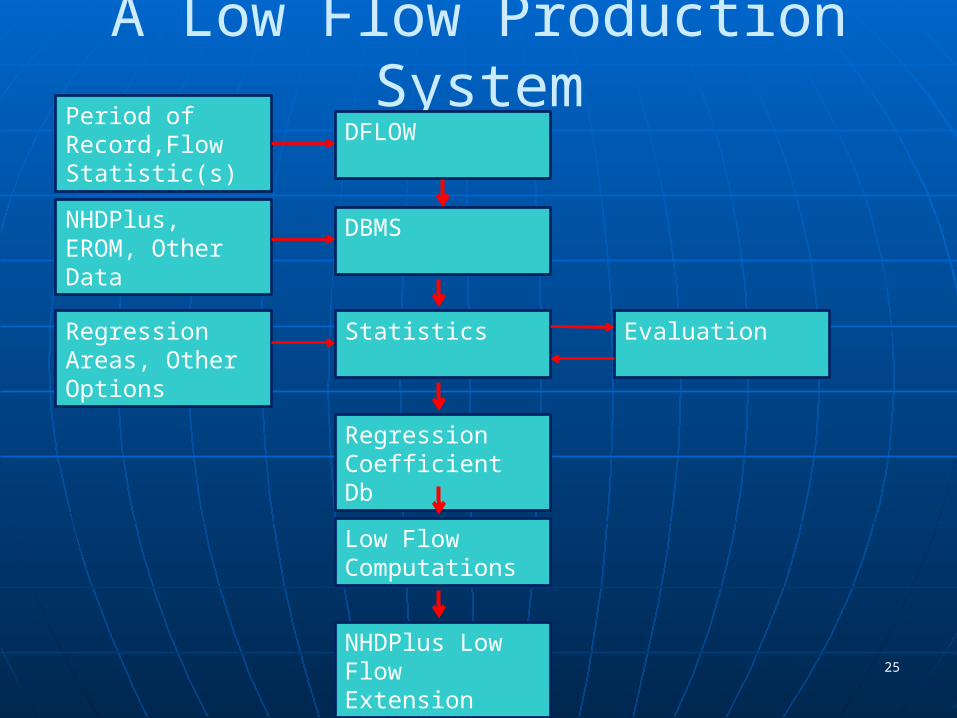
A Low Flow Production SystemDFLOW
DBMS
Statistics
Regression Coefficient Db
Low Flow Computations
NHDPlus Low Flow Extension
EvaluationRegression Areas, Other Options
NHDPlus, EROM, Other Data
Period of Record,Flow Statistic(s)
26
Down the Road PlusFlowAR:
• Incorporate more detailed information from NHD Stewards, WBD, others!
• Seasonal values? EET Step: Model Coefficients, issues
in some areas Continue 7Q10, other low flows Use a 1981-2010 time frame
• PRISM has released “normals” for this period
• An issue: international drainage
Read All About It!
Go to NHDPlus.com• This redirects you to the
ftp.horizon-systems.com page• Click on a hot-link in the text to get the
User Guide In the User Guide:
• Pages 61-69: EROM and Attribute Extension Table Layouts
• Pages 125-147: How EROM works Note caveats for using velocities!!!!
27
28
Questions?
Tim Bondelid - Independent Consultant to [email protected]
NHDPlus V02:http://www.horizon-systems.com/NHDPlus


![AWRA-L v5.0: Technical description of model algorithms and ... · CSIRO LAND AND WATER AWRA-L v5.0: Technical description of model algorithms and inputs [AWRA-L v5.0 technical report]](https://img.pdfslide.net/doc/110x75/5b60e9a57f8b9a4a488bd18c/awra-l-v50-technical-description-of-model-algorithms-and-csiro-land-and.jpg)