Embed Size (px)
Citation preview

1
More on UML
Xiaojun Qi
2
The Current Version of UML• Like all modern computer languages, UML
is constantly changing– When this book was written, the latest version
of UML was Version 2.0– By now, some aspects of UML may have
changed
• UML is now under the control of the Object Management Group (OMG)– Check for updates at the OMG Web site,
www.omg.org
3
UML Is Not a Methodology• UML is an acronym for Unified Modeling
Language– UML is therefore a language
• A language is simply a tool for expressing ideas
• UML is a notation, not a methodology– It can be used in conjunction with any methodology
• UML is not merely a notation, it is the notation
• UML has become a world standard– Every information technology professional today
needs to know UML
4
UML Is Not a Methodology (Cont.)• The manual for Version 1.4 of UML is
nearly 600 pages long; The manual for version 2.0 of UML is over 1200 pages long– Complete coverage is not possible
• The small subset of UML presented in Chapters 7, 10, 12, and 13 is adequate for the purposes of this book
• The larger subset of UML presented in this chapter is adequate for the development and maintenance of most software products
5
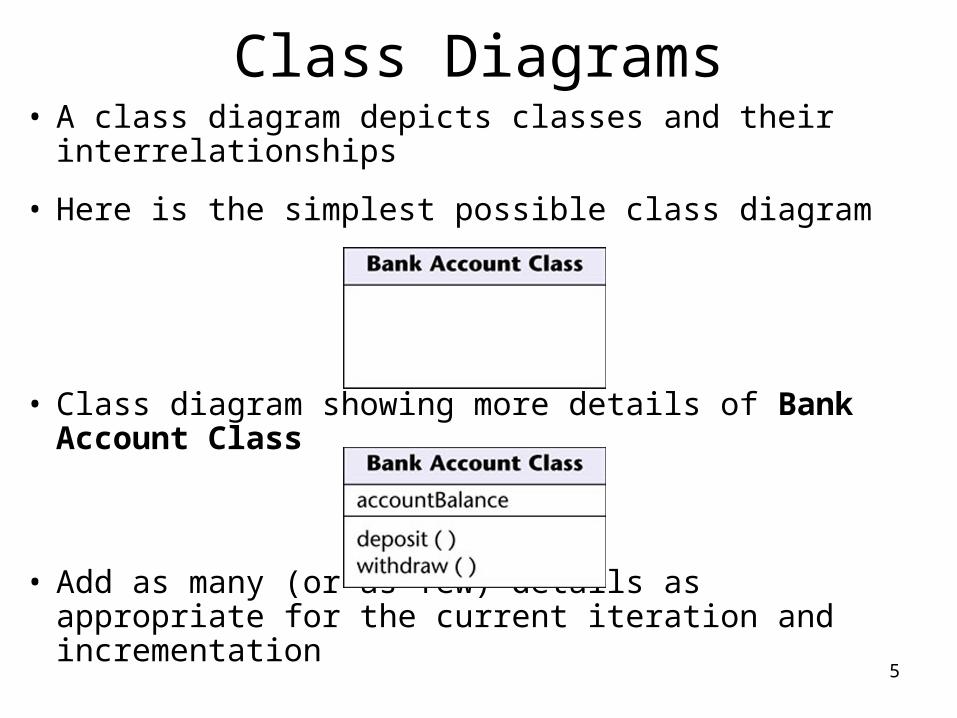
Class Diagrams• A class diagram depicts classes and their
interrelationships
• Here is the simplest possible class diagram
• Class diagram showing more details of Bank Account Class
• Add as many (or as few) details as appropriate for the current iteration and incrementation
6
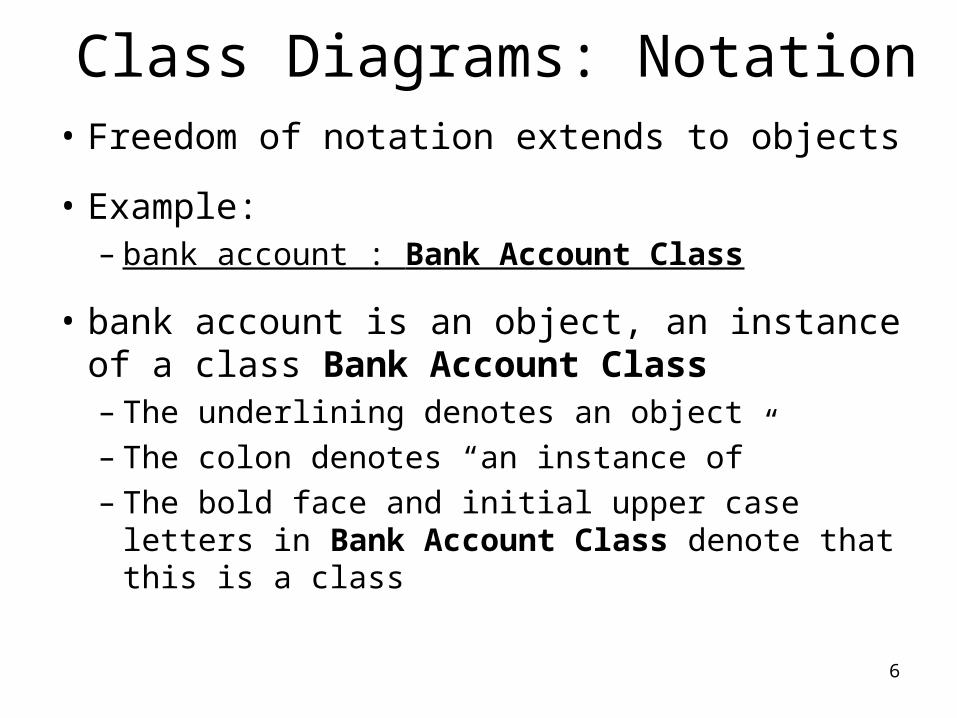
Class Diagrams: Notation• Freedom of notation extends to objects
• Example: – bank account : Bank Account Class
• bank account is an object, an instance of a class Bank Account Class– The underlining denotes an object– The colon denotes “an instance of” – The bold face and initial upper case letters in
Bank Account Class denote that this is a class
7
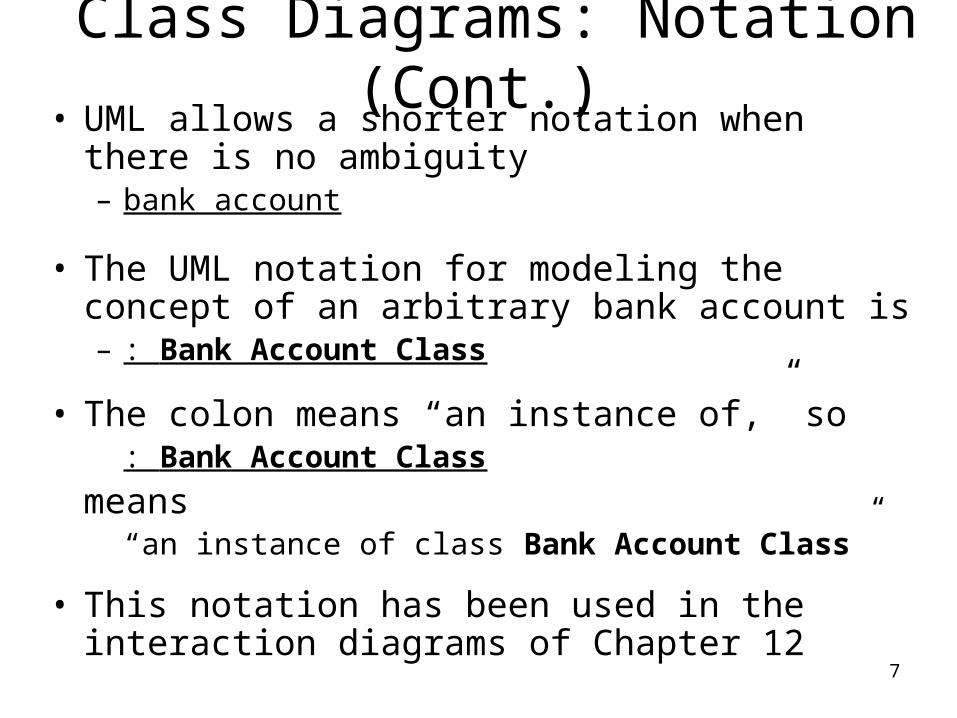
Class Diagrams: Notation (Cont.)• UML allows a shorter notation when there is no
ambiguity– bank account
• The UML notation for modeling the concept of an arbitrary bank account is – : Bank Account Class
• The colon means “an instance of,” so : Bank Account Class
means “an instance of class Bank Account Class”
• This notation has been used in the interaction diagrams of Chapter 12
8
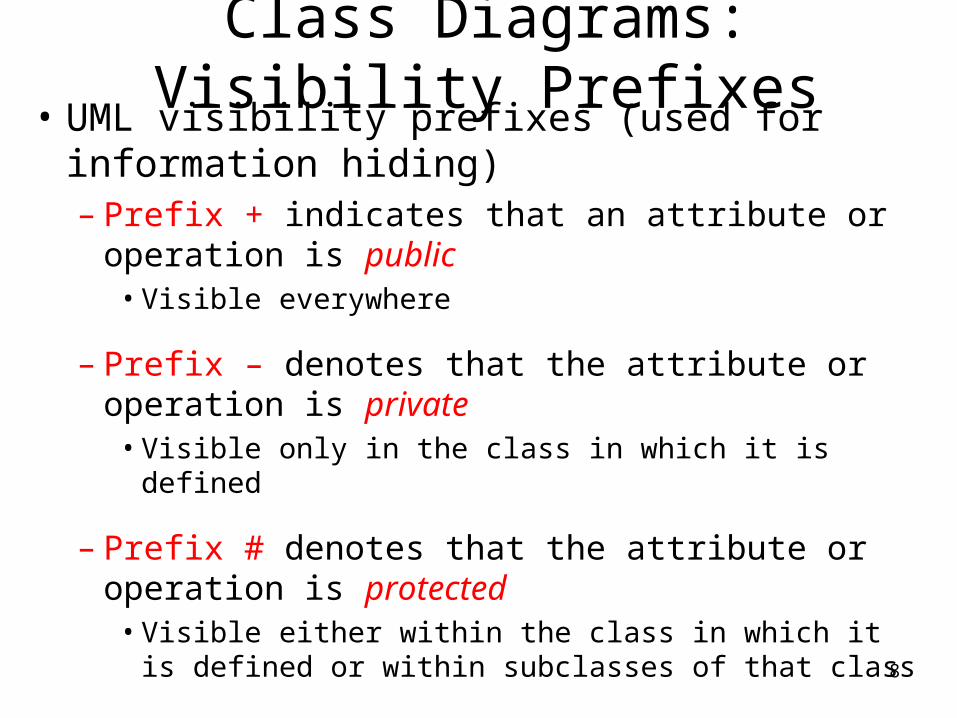
Class Diagrams: Visibility Prefixes• UML visibility prefixes (used for information
hiding) – Prefix + indicates that an attribute or operation is
public• Visible everywhere
– Prefix – denotes that the attribute or operation is private
• Visible only in the class in which it is defined
– Prefix # denotes that the attribute or operation is protected
• Visible either within the class in which it is defined or within subclasses of that class
9
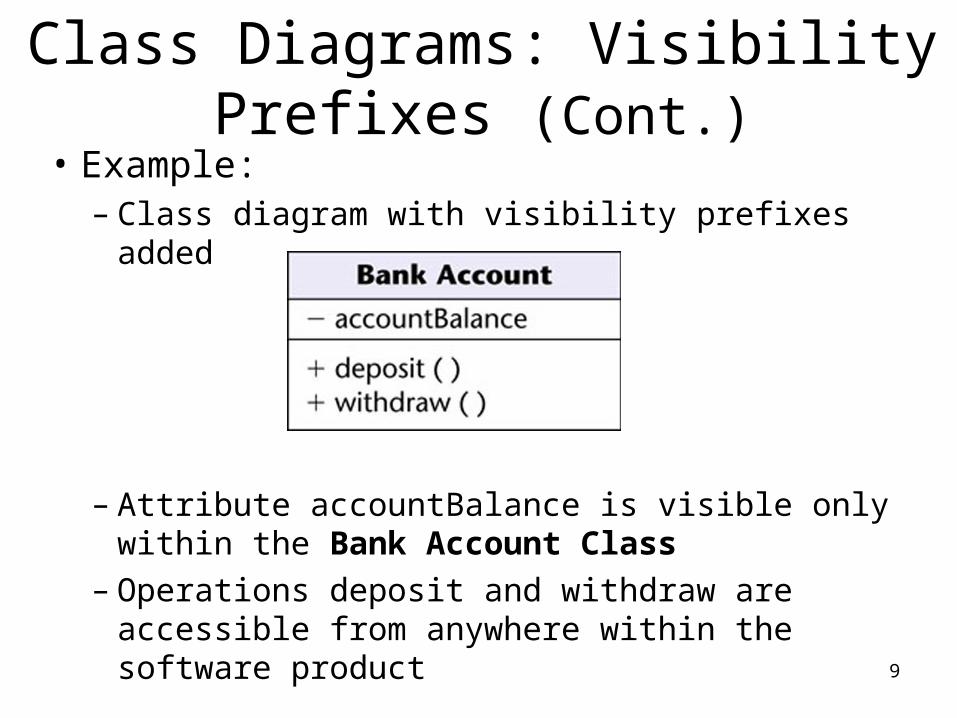
• Example:– Class diagram with visibility prefixes added
– Attribute accountBalance is visible only within the Bank Account Class
– Operations deposit and withdraw are accessible from anywhere within the software product
Class Diagrams: Visibility Prefixes (Cont.)
10
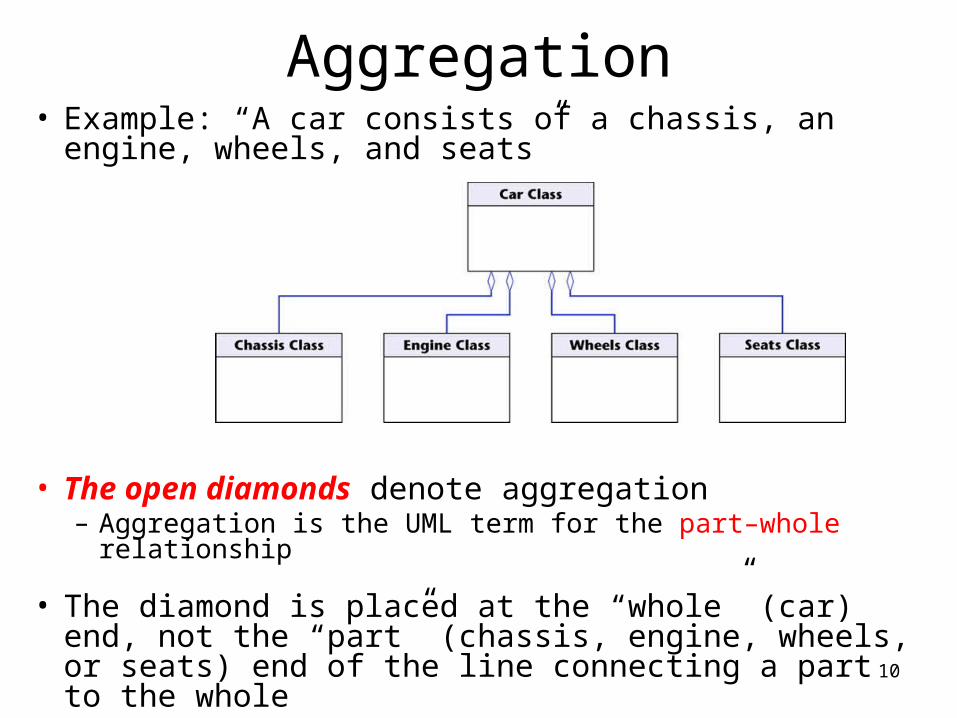
Aggregation• Example: “A car consists of a chassis, an engine,
wheels, and seats”
• The open diamonds denote aggregation– Aggregation is the UML term for the part–whole
relationship
• The diamond is placed at the “whole” (car) end, not the “part” (chassis, engine, wheels, or seats) end of the line connecting a part to the whole
11
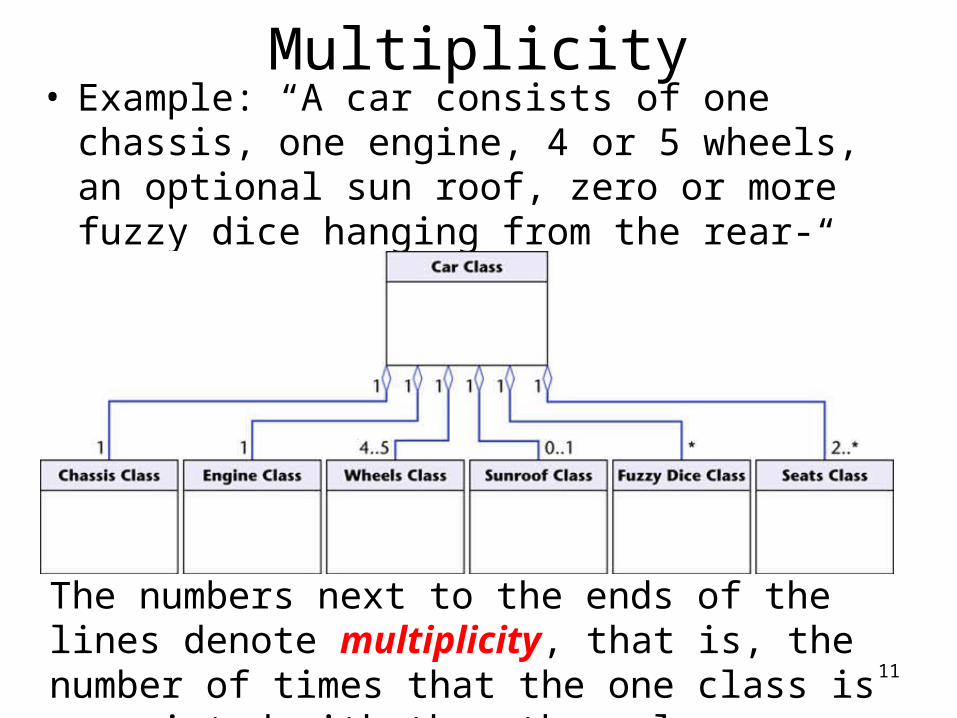
Multiplicity• Example: “A car consists of one chassis, one
engine, 4 or 5 wheels, an optional sun roof, zero or more fuzzy dice hanging from the rear-view mirror, and 2 or more seats”
The numbers next to the ends of the lines denote multiplicity, that is, the number of times that the one class is associated with the other class
12
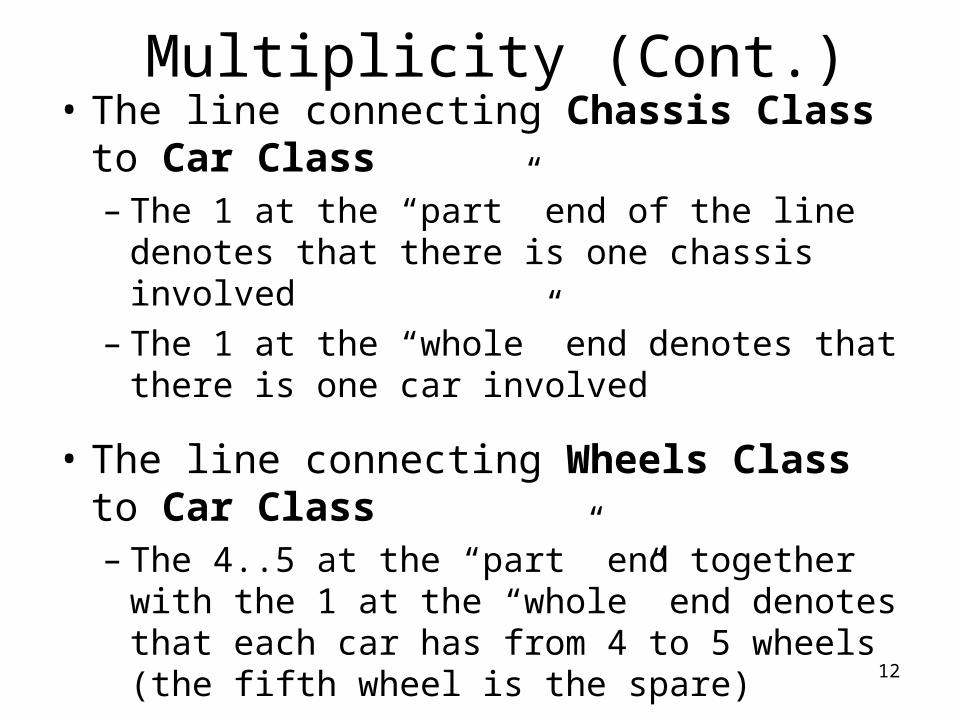
Multiplicity (Cont.)• The line connecting Chassis Class to Car
Class– The 1 at the “part” end of the line denotes that
there is one chassis involved– The 1 at the “whole” end denotes that there is
one car involved
• The line connecting Wheels Class to Car Class– The 4..5 at the “part” end together with the 1
at the “whole” end denotes that each car has from 4 to 5 wheels (the fifth wheel is the spare)
13
Multiplicity (Cont.)• The line connecting Sun Roof Class to
Car Class– Two dots .. denote a range, so the 0..1 means
zero or one, the UML way of denoting “optional”
• The line connecting Fuzzy Dice Class to Car Class– The * by itself means zero or more
• The line connecting Seats Class to Car Class– An asterisk in a range denotes “or more,” so
the 2..* means 2 or more
14
Multiplicity (Cont.)• If the exact multiplicity is known, use it
– Example: The 1 that appears in 8 places
• If the range is known, use the range notation– Examples: 0..1 or 4..5
• If the number is unspecified, use the asterisk– Example: *
• If the range has upper limit unspecified, combine the range notation with the asterisk notation– Example: 2..*
15
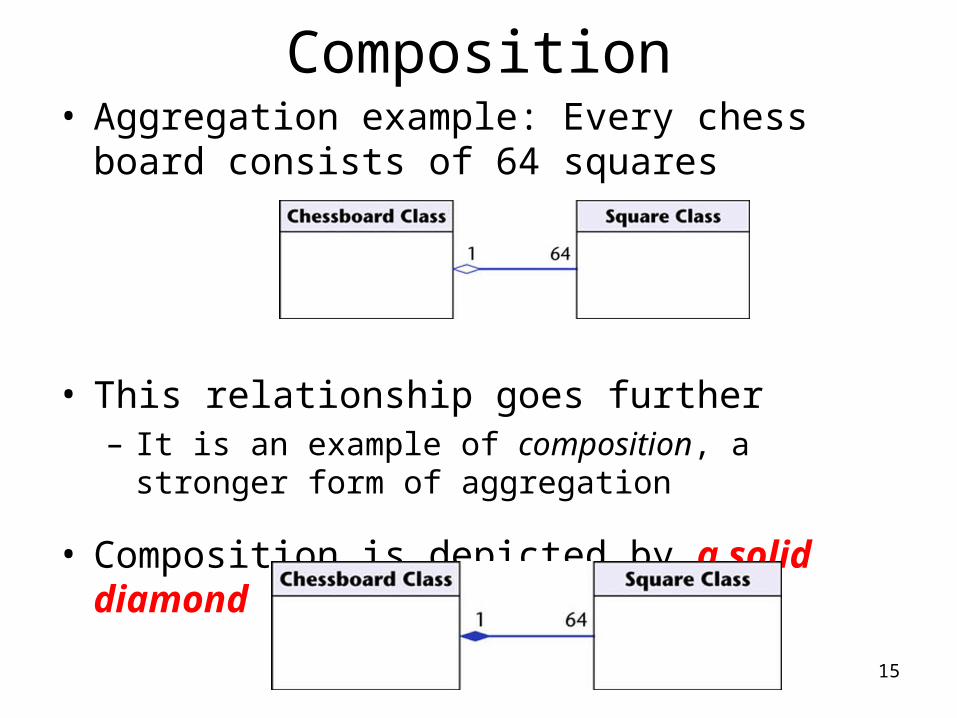
Composition• Aggregation example: Every chess board
consists of 64 squares
• This relationship goes further– It is an example of composition, a stronger form of
aggregation
• Composition is depicted by a solid diamond
16
Composition (Cont.)• Composition
– Also models the part–whole relationship but, in addition,
– Every part may belong to only one whole, and – If the whole is deleted, so are the parts
• Example: A number of different chess boards– Each square belongs to only one board– If a chess board is thrown away, all 64 squares
on that board go as well
17
Generalization• Inheritance is a required feature of object
orientation
• Inheritance is a special case of generalization– The UML notation for generalization is an open
triangle– Sometimes the open triangle is labeled with a
discriminator
18
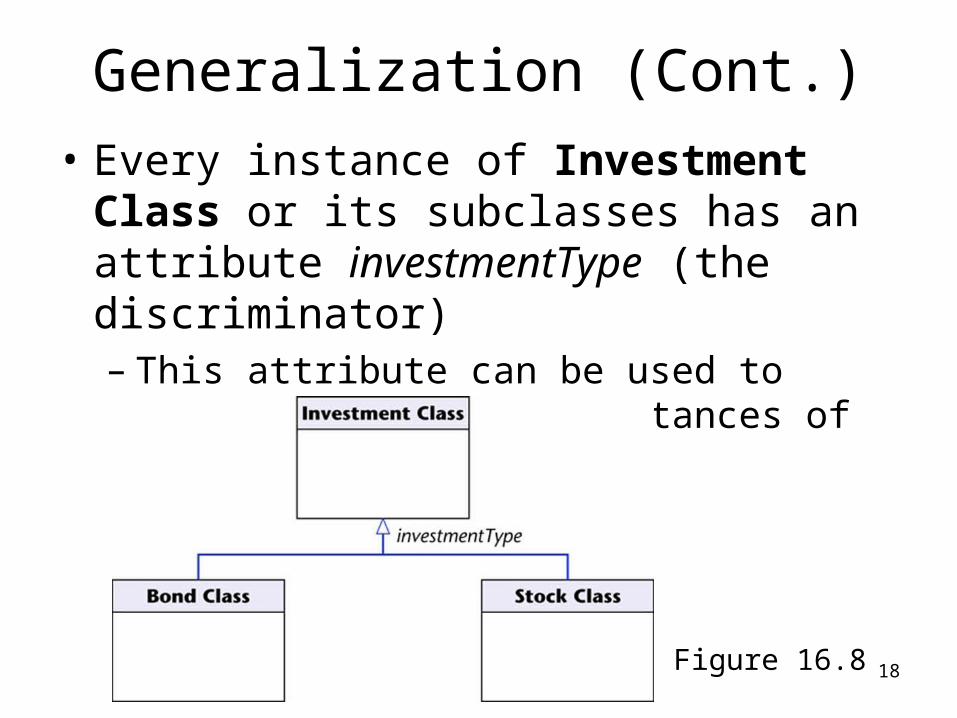
Generalization (Cont.)
• Every instance of Investment Class or its subclasses has an attribute investmentType (the discriminator)– This attribute can be used to distinguish
between instances of the subclasses
Figure 16.8
19
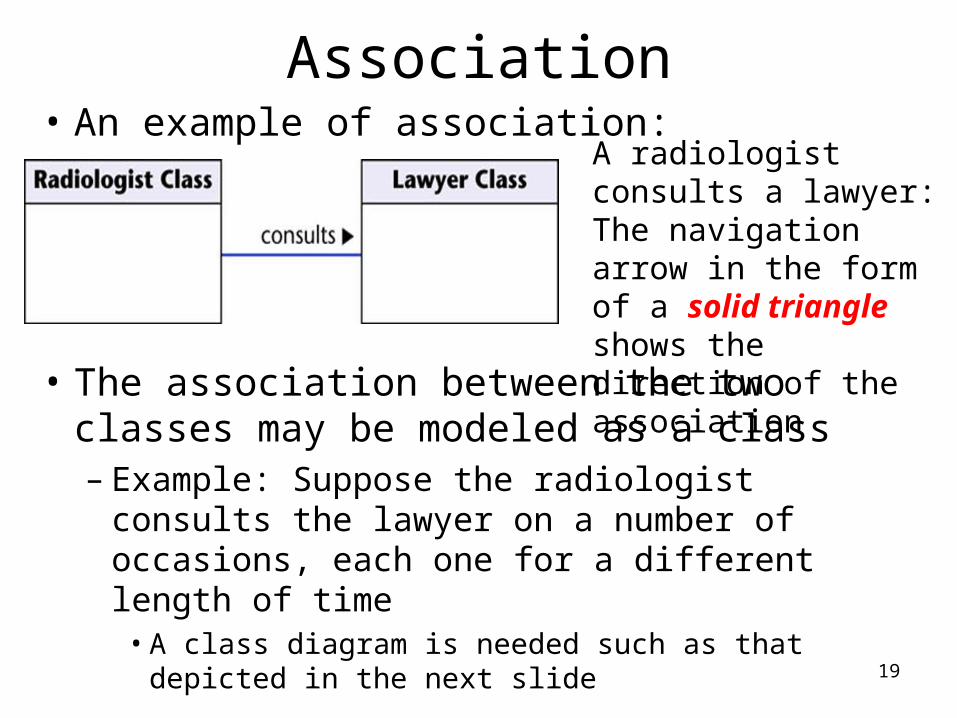
Association• An example of association:
• The association between the two classes may be modeled as a class– Example: Suppose the radiologist consults the
lawyer on a number of occasions, each one for a different length of time
• A class diagram is needed such as that depicted in the next slide
A radiologist consults a lawyer: The navigation arrow in the form of a solid triangle shows the direction of the association
20
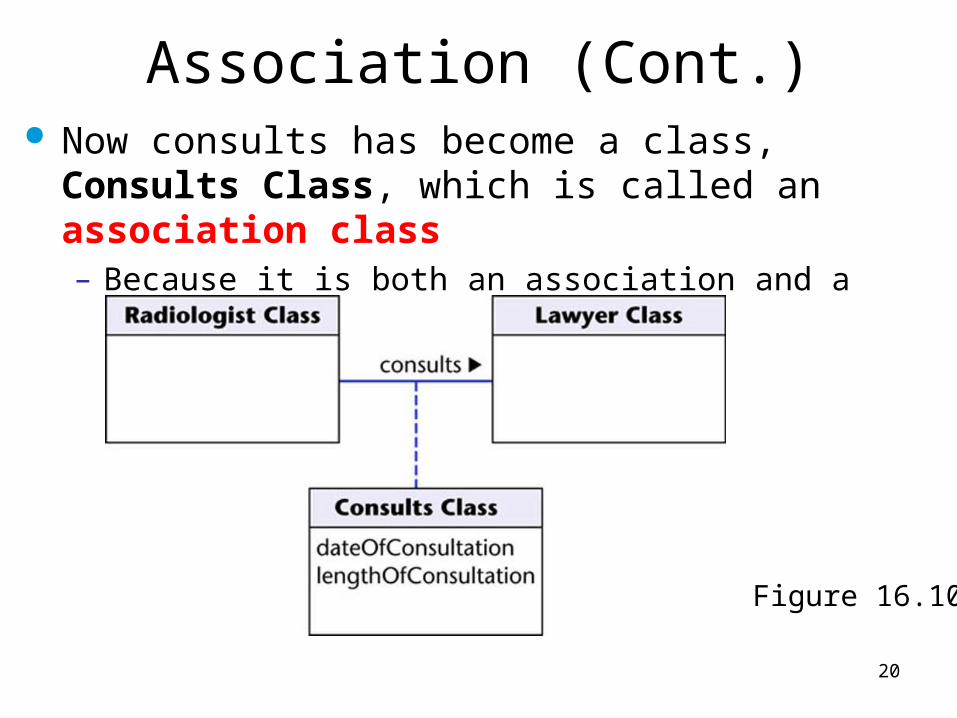
Association (Cont.) Now consults has become a class, Consults Class,
which is called an association class – Because it is both an association and a class
Figure 16.10
21
Notes
• A comment in a UML diagram is called a note– Depicted as a rectangle with the top right-
hand corner bent over– A dashed line is drawn from the note to the
item to which the note refers
22
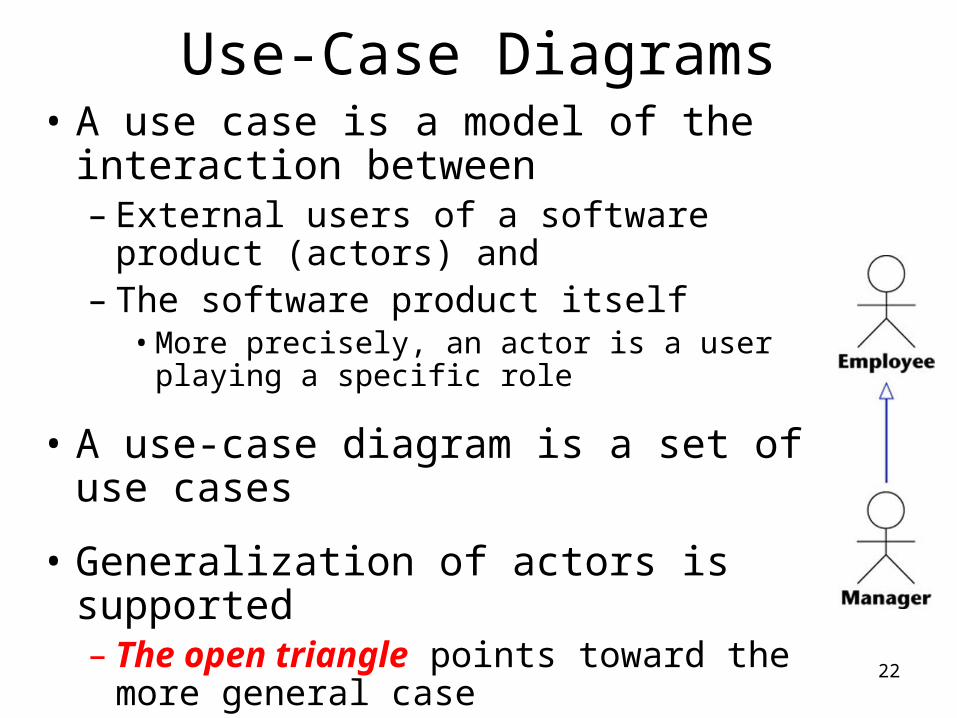
Use-Case Diagrams• A use case is a model of the interaction
between – External users of a software product
(actors) and – The software product itself
• More precisely, an actor is a user playing a specific role
• A use-case diagram is a set of use cases
• Generalization of actors is supported– The open triangle points toward the more
general case
23
Stereotypes• A stereotype in UML is a way of extending
UML
• Stereotypes already encountered include – Boundary, control, and entity classes, and – The «include» stereotype
• The names of stereotypes appear between guillemets– Example: «This is my own construct»
24
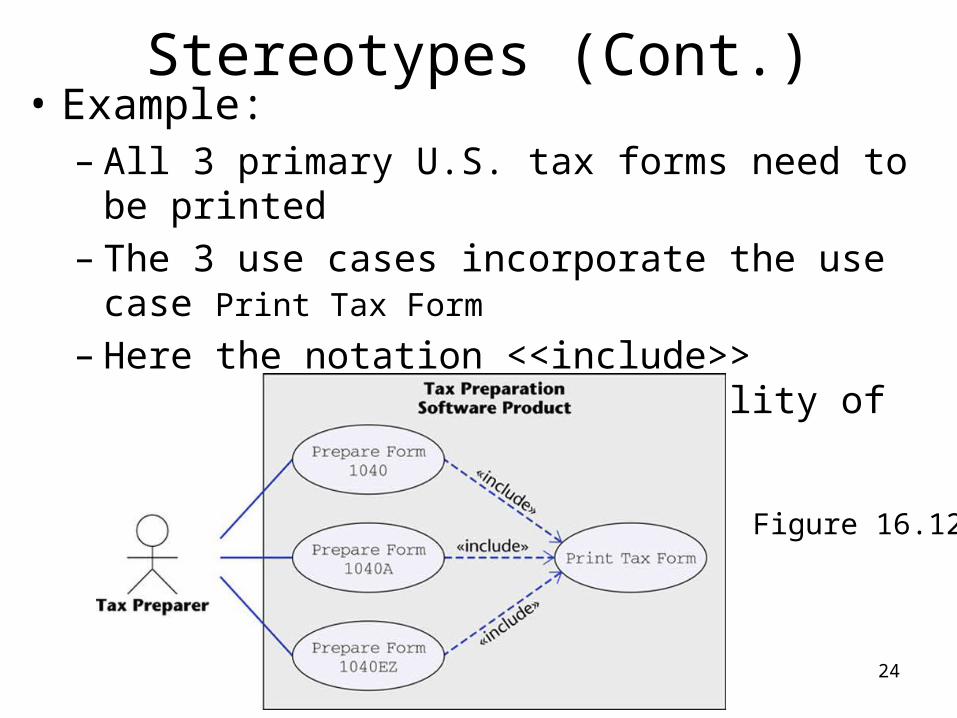
Stereotypes (Cont.)• Example:
– All 3 primary U.S. tax forms need to be printed– The 3 use cases incorporate the use case Print Tax Form
– Here the notation <<include>> denotes the common functionality of the use case Print Tax Form
Figure 16.12
25
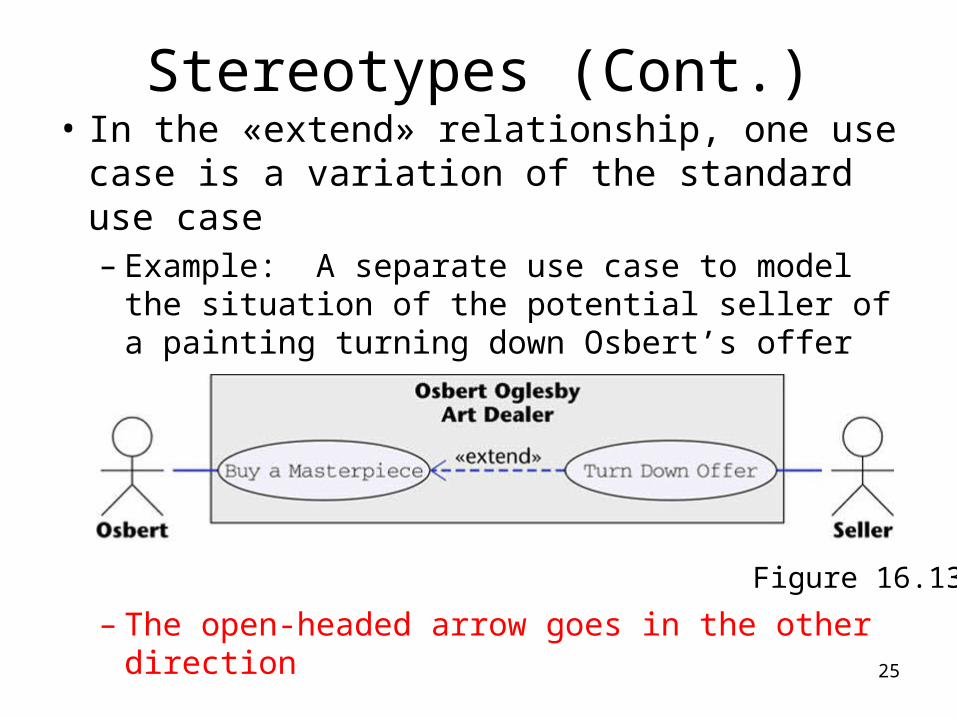
Stereotypes (Cont.)• In the «extend» relationship, one use case
is a variation of the standard use case– Example: A separate use case to model the
situation of the potential seller of a painting turning down Osbert’s offer
– The open-headed arrow goes in the other direction
Figure 16.13
26
Interaction Diagrams
• Interaction diagrams show how objects interact with one another
• UML supports two types of interaction diagrams – Sequence diagrams– Collaboration diagrams
27
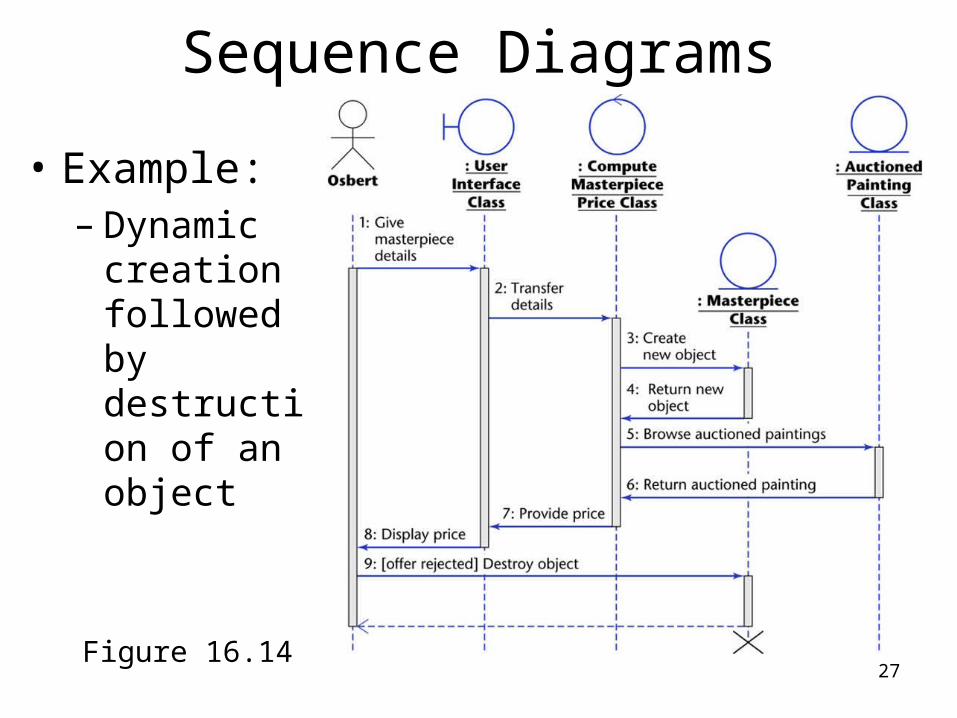
Sequence Diagrams
• Example:– Dynamic
creation followed by destruction of an object
Figure 16.14
28
Sequence Diagrams (Cont.)• The lifelines in the sequence diagram
– An active object is denoted by a thin rectangle (activation box) in place of the dashed line
• Creation of the : Masterpiece Class object is denoted by the lifeline starting at the point of dynamic creation
• Destruction of that object after it receives message
• 9: Destroy object
is denoted by the heavy X
29
Sequence Diagrams (Cont.)
• A message is optionally followed by a message sent back to the object that sent the original message
• Even if there is a reply, it is not necessary that a specific new message be sent back– Instead, a dashed line ending in an open
arrow indicates a return from the original message, as opposed to a new message
30
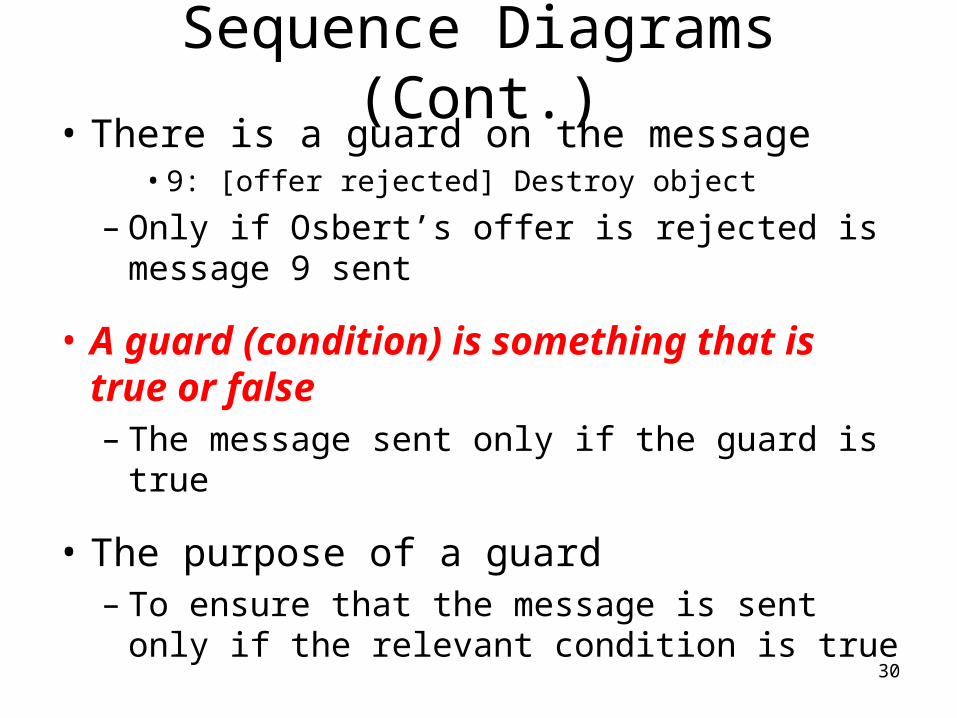
Sequence Diagrams (Cont.)• There is a guard on the message
• 9: [offer rejected] Destroy object
– Only if Osbert’s offer is rejected is message 9 sent
• A guard (condition) is something that is true or false– The message sent only if the guard is true
• The purpose of a guard– To ensure that the message is sent only if the
relevant condition is true
31
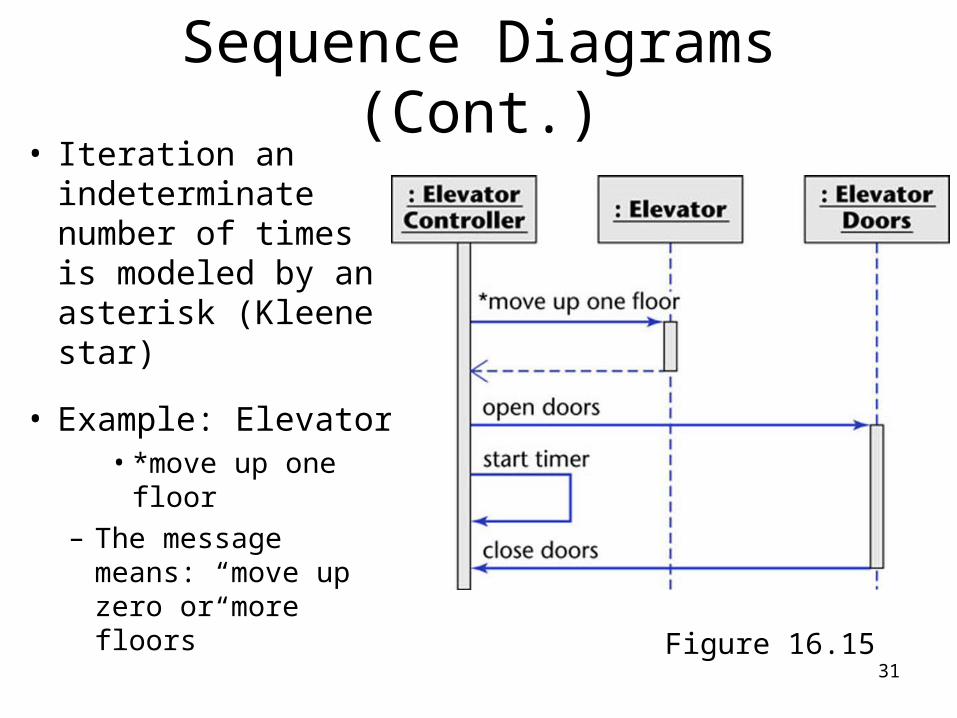
Sequence Diagrams (Cont.)• Iteration an
indeterminate number of times is modeled by an asterisk (Kleene star)
• Example: Elevator• *move up one
floor– The message
means: “move up zero or more floors”
Figure 16.15
32
Sequence Diagrams (Cont.)• An object can send a message to itself
– A self-call
• Example: – The elevator has arrived at a floor– The elevator doors now open and a timer
starts– At the end of the timer period the doors close
again– The elevator controller sends a message to
itself to start its timer — this self-call is shown in the UML diagram on the previous slide.

33
Collaboration Diagrams
• Collaboration diagrams are equivalent to sequence diagrams– All the features of sequence diagrams are
equally applicable to collaboration diagrams
• Use a sequence diagram when the transfer of information is the focus of attention
• Use a collaboration diagram when concentrating on the classes
34
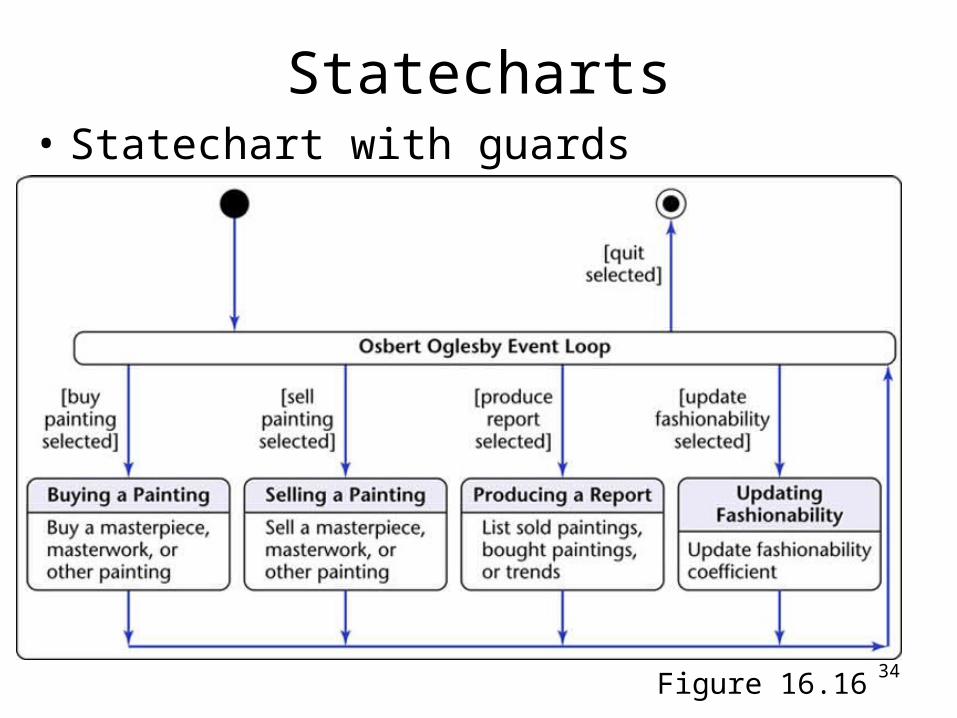
Statecharts• Statechart with guards
Figure 16.16
35
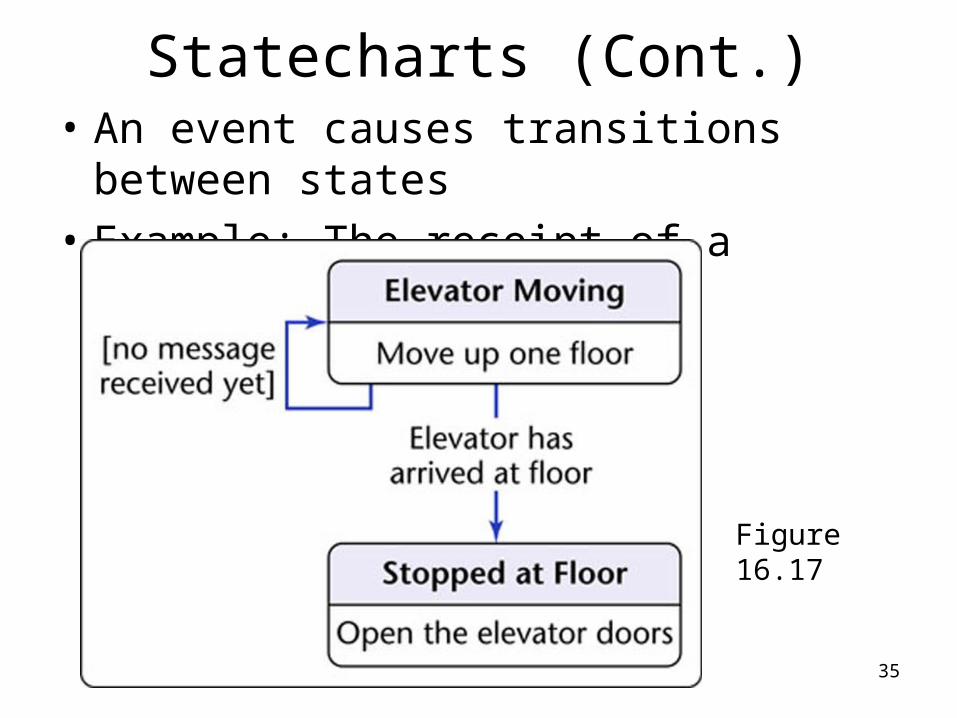
Statecharts (Cont.)• An event causes transitions between states
• Example: The receipt of a message
Figure 16.17
36
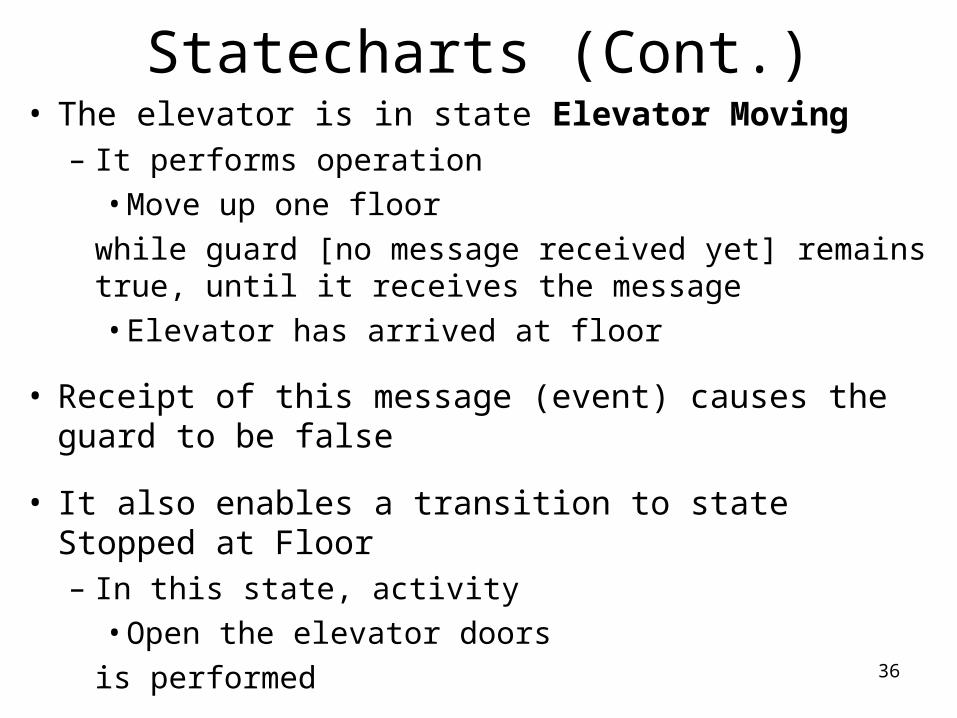
Statecharts (Cont.)• The elevator is in state Elevator Moving
– It performs operation
• Move up one floor
while guard [no message received yet] remains true, until it receives the message
• Elevator has arrived at floor
• Receipt of this message (event) causes the guard to be false
• It also enables a transition to state Stopped at Floor– In this state, activity
• Open the elevator doors
is performed
37
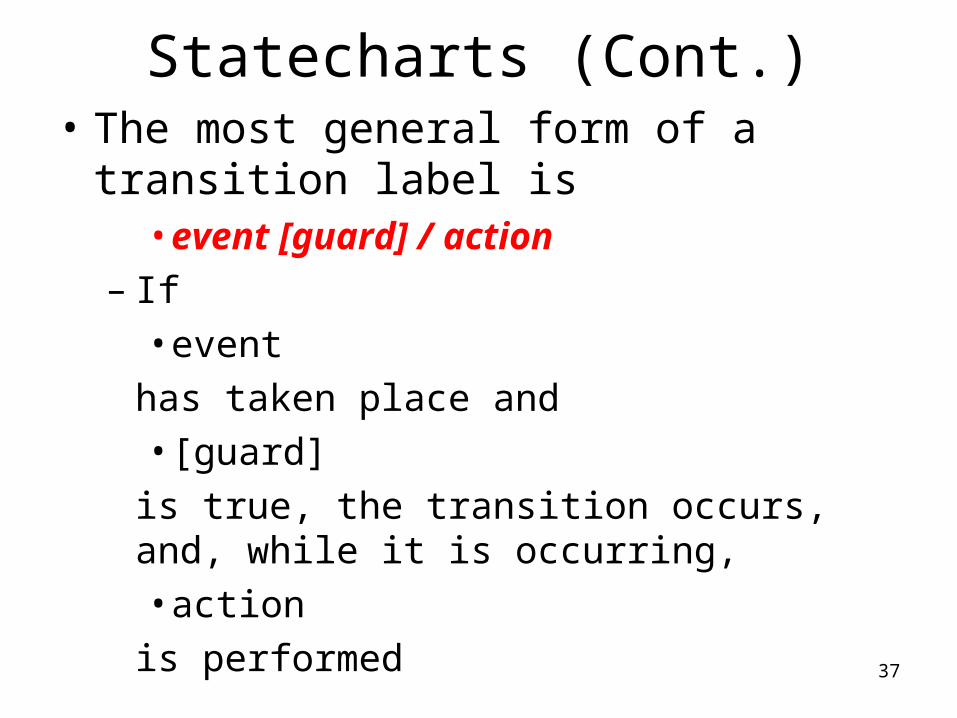
Statecharts (Cont.)• The most general form of a transition label
is• event [guard] / action
– If • event
has taken place and • [guard]
is true, the transition occurs, and, while it is occurring, • action
is performed
38
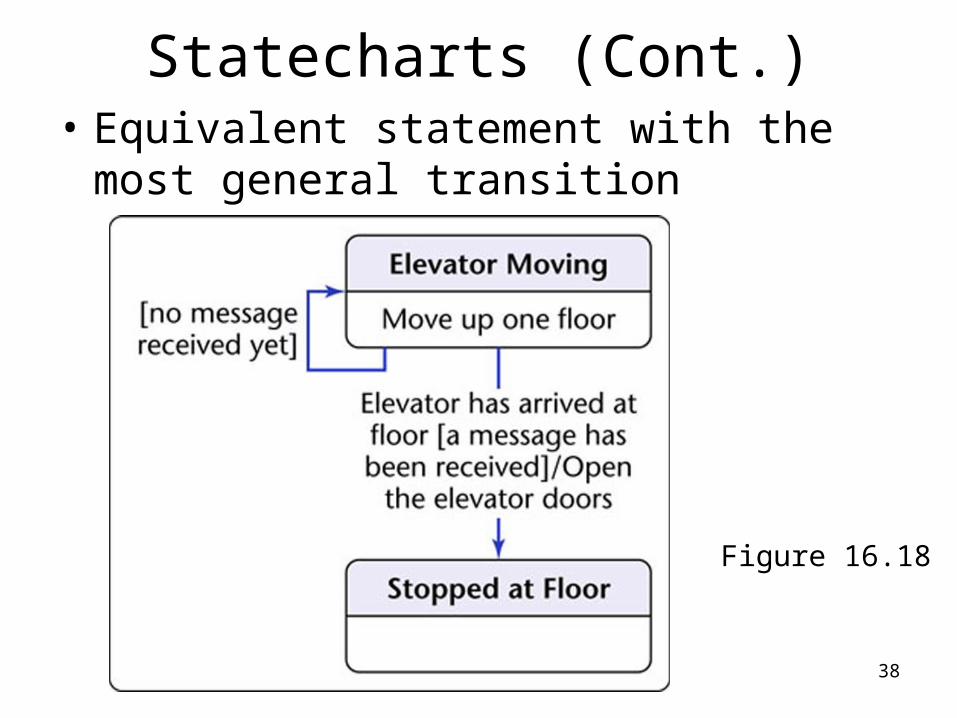
Statecharts (Cont.)• Equivalent statement with the most
general transition
Figure 16.18
39
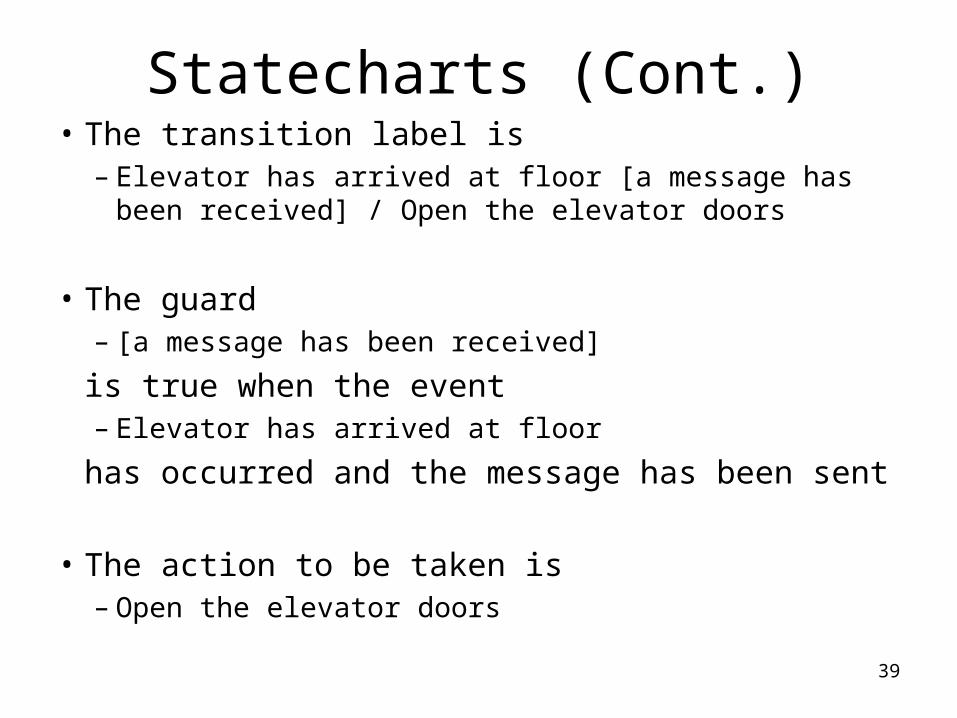
Statecharts (Cont.)• The transition label is
– Elevator has arrived at floor [a message has been received] / Open the elevator doors
• The guard– [a message has been received]
is true when the event– Elevator has arrived at floor
has occurred and the message has been sent
• The action to be taken is – Open the elevator doors
40
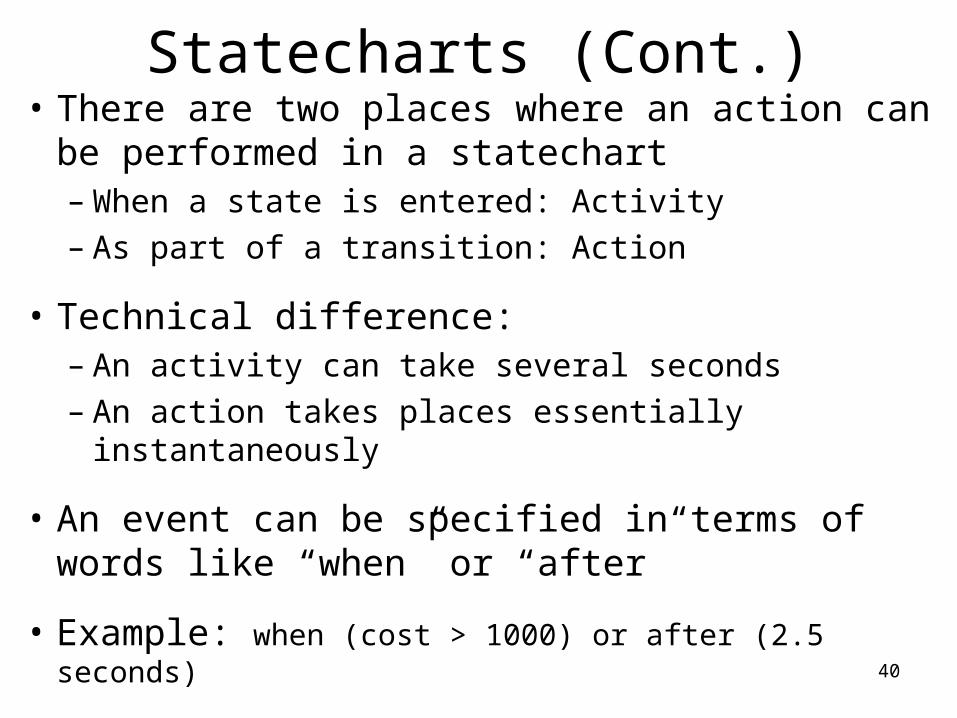
Statecharts (Cont.)• There are two places where an action can be
performed in a statechart– When a state is entered: Activity– As part of a transition: Action
• Technical difference:– An activity can take several seconds – An action takes places essentially instantaneously
• An event can be specified in terms of words like “when” or “after”
• Example: when (cost > 1000) or after (2.5 seconds)
41
Statecharts (Cont.)
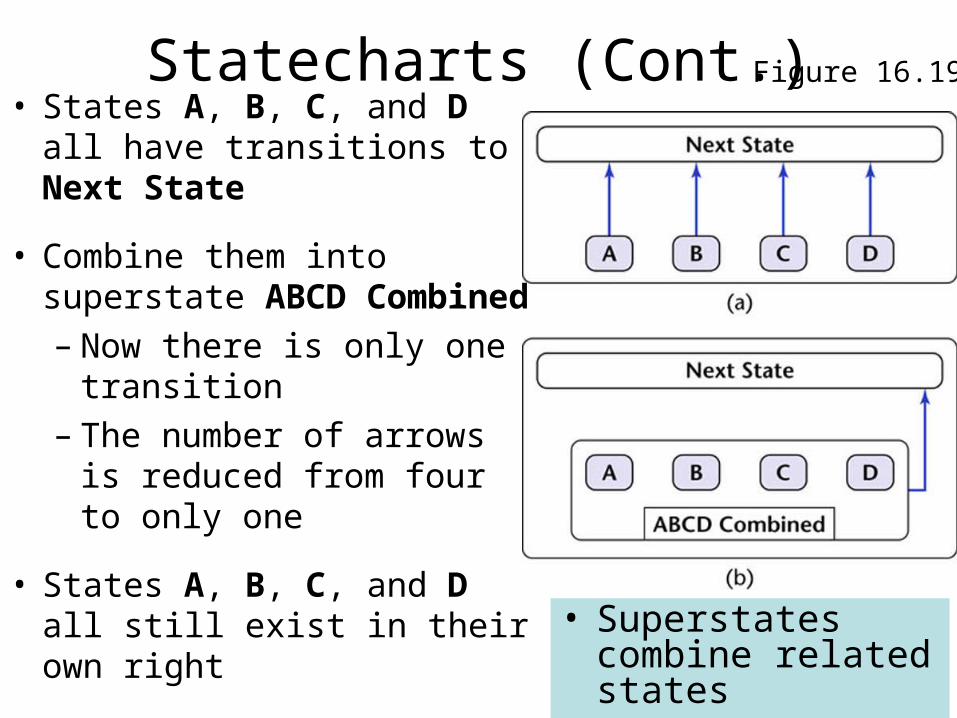
• Superstates combine related states
• States A, B, C, and D all have transitions to Next State
• Combine them into superstate ABCD Combined– Now there is only one
transition– The number of arrows is
reduced from four to only one
• States A, B, C, and D all still exist in their own right
Figure 16.19
42
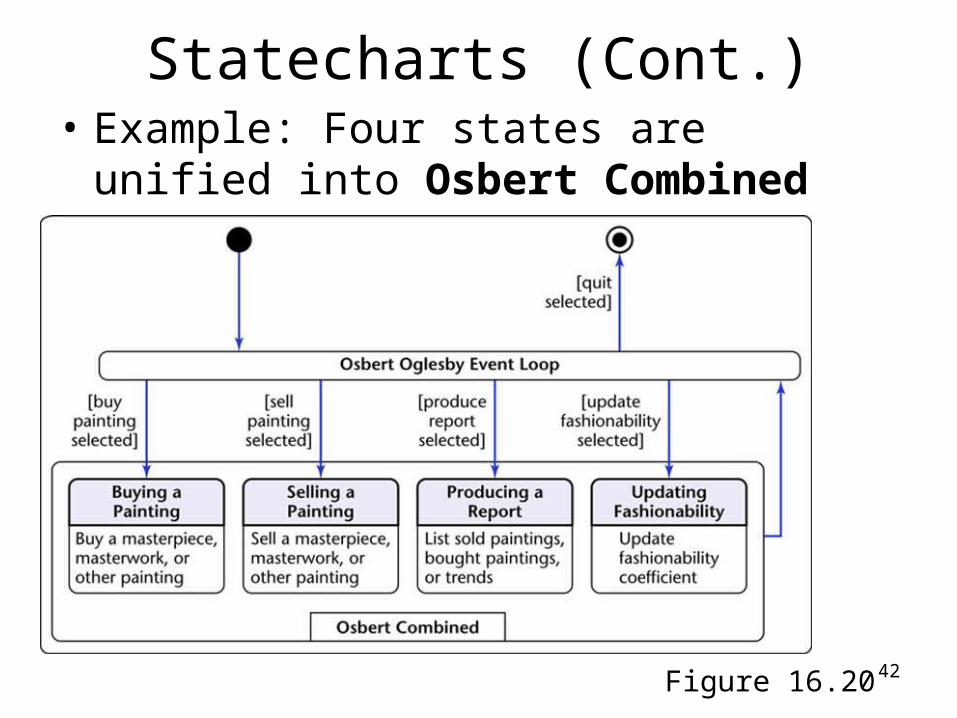
• Example: Four states are unified into Osbert Combined
Statecharts (Cont.)
Figure 16.20
43
Activity Diagrams
• Activity diagrams show how various events are coordinated– Used when activities are carried on in parallel
• Example: – One diner orders chicken, the other fish– The waiter writes down their order, and hands
it to the chef– The meal is served only when both dishes
have been prepared
44
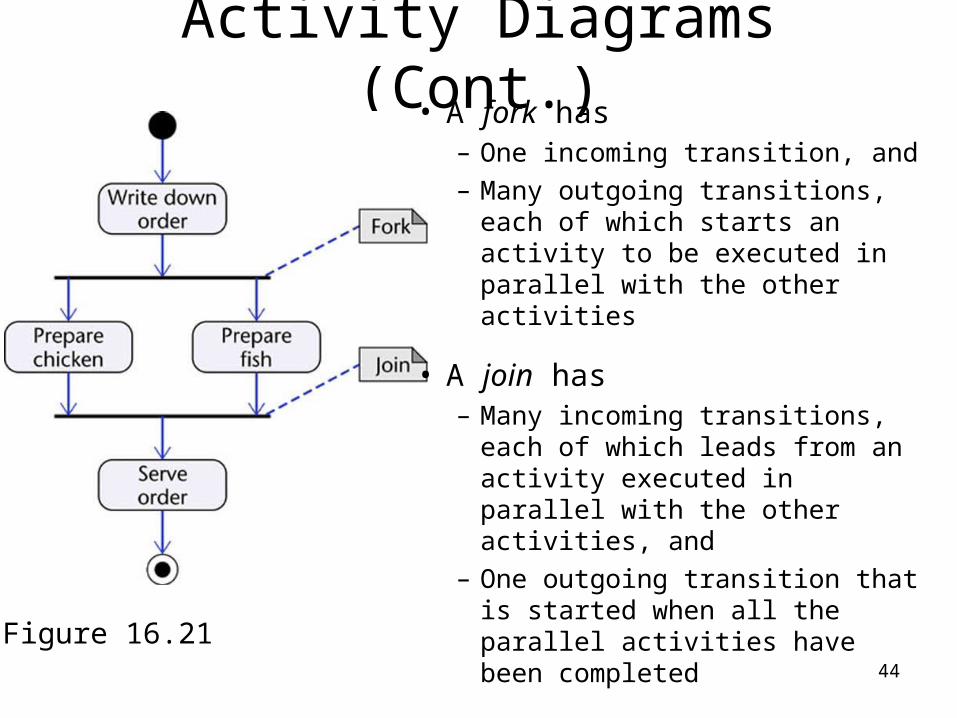
Activity Diagrams (Cont.)
Figure 16.21
• A fork has
– One incoming transition, and – Many outgoing transitions,
each of which starts an activity to be executed in parallel with the other activities
• A join has– Many incoming transitions,
each of which leads from an activity executed in parallel with the other activities, and
– One outgoing transition that is started when all the parallel activities have been completed
45
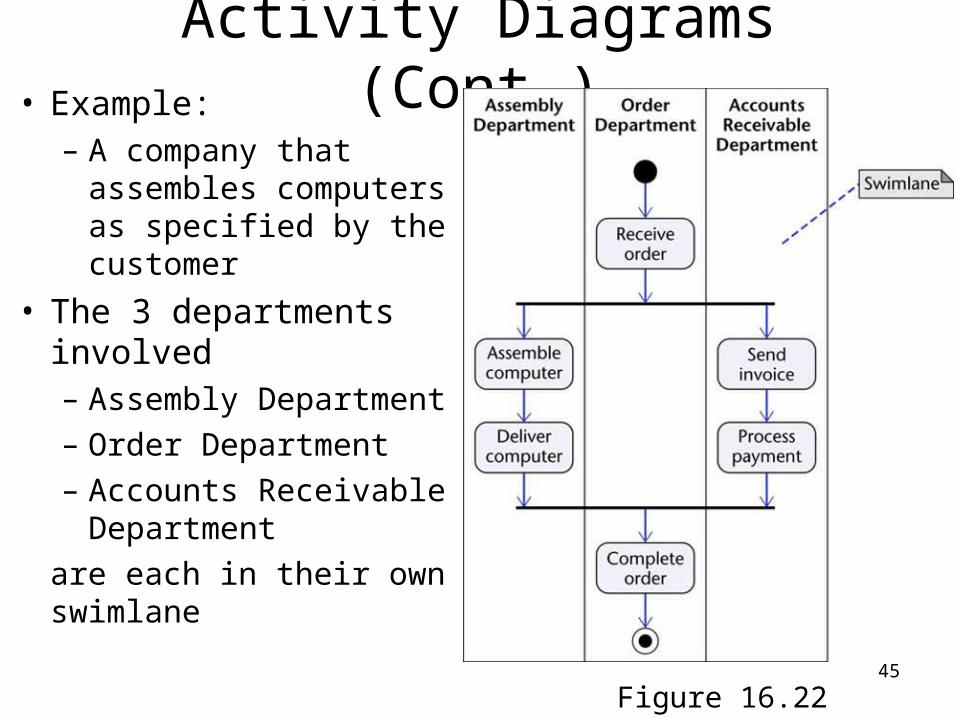
Activity Diagrams (Cont.)• Example:
– A company that assembles computers as specified by the customer
• The 3 departments involved– Assembly Department
– Order Department
– Accounts Receivable Department
are each in their own swimlane
Figure 16.22
46
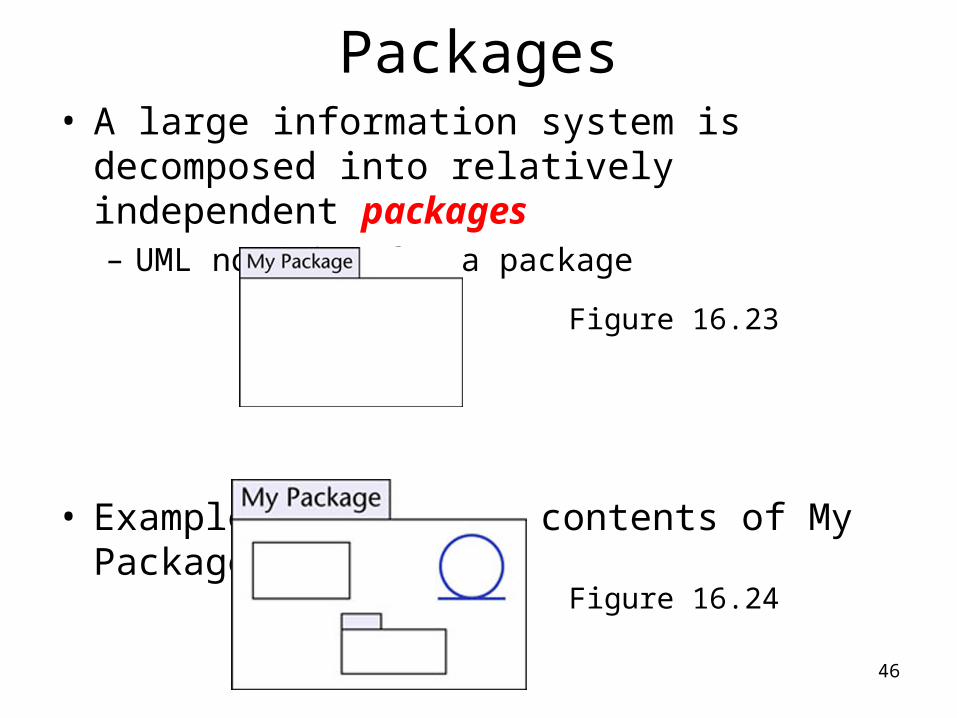
Packages• A large information system is decomposed into
relatively independent packages– UML notation for a package
• Example showing the contents of My Package
Figure 16.23
Figure 16.24
47
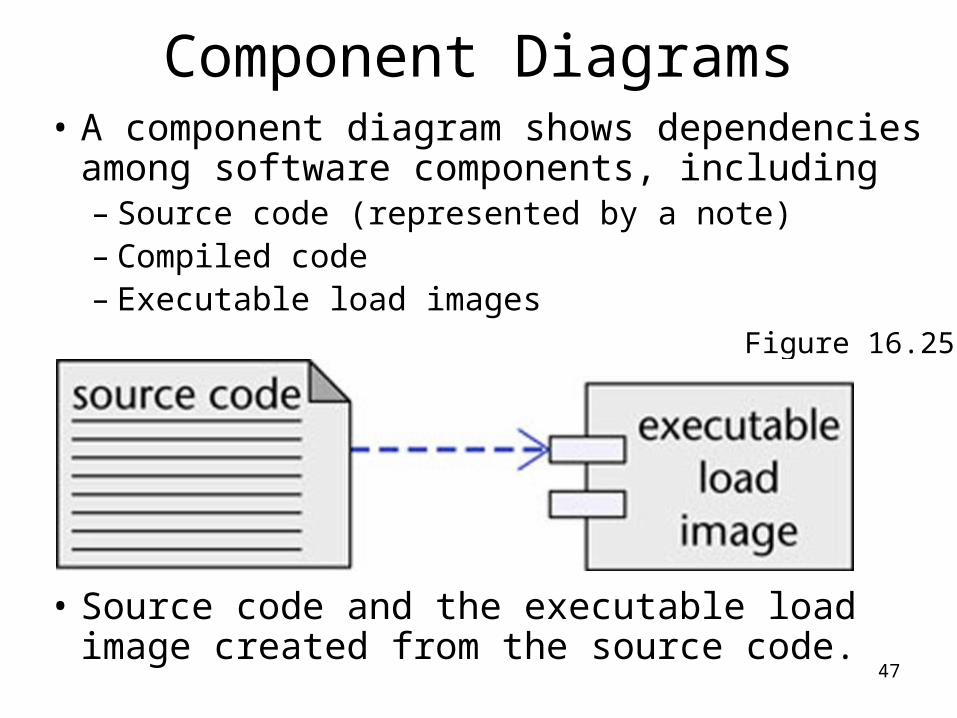
Component Diagrams• A component diagram shows dependencies
among software components, including – Source code (represented by a note)– Compiled code– Executable load images
• Source code and the executable load image created from the source code.
Figure 16.25
48
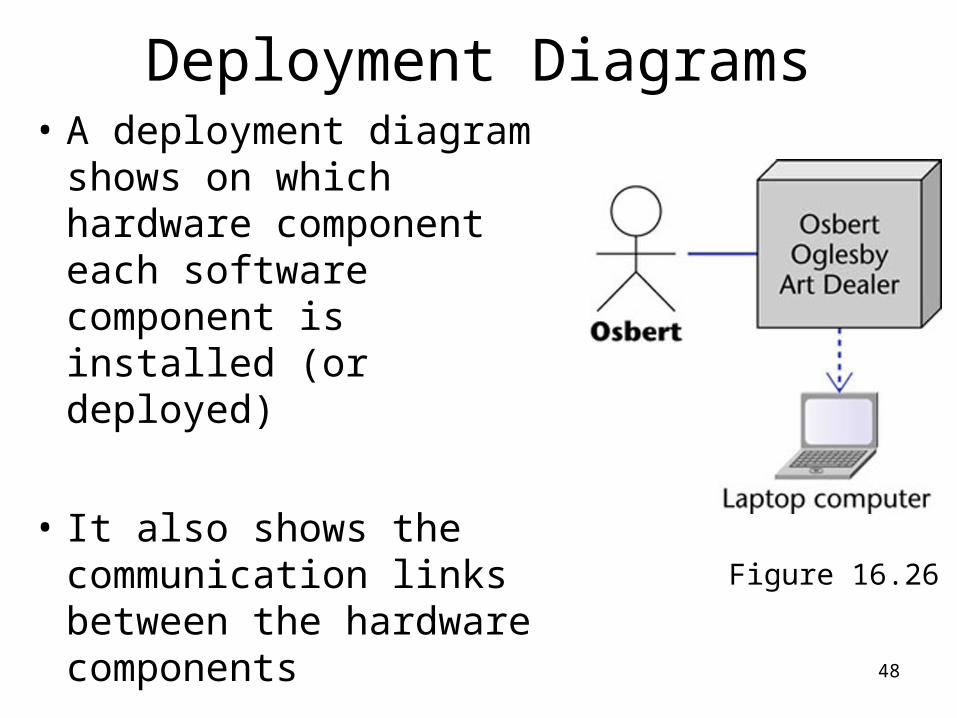
Deployment Diagrams• A deployment diagram
shows on which hardware component each software component is installed (or deployed)
• It also shows the communication links between the hardware components
Figure 16.26
49
Review of UML Diagrams
• Some diagrams that could be confused include:– A use case models the interaction between
actors and the information system
– A use-case diagram is a single diagram that incorporates a number of use cases
– A class diagram is a model of the classes showing the static relationships between them• Including association and generalization
50
Review of UML Diagrams (Cont.)• A statechart shows
– States (specific values of attributes of objects),– Events that cause transitions between states
(subject to guards), and – Actions taken by objects
• An interaction diagram (sequence diagram or collaboration diagram) shows how objects interact as messages are passed between them
• An activity diagram shows how events that occur at the same time are coordinated
51
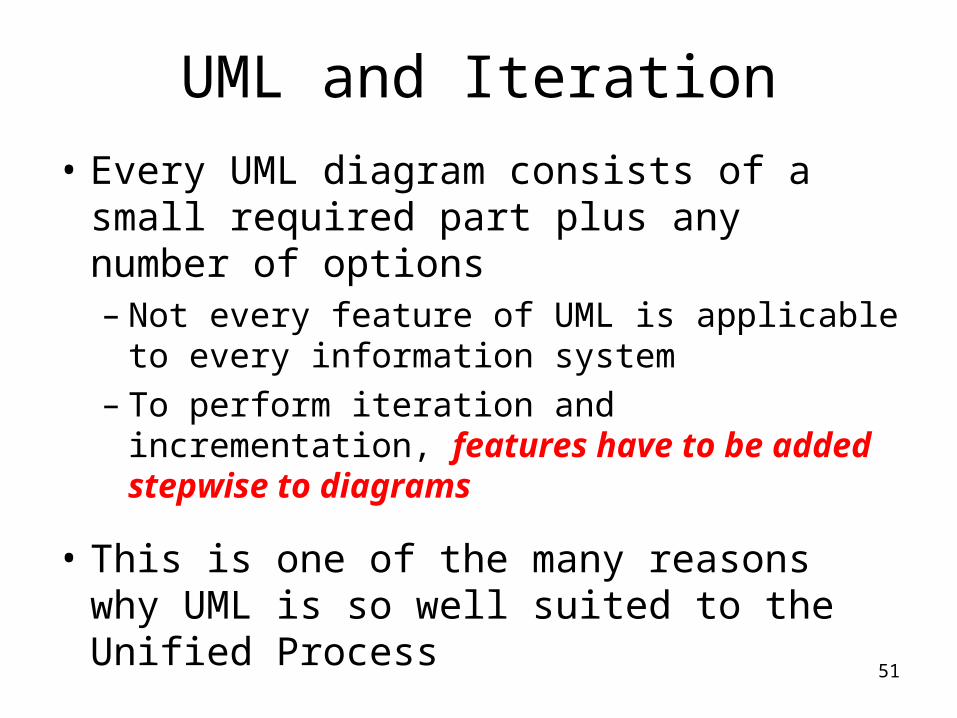
UML and Iteration
• Every UML diagram consists of a small required part plus any number of options– Not every feature of UML is applicable to
every information system– To perform iteration and incrementation,
features have to be added stepwise to diagrams
• This is one of the many reasons why UML is so well suited to the Unified Process


![xiaojun wu jnu@163.com arXiv:1912.11343v1 [cs.CV] 24 Dec 2019](https://img.pdfslide.net/doc/110x75/61e2a560b4a05404135e9797/xiaojun-wu-jnu163com-arxiv191211343v1-cscv-24-dec-2019.jpg)