Embed Size (px)
Citation preview
1
Nikolajs Bogdanovs Riga Technical University,
Lomonosova iela 1, LV-1019, Riga, Latvia, phone: +37129727288, e-mail:
Two Layer Model for Performance Evolution of
Vehicular Networks

2
We research interests in utilizing wireless technologies like WiMax and WiFi to provide Internet connectivity to users in moving vehicles. Such systems, termed Drive-thru Internet, operate by placing inter-connected roadside access points (APs) on city roads and trunk roads so as to enable vehicular users to obtain network connectivity by temporarily connecting to an AP as the vehicle passes through the AP’s coverage range. The aim is to develop an effective communication system for the Intelligent Transportation System (ITS). An important feature of Drive-thru Internet systems, shown in Fig.
Vehicular Network
3
The description of the object
We was calculated a goodput of standards IEEE802.11n and IEEE802.16e for open network systems. The physical sphere for the transmission is the wireless network. At the first stage the data is transmitted from the mobile object to the nearest Access Point along the protocol 802.11n. However, the distance from the AP object should not exceed 200 meters. Further from the AP the data is transmitted to the remote base station on the protocol 802.16 (WiMax).
4
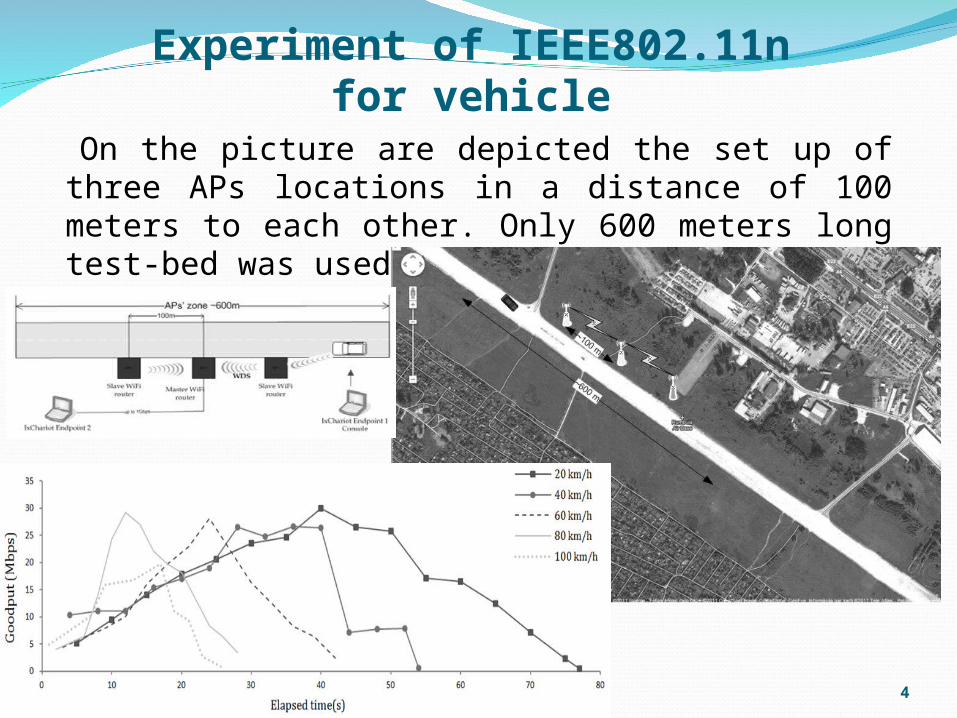
Experiment of IEEE802.11n for vehicleOn the picture are depicted the set up of three APs
locations in a distance of 100 meters to each other. Only 600 meters long test-bed was used to make the experiment.

5
Closed Cyclic estimation model for vehicular number
Following the obtained practical results we will calculate the base station performance at variable client count. In our case the 200 meters long base station operational zone of is divided to 5 zones, 40 meters each, the third zone being the most adjacent to the base station.
200 meter segment consisting of 5 zones, 40 meters each,
6
Closed Cyclic estimation model for vehicular number
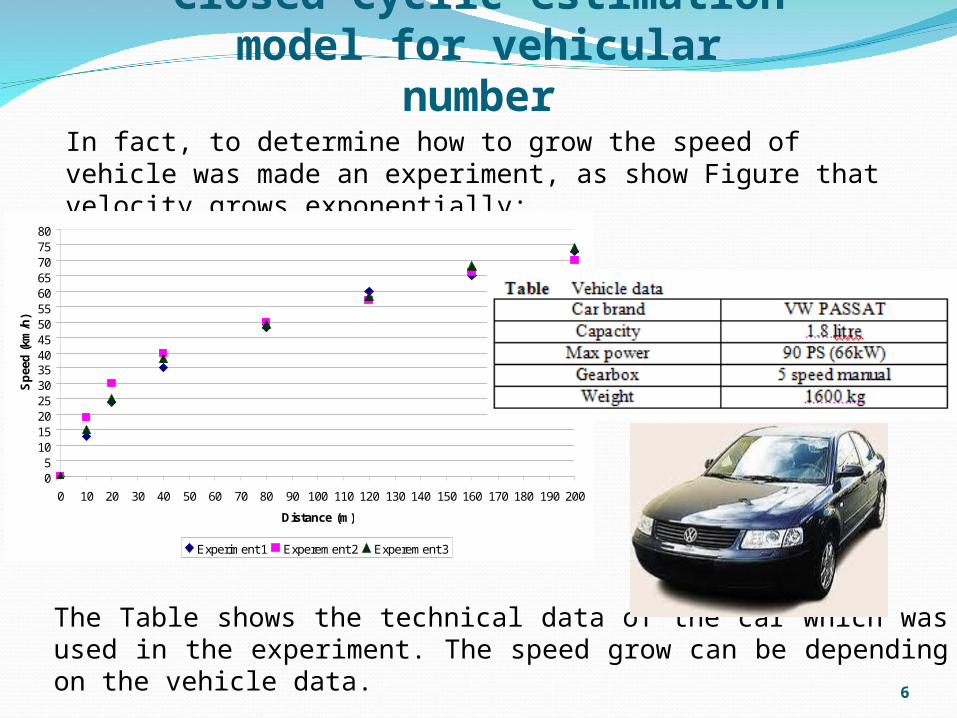
In fact, to determine how to grow the speed of vehicle was made an experiment, as show Figure that velocity grows exponentially:
05
101520253035404550556065707580
0 10 20 30 40 50 60 70 80 90 100 110 120 130 140 150 160 170 180 190 200
Distance (m)
Sp
eed
(km
/h)
Experiment 1 Experement 2 Experement 3
The Table shows the technical data of the car which was used in the experiment. The speed grow can be depending on the vehicle data.

7
Closed Cyclic estimation model for vehicular number
Closed network consisting of M independent nodes with N incoming queries. Distribution is exponential with the parameter .i
iSi
If the interval length equals , and vehicle movement
then the intensity of vehicle service
i
ii S
speed equals ,
by road interval equals:
8
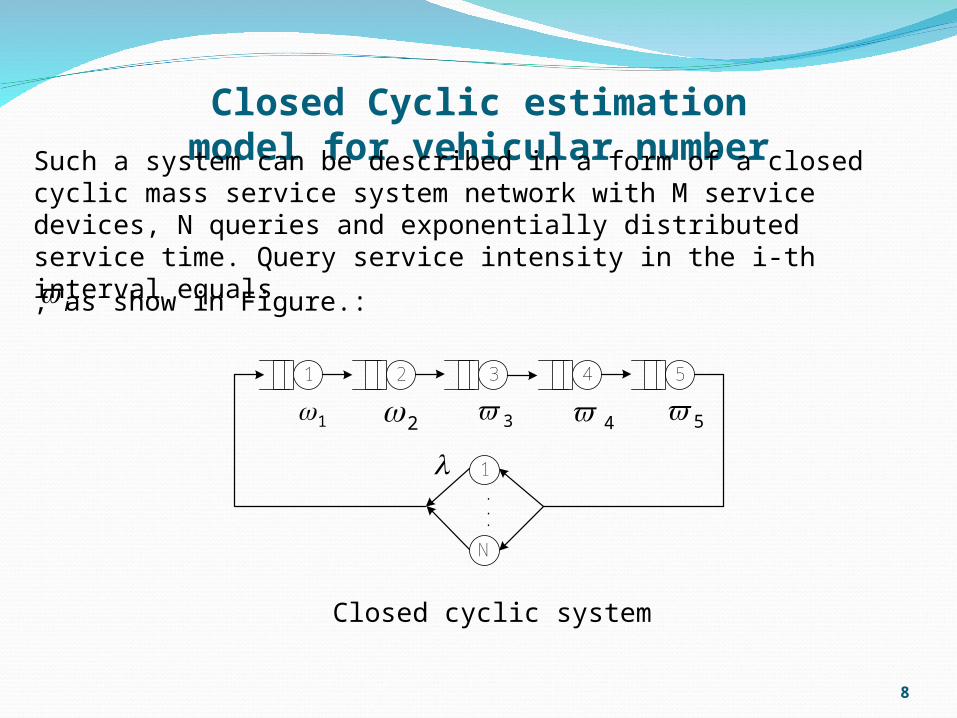
Closed Cyclic estimation model for vehicular number
Such a system can be described in a form of a closed cyclic mass service system network with M service devices, N queries and exponentially distributed service time. Query service intensity in the i-th interval equals
i , as show in Figure.:
1 54321 2 3 4 5
1
N
..
.
Closed cyclic system
9
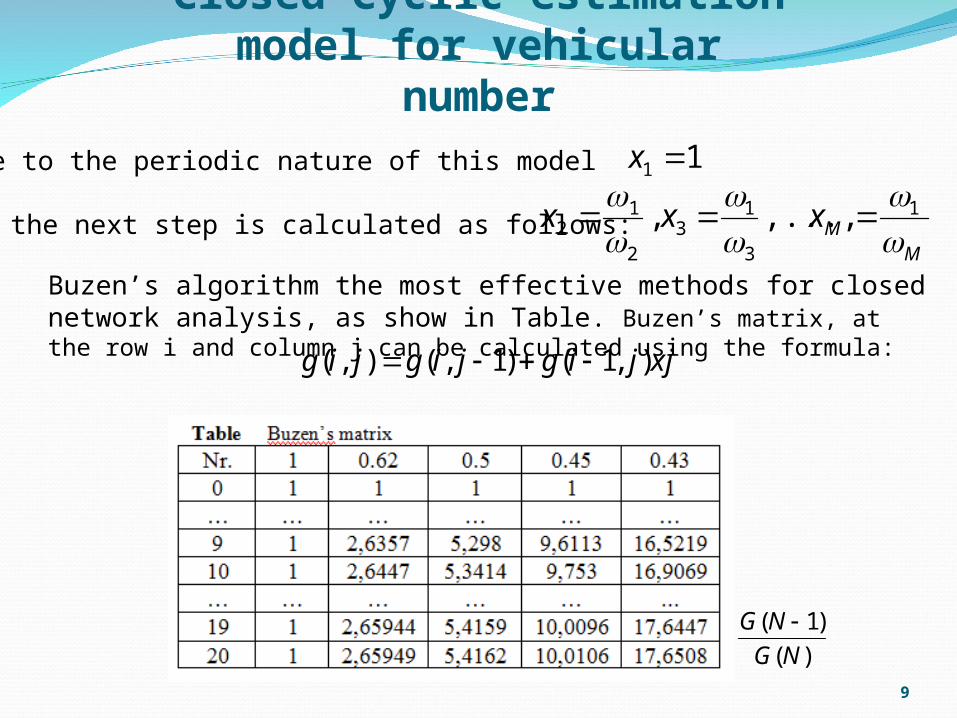
Due to the periodic nature of this model 11 x
and the next step is calculated as follows:M
Mxxx
1
3
13
2
12 ,...,,
Buzen’s algorithm the most effective methods for closed network analysis, as show in Table. Buzen’s matrix, at the row i and column j can be calculated using the formula: xjjigjigjig ),1()1,(),(
)(
)1(
NG
NG
Closed Cyclic estimation model for vehicular number
10
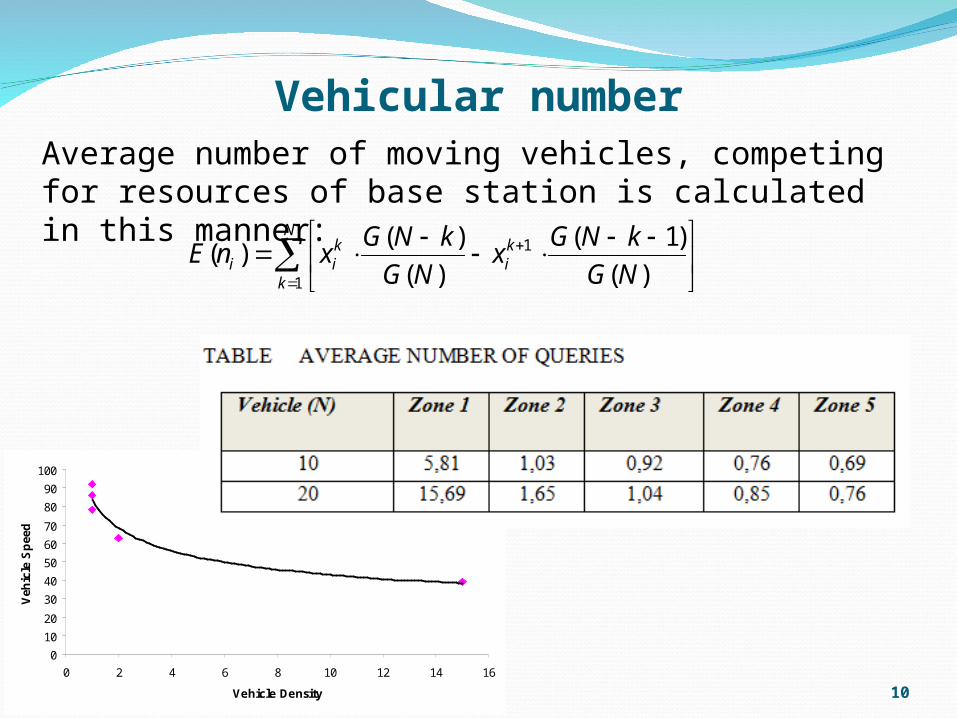
Average number of moving vehicles, competing for resources of base station is calculated in this manner:
N
k
ki
kii NG
kNGx
NG
kNGxnE
1
1
)(
)1(
)(
)()(
0
10
20
30
40
50
60
70
80
90
100
0 2 4 6 8 10 12 14 16
Vehicle Density
Veh
icle
Sp
eed
Vehicular number

11
Two Layer Model
;101
01 PX
12 aXX 122
1 Pa
The terminal count in each vehicular wireless network is usually high. Bandwidth equation for a two layer network:
12
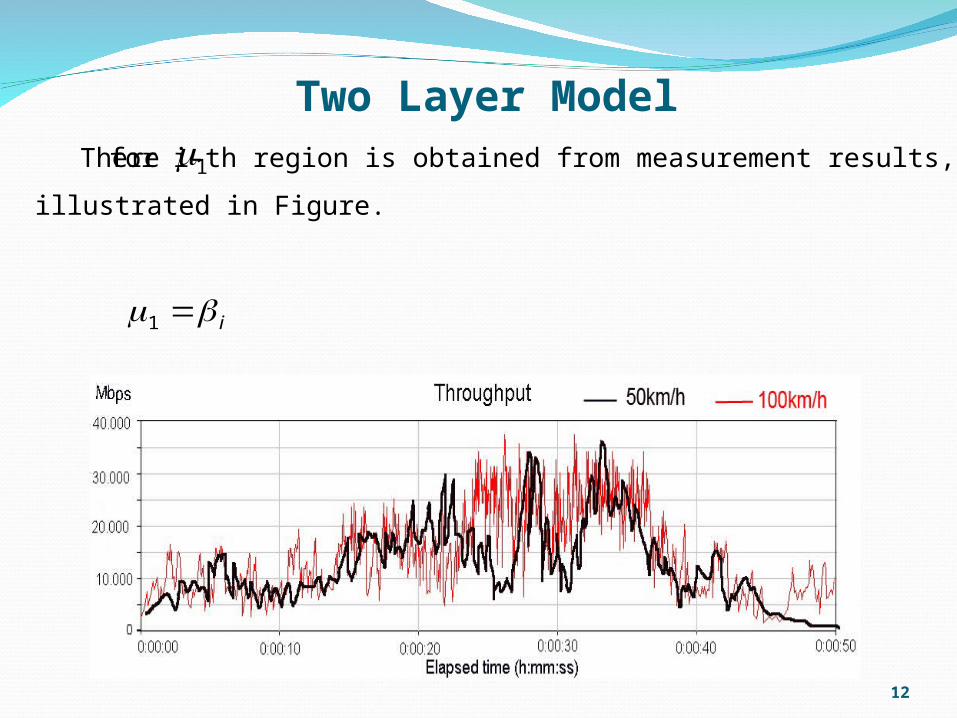
Two Layer ModelThere for i-th region is obtained from measurement results,
illustrated in Figure.
1
i 1
13
Two Layer Model
)( itE
)( 0tE
2
)()()( 01
tEtEtE i
)(
1
10 tE
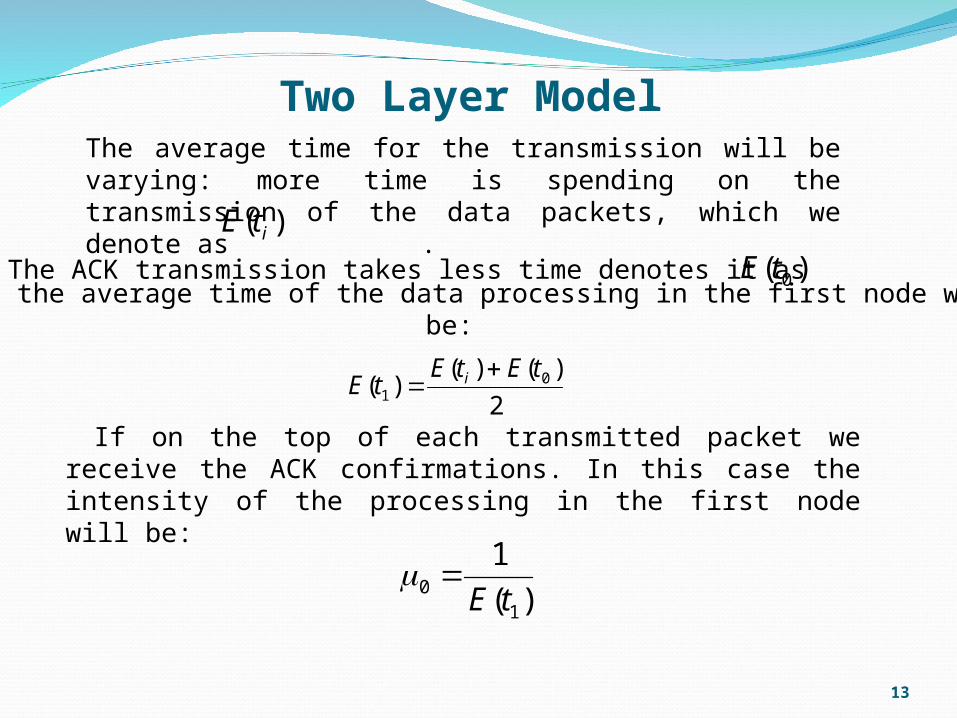
The average time for the transmission will be varying: more time is spending on the transmission of the data packets, which we denote as .
The ACK transmission takes less time denotes it asThen the average time of the data processing in the first node will
be:
If on the top of each transmitted packet we receive the ACK confirmations. In this case the intensity of the processing in the first node will be:
14
Two Layer Model2
t
12
f
p
V
lt
fV
nVbyteslp 1500
2n
f
VV
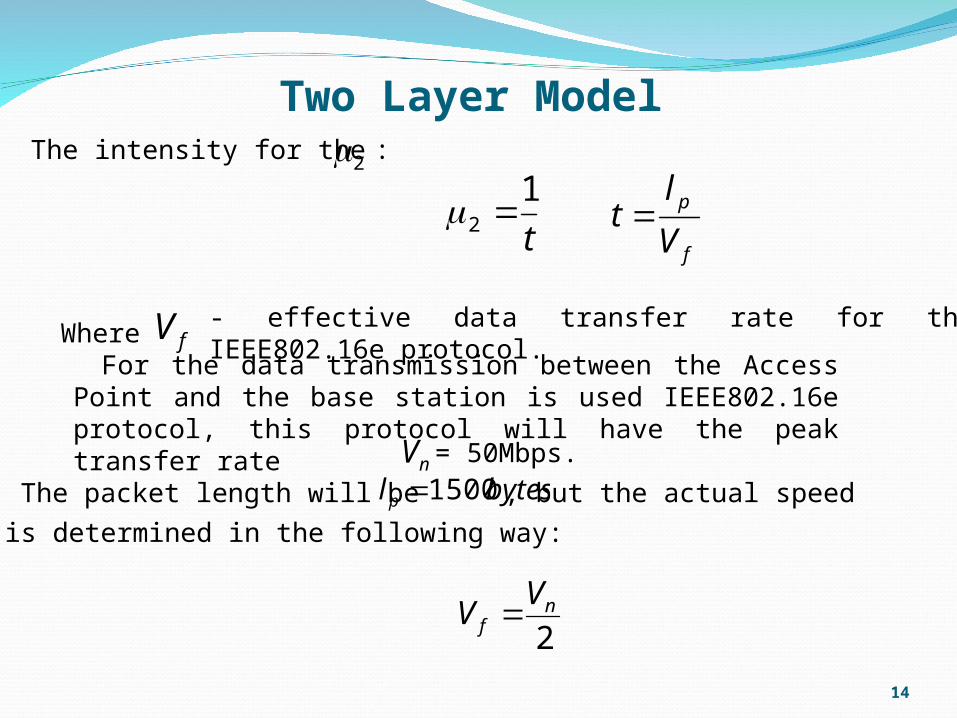
The intensity for the :
Where - effective data transfer rate for the IEEE802.16e protocol.
The packet length will be , but the actual speed
For the data transmission between the Access Point and the base station is used IEEE802.16e protocol, this protocol will have the peak transfer rate = 50Mbps.
is determined in the following way:
15
Two Layer Model
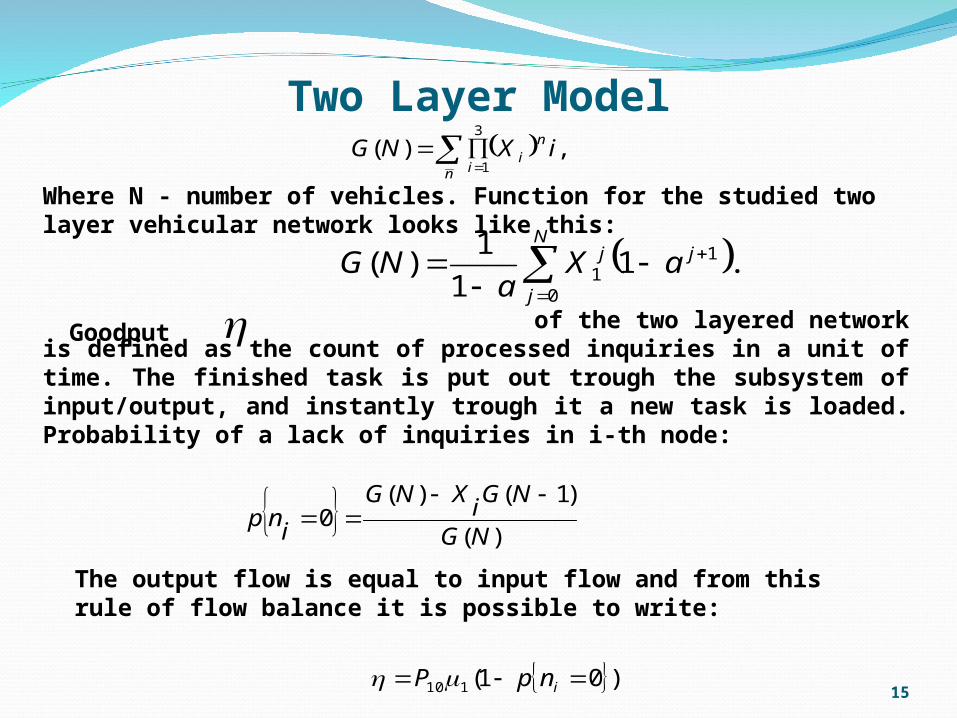
)01(110 inpP
The output flow is equal to input flow and from this rule of flow balance it is possible to write:
)(
)1()(0
NG
NGiXNG
inp
Goodput of the two layered network is defined as the count of processed inquiries in a unit of time. The finished task is put out trough the subsystem of input/output, and instantly trough it a new task is loaded. Probability of a lack of inquiries in i-th node:
Where N - number of vehicles. Function for the studied two layer vehicular network looks like this:
N
j
jj aXa
NG0
11 .1
1
1)(
,)(3
1iXNG n
in i

16
Goodput with the probability P10=0.999 P12=0.001 for N=10 and N=20 will be:
Two Layer Model
17
EXPERIMENTAL ESTIMATION OF VEHICULAR NETWORK
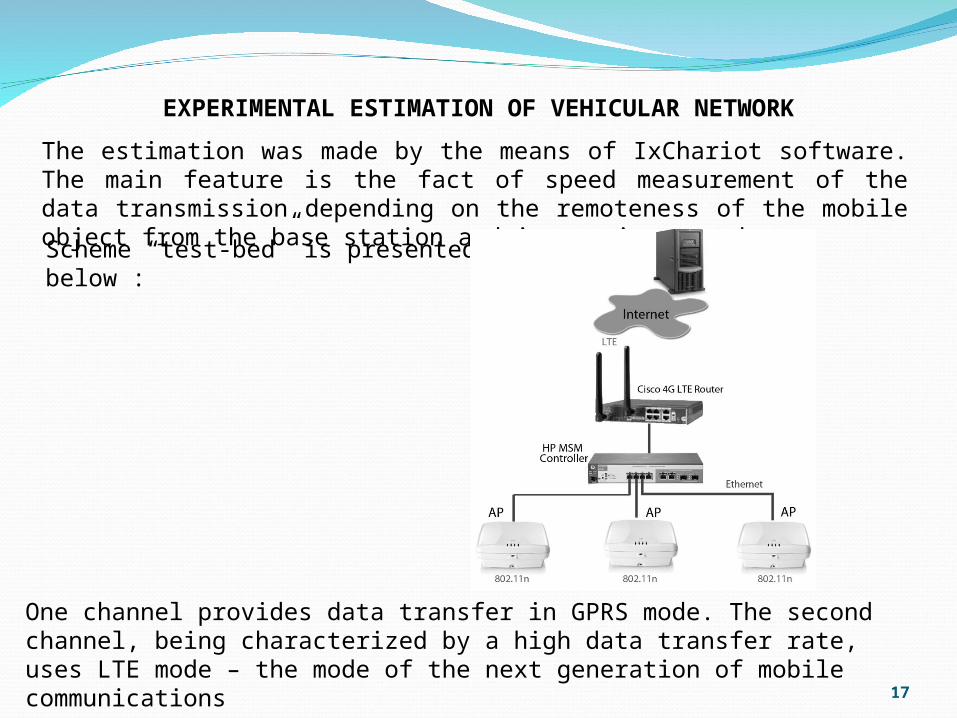
The estimation was made by the means of IxChariot software. The main feature is the fact of speed measurement of the data transmission depending on the remoteness of the mobile object from the base station and its moving speed.
One channel provides data transfer in GPRS mode. The second channel, being characterized by a high data transfer rate, uses LTE mode – the mode of the next generation of mobile communications
Scheme “test-bed” is presented below :

18
Conclusions
In this research experimental data is presented, about data transfer rate in wireless networks of IEEE 802.11n standard connecting moving objects. Based on the experimental data mathematical patterns were developed binding characteristics of vehicular flow with characteristics of data transfer system. Experimental data is presented in this research, concerning data transfer rate in IEEE 802.11n standard wireless network of moving objects. Based on experimental data two mathematical models were developed, binding the characteristics of vehicular flow and characteristics of data transfer system.
In the presented research, a model for real data transfer rate estimation depending from number N of moving objects located in the wireless network base stations operational zone was developed. Based on this research, the real data transfer rate depends from the number and distances from base station of objects interacting with base station.
19