Embed Size (px)
Citation preview
21
SUMMARY FINDINGS
1. OVERVIEW OF DOMESTIC TOURISM
Domestic tourism in Malaysia is influenced by seasonal (e.g. public holidays and school
holidays) and the organisation of large-scale events. On an average, 46.8 per cent of
Malaysian residents aged 15 years and above made domestic tourism trips in 2010.
Chart 1: Number of domestic visitors and trips by month, 2010
Chart 1 showed the fluctuations in the number of domestic visitors during the year 2010.
The highest number of domestic visitors recorded was in September 2010 with
12.5 million visitors and 14.7 million trips. This is in conjunction with Hari Raya
celebrations, which is a tradition for Malaysians to “Balik Kampung”. On an average,
Malaysian residents aged 15 years and above made 1.17 trips in the month of
September 2010.
The second highest number of domestic visitors was recorded in February 2010,
10.6 million visitors with trips made of 12.8 million. This coincided with the Chinese New
Year celebrations. In the month of February, on an average, Malaysian residents aged 15
years and above made 1.21 trips.
On the whole, a total of 115.5 million domestic visitors were recorded in 2010 with
137.9 million trips made.
Note : “Balik Kampung” is a tradition for Malaysian citizens to return to their hometown during the holiday celebration (e.g.
school holiday, Eid celebration, Chinese New Year, Christmas) to visit their parents and relatives
22
2. KEY STATISTICS OF DOMESTIC TOURISM
In 2010, domestic visitors (excursionists and tourists) spent a total of RM34.7 billion,
registering a 33.5 per cent increase as against RM26.0 billion spent in 2009. The increase
in the number of domestic trips recorded in 2010 (137.9 million trips as compared with
90.5 million trips in 2009) was a major factor in the increase of the total expenditure.
However, the average expenditure per trip of a domestic visitor declined 12.3 per cent
from RM287 in 2009 to RM252 in 2010 (Table 1).
Table 1: Key statistics of domestic tourism, 2009 and 2010
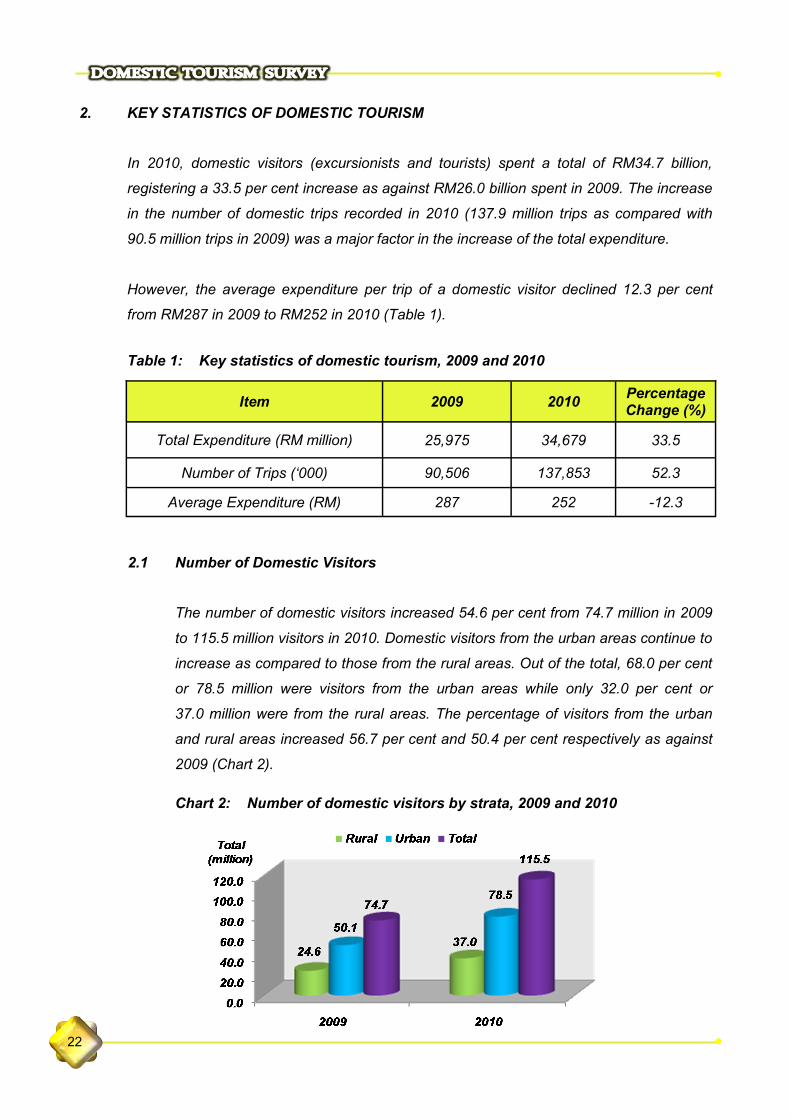
2.1 Number of Domestic Visitors
The number of domestic visitors increased 54.6 per cent from 74.7 million in 2009
to 115.5 million visitors in 2010. Domestic visitors from the urban areas continue to
increase as compared to those from the rural areas. Out of the total, 68.0 per cent
or 78.5 million were visitors from the urban areas while only 32.0 per cent or
37.0 million were from the rural areas. The percentage of visitors from the urban
and rural areas increased 56.7 per cent and 50.4 per cent respectively as against
2009 (Chart 2).
Chart 2: Number of domestic visitors by strata, 2009 and 2010
Item 2009 2010 Percentage Change (%)
Total Expenditure (RM million) 25,975 34,679 33.5
Number of Trips („000) 90,506 137,853 52.3
Average Expenditure (RM) 287 252 -12.3
23
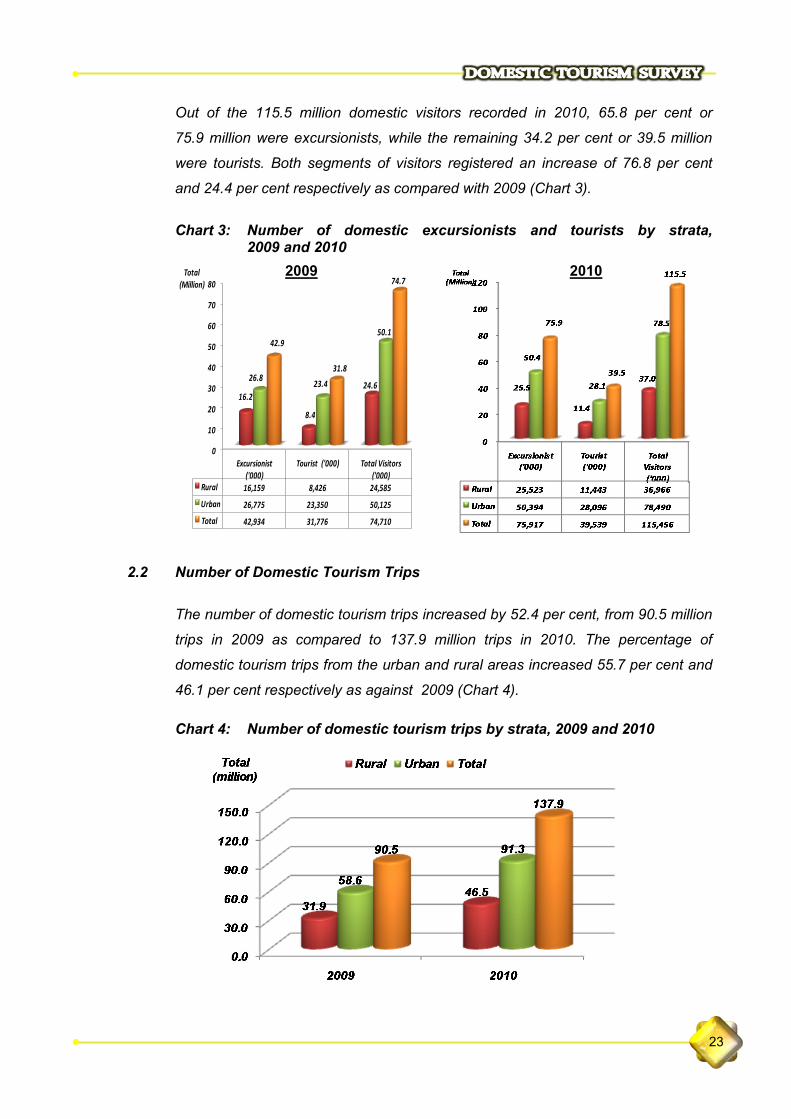
Out of the 115.5 million domestic visitors recorded in 2010, 65.8 per cent or
75.9 million were excursionists, while the remaining 34.2 per cent or 39.5 million
were tourists. Both segments of visitors registered an increase of 76.8 per cent
and 24.4 per cent respectively as compared with 2009 (Chart 3).
Chart 3: Number of domestic excursionists and tourists by strata,
2009 and 2010
2.2 Number of Domestic Tourism Trips
The number of domestic tourism trips increased by 52.4 per cent, from 90.5 million
trips in 2009 as compared to 137.9 million trips in 2010. The percentage of
domestic tourism trips from the urban and rural areas increased 55.7 per cent and
46.1 per cent respectively as against 2009 (Chart 4).
Chart 4: Number of domestic tourism trips by strata, 2009 and 2010
2009
2010
0
10
20
30
40
50
60
70
80
Excursionist ('000)
Tourist ('000) Total Visitors ('000)
Rural 16,159 8,426 24,585
Urban 26,775 23,350 50,125
Total 42,934 31,776 74,710
16.2
8.4
24.626.8
23.4
50.142.9
31.8
74.7Total
(Million)2009
24
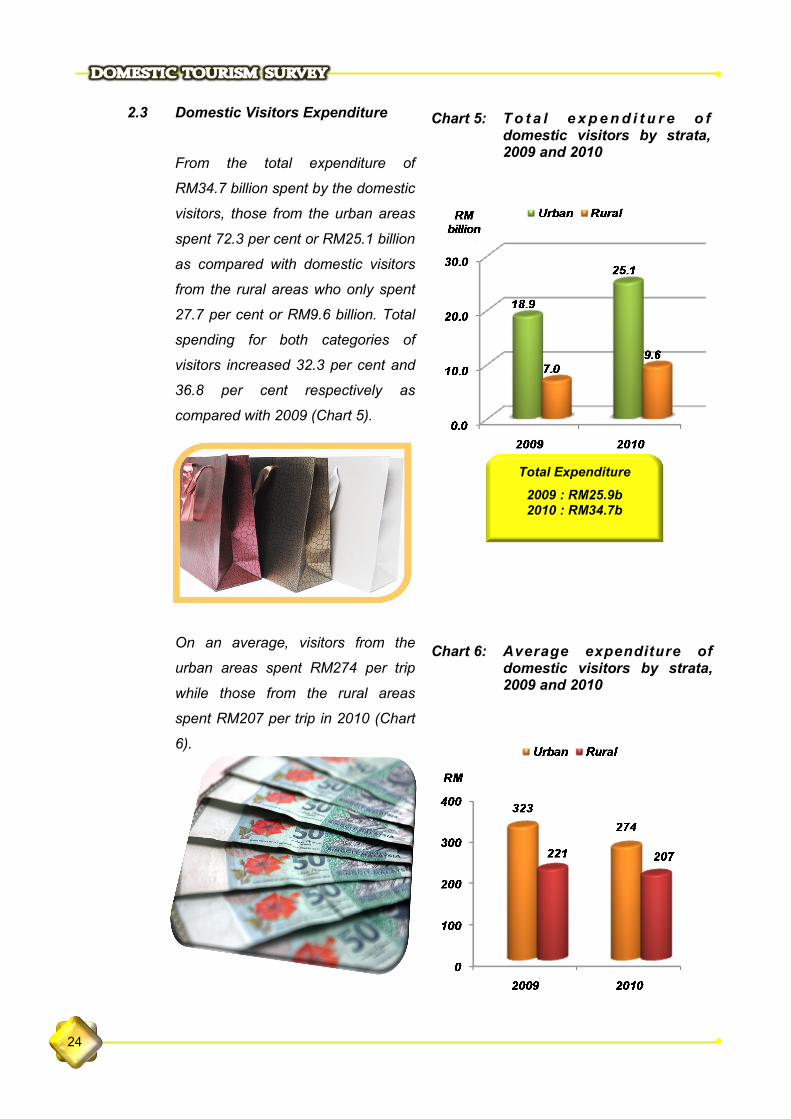
2.3 Domestic Visitors Expenditure
From the total expenditure of
RM34.7 billion spent by the domestic
visitors, those from the urban areas
spent 72.3 per cent or RM25.1 billion
as compared with domestic visitors
from the rural areas who only spent
27.7 per cent or RM9.6 billion. Total
spending for both categories of
visitors increased 32.3 per cent and
36.8 per cent respectively as
compared with 2009 (Chart 5).
On an average, visitors from the
urban areas spent RM274 per trip
while those from the rural areas
spent RM207 per trip in 2010 (Chart
6).
Chart 5: T o t a l e x p e n d i t u r e o f domestic visitors by strata, 2009 and 2010
Chart 6: Average expenditure of domestic visitors by strata, 2009 and 2010
Total Expenditure
2009 : RM25.9b 2010 : RM34.7b
25
Strata
Average Length of Stay
Total Expenditure (RM million)
Average per Diem Expenditure
(RM)
Average Expenditure per Trip (RM)
2009 2010 2009 2010 2009 2010 2009 2010
Urban 2.47 2.58 14,421 17,260 564 557 228 216
Rural 2.17 2.59 4,863 6,424 489 500 226 193
Malaysia 2.39 2.58 19,284 23,684 543 541 227 210
3. AVERAGE LENGTH OF STAY AND TOURIST EXPENDITURE
On the average, a domestic tourist stayed 2.58 days per trip in 2010 with an expenditure
of RM541. The comparative data for 2009 were 2.39 days per trip and expenditure of
RM543. The duration of stay registered in 2010 showed an increase when compared with
2009. On the other hand, the average expenditure per trip decreased marginally from
RM543 in 2009 to RM541 in 2010. The average per diem expenditure also dropped
7.8 per cent from RM227 in 2009 to RM210 in 2010 (Table 2). This is due to the increased
cost of travelling such as fuel and food & beverages.
Table 2: Average length of stay and average expenditure per trip by strata,
2009 and 2010
26
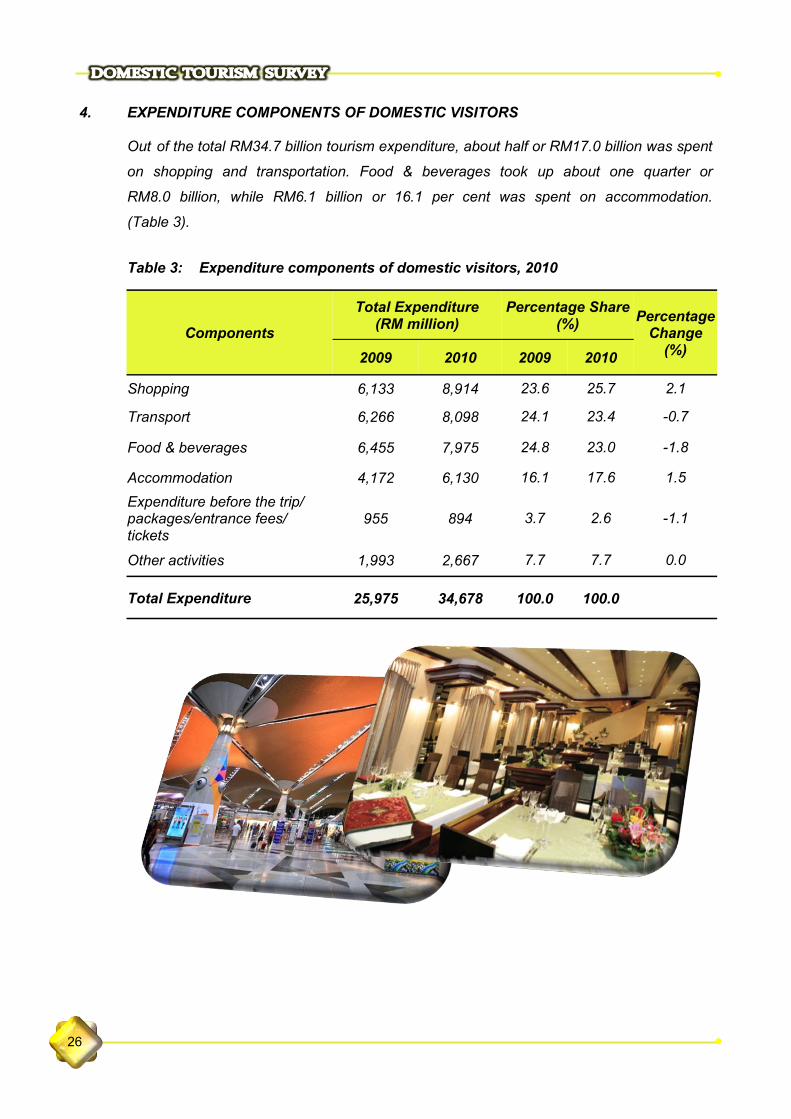
4. EXPENDITURE COMPONENTS OF DOMESTIC VISITORS Out of the total RM34.7 billion tourism expenditure, about half or RM17.0 billion was spent
on shopping and transportation. Food & beverages took up about one quarter or
RM8.0 billion, while RM6.1 billion or 16.1 per cent was spent on accommodation.
(Table 3).
Table 3: Expenditure components of domestic visitors, 2010
Components
Total Expenditure (RM million)
Percentage Share (%)
Percentage Change
(%) 2009 2010 2009 2010
Shopping 6,133 8,914 23.6 25.7 2.1
Transport 6,266 8,098 24.1 23.4 -0.7
Food & beverages 6,455 7,975 24.8 23.0 -1.8
Accommodation 4,172 6,130 16.1 17.6 1.5
Expenditure before the trip/packages/entrance fees/ tickets
955 894 3.7 2.6 -1.1
Other activities 1,993 2,667 7.7 7.7 0.0
Total Expenditure 25,975 34,678 100.0 100.0
27
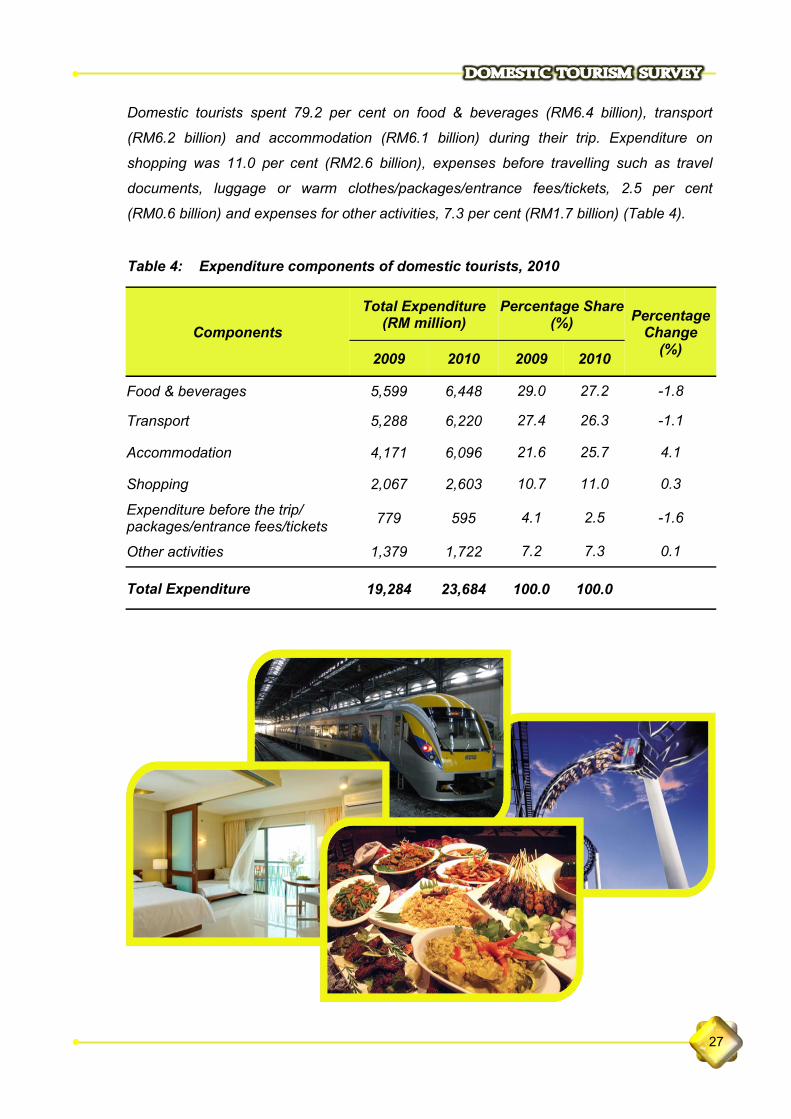
Domestic tourists spent 79.2 per cent on food & beverages (RM6.4 billion), transport
(RM6.2 billion) and accommodation (RM6.1 billion) during their trip. Expenditure on
shopping was 11.0 per cent (RM2.6 billion), expenses before travelling such as travel
documents, luggage or warm clothes/packages/entrance fees/tickets, 2.5 per cent
(RM0.6 billion) and expenses for other activities, 7.3 per cent (RM1.7 billion) (Table 4).
Table 4: Expenditure components of domestic tourists, 2010
Components
Total Expenditure (RM million)
Percentage Share (%)
Percentage Change
(%) 2009 2010 2009 2010
Food & beverages 5,599 6,448 29.0 27.2 -1.8
Transport 5,288 6,220 27.4 26.3 -1.1
Accommodation 4,171 6,096 21.6 25.7 4.1
Shopping 2,067 2,603 10.7 11.0 0.3
Expenditure before the trip/packages/entrance fees/tickets
779 595 4.1 2.5 -1.6
Other activities 1,379 1,722 7.2 7.3 0.1
Total Expenditure 19,284 23,684 100.0 100.0
28
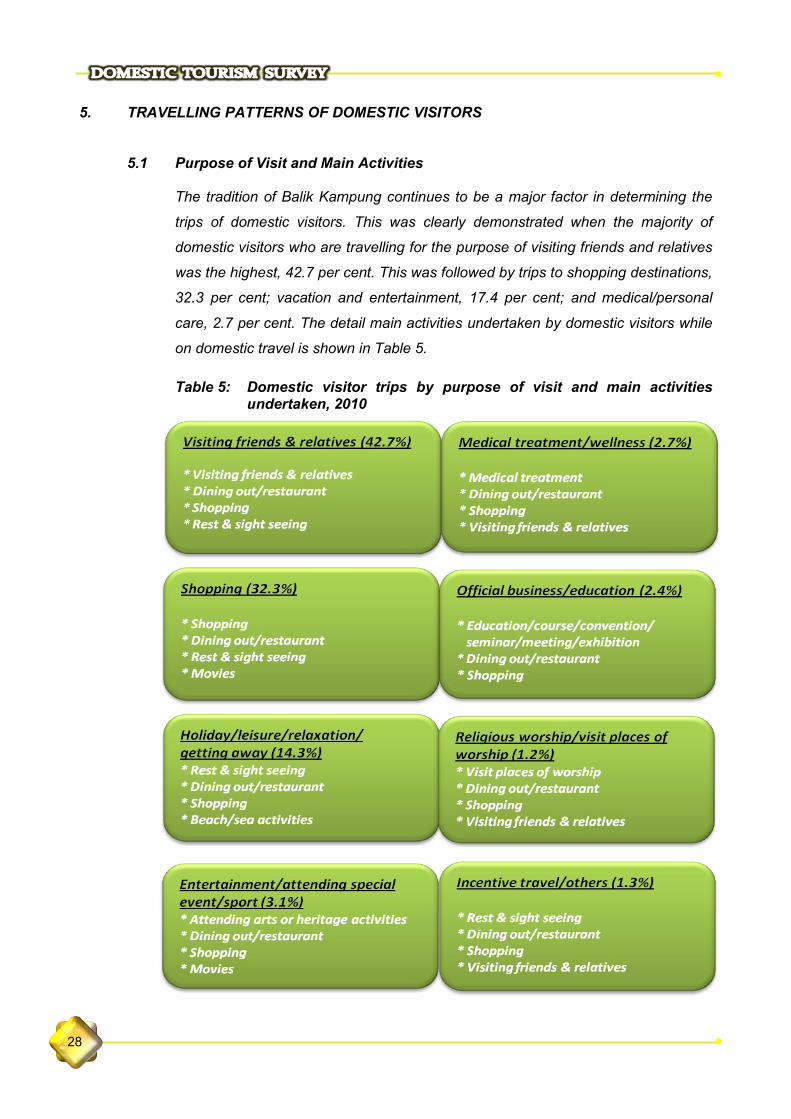
5. TRAVELLING PATTERNS OF DOMESTIC VISITORS 5.1 Purpose of Visit and Main Activities
The tradition of Balik Kampung continues to be a major factor in determining the
trips of domestic visitors. This was clearly demonstrated when the majority of
domestic visitors who are travelling for the purpose of visiting friends and relatives
was the highest, 42.7 per cent. This was followed by trips to shopping destinations,
32.3 per cent; vacation and entertainment, 17.4 per cent; and medical/personal
care, 2.7 per cent. The detail main activities undertaken by domestic visitors while
on domestic travel is shown in Table 5.
Table 5: Domestic visitor trips by purpose of visit and main activities undertaken, 2010
29
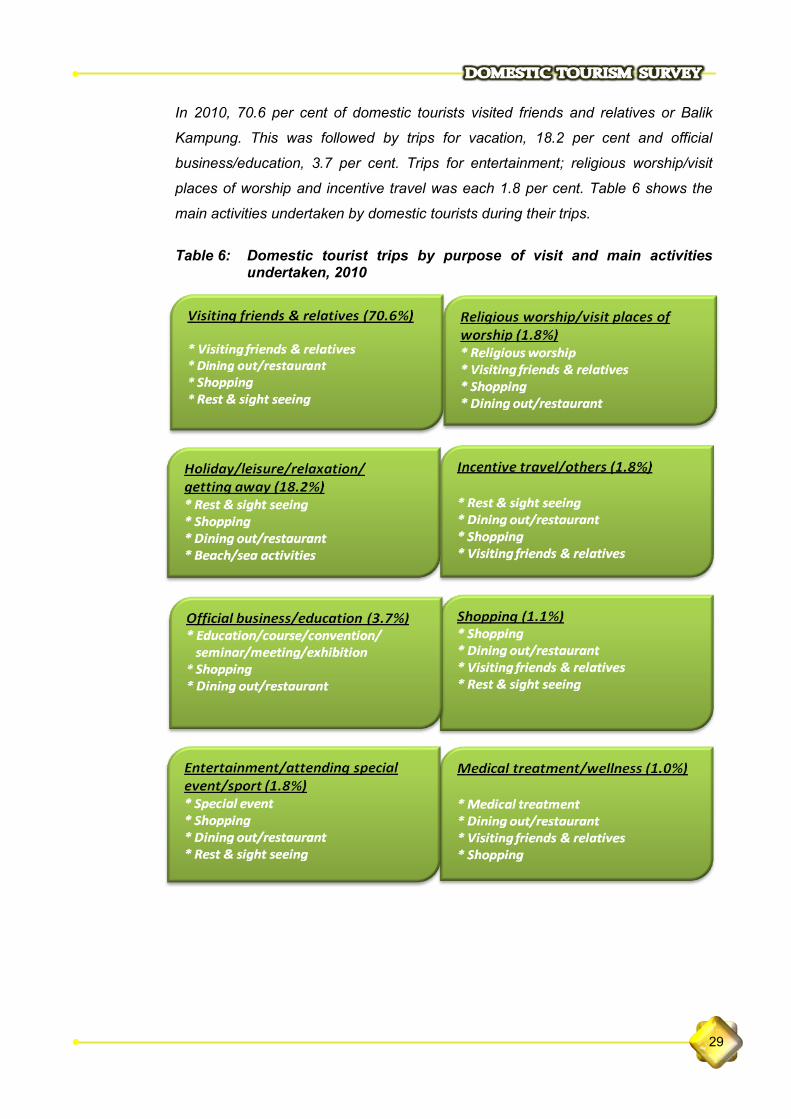
In 2010, 70.6 per cent of domestic tourists visited friends and relatives or Balik
Kampung. This was followed by trips for vacation, 18.2 per cent and official
business/education, 3.7 per cent. Trips for entertainment; religious worship/visit
places of worship and incentive travel was each 1.8 per cent. Table 6 shows the
main activities undertaken by domestic tourists during their trips.
Table 6: Domestic tourist trips by purpose of visit and main activities
undertaken, 2010
30
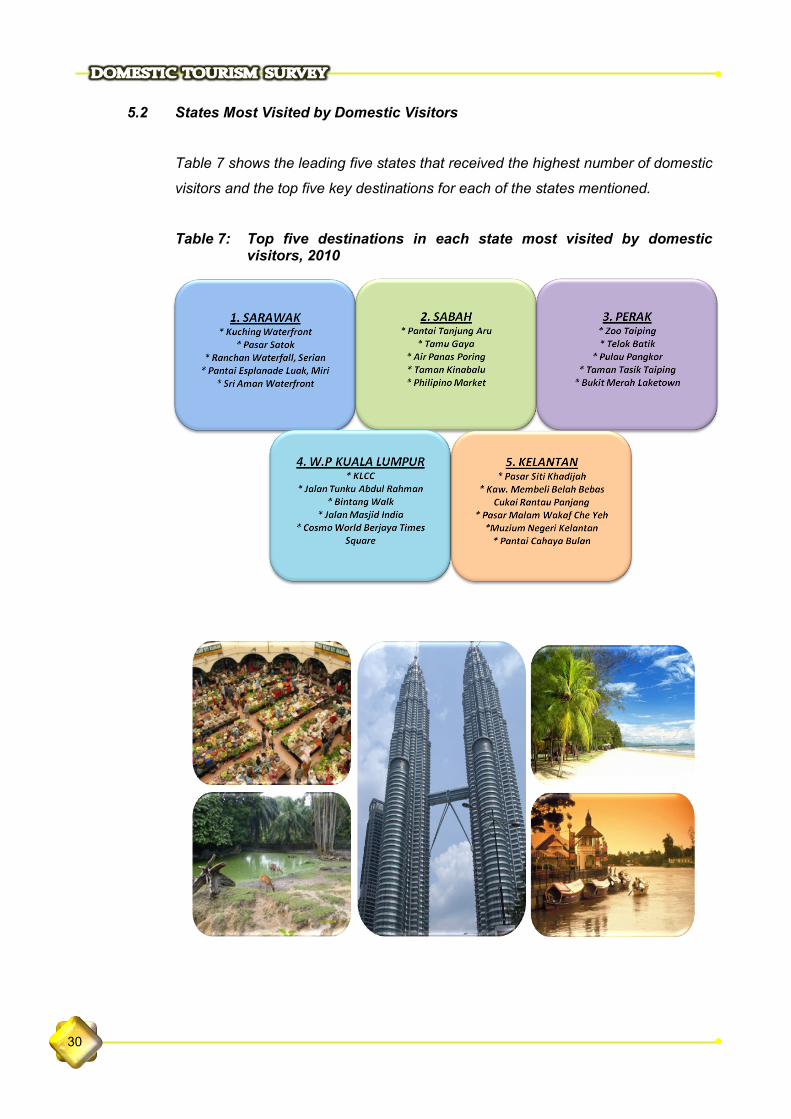
5.2 States Most Visited by Domestic Visitors
Table 7 shows the leading five states that received the highest number of domestic
visitors and the top five key destinations for each of the states mentioned.
Table 7: Top five destinations in each state most visited by domestic visitors, 2010
31
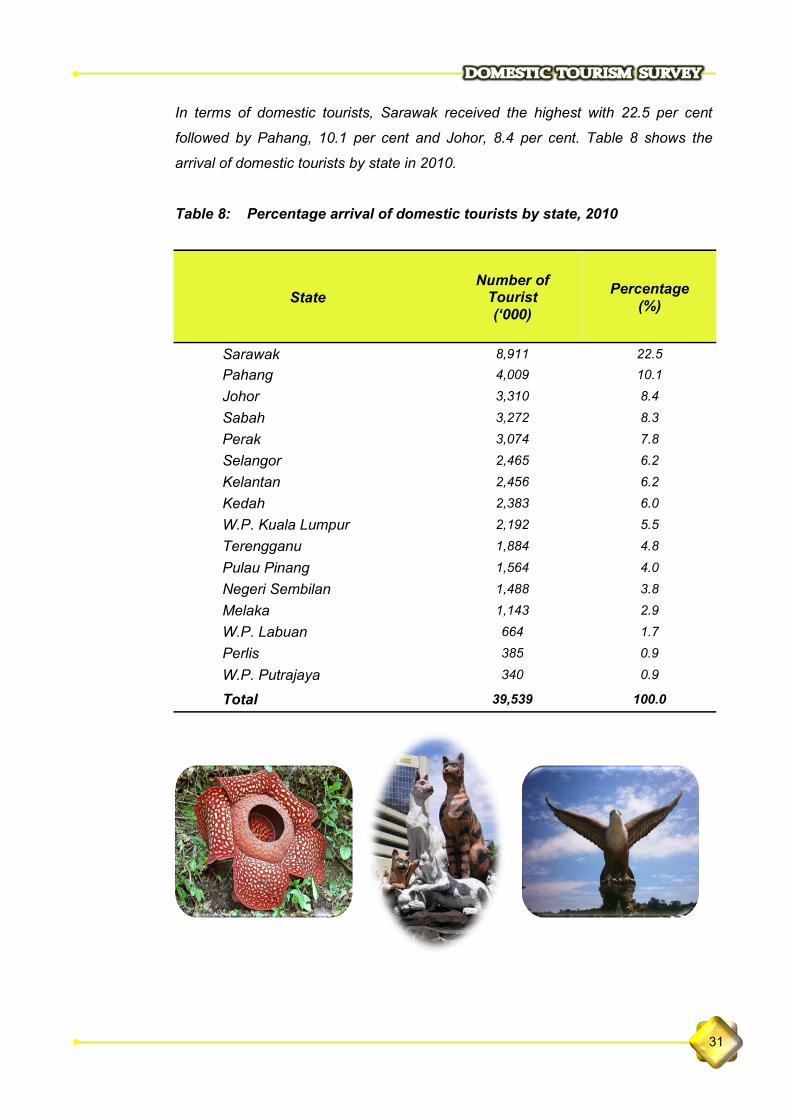
In terms of domestic tourists, Sarawak received the highest with 22.5 per cent
followed by Pahang, 10.1 per cent and Johor, 8.4 per cent. Table 8 shows the
arrival of domestic tourists by state in 2010.
Table 8: Percentage arrival of domestic tourists by state, 2010
State
Number of Tourist
(‘000)
Percentage
(%)
Sarawak 8,911 22.5
Pahang 4,009 10.1
Johor 3,310 8.4
Sabah 3,272 8.3
Perak 3,074 7.8
Selangor 2,465 6.2
Kelantan 2,456 6.2
Kedah 2,383 6.0
W.P. Kuala Lumpur 2,192 5.5
Terengganu 1,884 4.8
Pulau Pinang 1,564 4.0
Negeri Sembilan 1,488 3.8
Melaka 1,143 2.9
W.P. Labuan 664 1.7
Perlis 385 0.9
W.P. Putrajaya 340 0.9
Total 39,539 100.0
32
Air , 1.8%
Water, 2.6%
Bus, 9.0%
Taxi, 4.5%
Train, 1.0%
Private vehicles,
85.5%
Land, 95.6%
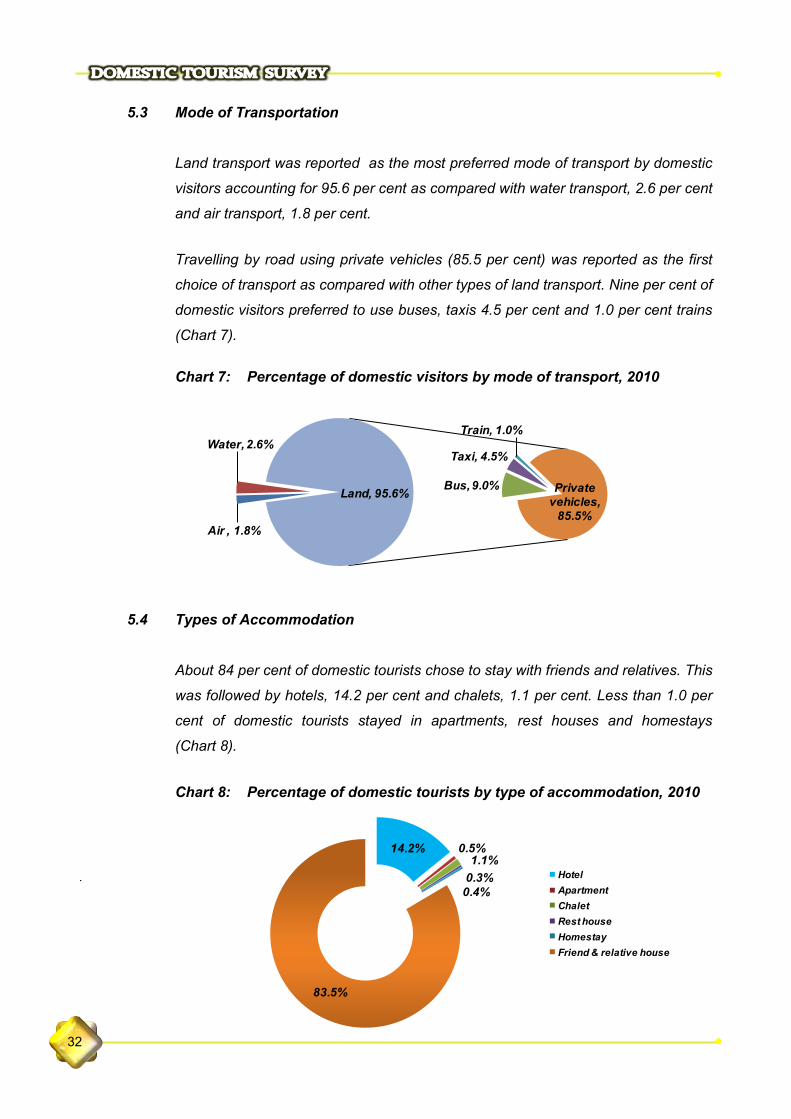
5.3 Mode of Transportation
Land transport was reported as the most preferred mode of transport by domestic
visitors accounting for 95.6 per cent as compared with water transport, 2.6 per cent
and air transport, 1.8 per cent.
Travelling by road using private vehicles (85.5 per cent) was reported as the first
choice of transport as compared with other types of land transport. Nine per cent of
domestic visitors preferred to use buses, taxis 4.5 per cent and 1.0 per cent trains
(Chart 7).
Chart 7: Percentage of domestic visitors by mode of transport, 2010
5.4 Types of Accommodation
About 84 per cent of domestic tourists chose to stay with friends and relatives. This
was followed by hotels, 14.2 per cent and chalets, 1.1 per cent. Less than 1.0 per
cent of domestic tourists stayed in apartments, rest houses and homestays
(Chart 8).
Chart 8: Percentage of domestic tourists by type of accommodation, 2010
.
14.2% 0.5%1.1%
0.3%
0.4%
83.5%
Hotel
Apartment
Chalet
Rest house
Homestay
Friend & relative house
33
> 54
40 - 54
25 - 39
≤ 24
12.8
28.8
37.5
20.9
12.3
29.3
38.0
20.4
Age Group2009
2010
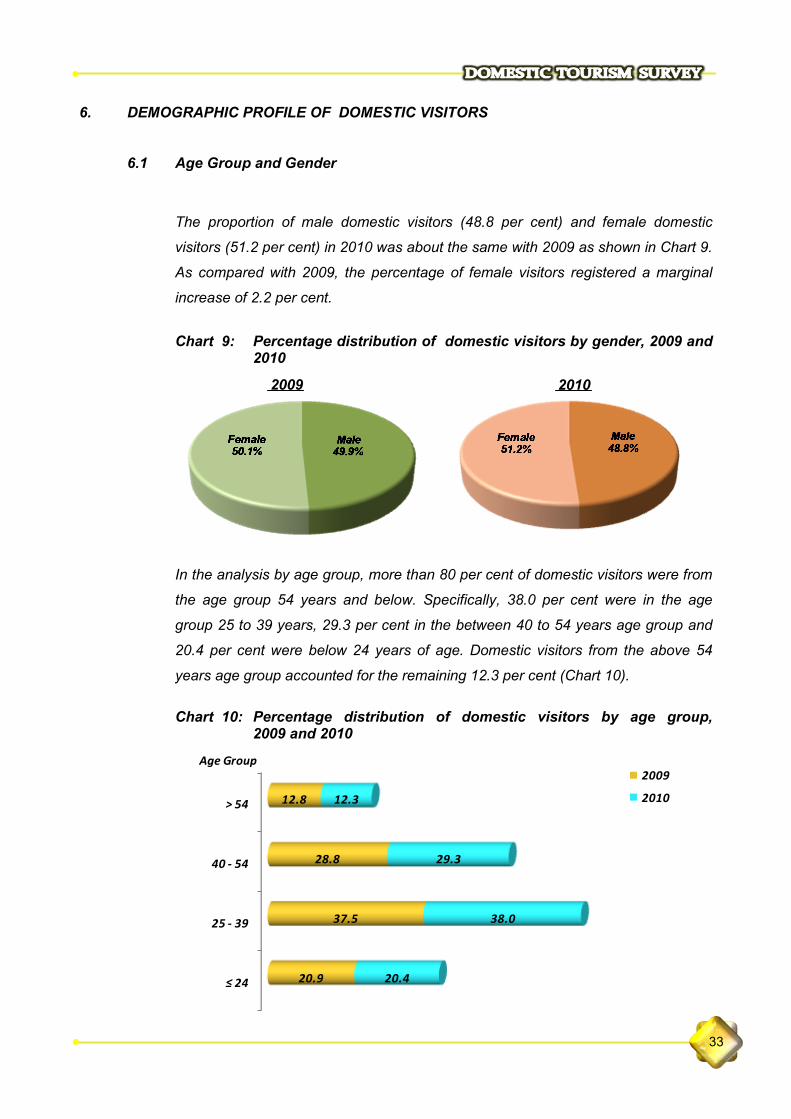
6. DEMOGRAPHIC PROFILE OF DOMESTIC VISITORS 6.1 Age Group and Gender
The proportion of male domestic visitors (48.8 per cent) and female domestic
visitors (51.2 per cent) in 2010 was about the same with 2009 as shown in Chart 9.
As compared with 2009, the percentage of female visitors registered a marginal
increase of 2.2 per cent.
Chart 9: Percentage distribution of domestic visitors by gender, 2009 and 2010
In the analysis by age group, more than 80 per cent of domestic visitors were from
the age group 54 years and below. Specifically, 38.0 per cent were in the age
group 25 to 39 years, 29.3 per cent in the between 40 to 54 years age group and
20.4 per cent were below 24 years of age. Domestic visitors from the above 54
years age group accounted for the remaining 12.3 per cent (Chart 10).
Chart 10: Percentage distribution of domestic visitors by age group, 2009 and 2010
2009 2010
34
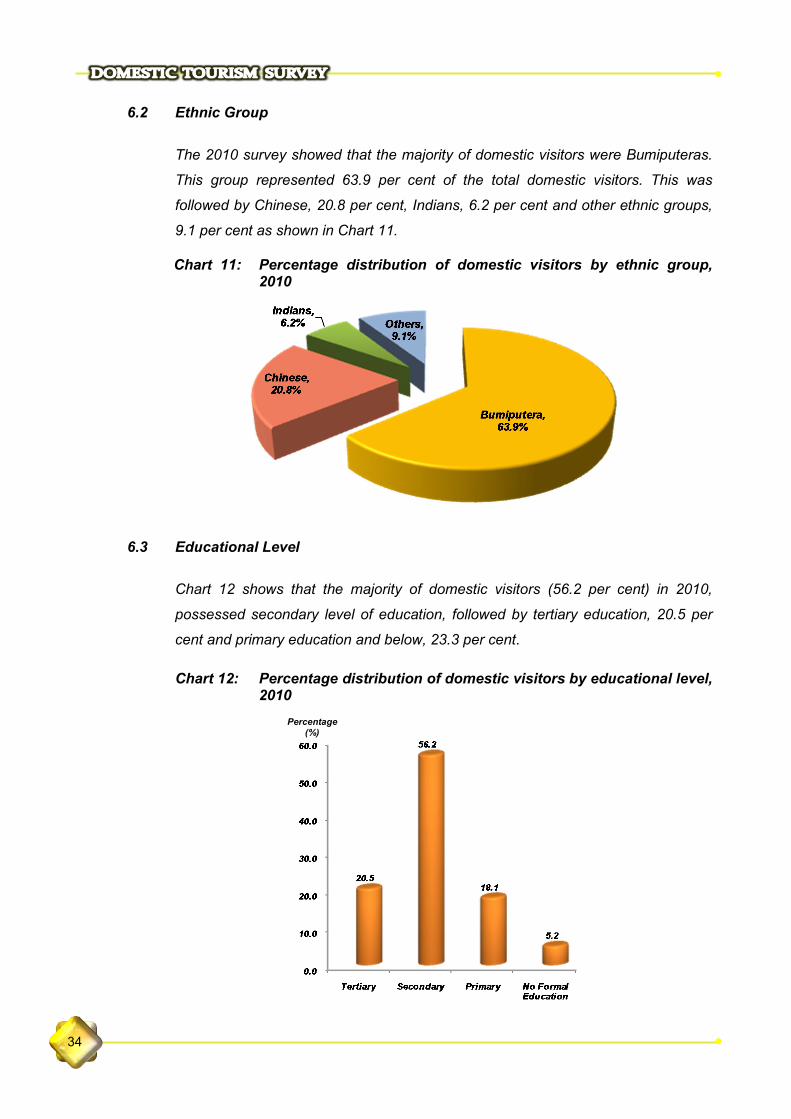
6.2 Ethnic Group
The 2010 survey showed that the majority of domestic visitors were Bumiputeras.
This group represented 63.9 per cent of the total domestic visitors. This was
followed by Chinese, 20.8 per cent, Indians, 6.2 per cent and other ethnic groups,
9.1 per cent as shown in Chart 11.
Chart 11: Percentage distribution of domestic visitors by ethnic group, 2010
6.3 Educational Level
Chart 12 shows that the majority of domestic visitors (56.2 per cent) in 2010,
possessed secondary level of education, followed by tertiary education, 20.5 per
cent and primary education and below, 23.3 per cent.
Chart 12: Percentage distribution of domestic visitors by educational level, 2010
Percentage (%)
35
0.0 20.0 40.0 60.0 80.0
>10,001
5,001 - 10,000
3,001 - 5,000
1,001 - 3,000
≤ 1,000
19.0
12.9
16.7
27.9
23.5
5.1
15.3
19.5
35.9
24.2
2009 2010
12.6%7.6%
18.4%
11.1%14.9%
35.4%
Professional/technical
Managerial/administration
Sales person/clerical
General worker
Student/retiree
Others
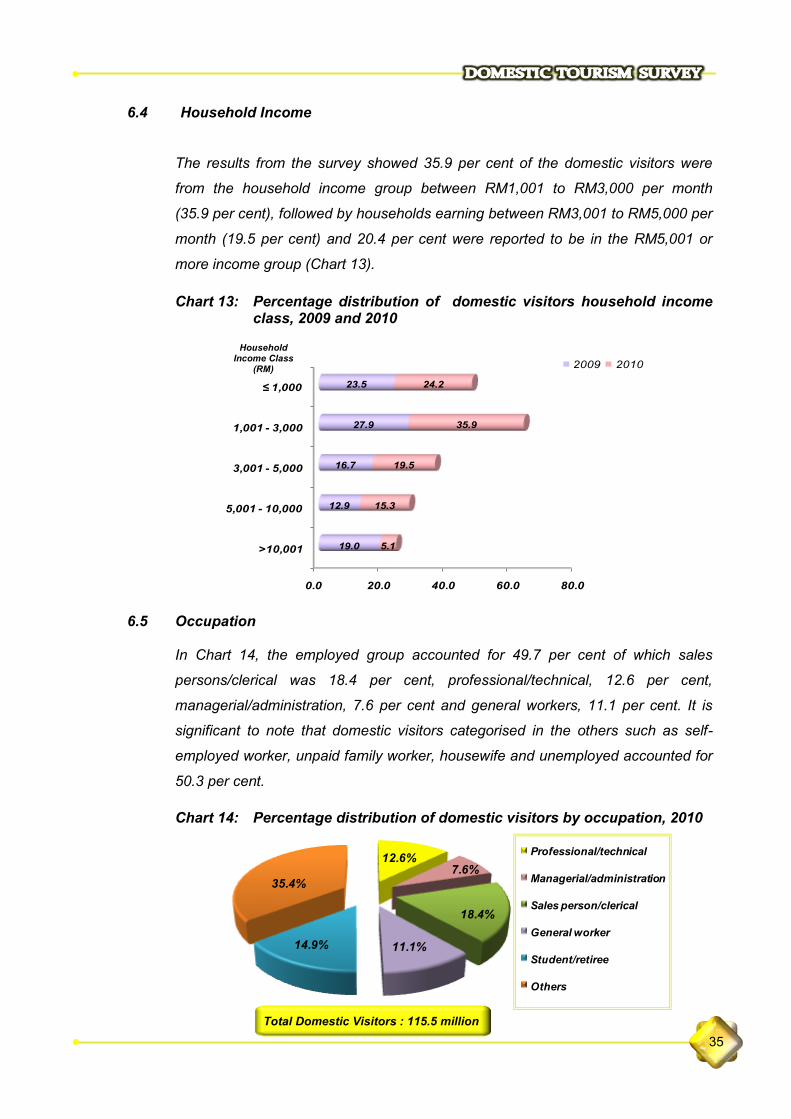
6.4 Household Income The results from the survey showed 35.9 per cent of the domestic visitors were
from the household income group between RM1,001 to RM3,000 per month
(35.9 per cent), followed by households earning between RM3,001 to RM5,000 per
month (19.5 per cent) and 20.4 per cent were reported to be in the RM5,001 or
more income group (Chart 13).
Chart 13: Percentage distribution of domestic visitors household income class, 2009 and 2010
6.5 Occupation
In Chart 14, the employed group accounted for 49.7 per cent of which sales
persons/clerical was 18.4 per cent, professional/technical, 12.6 per cent,
managerial/administration, 7.6 per cent and general workers, 11.1 per cent. It is
significant to note that domestic visitors categorised in the others such as self-
employed worker, unpaid family worker, housewife and unemployed accounted for
50.3 per cent.
Chart 14: Percentage distribution of domestic visitors by occupation, 2010
Total Domestic Visitors : 115.5 million
Household Income Class
(RM)